

Can soil and tree carbon sequestration maintain zero net emissions grazing?
A. Macdonald A , J. Court B , R. Meyer A , M. Wootton C , E. Kantor C , R. Keenan A , H. Stewart D and R. Eckard A *
A
B
C
D
Abstract
Goals set by countries and corporate entities in response to the Paris climate agreement (COP21) have put a focus on livestock producers to reduce greenhouse gas emissions (GHGe). However, methods to reduce emissions in livestock enterprises are limited. One option to reduce the balance of GHGe produced on farms is to sequester carbon in soils and trees within the farm boundary.
To assess the effectiveness of carbon sequestration in maintaining net zero emissions on a grazing enterprise (Jigsaw Farms). A previous study indicated that a single property in this enterprise (Hensley Park) achieved net zero status in 2014.
Net emissions produced by the enterprise across two properties (Melville Forrest and Hensley Park) were estimated by calculating on-farm and pre-farm emissions, using the IPCC-approved method, SB-GAFv2.3, FullCAM, and soil data provided by Jigsaw Farms. Emissions and vegetation sequestration results were validated through field data and farm records.
From 2010 to 2014, Jigsaw Farm’s Hensley Park property sequestered more carbon in trees and soils than the equivalent GHGe produced. Trees, on average, provided 89% of the sequestration and soils provided 11%. After this, an increase in GHGe from higher animal numbers and declining sequestration rates meant the enterprise was no longer net zero. Emissions in 2021 were 10,870 t carbon dioxide equivalents (CO2-e), while vegetation sequestered 6704 t CO2-e. Data was insufficient to assess soil carbon sequestration. Although net emissions increased, the emissions intensity of products was halved due to sequestration.
Although increased woody vegetation on-farm enabled achievement of net zero emissions, maintaining this position using only sequestration has proven challenging. Other on-farm benefits of trees and shrubs, such as shade and shelter for animals from climatic extremes, conservation and aesthetic benefits, are important in decisions to integrate trees.
The level of emission reduction achieved by trees can be increased, and the period of emissions reduction extended, by expanding tree plantings, staging plantings over time, using faster-growing species or, in the longer term, harvesting trees for timber and accounting for carbon stored in long-lived products. However, relying on sequestration alone cannot indefinitely meet net zero emission objectives.
Keywords: agricultural systems, carbon account, carbon audit, global climate change, greenhouse gases, insetting, methane, nitrous oxide.
Introduction
The Paris climate agreement (COP21) set the goal of achieving ‘a balance between anthropogenic emissions by sources and removals by sinks of greenhouse gas emissions (GHGe) in the second half of this century’, thereby effectively establishing the target of net zero emissions by 2050 (UNFCCC 2015). The COP26 meeting in Glasgow added interim targets by 2030, to ensure signatories are making progress towards this target (UNFCCC 2022). Agriculture is responsible for 14% of global emissions and, in response to these global goals, agricultural companies are setting emissions reduction targets, including for their Scope three emissions (off-farm emissions from processing and other factors), providing a market signal for lower emissions from livestock production (Eckard and Clark 2018).
The Australian agriculture sector is responsible for 17% of national emissions (72.27 Mt carbon dioxide equivalents, CO2-e), predominantly methane through enteric fermentation by ruminant livestock (48.8 Mt CO2-e, or 11% of national emissions). The Australian red meat sector has set a target of achieving zero net emissions by 2030 (Mayberry et al. 2018) and producers are increasingly aware of the emerging imperative to reduce farm emissions. Apart from destocking, options to reduce enteric methane are currently limited and one of the main pathways to achieving zero net emissions production at farm scale is through carbon sequestration in soils and trees.
This paper presents an analysis of greenhouse gas emissions and removals from Jigsaw Farms, a relatively large prime lamb, premium wool, and cattle farm located in south-west Victoria. The owners have established trees on 562.8 ha (16.5% of the property) to restore biodiversity, manage salinity, provide shade and shelter for livestock and to produce timber. The property has demonstrated to other graziers how best practice in natural resource management has the potential to improve natural capital while maintaining agricultural productivity and profitability. A previous assessment in 2018 estimated that the Hensley Park property achieved zero net emissions between 2010 and 2014 (Doran-Browne et al. 2018). This assessment indicated that soil and tree sequestration rates would decline over time as soil carbon reached maximum potential and tree growth rates slowed, and that livestock and farm practice emissions would exceed annual rates of carbon sequestration from 2017 onwards. Since that assessment, farm area, animal numbers and models to estimate carbon sequestration, have changed. Furthermore, the global warming potential (GWP) of methane and nitrous oxide changed from 21 and 310 (IPCC 1996) to 28 and 265 respectively (IPCC 2014; DCCEW 2024). This paper provides updated estimates of this important farm case study, and discusses the opportunities, challenges and limitations of using sequestration to achieve long term emissions reduction goals in an extensive livestock grazing system.
Methods
Farm summary
Jigsaw Farms is a prime lamb, premium wool, and cattle enterprise located in south-west Victoria. The farm was comprised of two properties in 2021: Hensley Park (−37°62′S, 142°01′E) and Melville Forest (−37°52′S, 141°82′E), 2133.1 ha and 1284.4 ha in area, respectively. At the time of purchase by the current owners (Mark Wootton and Eve Kantor) in the late 1990s, the stocking rate was five dry sheep equivalents (DSE) per hectare. Following pasture and soil improvement, this has increased to 25 DSE in some of the highest stocked paddocks. Average annual rainfall is 617.5 mm, predominantly in winter and spring. Rainfall variability in this region is relatively high. Rainfall was 559.5 mm in 2021.
By 1880, most native vegetation in this region had been cleared for agricultural production, with larger trees left in some areas for shade for animals. Starting in 1987, previous and current owners of Jigsaw Farms identified the need to restore biodiversity, manage salinity and provide shade and shelter for livestock, through the re-establishment of trees across the landscape. By 2021, a total of 16.9% of Hensley Park and 15.8% of Melville Forest had been established to environmental plantings or agroforestry. Since the publication of the original assessment (Doran-Browne et al. 2018), the owners have reduced the area under their management from 4900 ha to 3417.5 ha, with an associated reduction in total sheep and beef numbers, and 52.7 ha of trees have been planted. Changes have also occurred in parameters to assess emissions and sequestration, for example the GWP of methane has increased from 21 to 28 (IPCC 2014; DCCEW 2024) and the the Full Carbon Accounting Model (FullCAM) to estimate sequestration has been updated.
Tree carbon sequestration
Planted trees include agroforestry plantings of species not native to the area and intended for future harvest, as well as permanent revegetation (environmental plantings – a mix of native Eucalyptus and Acacia species). Agroforestry plantings were mostly planted in blocks between 2002 and 2010 and are predominantly spotted gum (Corymbia maculata, 72%) and Sydney blue gum (E. saligna, 19%) and a small area of mahogany gum (E. botryoides), red ironbark (E. tricarpa) and river red gum (E. camaldulensis), using tubestock seedlings at a density of 1000 stems per ha. These plantings were thinned mechanically, leaving about 500 stems per ha, with thinned trees left on site. Areas of permanent revegetation are a mix of trees and shrubs, using tubestock seedling or direct seeding. The previous owners of Melville Forest participated in the Potter Farmland Plan1 and established 33 ha of permanent revegetation during the period 1987–1995. Since Jigsaw Farms acquired the property, the area of permanent revegetation more than trebled, to a total of 112 ha as of 2022 – some planted in blocks and others in belts. Prior to 1997, the proportions of trees and shrubs were 70:30; since then, the ratio has been 60:40.
The FullCAM model (2020 Public Release version) (Richards and Evans 2004) was used to estimate carbon sequestration in trees and shrubs. FullCAM is a dynamic model that incorporates spatial variation in site conditions and daily or monthly variation in weather conditions to model vegetation growth. It has calibrations to estimate carbon sequestration for different species, planting densities and planting configurations (blocks or belts). Modelling of carbon stocks in woody vegetation using FullCAM is carried out for carbon estimation areas (CEAs). These are areas of at least 0.2 ha with uniform site characteristics, planted at the same time with the same mix of plant species, and established and managed under the same regime, with ‘forest potential’ (the potential to reach two metres or more in height and crown cover of at least 20% of the land). Analysis with Google Earth and field observations indicated that the total stocked area of agroforestry and permanent revegetation of 562 ha (plantings that had achieved or could achieve forest cover of > 20% canopy cover) was less than the mapped area of plantings of 612 ha. The difference was due to dams located within mapped areas of tree plantings, some waterways mapped as tree planting that were fenced and protected but only partially revegetated, and areas of tree planting that either failed or were unlikely to achieve forest cover. At Hensley Park, the tree plantings were mapped into 99 CEAs ranging in size from 0.2 ha to 25.0 ha, with a total area of 360.4 ha. At Melville Forest, there were 56 CEAs ranging in size from 0.5 ha to 21.0 ha, with a total area of 202.4 ha. All CEAs were modelled with a start date of July 1st in the year the trees were established. The model run for each CEA started from the planting date until 2046, using a modelling point that was in the approximate centre of the CEA.
Two different approaches were used to assess carbon sequestration in trees: modelling with FullCAM and modelling adjusted with field measurements. FullCAM is a national model based on measurements of carbon stocks in trees of different ages, adjusted for climatic and soil factors and the estimated maximum forest biomass for any location in Australia. Its calibrations provide an average estimate of carbon sequestration over a wide range of sites. Sequestration rates at a given site may vary from this average depending on vegetation management and local site conditions. To assess the local accuracy of FullCAM output, field estimates were generated using tree and shrub diameter and height data collected in plots of varying size across both properties. Thirteen sites were assessed in the agroforestry plantings in August 2022 and 11 sites in permanent revegetation areas in April 2023. In agroforestry plantings, CEAs were 17–20 years of age. Measurements involved point sampling of basal area of the stands, area-based plots to measure stocking, and sampling of stand heights. Plots 20 m × 20 m were established at random in each CEA. Basal area was measured at the centre of the plot using a prism (2-factor). The number of live trees in the plot was recorded, and stand height was measured. Permanent revegetation was largely in belts and strips and assessed in randomly located belt transects 5 m wide and of variable length (11 m to 50 m), depending on the size and shape of the planting. At each plot, the stem diameter of all standing live trees that were at least 5 cm in diameter was measured and the species group recorded. Transect area was 1.3% of the area of the plantings. Data from both planting types were converted to estimates of carbon per unit area. For permanent revegetation above-ground, live biomass for each plot was estimated from stem diameter measurements using allometric models for each species group (Paul et al. 2016).
For the agroforestry plantings, field data was used to recalibrate the FullCAM Tree Yield Formula by adjusting the M value (the maximum above-ground biomass (t dry matter/ha) in undisturbed native vegetation) and parameter r (the site-productivity-dependent, non-endemic species multiplier) for each CEA to scale the modelled above-ground biomass to match the measured data. For another 18 CEAs, basal area and stocking were inferred from the measured CEAs considering their age, management history and geographic relationship and adjusted the parameter r in FullCAM. For the remaining 14 CEAs a user-defined calibration was used based on sugar gum (E. cladocalyx), but with the Tree Yield Formula (TYF) in FullCAM altered, using published parameters for ‘OtherEuc’, that predominantly comprises the mix of species E. cladocalyx, E. camaldulensis, E. saligna/botryoides, Corymbia maculata, and E. pilularis.
Soil carbon sequestration
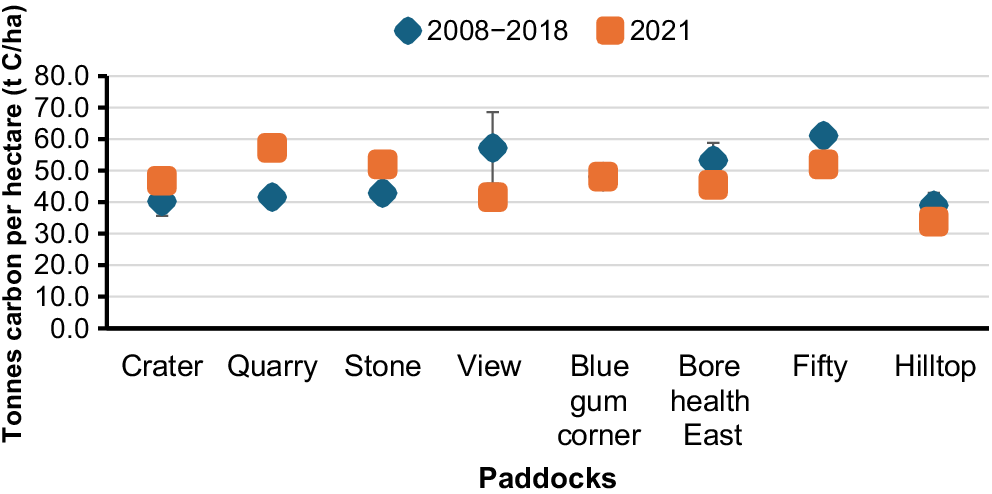
Soil carbon data was sourced from farm records. Selected paddocks were first sampled at 0–10 cm depth between 2008 and 2018, and again in 2021 (Fig. 1), but were not included in the balance of GHGe. Soil data provided by Jigsaw Farms showed increases in soil carbon (t C/ha) in some paddocks (Carter, Quarry, and Stone) at 0–10 cm. However, statistical analysis suggested there was no obvious trend in soil carbon data (P value = 0.42). Henceforth we could not include annual soil carbon sequestration in the 2021 assessment, as it could not be concluded from the available evidence that changes in soil carbon were due to farm management activities or natural fluctuations in response to climate variability.
Greenhouse gas emissions
Sheep and cattle numbers were sourced from farm records and modelled using the GrassGro model (Clark et al. 2000; Moore and Herrmann 2023) and reconciled with farm sales and purchase data. Climate data used in the GrassGro model was sourced from the SILO database (Jeffrey et al. 2001), based on Hamilton Airport (−37°39′S, 142°04′E). Data on fuel use, electricity, fertiliser, herbicides and purchased stock and feed were sourced from farm records. The emissions from the enterprise and the emissions intensity of beef, sheep meat and wool were calculated using the sheep and beef greenhouse accounting framework tool (SB-GAFv2.3) (Doran-Browne et al. 2018). The SB-GAF tool calculates Scope one and two emissions using the IPCC-approved Australian National Greenhouse Gas Inventory (NGGI) method (DCCEW 2024), whereas pre-farm Scope three emissions align with emission factors in the Ecoinvent database (Wernet et al. 2016). The tool calculates the farm greenhouse gas account within a pre-farm to farm gate life cycle assesment (LCA) boundary, as per ISO 14040 and ISO 14067 standards. Pre-farm emissions from fuel, electricity, feed, fertiliser, herbicides and pesticides were allocated equally between enterprises based on DSE. All emissions were converted to CO2-e using the GWP of 28 for methane (CH4) and 265 for nitrous oxide (N2O), as per the NGGI (DCCEW 2024). Scope three emissions were included in the total greenhouse gas balance for the property and the calculation of emissions for agricultural products, in accordance with updated GHGe accounting protocols (DCCEW 2024). Allocation between meat and wool for the sheep enterprise was based on the protein allocation method of (Wiedemann et al. 2015, 2016b). The net greenhouse gas balance for Jigsaw farms was calculated for the 2021 calendar year, as the sum of all Scope one, Scope two and Scope three emissions, minus the annual change in tree carbon sequestered from agroforestry and permanent revegetation calculated for 2021.
Results
Carbon sequestration in trees
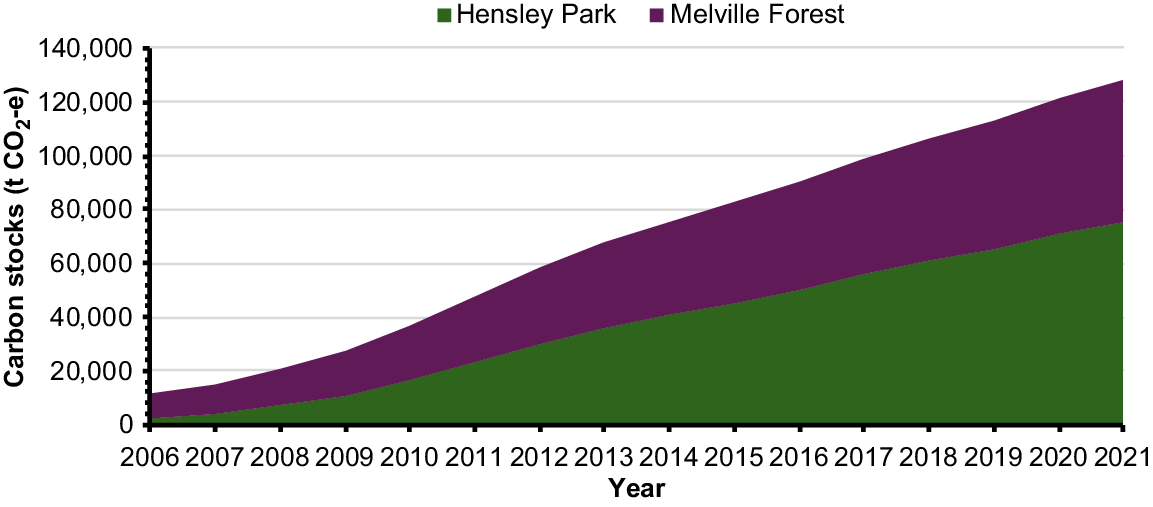
Models validated with on-ground measurements, determined that between 2006 and 2021, Jigsaw Farms sequestered a total of −128,032 t CO2-e, distributed as −75,170 t CO2-e and −52,830 t CO2-e at Hensley Park and Melville Forest, respectively; and −83,490 t CO2-e and −44,510 t CO2-e in the agroforestry and permanent revegetation plantings, respectively (Fig. 2). Annual sequestration rates peaked at −11,434 t CO2-e per year in 2011 and declined thereafter as trees matured (Figs 2, 3). Modelled sequestration varied annually, largely driven by climate variability. Average annual sequestration per hectare was more than double in agroforestry plantings than permanent revegetation due to the latter having a higher proportion of shrubs with multiple stems and low maximum height in revegetation areas. During the 2021 calendar year, trees sequestered a total of −6704 t CO2-e (Tables 1, 2), with a 10-year running mean of sequestration (2012–2021) of −8024 t CO2-e (Fig. 3).
Modelled annual change in tree carbon sequestration (t CO2-e/year) on Jigsaw Farms cumulative carbon stocks (t CO2-e) from sequestration from 2006 to 2021 from agroforestry and permanent revegetation across Hensley Park and Melville Forest.
Modelled annual change in tree carbon sequestration (t CO2-e/year) from agroforestry and permanent revegetation plantings on Jigsaw Farms from 2011 to 2021 and the CO2, CH4, N2O and total gross GHGe produced by Jigsaw Farms in 2021.

| Year | On-farm emissions | Pre-farm emissions | Total gross emissions | Tree carbon | Soil carbon | Net emissions | Carbon inset (%) | |
|---|---|---|---|---|---|---|---|---|
| (t CO2-e) A | ||||||||
| 2000 | 2200 | 132 | 2332 | 0 | −85 | 2247 | 4 | |
| 2001 | 4034 | 65 | 4099 | −5 | −207 | 3887 | 5 | |
| 2002 | 3948 | 22 | 3970 | −37 | −91 | 3842 | 3 | |
| 2003 | 4010 | 72 | 4082 | −189 | −114 | 3779 | 7 | |
| 2004 | 3854 | 80 | 3934 | −426 | −48 | 3460 | 12 | |
| 2005 | 5915 | 1777 B | 7692 | −868 | −41 | 6783 | 12 | |
| 2006 | 5949 | 2571 B | 8520 | −1177 | −80 | 7263 | 15 | |
| 2007 | 6062 | 2259 B | 8321 | −2326 | −119 | 5876 | 29 | |
| 2008 | 3958 | 589 | 4547 | −3716 | −205 | 626 | 86 | |
| 2009 | 3687 | 406 | 4093 | −3609 | −284 | 200 | 95 | |
| 2010 | 4169 | 269 | 4438 | −5101 | −257 | −920 | 121 | |
| 2011 | 5441 | 118 | 5559 | −5104 | −616 | −161 | 103 | |
| 2012 | 4295 | 378 | 4673 | −4733 | −683 | −743 | 116 | |
| 2013 | 3899 | 529 | 4428 | −4907 | −903 | −1382 | 131 | |
| 2014 | 4297 | 629 | 4926 | −4805 | −983 | −862 | 117 | |
| (t CO2-e) C | ||||||||
| 2021 | 9830 | 1040 | 10,870 | −6704 | n.d. D | 4166 | 62 | |
Data shows the emissions, and sequestration for the Hensley Park property between 2000 and 2014 (calculated from Doran-Browne et al. (2018)) and the 2021 estimate for Hensley Park and Melville Forest properties from this study. The shaded area represents the period during which sequestration exceeded emissions, i.e. the property was net zero.
| Unit | Year | ||||||
|---|---|---|---|---|---|---|---|
| 2000 | 2001–2004 A | 2005–2007 A | 2008–2014 A | 2021 | |||
| Farm description | |||||||
| Farm area | Ha | 580.0 | 970.0 | 1145.0 | 1270.0 | 3417.5 | |
| Agroforestry | Ha | 0.0 | 0.0–155.8 | 254.8–281.3 | 281.3–290.0 | 294.8 | |
| Permanent revegetation | Ha | 75.7 | 76.5–119.5 | 152.0–196.1 | 199.1–222.6 | 268.0 | |
| Stocking rate | DSE/ha | 20.7–21.2 | 20.7 | 20.9–25.6 | 20.7–21.2 | 20.7–25.0 | |
| Productivity | |||||||
| Beef sold | kg liveweight | 20,300 | 39,000 | 400,520 | 38,640 | 165,805 | |
| Sheep meat sold | kg liveweight | 164,220 | 268,600 | 96,350 | 501,400 | 593,291 | |
| Wool sold | kg greasy wool | 23,460 | 39,100 | 7995 | 46,000 | 126,531 | |
| Emissions | |||||||
| CH4 emissions B | t CO2-e/year | 2089 | 3668 | 5972 | 4159 | 8041 | |
| N2O emissions B | t CO2-e/year | 539 | 1030 | 1280 | 810 | 865 | |
| CO2 emissions | t CO2-e/year | 3 | 3 | 3 | 3 | 923 | |
| Total on-farm emissions | t CO2-e/year | 2631 | 4701 | 7255 | 4971 | 9829 | |
| Pre-farm emissions | t CO2-e/year | 132 | 60 | 2202 | 417 | 1040 | |
| Total GHGe | t CO2-e/year | 2763 | 4761 | 9457 | 5388 | 10,870 | |
| GHGe per ha | t CO2-e/ha | 4.76 | 4.91 | 8.26 | 4.24 | 3.18 | |
| Sequestration | |||||||
| Tree carbon Hensley Park | t CO2-e/year | 0.0 | −131.4 | −1011.2 | −5242.0 | −4416.0 | |
| Tree carbon Melville Forest | t CO2-e/year | 0.0 | 0.0 | −1066.2 | −3391.0 | −2288.0 | |
| Soil carbon | t CO2-e/year | −85 | −115 | −80 | −562 | n.d | |
| Total sequestration | t CO2-e/year | −85 | −246 | −2157 | −9195 | −6704 | |
| Total sequestration per ha | t CO2-e/ha | −0.15 | −0.25 | −1.88 | −7.24 | −1.96 | |
| Emissions balance | |||||||
| Net on-farm emissions | t CO2-e/year | 2678 | 4515 | 5097 | −3807 | 4166 | |
| Carbon inset | (%) | 3% | 5% | 23% | 171% | 62% | |
| Emissions intensity (excluding sequestration) | |||||||
| Sheep meat | kg CO2-e/kg LW | 6.9 | 7.4 | 4.0 | 4.4 | 8.5 | |
| Wool | kg CO2-e/kg greasy wool | 37.2 | 39.2 | 37.5 | 37.3 | 30.8 | |
| Beef | kg CO2-e/kg LW | 15.8 | 12.6 | 18.7 | 13.9 | 11.6 | |
| Emissions intensity (including sequestration) | |||||||
| Sheep meat | kg CO2-e/kg LW | 6.9 | 7.0 | 2.4 | 0.0 | 3.4 | |
| Wool | kg CO2-e/kg greasy wool | 37.1 | 36.9 | 21.8 | 0.0 | 12.3 | |
| Beef | kg CO2-e/kg LW | 114.7 | 102.2 | 17.4 | 0.0 | 3.5 | |
Comparing the sequestration results and carbon balance of this study with those of the previous study on the Hensley Park property (Doran-Browne et al. 2018). This study indicated a lower planted area (360 vs 380 ha) because the areas were adjusted for actual stocked area, but higher sequestration rates. This resulted in similar total amounts of carbon sequestered on this property between 2006 and 2014 (−35,480 t CO2-e for Doran-Browne et al. and −38,860 t CO2-e in our study). Both studies found that the peak rate of carbon sequestration by planted trees occurred in 2011 (Table 1).
Emissions from livestock, farm operations and inputs
It was estimated that during the 2021 calendar year, emissions from Jigsaw farms operations totalled 10,870 t CO2-e, with 9830 t CO2-e directly on-farm (Scope one and two) and 1040 t CO2-e in pre-farm inputs (Scope three, see Table 3). On-farm emissions were predominantly enteric CH4 (78.2% of Scope one emissions), followed by lime (7.3%), N2O from animal excreta (4.7%), CH4 from manure management (4.1%), N2O from leaching (3.4%) and CO2 from fuel use (1.2%). Scope two emissions from the use of electricity totalled 64 t CO2-e (Table 3). This was relatively low because Jigsaw Farms has a solar power installation, reducing its reliance on grid electricity. Scope three emissions were included in the calculation of intensity of products, and property emissions. The largest sources of Scope three emissions were purchased feed (72.7%), fertiliser (13.8%), livestock purchase (4.8%) and lime (4.3%) (Table 3).
| Greenhouse gas source | t CO2-e/farm | |||
|---|---|---|---|---|
| Beef | Sheep | Total | ||
| On-farm emissions: Scope one | ||||
| CO2 – Fuel | 24 | 95 | 119 | |
| CO2 – Lime | 143 | 572 | 715 | |
| CO2 – Urea | 5 | 20 | 25 | |
| CH4 – Fuel | 0 | 0 | 0 | |
| CH4 – Enteric | 1271 | 6369 | 7640 | |
| CH4 – Manure management | 58 | 344 | 402 | |
| N2O – Fertiliser | 4 | 18 | 22 | |
| N2O – Urine and dung | 95 | 364 | 459 | |
| N2O – Atmospheric deposition | 10 | 40 | 51 | |
| N2O – Leaching and runoff | 68 | 264 | 333 | |
| N2O – Fuel | 0 | 1 | 1 | |
| Scope one total | 1678 | 8088 | 9766 | |
| On-farm emissions: Scope two | ||||
| Electricity | 13 | 51 | 64 | |
| Pre-farm emissions: Scope three | ||||
| Fertiliser | 32 | 112 | 144 | |
| Purchased feed | 151 | 605 | 756 | |
| Herbicides/pesticides | 3 | 7 | 10 | |
| Electricity | 1 | 4 | 5 | |
| Fuel | 6 | 24 | 30 | |
| Lime | 9 | 36 | 45 | |
| Purchased livestock | 25 | 24 | 50 | |
| Scope three total | 228 | 812 | 1040 | |
| Total gross emissions | 1919 | 8951 | 10,870 | |
Emissions are shown by type of greenhouse gas; methane (CH4), carbon dioxide (CO2) and nitrous oxide (N2O), but all emissions were converted to carbon dioxide equivalents (CO2-e).
During 2021, Jigsaw Farms sold 165,805 t beef, 593,291 t sheep meat and 126,531 t greasy wool (Table 2). The emissions intensity (excluding sequestration) of each product was calculated to be 11.6 kg CO2-e/kg liveweight for beef, 8.5 kg CO2-e/kg liveweight for sheep and 30.8 kg CO2-e/kg of greasy wool (Table 2).
Emissions balance
In 2021, total gross emissions were 10,870 t CO2-e, minus total sequestration of −6704 t CO2-e, resulting in net emissions of 4166 t CO2-e (Table 3). Tree sequestration therefore offset 61.7% of total emissions (Table 1; Fig. 3). Allocating sequestration offsets equally between the products reduced emissions intensity to 3.5 kg CO2-e/kg liveweight of beef, 3.4 kg CO2-e/kg liveweight of sheep and 12.3 kg CO2-e/kg greasy wool, respectively (Table 2).
If emissions in the early 2010s were similar to those estimated for 2021, the property would have been carbon neutral for a period of about 5 years from 2008 to 2012. The previous carbon assessment (Doran-Browne et al. 2018) for the property was for the Hensley park property only. A comparison indicates that on average, livestock emissions and sequestration were respectively 2.6 and 1.6 times lower in Doran-Browne et al. (2018), than calculated in the current assessment (Table 1). The ratio of tree carbon sequestration to livestock emissions (calculated as % carbon inset) was clearly greater for the Hensley Park property (21% trees, 2010–2014) than Melville Forest (15.8% trees in 2021). The study by Doran-Browne et al. (2018), and sequestration data from this study estimate that Jigsaw Farms was net zero between 2010 and 2017 (shaded in Table 1).
Discussion and conclusion
Total gross emissions were higher than the assessment by Doran-Browne et al. (2018), which ranged from 2336 t CO2-e in 2000, to a maximum of 8520 t CO2-e in 2006, declining to 4805 t CO2-e in 2014 (Table 1). These differences are largely due to higher animal numbers, because both Hensley Park and Melville Forest properties were included in this assessment (Table 2). Other factors include a higher GWP for methane (28 versus 21). Calculated emissions intensity is within the range of other studies using the same methodology, with emissions intensity for beef production in Australia and Canada reported to be between 10.4 and 15.6 t CO2-e/t LWT (Wiedemann et al. 2016a; Alvarez-Hess et al. 2019), prime lamb between 6.1 and 7.3 kg CO2-e/kg LW (Wiedemann et al. 2015, 2016b) and wool between 25 and 30 kg CO2-e/kg greasy wool (Wiedemann et al. 2016b). Estimated tree carbon sequestration is also higher than previous modelling by Doran-Browne et al. (2018), where tree sequestration was estimated at −37,003 t CO2-e from 2000 to 2014, with a peak of −5104 t CO2-e in 2011 Table 1). The higher sequestration value is partly due to the inclusion of the Melville Forest property in the current analysis, but also due to the significant correction applied to the modelling for environmental plantings, based on on-ground measurements. This emphasises the limitation of applying a model (FullCAM), designed for tier three inventory reporting at national or state scale, to a locally specific set of conditions.
In this analysis, emissions were calculated for the 2021 calendar year only. In the previous assessment, Hensley Park was calculated to have achieved net zero between 2010 and 2014 (Table 1) (Doran-Browne et al. 2018). Assuming a stable livestock inventory, this would suggest Jigsaw Farms achieved roughly net zero between 2010 and 2017 (Table 1; Fig. 3). This observation emphasises the importance of tree area, as well as tree age, on the potential to offset livestock emissions (Fig. 2). The earlier analysis had a greater ratio of trees to livestock because only one property was assessed. This emphasises the need to include the entire business entity in modelling emissions, especially where animals move between, and resources are shared between properties. Given the effect of climate variability on sequestration (as indicated in Fig. 3) a 10-year running mean of sequestration could provide a better approach to linking sequestration and emissions. On this basis, if it is assumed that the 2021 livestock and farm emissions were the same over the previous 10 years, the trees offset an average of 77% of total gross farm emissions over 10 years (Table 3; Fig. 3), with a net emissions intensity reduced to 2.5 kg CO2-e/kg liveweight of beef, 1.9 kg CO2-e/kg liveweight of sheep and 7.6 kg CO2-e/kg greasy wool (Table 2). If the owners were to purchase equivalent offsets in the Australian carbon market for the 2020–2025 period (average sequestration of −5886 t CO2-e) at the current market value of A$35/t CO2-e, it would cost $206,000 per year.
This analysis shows planting woody vegetation on an extensive area (17%) of this property was able to achieve a net zero livestock production system for only a limited period, from 2010 to 2017 (Table 1; Fig. 3). However, this period would have been significantly reduced to 1–2 years if Jigsaw Farms had produced the same volume of gross GHGe it produced in 2021 (Table 3; Fig. 3). The period of net zero emissions could have been extended by planting more of the area to agroforestry and longer-lived eucalypt trees with faster growth and higher biomass potential than the revegetation areas planted primarily for biodiversity (Zomer et al. 2022). However, reducing the area of environmental plantings and increasing timber trees could reduce the benefits of environmental plantings. Notably, although sequestration rates decline to low levels once the site is fully stocked and trees reach maturity (Department of the Prime Minister, and Cabinet 2021), trees do continue to provide critical ecosystem services, including biodiversity, salinity management and animal welfare benefits through shade and shelter (Monckton and Mendham 2022). Trees on livestock grazing properties are therefore likely to be an ongoing asset in a balanced portfolio where natural capital is increasingly valued.
Soil carbon also observes a similar effect to vegetation, with rates of sequestration peaking and declining due to the law of diminishing returns, until carbon saturation is achieved. Soils’ capacity to sequester carbon is influenced by climate, edaphic factors, and management (Mitchell et al. 2024). But even with favourable variables, all soil will reach a steady state of sequestration and cannot be relied upon to reduce net emissions infinitely. Data on soil carbon was unable to determine if soil carbon had increased in Jigsaw Farms during the 2021 calendar year, nor could it conclude if soil carbon had achieved a steady state. Therefore, increases in soil carbon stocks may reduce the net emissions produced by Jigsaw Farms in future audits. To include the sequestration of carbon in soils, soil must be sampled at a minimum depth of 30 cm and show a statistically significant change soil carbon (t C/ha) from historical values.
Emissions could continue to be offset by increasing the area planted to trees, but this may impact on livestock production (Kingwell 2021). The owners of Jigsaw Farms consider that the current area has not reduced animal production capacity, and trees are likely to have enhanced production by reducing lambing losses during cold winds and potentially increasing overall pasture production despite tree competition. The cumulative benefits of more trees are likely to diminish as the area increases and competitive effects with pasture will be greater.
Harvesting the agroforestry trees was not incorporated in this study. Harvesting trees and capturing carbon in long-lived products such as in construction or furniture would result in a temporary reduction in carbon stocks on the property but longer-term storage of carbon off site (Clean Energy Regulator 2024). Over multiple harvesting and replanting cycles (50+ years), this could result in higher levels of carbon stocks than if trees are left unharvested, which could increase the level of emissions offset by trees. This storage effect is incorporated in the FullCAM model and could be explored in future analyses. Allocation of the ‘credit’ between the grower, processor and user of the wood product needs to be resolved.
In conclusion, this analysis shows planting woody vegetation over an extensive area (17%) of Jigsaw Farms was able to achieve a net zero livestock production system, while enhancing livestock production, animal welfare and farm biodiversity. This effect was only possible for a limited time due to trees and soils reaching their maximum sequestration potential. Emissions could potentially be continuously offset by expanding the area of trees, planting faster growing trees with higher carbon storage potential or, in the longer term, harvesting and replanting trees and incorporating carbon in long-lived wood products. Ultimately, cost effective strategies are needed to reduce enteric methane emissions, perhaps through vaccination, feed supplements, inhibitors and breeding for low residual methane production.
Data availability
The data presented in this study is available on request from the corresponding author.
Conflicts of interest
Mark Wootton and Eve Kantor own Jigsaw Farms. To mitigate the potential conflict of interest they had no editor-level access to the data, analysis, or manuscript.
Declaration of funding
This study was funded by Meat and Livestock Australia, and The Australian Government Department of Climate Change, Energy, the Environment and Water. Neither Meat and Livestock Australia, nor the Department of Climate Change, Energy, the Environment and Water had a role in the design of the study, the collection of data, its analysis and interpretation, or of the writing of the manuscript.
References
Alvarez-Hess PS, Little SM, Moate PJ, Jacobs JL, Beauchemin KA, Eckard RJ (2019) A partial life cycle assessment of the greenhouse gas mitigation potential of feeding 3-nitrooxypropanol and nitrate to cattle. Agricultural Systems 169, 14-23.
| Crossref | Google Scholar |
Clark SG, Donnelly JR, Moore AD (2000) The GrassGro decision support tool: its effectiveness in simulating pasture and animal production and value in determining research priorities. Australian Journal of Experimental Agriculture 40, 247.
| Crossref | Google Scholar |
Clean Energy Regulator (2024) Understanding your plantation forestry project: Australian Carbon Credit Unit Scheme simple method guide for plantation forestry projects registered under the Carbon Credits (Carbon Farming Initiative—Plantation Forestry) Methodology Determination 2022. Department of Climate Change, Energy, Environment and Water, GPO Box 3090, Canberra, ACT 2601, Australia
Doran-Browne N, Wootton M, Taylor C, Eckard R (2018) Offsets required to reduce the carbon balance of sheep and beef farms through carbon sequestration in trees and soils. Animal Production Science 58, 1648.
| Crossref | Google Scholar |
Eckard RJ, Clark H (2018) Potential solutions to the major greenhouse-gas issues facing Australasian dairy farming. Animal Production Science 60, 10-16.
| Crossref | Google Scholar |
IPCC (1996) Climate Change 1995: The Science of Climate Change. Contribution of Working Group I to the Second Assessment Report of the Intergovernmental Panel on Climate Change. Table of GWP values, Chapter 2 [Core Writing Team J.T Houghton, L.G.M Filho, B.A Callander, N Harris, A Kattenberg and K Maskell (eds.)]. IPCC, Cambridge, Great Britain.
Jeffrey SJ, Carter JO, Moodie KB, Beswick AR (2001) Using spatial interpolation to construct a comprehensive archive of Australian climate data. Environmental Modelling & Software 16, 309-330.
| Crossref | Google Scholar |
Kingwell R (2021) Agriculture’s carbon neutral challenge: the case of Western Australia. Australian Journal of Agricultural and Resource Economics 65, 566-595.
| Crossref | Google Scholar |
Mitchell E, Takeda N, Grace L, Grace P, Day K, Ahmadi S, Badgery W, Cowie A, Simmons A, Eckard R, Harrison MT, Parton W, Wilson B, Orgill S, Viscarra Rossel RA, Pannell D, Stanley P, Deane F, Rowlings D (2024) Making soil carbon credits work for climate change mitigation. Carbon Management 15, 2430780.
| Crossref | Google Scholar |
Monckton D, Mendham DS (2022) Maximising the benefits of trees on farms in Tasmania – a desktop review of investment opportunities to improve farm enterprise productivity, profitability and sustainability. Australian Forestry 85, 6-12.
| Crossref | Google Scholar |
Moore, A, Herrmann, N (2023) GrassGro version 11. Retrieved on 3 October 2022 from https://grazplan.csiro.au/grassgro/
Paul KI, Roxburgh SH, Chave J, England JR, Zerihun A, Specht A, Lewis T, Bennett LT, Baker TG, Adams MA, Huxtable D, Montagu KD, Falster DS, Feller M, Sochacki S, Ritson P, Bastin G, Bartle J, Wildy D, Hobbs T, Larmour J, Waterworth R, Stewart HTL, Jonson J, Forrester DI, Applegate G, Mendham D, Bradford M, O’Grady A, Green D, Sudmeyer R, Rance SJ, Turner J, Barton C, Wenk EH, Grove T, Attiwill PM, Pinkard E, Butler D, Brooksbank K, Spencer B, Snowdon P, O’Brien N, Battaglia M, Cameron DM, Hamilton S, McAuthur G, Sinclair J (2016) Testing the generality of above-ground biomass allometry across plant functional types at the continent scale. Global Change Biology 22, 2106-2124.
| Crossref | Google Scholar |
Richards GP, Evans DMW (2004) Development of a carbon accounting model (FullCAM Vers. 1.0) for the Australian continent. Australian Forestry 67, 277-283.
| Crossref | Google Scholar |
UNFCCC (2022) Report of the Conference of the Parties on its twenty-sixth session, held in Glasgow from 31 October to 13 November 2021. Addendum Part two: Action taken by the Conference of the Parties at its twenty-sixth session. United Nations Framework Convention on Climate Change (UNFCCC), FCCC/CP/2021/12/Add.1.
Wernet G, Bauer C, Steubing B, Reinhard J, Moreno-Ruiz E, Weidema B (2016) The ecoinvent database version 3 (part I): overview and methodology. The International Journal of Life Cycle Assessment 21, 1218-1230.
| Crossref | Google Scholar |
Wiedemann SG, Ledgard SF, Henry BK, Yan M-J, Mao N, Russell SJ (2015) Application of life cycle assessment to sheep production systems: investigating co-production of wool and meat using case studies from major global producers. The International Journal of Life Cycle Assessment 20, 463-476.
| Crossref | Google Scholar |
Wiedemann S, McGahan E, Murphy C, Yan M (2016a) Resource use and environmental impacts from beef production in eastern Australia investigated using life cycle assessment. Animal Production Science 56, 882-894.
| Crossref | Google Scholar |
Wiedemann SG, Yan MJ, Henry BK, Murphy CM (2016b) Resource use and greenhouse gas emissions from three wool production regions in Australia. Journal of Cleaner Production 122, 121-132.
| Crossref | Google Scholar |
Zomer RJ, Bossio DA, Trabucco A, van Noordwijk M, Xu J (2022) Global carbon sequestration potential of agroforestry and increased tree cover on agricultural land. Circular Agricultural Systems 2, 1-10.
| Crossref | Google Scholar |