

Graincast™: monitoring crop production across the Australian grainbelt
R. Lawes A * , Z. Hochman B , E. Jakku C , R. Butler D , J. Chai E , Y. Chen F , F. Waldner B G , G. Mata A and R. Donohue H
A CSIRO Agriculture and Food, 147 Underwood Avenue, Floreat, WA 6014, Australia.
B CSIRO Agriculture and Food, 306 Carmody Road, St Lucia, Qld 4067, Australia.
C CSIRO Land and Water, 306 Carmody Road, St Lucia, Qld 4067, Australia.
D CSIRO Data61, 315 Brunswick Street, Fortitude Valley, Qld 4006, Australia.
E CSIRO Data61, 26 Dick Perry Avenue, Kensington, WA 6151, Australia.
F CSIRO Data61, Goods Shed North, 34 Village Street, Docklands, Vic. 3008, Australia.
G European Commission Joint Research Centre, Food Security, 21027 Ispra, Varese, Italy.
H CSIRO Land and Water, GPO Box 1700, Canberra, ACT 2061, Australia.
Crop & Pasture Science - https://doi.org/10.1071/CP21386
Submitted: 4 June 2021 Accepted: 26 October 2021 Published online: 21 March 2022
© 2022 The Author(s) (or their employer(s)). Published by CSIRO Publishing. This is an open access article distributed under the Creative Commons Attribution-NonCommercial-NoDerivatives 4.0 International License (CC BY-NC-ND)
Abstract
The Australian dryland grain-cropping landscape occupies 60 Mha. The broader agricultural sector (farmers and agronomic advisors, grain handlers, commodity forecasters, input suppliers, insurance providers) required information at many spatial and temporal scales. Temporal scales included hindcasts, nowcasts and forecasts, at spatial scales ranging from sub-field to the continent. International crop-monitoring systems could not service the need of local industry for digital information on crop production estimates. Therefore, we combined a broad suite of satellite-based crop-mapping, crop-modelling and data-delivery techniques to create an integrated analytics system (Graincast™) that covers the Australian cropping landscape. In parallel with technical developments, a set of user requirements was identified through a human-centred design process, resulting in an end-product that delivered a viable crop-monitoring service to industry. This integrated analytics solution can now produce crop information at scale and on demand and can deliver the output via an application programming interface. The technology was designed to underpin digital agriculture developments for Australia. End-users are now using crop-monitoring data for operational purposes, and we argue that a vertically integrated data supply chain is required to develop crop-monitoring technology further.
Keywords: application programming interface, big data analytics, crop modelling, integrated land management, land use mapping, participatory research, remote sensing, user centred design.
Introduction
Crop-monitoring systems that monitor the production of the major grain crops have been developed by the European Union (EU) and the USA (Fritz et al. 2019). The EU MARS monitoring system (van der Velde et al. 2019) and the USDA World Agricultural Supply and Demand Estimates (WASDE) were developed to monitor the global food supply, inform government policy, and provide grain buyers with the tools to market various commodities (Adjemian 2012). Both systems provide insights into production across the globe, and highlight the relative impact that droughts, floods and other conditions have on crop production. The outputs from these crop-monitoring systems are provided as a relative measure, where production is defined as above or below a long-term average. Information is usually provided at regional scales, and data are accessed via reports and file transfer with standardised output (Becker-Reshef et al. 2019).
Most global monitoring systems deliver information at a geopolitical scale. These systems are not designed to provide information to individuals at a field scale. This information is disseminated through web-based systems, and data can be accessed via cloud computing infrastructure. However, much of the information still needs to be processed in geographic information systems (GIS) to extract specific information. In order to counter these deficiencies, some countries, such as the Philippines, have created a rice-monitoring systems for domestic use (Boschetti et al. 2017).
The private sector also offers crop-monitoring services. Recent capital investments into companies such as Indigo Ag and Farmers Business Network suggest a perceived value associated with agricultural productivity information. Investors believe digital technology can transform the agricultural sector, where there is a strong demand for small-scale, field-level productivity information. The private sector can provide information from satellites, such as a Normalised Difference Vegetation Index (NDVI) time series, at a field scale. Bespoke output has been tailored for end-users, but few organisations predict crop yield at the field scale and deliver that output via easily accessible mobile systems. Bespoke services that provide high resolution, sub-field-scale output can be challenging to create (Fajardo and Whelan 2021). Insights into pest, disease and weed status, predicted yield, carbon stocks or pasture production require quantities of training data. Furthermore, monitoring products created in one region or for a particular crop may not easily be transferred to another region without considerable on-ground validation (Lawes et al. 2021). These limitations complicate the widespread application of digital technology to new geographies with scarce crop production data.
The lack of a readily available ‘crop yield’ product that can provide output at the field, farm, region and national scales, suggests that key linkages need to be formed between the data supplier and the decision maker. The crop yield product may be used to make a range of decisions and suggests that organisations that supply crop yield information need to discover what the end-use is (Eichler Inwood and Dale 2019). This need is one of the 15 requirements for decision support systems outlined by Rose et al. (2016). Ideally, organisations would create crop yield products that have multiple uses. For example, a crop yield product may need to provide insight before seeding to assist with fertiliser demand (Angus 2001), or with the decision to sow a crop (Hochman et al. 2009; Fletcher et al. 2016). During the growing season, a crop yield product may need to assist with decisions related to the application of inputs such as additional fertiliser or fungicide. Finally, toward the end of the season, a crop yield product may need to assist with crop marketing or decisions related to insurance (Hatt et al. 2012).
Decision makers will have different requirements, and each type of decision may need the data delivered in a unique way. Here, human-centred design approaches, which ensure that users are actively involved throughout the development phase, can enhance the useability and likely uptake of a digital system (Maguire 2001). In agriculture, others have noted that potential needs of end-users must be documented and accommodated (McCown 2002; Rose et al. 2016; Eichler Inwood and Dale 2019). However, in human-centred design, the development process should be iterative, where the designers continuously engage with the end-user. It is not clear whether the larger scale offerings from public crop-monitoring systems have designed their systems while iteratively engaging with end-users. These systems do not scale in space or time and do not easily lend themselves to field-scale management activities or to regional assessment of production, nor do they provide sufficient local insight for land managers, agribusinesses or financial institutions. Data may be required to conduct a historical estimate of a field (hindcast), monitor that field in real-time (nowcast), or predict the yield at the end of the current growing season (forecast). At present, the EU and US crop information systems cannot provide the necessary information to end-users. The information from a crop-monitoring tool must also be linked to a critical decision to advance agriculture (Shepherd et al. 2020).
In order to address this need, we created the Australian crop-monitoring system, Graincast™. In this paper we describe the technical aspects of Graincast™, and evaluate user responses to critical components of the technology, where a human-centred design approach was adopted to develop parts of the technology. We critique the technology from an operational perspective, and consider some of the novel use-cases toward which the Graincast™ technology can be deployed. Finally, we discuss how this technology can advance agriculture and tackle some of the challenges identified (Shepherd et al. 2020).
The Australian dryland cropping system
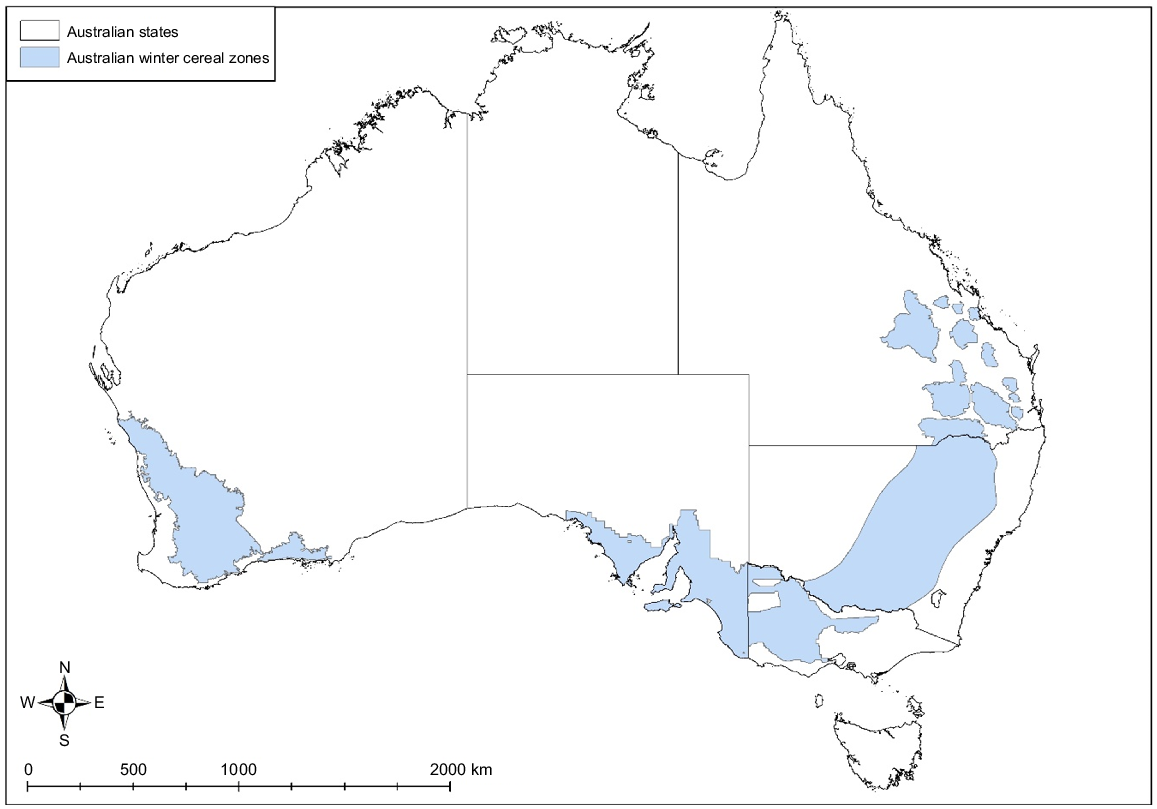
The Australian cropping region occupies nearly 60 Mha in the states of Queensland, New South Wales (NSW), Victoria, South Australia and Western Australia (Fig. 1). Across the continent, the cropping systems vary considerably. In the north (Queensland and NSW), rainfall is summer dominant. Farmers sow summer and winter groups, including wheat, barley, oats, sorghum, maize, soybeans, mungbeans and chickpeas. They also plant perennial and annual pastures to support livestock. In Victoria, South Australia and Western Australia, farmers traditionally plant wheat and barley in rotation with legume and oilseed crops including lupins, faba beans, field peas, chickpeas, lentils and canola. They cultivate other cereals such as oats and triticale and plant crops in April or May, which grow on stored soil moisture and winter rainfall. Again, pastures are prevalent throughout these regions. In Western Australia lupins are the most common legume crop.
Cropping practices also vary across Australia, even though winter cropping systems dominate. Farmers may sow crops into a moist soil in April or May, following recent rainfall (Hochman et al. 2016), or plant crops dry, before winter rainfall (Fletcher et al. 2016). It can be challenging to define a farming system across Australia precisely or to define specific patterns. Seeding decisions vary annually, based on seasonal expectations about production, the need to rotate a crop, and commodity price. The area planted to minor crops can vary significantly from season to season, because these can be riskier to produce and prices fluctuate dramatically (Robertson et al. 2010; Fletcher et al. 2016). Graincast™ operates across this vast and variable farming landscape.
The Graincast™ system
Graincast™ is a system designed to monitor crop production in Australia, at multiple spatial and temporal scales. Four separate products were created as part of this capability, each with their own design workflow, based around the use case, end-user requirements and machine learning workflow. These design workflows relate to the process of data acquisition, model development with training data, model validation with test data, iterative end-user engagement, and the delivery of model output. With each of the four components, the relative effort applied to data acquisition, model development, model validation and end-user engagement varied and depended on the maturity level of the initial technology. Considerable effort was expended on user engagement and testing with mature technologies. For nascent technologies, effort was expended on data acquisition and model development. The four components of the Graincast™ system are C-Crop, CropID, Graincast™ app and Field Boundaries (known as ePaddocks).
C-Crop
The C-Crop model was created to monitor crop yields at the field, farm, state and national scales in near real-time by using a combination of satellite imagery and climate data. Crop yield estimates are produced for wheat, barley and canola.
Data requirements for C-Crop data: wheat yields
To create C-Crop, training data about crop yields were acquired from crop yield maps generated by farmers, using yield-monitoring technology attached to commercial grain harvesters. Data from grain harvesters were processed using methods described in Lawes et al. (2021). Fields were usually ≥40 ha, and training data could be generated for individual 250-m MODIS pixels within those fields. Data were acquired from 2008 to 2015, across the Australian continent, and used to calibrate the C-Crop model for wheat, barley and canola.
Satellite data are acquired from the MODIS platform, where the 16-day composite NDVI product is used to generate a calculation for the fraction of absorbed photosynthetically active radiation (fPar), which is a critical component of the C-Crop model. Daily maximum and minimum temperature data are also used by the C-Crop model. Specific details of data inputs are provided in Donohue et al.(2018).
The C-Crop model is a semi-process-based model where it models the carbon mass accumulation for a crop species. C-Crop use gross primary productivity (GPP) as a primary driver of crop yield estimation, and is an evolutionary development of a model proposed by Reeves et al. (2005). It first estimates GPP using the DIFFUSE photosynthesis model (Donohue et al. 2014). The model then estimates plant carbon accumulation, and finally grain yield. fPar is calculated from a transformation of an NDVI time series. Other variables required include daily solar irradiance, an estimate of the fraction of diffuse radiation, and a period-average daily air temperature (Donohue et al. 2018). The two processes, respiration rate at 10°C and leaf longevity were optimised to minimise the residual mean squared error (RMSE) between the training data and predicted values. The training data are used to calibrate the model for specific crop species.
This output is updated every 16 days, or when data from NASA become available to monitor crop growth and predict yield at the field scale (Table 1). At the field scale, the first iteration of the model was able to predict wheat yields with an r2 of 0.68 and an RMSE of 0.73 t/ha. Canola yields were predicted with an r2 of 0.69 and an RMSE of 0.54 t/ha. A later version that copes with end-of-season effects of terminal drought on yield, and known as Crop-SI, showed slight improvement and was able to predict wheat yield with an r2 of 0.74 and an RMSE of 0.51 t/ha (Chen et al. 2020).
|
Data delivery
C-Crop creates a crop yield prediction for the entire Australian cropping region at 2-week intervals on a 250-m grid. Data are processed as a raster, which must then be re-processed to provide information at the field, farm and regional spatial scales. C-Crop is able to deliver crop yield predictions from mid-August at 80 days after seeding (Donohue et al. 2018). Historical yields can also be created with the C-Crop model, although the crop type needs to be identified in order to use the model historically (Fig. 2).

|
To create a yield estimate for a particular region, C-Crop must be paired with CropID information. Outputs for fields, regions, states and the continent can then be delivered via any geospatial software platform (e.g. ARCGIS, QGIS, Google Earth Engine). Uncertainty estimates for a prediction are derived from the RMSE calculated from the model calibration data. Further data would be required to update these uncertainty estimates. To capture end-users’ requirements regarding crop yield estimation via C-Crop and CropID, we evaluated the contracts with those end-users to supply data.
CropID
CropID was created to determine the crop species growing in a particular field, and to deliver that information at scale, during the current cropping season. CropID outputs had to be delivered at the field, farm and regional scales, and needed to align spatially with outputs from the C-Crop model in order to create regional crop tonnage estimates. CropID was designed to provide information for cereal, legume and oilseed crops. Pastures were identified, but not to the species level. Crop classification that utilises satellite imagery, training data and a machine learning algorithm to classify spectrally disparate crop species has been used in a number of studies around the world. Detailed classification methods are routinely tested on areas of hundreds or thousands of hectares (e.g. Khosravi and Alavipanah 2019), and studies across larger landmasses are becoming more common (Boryan et al. 2011; Massey et al. 2018; Defourny et al. 2019).
The data requirements for CropID included acquiring extensive training data about the crop species of individual fields and satellite imagery from optical and radar platforms. Specifically, imagery from Landsat 8, Sentinel 2 and Sentinel 1 were used.
The training data required to create the CropID output are exhaustive. Three approaches were employed to acquire sufficient training data to build a CropID product for Australia. Trained agriculturists conducted roadside surveys from 2017 to 2019 (Table 2) that could give useful representative data (Waldner et al. 2019; Fowler et al. 2020), as long as crops and pastures were correctly identified. When deployed at continental scale, there were concerns that cereal crops such as wheat or barley could be mis-identified from the roadside. The Graincast™ app (see below) was created to provide farmers with information about their field and to provide the research team with the necessary training data to build a crop classification model. Limited data were collected via the app, in time for image classification; however, as a proof of concept, it demonstrated that it was possible to crowd-source training data via a data delivery system. Finally, third-party data-sharing agreements were entered into with organisations interested in acquiring output from the Graincast™ suite of products. This was trialled in 2018 with one organisation. By 2020, this became the preferred method of data acquisition for CropID, particularly once it was explained to organisations that the quality of data influenced the quality of the product they received. The geographic spread of training data for CropID in 2020 is illustrated in Fig. 3.
|

|
Ideally, the spectral signatures of a particular crop vary as the season progresses. In an Australian context, discriminating between crop species is challenging. Crops are typically grown during the winter, when the spectral signatures of crop species start to separate out at 70–90 days after seeding (Chia et al. unpubl. data). The spectral signatures, and the timing of the differences in the spectral signatures of crop species, vary across the country, with latitude. For example, it may be possible to discriminate wheat from canola and even barley at Geraldton, Western Australia (28.8S, 114.6E), in mid–late August. This discrimination may not be possible until mid-October in the cool, long growing season around Temora, NSW (34.4S, 147.5E). In addition, the timing of the spectral differences can vary between seasons, depending on the seeding date and the timing of the opening rains. Therefore, the timing of the spectral differences between the crop species varies both spatially and temporally, and the machine learning algorithms require the annual collection of training data across the entire continent (Chia et al. unpubl. data). Crops are grown during winter, and in the southern states (Western Australia, South Australia, Victoria), crops rely on winter rainfall. When there is more rain, there is more cloud, and optical imagery can be obscured by cloud. As suggested by McNairn et al.(2009), all-weather radar images were considered to build an approach that mitigates these risks. Therefore, crop identification in Graincast™ relies on multiple sensors: Landsat-8 for the optical domain and Sentinel-1 for the microwave domain. Imagery was often available on a scene-by-scene basis, but because weather patterns varied in time and space, disparate quantities of imagery were available across the continent. Further, the compositing of imagery varies annually because this, too, is affected by cloud. Operational monitoring cannot tolerate compromises in the integrity of the product due to inability to collect data at critical points in time. Outputs are displayed in Fig. 4, and the attributes of CropID are described in Table 3.

|
|
The value of crop classification comes from being able to create a product in near real-time, before harvest. Once the CropID product was created, it was exported to end-users as a raster file, at state and continental scale.
Field Boundaries
The Field Boundaries component, known as ePaddocks, was created to define field boundaries for the dryland cropping zone, and provide a bounding polygon for the rasterised outputs created from CropID and from C-Crop. With field boundaries, it became possible to create field-level output, with a mean crop yield and crop species, as well as an estimate of the field area. Field boundaries were created by using satellite imagery and training data of individual fields.
To create the training data, teams of people used high-resolution imagery from Google Earth and manually labelled 50 000 field boundaries across Australia. This information was used to create individual field polygons to feed into the machine learning algorithms (Waldner and Diakogiannis 2020; Waldner et al. 2021) (Table 4). Field boundaries were extracted in three sequential steps, following the detection, consensus and delineation principles. In the detection step, fields and their boundaries are automatically detected in single-date satellite images based on a deep-learning model that uses spatial, spectral and temporal cues. In the consensus step, model predictions for multiple dates are averaged to create consolidated predictions. In the delineation step, continuous and closed-field contours are generated from the consolidated model prediction by using hierarchical watershed segmentation. In total, 1.7 million fields were identified across 60 Mha. The field boundaries are available as a shape file and can also be accessed via an API through a web platform.
|
Graincast™ app for crop yield and soil water
The Graincast™ app was created to explore whether training data for CropID could be crowd-sourced using a product that provided information that end-users considered useful. The APSIM crop model was used to produce an estimate of yield potential, as opposed to actual crop yield, at the point scale for a specific field. This use case differs markedly from C-Crop, which produces estimates of actual yield, not yield potential. The APSIM crop model (Holzworth et al. 2014) is a process-based model that requires daily meteorological files, soil information, management information and information about a cultivar to simulate crop yield. Historically, scientists surveyed the soil in detail to parameterise the model for a particular location (Oliver and Robertson 2009; He and Wang 2019), and numerous studies have shown that when the APSIM crop model is properly parameterised it is able to model most dryland crop yields (Carberry et al. 1996; Hochman et al. 2007; Lawes et al. 2009). The ASRIS soil grid (Grundy et al. 2015) provides an estimate of soil properties across the continent at a 90-m resolution. The SILO climate grid (Jeffrey et al. 2001) provides climate estimates at a 5-km resolution. These two products enable a crop yield to be generated for a particular location, when management is assumed, and a crop species and cultivar are chosen. Crop simulation, using these national data streams, has been employed to estimate yield gaps (Hochman et al. 2016) and to derive insights about the impact of future climate on existing crop production (Grundy et al. 2016). Therefore, as part of Graincast™, a web application was created to enable farmers to access information from the APSIM crop model about the yield potential of their crop on any field in Australia.
Outputs from the Graincast™ crop-monitoring process have been delivered to clients. End-users have included farmers, consultants and agribusiness. The product offerings needed to have intrinsic value to the end-user, and we followed an agile design sprint methodology to identify the value propositions and to develop the tool in a rapid, iterative manner (Sari and Tedjasaputra 2017). The process is known as the Google Design Sprint Methodology and was developed by Google Ventures (Sari and Tedjasaputra 2017). To that end, we recognised that human–computer interaction (HCI), with sound useability, could enhance the accessibility and satisfaction of using the application. The collection of user feedback and incorporation of that feedback into the product development process was underpinned by principles and methods common to user-centred design (Allanwood and Beare 2014).
Therefore, growers and consultants were interviewed across the Australian grainbelt to determine what digital information they may be interested in. Following consultation, an app was constructed to deliver soil-water and crop yield information to a grower, using the APSIM yield and soil-water predictions described earlier. Soil-water information was useful early in the growing season and could inform decisions around the application of crop inputs such as nitrogen. Crop yield information was useful for assisting with marketing and management decisions more generally. Qualitative user engagement processes were followed to design the interface, communicate the legal terms and conditions, and provide users with the ability to opt out of the service. The app is not a decision support system. It provides information to the user, who can use that information to make any particular decision; for example, the app was not designed to generate a specific nitrogen recommendation or a sowing recommendation, and therefore differs from traditional decision support systems. The participatory engagement of farmers and consultants contributed to decisions about the interface design and how information was presented. Their perceptions informed the context of using the product, which included capturing insights about consent and data privacy.
The decision to create an app about soil water prediction and a yield forecast was influenced by the farmers’ feedback; however, it was also influenced by the capacity of the team to deliver a certain product within a defined budget. Rather than being designed to solve a complete suite of problems, the application was scoped as a fully functional app that could generate a soil-water estimate and a yield estimate at a point in time for a particular field. This specificity was determined by both project resources and feedback from farmers who participated in early testing with a mock-up. Upon commissioning, the use and uptake of the app were monitored. Growers and consultants, who were the target end-users, were also interviewed to understand what future applications may be relevant and may provide a value-add to their current ways of working.
We invited a sample of end-users to participate in a semi-structured interview through email addresses provided when users register for access to Graincast™ (Ethics approval #106/17). We interviewed six respondents with the objective of eliciting feedback on the value of the information that Graincast™ provides to the users and the extent to which it can effect on-farm decisions, and additional features that would be most valued in later versions of the app.
End-users were engaged with CropID and regional outputs of crop yield. The end-users’ interest was formally captured through the research contract, where the date of delivery and type of delivery were all specified prior to delivery. These contracts were fee-for-service and provide a potent insight into what end-users valued.
End-user evaluations of CropID and Crop Yield monitoring outputs
Outputs from CropID and crop yield monitoring from C-Crop were first provided to end-users in Western Australia for 2018. End-users required frequent, fortnightly updates about the progress of the cropping season. Specifically, the end-users requested information about the area planted to crops and the area planted to individual crop species. Information about crop area was required at subregional or district scales. End-users were particularly interested in yield forecasts, but these needed to be expressed as total tonnage for a particular region.
Crop yield and CropID were provided as a data delivery service. They were not a decision support system. Data were delivered as raster images and shapefiles for processing in geospatial software. End-users needed to integrate the data into their own digital systems, where data was input three times during the growing season. The data were used by the end-user to assist in planning company logistics, and updates were closely scrutinised by the company. Scientists engaged with the company to explain the data every time there was a data exchange. Uncertainty estimates were communicated with RMSE for crop yield. Uncertainty estimates for CropID were communicated with producer, along with user accuracy estimates for each crop class. The key findings regarding CropID and regional crop yield estimation were:
-
Timely (early) predictions were requested by agribusiness, which meant that the operational workflow needed to be quickly established to produce estimates of CropID.
-
Fortnightly updates for C-Crop yield estimates were requested by agribusiness, and these requests were communicated via contract.
-
Accurate assessments for CropID were requested, and generally, an accuracy assessment of ≥80% was required across all crop and pasture classes; 90% accuracy was requested during one negotiation, but the research team did not agree to this stipulation.
-
Considerable effort was required to communicate the implications of the accuracy assessments for CropID. Similar effort was required to communicate the uncertainty estimates surrounding crop yield monitoring and total tonnage for a region.
-
Data from the predictions had to be integrated into the organisation’s digital systems, to assist with decision making. Outputs for custom spatial boundaries for regions of interest were requested by two agribusiness clients.
-
Agribusiness clients requested information at regional, state and national scales. They were not interested in field-scale information.
-
Agribusinesses did use the Graincast™ app, with their clients, for field-scale decisions, but agribusinesses were primarily interested in regional, larger scale estimates of productivity.
-
The research team observed that it was difficult to quantify the impact and value of high-quality classifications during the growing season, from a decision-making perspective.
-
The data were requested by clients to help with the decision-making process. Despite this, it was not clear what decisions the clients were making with the data, or what the value of the data was to their business.
Since 2018, CropID and crop yield monitoring have been provided to six separate agribusiness clients, and these have been licensed to a private company.
End-user evaluation of crop yield and soil-water monitoring of the Graincast™ app
The Graincast™ app was designed to deliver data at the field scale for crop yield and soil water (Fig. 5). It was released in August 2018, at the end of the cropping season. Uptake was limited in 2018, but increased steadily throughout the growing season in 2019, when >1000 fields were monitored. The system was reset in 2020; some users’ email addresses had become inactive and were removed from the system. Uptake continued through the 2020 cropping season, when 1200 fields were monitored by 200 users (Fig. 6). Users were located across the continent (Fig. 7). To use the app, a farmer had to agree to the terms and conditions, identify a field with a pin, and specify its crop type. Soil-water and crop yield potential outputs would then be provided on demand through the app (Fig. 5). In an Australian context, soil-water influences yield potential (Hunt and Kirkegaard 2011). Knowledge of soil-water content can also assist farmers with planting decisions and nitrogen fertiliser decisions (Lawes et al. 2019). Although the app ensured that crop yield and soil-water data could be delivered at the field level, on demand, it also enabled the team to capture training data about what crop is growing where for the current season. This was an attempt to capture crowd-sourced training data, where growers receive output of value to themselves, in exchange for these training data.

|

|

|
Post-deployment monitoring and evaluation of the Graincast™ app
Value of the service provided
A necessary condition for a decision support system to provide value is that it must have the potential to alter a decision of consequence. If information provided by the system never results in an action, or only results in actions that have little or no impact, then outcomes with and without the system are effectively identical.
We surveyed end-users and asked whether there were situations in which information from Graincast™ could alter a decision one way or another. Two such situations emerged. The first involves impact on the decision to apply additional fertiliser (topdressing) to crops later in the season:
‘Probably the main one… is that at certain points of the year there’s trigger points for topdressing fertiliser… particularly those topdressing decisions at midyear, June, July, August. It would certainly help with that.’
The second situation sees Graincast™ being used for reassurance and to commit to plans made earlier in the season. An interviewee identifies times throughout the season when there is an urge to overreact to temporary weather extremes. They report that observing stable yield predictions from Graincast™ could avoid making a rash decision:
‘The point is to take the emotion out of seasonal situations. Just because it’s dripping wet in the middle of July doesn’t mean it’s a particularly wet season. Just because the dust is flying in the middle of July it doesn’t mean it’s necessarily a blow-over season. It’s a matter of taking the emotion out of those periods.’
Arguably, the value of a decision support system should be considered in view of the existence of similar systems that might act as substitutes. However, the Graincast™ app is a data delivery service, so direct comparisons with decision support systems are not entirely warranted, although users are not likely to focus on the subtle difference. All interviewees reported using an ensemble of yield-forecasting tools, such as iPaddock (https://www.ipaddock.com.au/) and YieldProphet™. There are two factors contributing to service value: the novelty of the service provided, for which there may in fact be close substitutes; and the cost at which that service is provided. Cost includes not only the price paid to access the service (which at the moment is zero), but also the time and effort expended by the user. The interviewees identify the comparative advantage of Graincast™ as being that very little information must be manually entered by the user in order to obtain a yield forecast:
‘I’ve used [other app] previously, which I probably… well I’m not sure if I will or won’t in the future. It’s a bit data hungry, and the problem with these sorts of models is you put rubbish information in, you get rubbish information out… the idea of it being simplified has a lot of appeal.’
They also found the user interface to be intuitive and easy to navigate:
‘The interface, it’s very clean. That’s good.’
Additional features
Deployment of an application is rarely the end of its development. Functionality tends to improve over its lifetime, and the amount of funding available for further development can be driven by growth in the number of users. Directly engaging with users allows for further development of the app to be driven in a human-centred fashion, catering to the context of their decisions and stated pain points with the current offering.
Interviewees provided specific actionable feedback on how Graincast™ could be improved. One interviewee, an agronomist, revealed a difference in how advisors would use Graincast™ compared with individual farmers. They illustrated the need for paddock registration to be streamlined for scale so that they could use the app to advise a large number of clients without having to perform a tedious data entry task:
‘I cover a lot of clients, I actually wanted to pick out a number of paddocks for a number of different clients all over the region… But initially I think setting them up, there was obviously a few steps to jump through to actually have the paddock locations set up. … If you wanted a lot of paddocks done… it would be painful.’
Another interviewee, a farmer, suggested that forecasts for a paddock over time be recorded and stored, so that the interviewee may learn what events trigger large changes in forecasts:
‘It’d be really good if the model could log model runs so you can see your forecasts over time. … If you’re looking at it more frequently, you can see the yield getting eaten up and see where the damage has been done, or where it thinks the damage has been done.’
The difference in how agronomists and farmers perceived the usefulness of the product reinforces the point that when working with participatory research methods, like UX, multiple end-users groups should be included.
Discussion
The Australian crop monitoring system Graincast™ was developed to fill a perceived gap in the domestic market that could not be satisfied by existing international crop-monitoring solutions. The development process tackled the technical issues associated with creating a reproducible digital workflow. The digital workflow could be implemented commercially to produce outputs for multiple end-users engaged in the agricultural sector. Each of the components was developed with end-users in mind. The entire process was commercialised so as to ensure the technology could be utilised by any organisation beyond the life of the research project. The impact pathway, through commercialising, was mapped out as part of the research process. The team identified that this was how the project could have impact, following processes defined by Douthwaite et al. (2003).
It is now possible, across 60 Mha of Australia, to understand what was grown on every cropped field, understand what the yield potential of that field was, and understand what the tonnage produced from that field was. The information can be delivered throughout the growing season to end-users willing to subscribe to a commercial system. Therefore, the Graincast™ system was created where the technical development, the user engagement through human-centred design, and the economic requirements of system implementation occurred in concert with feedback loops to each section (Fig. 8). The approach is arguably a development, or modification, of the affordance framework, where considerable co-design and co-development of agricultural systems tools with end-users take place (Ditzler et al. 2018). Here, output from the process is provided as a data-service to the end-user, as a form of field-scale or industry-scale intelligence. It is not a decision support system, and avoids the issues and challenges raised by McCown (2002) and Eichler Inwood and Dale (2019) regarding the development of agricultural decision support systems and agricultural apps. Third parties can then incorporate the data into an in-house information system, and use the output to inform a decision.

|
Users often requested information at critical times during the growing season and specified particular levels of accuracy. Through this process, it became clear that the request for data was linked to a decision, but it was difficult to gauge which decision and the value of that decision to the user. The Graincast™ app was developed purely as an information service. It did not provide a nitrogen recommendation like Yield Prophet (Hochman et al. 2009), and nor did it allow the user to define the soil, like the Soil Water app (Freebairn et al. 2018). The ease of use facilitated uptake, and this occurred because the team followed the principles of human centred design, and chose not to build another nitrogen decision aid. The implication was that the information from the Graincast™ app could be deployed to address multiple questions, and these could vary from one user to the next. This design process demonstrated that delivery of data as a service was viable at the field scale, as the end-user had the autonomy to use the data for whatever purpose they conceived. The multiple components of Graincast™ provided data as a service through Apps, APIs and data transfer agreements with bespoke requirements. End-users typically requested faster, more frequent, more accurate data, that could be delivered through a convenient system at a lower price point than could be provided with the current technology. These requirements could be used as a process to define incremental improvement in the existing suite of technologies.
Linkages between the Graincast™ components
The Graincast™ technologies are interlinked. Training data were required to build C-Crop, Crop ID and Paddock boundaries. C-Crop, Crop ID, Paddock boundaries and the Graincast™ app all utilised high performance computing facilities. Machine learning algorithms were deployed to create C-Crop, Crop ID and Paddock boundaries. Satellite imagery was used to create C-Crop, Crop ID and Field Boundaries, and outputs from these products can be delivered through commercial GIS platforms. Information from each of the Graincast™ products was also distributed from high-performance computing facilities, and this enabled the creation of crop-monitoring data as a service.
Each of these technologies has limitations. For example, if the supply chain of training data for each product improved in both number and quality, then issues such as bias in sampling could be addressed. Similarly, machine learning algorithms such as convolutional neural networks require substantial quantities of information, and thus far, the volume of training data necessary to build more sophisticated crop monitoring tools has not been available. Clients demand earlier detection, and better crop forecasting. These systems can only be developed with better training data, and continued access to high performance computing facilities. As new satellite systems come online, it is conceivable that highly accurate crop-monitoring information can be provided, if there is a market need.
Future development of crop monitoring technology
The end-users of crop-monitoring technology articulated their needs as being where the end-user makes a better decision related to an existing operational requirement. That requirement could be to sow a crop, manage regional logistics operations with grain handling, or market some grain. Every use case indicated that crop-monitoring technology was generally used to assist with operational decision making. Crop monitoring, at this time, is not contributing to transformational changes to agriculture. The use cases identified illustrate that the digitalisation of agriculture, and use by the various commercial entities, often starts with improving business operation. Proponents of digital agriculture often suggest that it will help the world to produce more food (e.g. Shepherd et al. 2020), as long as the technical, social, economic and governance issues can be overcome and it can implemented at scale. Improving operational efficiencies that enable more crops to be sown in the right place, at the right time, with the appropriate levels of inputs will indeed help farmers grow more crop. Global yield gaps, which capture the disparity between what producers grow and the biological yield potential of the crop, vary markedly, but yield gaps in the order of 50% are not uncommon in broadacre crops (van Ittersum et al. 2013). This disparity alone suggests that digital technology could play an important role in communicating, in near real-time, whether a producer’s crops are tracking to yield potential during the growing season. Alternatively, digital agriculture technology, through crop monitoring technology, may help the industry to produce a higher value product, where farmers are able to meet global requirements to track food provenance and gain access to niche, high-value markets. Here, multiple organisations, including farmers, field-monitoring and data-collection services, crop-monitoring services, grain marketers and grain handlers will all need to co-operate to capture this market opportunity. The true value of data, digital agriculture and crop monitoring will be realised only if it vertically integrates into the entire supply chain. Shepherd et al. (2020) suggest that the industry will need to develop integrated solutions to data capture and use along the value chain that embrace novel business models. Multiple organisations will therefore need to collaborate if the value that crop-monitoring technology promises is to be fully exploited. Each organisation will need to embrace aspects of the technical, economic and human-centred design components highlighted in the development of Graincast™ to realise such a vision. An integrated data supply chain would ensure there is sufficient training data to deploy the latest algorithms and satellite technology to agricultural problems. Development cannot take place without this reliable supply of training data.
Conclusion
Crop-monitoring technology has been developed for the Australian continent in which many of the technical difficulties have been addressed. The process was conducted with extensive user engagement with a human-centred design approach. At present, crop-monitoring technology is being employed to enhance operational efficiencies across the supply chain. The use cases outline a clear path for technological improvement, where crop-monitoring data need to be supplied with higher levels of accuracy, earlier in the growing season and in an accessible manner, cognisant of the user’s requirements. There are industry concerns about data governance. The true impact of digital agriculture, and crop-monitoring technology may only be realised if crop-monitoring technology is used throughout the supply chain, and this in turn may require creative partnerships and business models if it is to succeed.
Data availability
The underlying data used to generate figures and tables in this article are not available, because these data are a synthesis of information obtained from multiple third parties under licence.
Conflicts of interest
The Graincast™ technology has been licensed to an external party, Digital Agricultural Services, of which CSIRO is an equity shareholder. The authors hold no direct financial interest.
Declaration of funding
The Graincast™ project was funded as part of the CSIRO Digiscape Future Science Platform.
References
Adjemian MK (2012) Quantifying the WASDE announcement effect. American Journal of Agricultural Economics 94, 238–256.| Quantifying the WASDE announcement effect.Crossref | GoogleScholarGoogle Scholar |
Allanwood G, Beare P (2014) ‘Basics interactive design: user experience design: creating designs users really love’, (Bloomsbury Publishing: London, UK) Available at https://www.bloomsbury.com/uk/basics-interactive-design-user-experience-design-9782940447695/
Angus JF (2001) Nitrogen supply and demand in Australian agriculture. Australian Journal of Experimental Agriculture 41, 277–288.
| Nitrogen supply and demand in Australian agriculture.Crossref | GoogleScholarGoogle Scholar |
Becker-Reshef I, Barker B, Humber M, Puricelli E, Sanchez A, Sahajpal R, McGaughey K, Justice C, Baruth B, Wu B, Prakash A, Abdolreza A, Jarvis I (2019) The GEOGLAM crop monitor for AMIS: assessing crop conditions in the context of global markets. Global Food Security 23, 173–181.
| The GEOGLAM crop monitor for AMIS: assessing crop conditions in the context of global markets.Crossref | GoogleScholarGoogle Scholar |
Boryan C, Yang Z, Mueller R, Craig M (2011) Monitoring US agriculture: the US Department of Agriculture, National Agricultural Statistics Service, Cropland Data Layer Program. Geocarto International 26, 341–358.
| Monitoring US agriculture: the US Department of Agriculture, National Agricultural Statistics Service, Cropland Data Layer Program.Crossref | GoogleScholarGoogle Scholar |
Boschetti M, Busetto L, Manfron G, Laborte A, Asilo S, Pazhanivelan S, Nelson A (2017) PhenoRice: a method for automatic extraction of spatio-temporal information on rice crops using satellite data time series. Remote Sensing of Environment 194, 347–365.
| PhenoRice: a method for automatic extraction of spatio-temporal information on rice crops using satellite data time series.Crossref | GoogleScholarGoogle Scholar |
Carberry PS, McCown RL, Muchow RC, Dimes JP, Probert ME, Poulton PL, Dalgliesh NP (1996) Simulation of a legume ley farming system in northern Australia using the agricultural production systems simulator. Australian Journal of Experimental Agriculture 36, 1037–1048.
| Simulation of a legume ley farming system in northern Australia using the agricultural production systems simulator.Crossref | GoogleScholarGoogle Scholar |
Chen Y, Donohue RJ, McVicar TR, Waldner F, Mata G, Ota N, Houshmandfar A, Dayal K, Lawes RA (2020) Nationwide crop yield estimation based on photosynthesis and meteorological stress indices. Agricultural and Forest Meteorology 284, 107872
| Nationwide crop yield estimation based on photosynthesis and meteorological stress indices.Crossref | GoogleScholarGoogle Scholar |
Defourny P, Bontemps S, Bellemans N, Cara C, Dedieu G, Guzzonato E, Hagolle O, Inglada J, Nicola L, Rabaute T, Savinaud M, Udroiu C, Valero S, Bégué A, Dejoux J-F, El Harti A, Ezzahar J, Kussul N, Labbassi K, Lebourgeois V, Miao Z, Newby T, Nyamugama A, Salh N, Shelestov A, Simonneaux V, Traore PS, Traore SS, Koetz B (2019) Near real-time agriculture monitoring at national scale at parcel resolution: performance assessment of the Sen2-Agri automated system in various cropping systems around the world. Remote Sensing of Environment 221, 551–568.
| Near real-time agriculture monitoring at national scale at parcel resolution: performance assessment of the Sen2-Agri automated system in various cropping systems around the world.Crossref | GoogleScholarGoogle Scholar |
Ditzler L, Klerkx L, Chan-Dentoni J, Posthumus H, Krupnik TJ, Ridaura SL, Andersson JA, Baudron F, Groot JCJ (2018) Affordances of agricultural systems analysis tools: a review and framework to enhance tool design and implementation. Agricultural Systems 164, 20–30.
| Affordances of agricultural systems analysis tools: a review and framework to enhance tool design and implementation.Crossref | GoogleScholarGoogle Scholar |
Donohue RJ, Hume IH, Roderick ML, McVicar TR, Beringer J, Hutley LB, Gallant JC, Austin JM, van Gorsel E, Cleverly JR, Meyer WS, Arndt SK (2014) Evaluation of the remote-sensing-based DIFFUSE model for estimating photosynthesis of vegetation. Remote Sensing of Environment 155, 349–365.
| Evaluation of the remote-sensing-based DIFFUSE model for estimating photosynthesis of vegetation.Crossref | GoogleScholarGoogle Scholar |
Donohue RJ, Lawes RA, Mata G, Gobbett D, Ouzman J (2018) Towards a national, remote-sensing-based model for predicting field-scale crop yield. Field Crops Research 227, 79–90.
| Towards a national, remote-sensing-based model for predicting field-scale crop yield.Crossref | GoogleScholarGoogle Scholar |
Douthwaite B, Kuby T, van de Fliert E, Schulz S (2003) Impact pathway evaluation: an approach for achieving and attributing impact in complex systems. Agricultural Systems 78, 243–265.
| Impact pathway evaluation: an approach for achieving and attributing impact in complex systems.Crossref | GoogleScholarGoogle Scholar |
Eichler Inwood SE, Dale VH (2019) State of apps targeting management for sustainability of agricultural landscapes. A review. Agronomy for Sustainable Development 39, 8
| State of apps targeting management for sustainability of agricultural landscapes. A review.Crossref | GoogleScholarGoogle Scholar |
Fajardo M, Whelan BM (2021) Within-farm wheat yield forecasting incorporating off-farm information. Precision Agriculture 22, 569–585.
| Within-farm wheat yield forecasting incorporating off-farm information.Crossref | GoogleScholarGoogle Scholar |
Fletcher A, Lawes R, Weeks C (2016) Crop area increases drive earlier and dry sowing in Western Australia: implications for farming systems. Crop & Pasture Science 67, 1268–1280.
| Crop area increases drive earlier and dry sowing in Western Australia: implications for farming systems.Crossref | GoogleScholarGoogle Scholar |
Fowler J, Waldner F, Hochman Z (2020) All pixels are useful, but some are more useful: efficient in situ data collection for crop-type mapping using sequential exploration methods. International Journal of Applied Earth Observation and Geoinformation 91, 102114
| All pixels are useful, but some are more useful: efficient in situ data collection for crop-type mapping using sequential exploration methods.Crossref | GoogleScholarGoogle Scholar |
Freebairn DM, Ghahramani A, Robinson JB, McClymont DJ (2018) A tool for monitoring soil water using modelling, on-farm data, and mobile technology. Environmental Modelling & Software 104, 55–63.
| A tool for monitoring soil water using modelling, on-farm data, and mobile technology.Crossref | GoogleScholarGoogle Scholar |
Fritz S, See L, Bayas JCL, Waldner F, Jacques D, Becker-Reshef I, Whitcraft A, Baruth B, Bonifacio R, Crutchfield J, Rembold F, Rojas O, Schucknecht A, Van der Velde M, Verdin J, Wu B, Yan N, You L, Gilliams S, Mücher S, Tetrault R, Moorthy I, McCallum I (2019) A comparison of global agricultural monitoring systems and current gaps. Agricultural Systems 168, 258–272.
| A comparison of global agricultural monitoring systems and current gaps.Crossref | GoogleScholarGoogle Scholar |
Grundy MJ, Rossel RAV, Searle RD, Wilson PL, Chen C, Gregory LJ (2015) Soil and landscape grid of Australia. Soil Research 53, 835–844.
| Soil and landscape grid of Australia.Crossref | GoogleScholarGoogle Scholar |
Grundy MJ, Bryan BA, Nolan M, Battaglia M, Hatfield-Dodds S, Connor JD, Keating BA (2016) Scenarios for Australian agricultural production and land use to 2050. Agricultural Systems 142, 70–83.
| Scenarios for Australian agricultural production and land use to 2050.Crossref | GoogleScholarGoogle Scholar |
Hatt M, Heyhoe E, Whittle L (2012) Options for insuring Australian agriculture. ABARES report to client prepared for the Department of Agriculture, Fisheries and Forestry, Canberra. Available at https://www.awe.gov.au/sites/default/files/sitecollectiondocuments/ag-food/drought/ec/nrac/work-prog/abares-report/abares-report-insurance-options.pdf
He D, Wang EL (2019) On the relation between soil water holding capacity and dryland crop productivity. Geoderma 353, 11–24.
| On the relation between soil water holding capacity and dryland crop productivity.Crossref | GoogleScholarGoogle Scholar |
Hertzler G, Sanderson T, Capon T, Hayman P, Kingwell R, McClintock A, Crean J, Randall A (2013) Real options for adaptive decisions in primary industries: will primary producers continue to adjust practices and technologies, change production systems or transform their industry? Technical Report. National Climate Change Adaptation Research Facility, Griffith University, Southport, Qld, Australia.
| Crossref |
Hochman Z, Dang YP, Schwenke GD, Dalgliesh NP, Routley R, McDonald M, Daniells IG, Manning W, Poulton PL (2007) Simulating the effects of saline and sodic subsoils on wheat crops growing on Vertosols. Australian Journal of Agricultural Research 58, 802–810.
| Simulating the effects of saline and sodic subsoils on wheat crops growing on Vertosols.Crossref | GoogleScholarGoogle Scholar |
Hochman Z, van Rees H, Carberry PS, Hunt JR, McCown RL, Gartmann A, Holzworth D, van Rees S, Dalgliesh NP, Long W, Peake AS, Poulton PL, McClelland T (2009) Re-inventing model-based decision support with Australian dryland farmers. 4. Yield Prophet® helps farmers monitor and manage crops in a variable climate. Crop & Pasture Science 60, 1057–1070.
| Re-inventing model-based decision support with Australian dryland farmers. 4. Yield Prophet® helps farmers monitor and manage crops in a variable climate.Crossref | GoogleScholarGoogle Scholar |
Hochman Z, Gobbett D, Horan H, Garcia JN (2016) Data rich yield gap analysis of wheat in Australia. Field Crops Research 197, 97–106.
| Data rich yield gap analysis of wheat in Australia.Crossref | GoogleScholarGoogle Scholar |
Holzworth DP, Huth NI, deVoil PG, Zurcher EJ, Herrmann NI, McLean G, Chenu K, van Oosterom EJ, Snow V, Murphy C, Moore AD, Brown H, Whish JPM, Verrall S, Fainges J, Bell LW, Peake AS, Poulton PL, Hochman Z, Thorburn PJ, Gaydon DS, Dalgliesh NP, Rodriguez D, Cox H, Chapman S, Doherty A, Teixeira E, Sharp J, Cichota R, Vogeler I, Li FY, Wang E, Hammer GL, Robertson MJ, Dimes JP, Whitbread AM, Hunt J, van Rees H, McClelland T, Carberry PS, Hargreaves JNG, MacLeod N, McDonald C, Harsdorf J, Wedgwood S, Keating BA (2014) APSIM: evolution towards a new generation of agricultural systems simulation. Environmental Modelling & Software 62, 327–350.
| APSIM: evolution towards a new generation of agricultural systems simulation.Crossref | GoogleScholarGoogle Scholar |
Hunt JR, Kirkegaard JA (2011) Re-evaluating the contribution of summer fallow rain to wheat yield in southern Australia. Crop & Pasture Science 62, 915–929.
| Re-evaluating the contribution of summer fallow rain to wheat yield in southern Australia.Crossref | GoogleScholarGoogle Scholar |
Jeffrey SJ, Carter JO, Moodie KB, Beswick AR (2001) Using spatial interpolation to construct a comprehensive archive of Australian climate data. Environmental Modelling & Software 16, 309–330.
| Using spatial interpolation to construct a comprehensive archive of Australian climate data.Crossref | GoogleScholarGoogle Scholar |
Khosravi I, Alavipanah SK (2019) A random forest-based framework for crop mapping using temporal, spectral, textural and polarimetric observations. International Journal of Remote Sensing 40, 7221–7251.
| A random forest-based framework for crop mapping using temporal, spectral, textural and polarimetric observations.Crossref | GoogleScholarGoogle Scholar |
Lawes RA, Oliver YM, Robertson MJ (2009) Integrating the effects of climate and plant available soil water holding capacity on wheat yield. Field Crops Research 113, 297–305.
| Integrating the effects of climate and plant available soil water holding capacity on wheat yield.Crossref | GoogleScholarGoogle Scholar |
Lawes RA, Oliver YM, Huth NI (2019) Optimal nitrogen rate can be predicted using average yield and estimates of soil water and leaf nitrogen with infield experimentation. Agronomy Journal 111, 1155–1164.
| Optimal nitrogen rate can be predicted using average yield and estimates of soil water and leaf nitrogen with infield experimentation.Crossref | GoogleScholarGoogle Scholar |
Lawes R, Chen C, Whish J, Meier E, Ouzman J, Gobbett D, Vadakattu G, Ota N, van Rees H (2021) Applying more nitrogen is not always sufficient to address dryland wheat yield gaps in Australia. Field Crops Research 262, 108033
| Applying more nitrogen is not always sufficient to address dryland wheat yield gaps in Australia.Crossref | GoogleScholarGoogle Scholar |
Maguire M (2001) Methods to support human-centred design. International Journal of Human-Computer Studies 55, 587–634.
| Methods to support human-centred design.Crossref | GoogleScholarGoogle Scholar |
Massey R, Sankey TT, Yadav K, Congalton RG, Tilton JC (2018) Integrating cloud-based workflows in continental-scale cropland extent classification. Remote Sensing of Environment 219, 162–179.
| Integrating cloud-based workflows in continental-scale cropland extent classification.Crossref | GoogleScholarGoogle Scholar |
McCown RL (2002) Changing systems for supporting farmers’ decisions: problems, paradigms, and prospects. Agricultural Systems 74, 179–220.
| Changing systems for supporting farmers’ decisions: problems, paradigms, and prospects.Crossref | GoogleScholarGoogle Scholar |
McNairn H, Champagne C, Shang J, Holmstrom D, Reichert G (2009) Integration of optical and Synthetic Aperture Radar (SAR) imagery for delivering operational annual crop inventories. ISPRS Journal of Photogrammetry and Remote Sensing 64, 434–449.
| Integration of optical and Synthetic Aperture Radar (SAR) imagery for delivering operational annual crop inventories.Crossref | GoogleScholarGoogle Scholar |
Oliver YM, Robertson MJ (2009) Quantifying the benefits of accounting for yield potential in spatially and seasonally responsive nutrient management in a Mediterranean climate. Soil Research 47, 114–126.
| Quantifying the benefits of accounting for yield potential in spatially and seasonally responsive nutrient management in a Mediterranean climate.Crossref | GoogleScholarGoogle Scholar |
Reeves MC, Zhao M, Running SW (2005) Usefulness and limits of MODIS GPP for estimating wheat yield. International Journal of Remote Sensing 26, 1403–1421.
| Usefulness and limits of MODIS GPP for estimating wheat yield.Crossref | GoogleScholarGoogle Scholar |
Robertson MJ, Lawes RA, Bathgate A, Byrne F, White P, Sands R (2010) Determinants of the proportion of break crops on Western Australian broadacre farms. Crop & Pasture Science 61, 203–213.
| Determinants of the proportion of break crops on Western Australian broadacre farms.Crossref | GoogleScholarGoogle Scholar |
Rose DC, Sutherland WJ, Parker C, Lobley M, Winter M, Morris C, Twining S, Ffoulkes C, Amano T, Dicks LV (2016) Decision support tools for agriculture: towards effective design and delivery. Agricultural Systems 149, 165–174.
| Decision support tools for agriculture: towards effective design and delivery.Crossref | GoogleScholarGoogle Scholar |
Sari E, Tedjasaputra A (2017) Designing valuable products with design sprint. In ‘INTERACT 2017. Proceedings 16th IFIP TC 13 international conference on human–computer interaction’. (Eds R Bernhaupt, G Dalvi, A Joshi, DK Balkrishan, J O'Neill, M Winckler). Human-Computer Interaction – INTERACT 2017, Lecture Notes in Computer Science, vol. 10516, pp. 391–394. (Springer: Cham)
| Crossref |
Shepherd M, Turner JA, Small B, Wheeler D (2020) Priorities for science to overcome hurdles thwarting the full promise of the ‘digital agriculture’ revolution. Journal of the Science of Food and Agriculture 100, 5083–5092.
| Priorities for science to overcome hurdles thwarting the full promise of the ‘digital agriculture’ revolution.Crossref | GoogleScholarGoogle Scholar | 30191570PubMed |
van der Velde M, van Diepen CA, Baruth B (2019) The European crop monitoring and yield forecasting system: celebrating 25 years of JRC MARS Bulletins. Agricultural Systems 168, 56–57.
| The European crop monitoring and yield forecasting system: celebrating 25 years of JRC MARS Bulletins.Crossref | GoogleScholarGoogle Scholar |
van Ittersum MK, Cassman KG, Grassini P, Wolf J, Tittonell P, Hochman Z (2013) Yield gap analysis with local to global relevance: a review. Field Crops Research 143, 4–17.
| Yield gap analysis with local to global relevance: a review.Crossref | GoogleScholarGoogle Scholar |
Waldner F, Diakogiannis FI (2020) Deep learning on edge: extracting field boundaries from satellite images with a convolutional neural network. Remote Sensing of Environment 245, 111741
| Deep learning on edge: extracting field boundaries from satellite images with a convolutional neural network.Crossref | GoogleScholarGoogle Scholar |
Waldner F, Chen Y, Lawes R, Hochman Z (2019) Needle in a haystack: mapping rare and infrequent crops using satellite imagery and data balancing methods. Remote Sensing of Environment 233, 111375
| Needle in a haystack: mapping rare and infrequent crops using satellite imagery and data balancing methods.Crossref | GoogleScholarGoogle Scholar |
Waldner F, Diakogiannis FI, Batchelor K, Ciccotosto-Camp M, Cooper-Williams E, Herrmann C, Mata G, Toovey A (2021) Detect, consolidate, delineate: scalable mapping of field boundaries using satellite images. Remote Sensing 13, 2197
| Detect, consolidate, delineate: scalable mapping of field boundaries using satellite images.Crossref | GoogleScholarGoogle Scholar |
