

The prediction of genetic values of chickpea genotypes in F4 generation by REML/BLUP and FAI–BLUP from mixed analysis models and feature importance ranking by boruta–random forest model
Sibel Ipekesen A * and Behiye Tuba Bicer A
A
Abstract
Selection indices are frequently used in plant breeding programs to evaluate multiple traits simultaneously. These indices allow the selection of genotypes that combine desirable characteristics for the product and show high yields.
The paper aimed to predict genetic parameters of 29 chickpea genotypes in the F4 generation, to determine genotypic and phenotypic correlation and genotypic and phenotypic path coefficients and to select superior chickpea genotypes by using mixed linear models.
The experiment was conducted in Diyarbakir, south-eastern Anatolia of Türkiye. The experiment was arranged as a randomized complete blocks design with three replications. The selection of features and superior genotypes was analyzed using some mixed analysis models, including restricted maximum likelihood–best linear unbiased prediction (REML/BLUP,) genotype–ideotype distance index (FAI–BLUP), principal component analysis (PCA), feature importance ranking (boruta–random forest) and classifying features and genotypes (Ward’s clustering).
These mixed analysis models effectively selected the best chickpea genotypes that have advantageous genetic gains for all examined features. The selection accuracy for predicting genetic values was quite high (>96%) in the REML/BLUP model; however, it was lower (78.2%) in the PCA. In the boruta–random forest, the superior features closely related to seed yield plant−1 were determined in chickpea genotypes. The FAI–BLUP index showed that G3, G7, G10, G23, G27, and G28 genotypes were closest to the ideotype for the features. Additionally, in Ward’s clustering analysis, these genotypes had a wide genetic diversity and high similarity.
The results of this paper indicated that the used models are effective in selecting features contributing to seed yield in chickpea breeding programs.
This paper evaluated mixed linear models to predict genetic parameters of chickpea genotypes and provides recommendations on the best models.
Keywords: Boruta-random forest, chickpea, Cicer arietinum, FAI-BLUP, mixed models, REML-BLUP, selection, Ward’s clustering.
Introduction
Chickpea (Cicer arietinum L.) is a significant part of diet worldwide, being a source rich in vitamins, minerals, protein, etc. (Ipekesen et al. 2022; Tunc et al. 2025). The world chickpea production has been recorded to be approximately 16 million tons from an area of 14 million ha. Although Türkiye is the third-largest producer (580.000 tons) after India and Australia globally, it has low productivity (1260 kg ha−1) (FAOSTAT 2023). This may be because of the limited high-yielding chickpea cultivars and insufficient management applications in agricultural areas.
Genetic diversity plays a significant role in plant breeding programs that aim to improve desirable features in crops. Indeed, improving feature selection relies on the amount of diversity in studied genetic material. Genetic diversity can be caused by genotypic differences in heterogeneous population for examined features of crops. Prediction of heritability is realized to determine the amount of diversity in the population; also, genetic progress is effective in showing genetic gains expected from selection. Success in plant breeding depends on good understanding of the genetic parameters of the yield and yield-related features, and the relationships among features can facilitate in improving effective selection strategies and complex features such as seed yield. Seed yield is controlled by many gene actions and environmental factors. Because yield is a polygenic feature, the direct selection may not be possible. Therefore, selection should be made on features contributing to yield, so as to determine superior genotypes in studied population. Joshi et al. (2018) also stated that there was genetic diversity for yield and seed yield contributed features to chickpea genotypes in spite of their genetic bottleneck. Additionally, the genotypic and phenotypic variance in studied genotypes is remarkably significant in the success of breeding programs, to select parental genotypes from populations. Prediction of the level of genetic diversity and determination of the significance of features have critical importance for further feature finding, inter-crossing design and best parental genotype selection (Jakhar 2014).
Recently, the many mixed linear models have been used to predict genotypic values and to perform effective selection on determining superior genotypes (Zali et al. 2023; Ghavidel et al. 2024; Amrate et al. 2025; Naveen et al. 2025). Prediction of genetic values of seed yield and seed-related features is determined by some mixed linear models such as best linear unbiased predictions (BLUPs) to determine the actual genetic potential of genotypes (Olivoto et al. 2019), factor analysis integrated best linear unbiased prediction (FAI–BLUP) to define distance between genotype and ideotype (Rocha et al. 2018), principal component analysis (PCA) and boruta–random forest to determine significant variable (Kassambara and Mundt 2017) and to feature-significance ranking (Breiman 2001). In addition, cluster analysis models are used to determine the genetic distance between the studied genotypes and features (Jayalakshmi et al. 2022; Qulmamatova 2023; Dehbaoui et al. 2024).
In the current study, the use of genotypic and phenotypic path coefficient of features, genotypic and phenotypic correlation, and some mixed linear models (REML/BLUP, PCA, boruta–random forest, FAI–BLUP and clustering) for predicting genetic values and defining superior genotypes of 29 chickpea genotypes was investigated.
Materials and methods
Experimental site properties
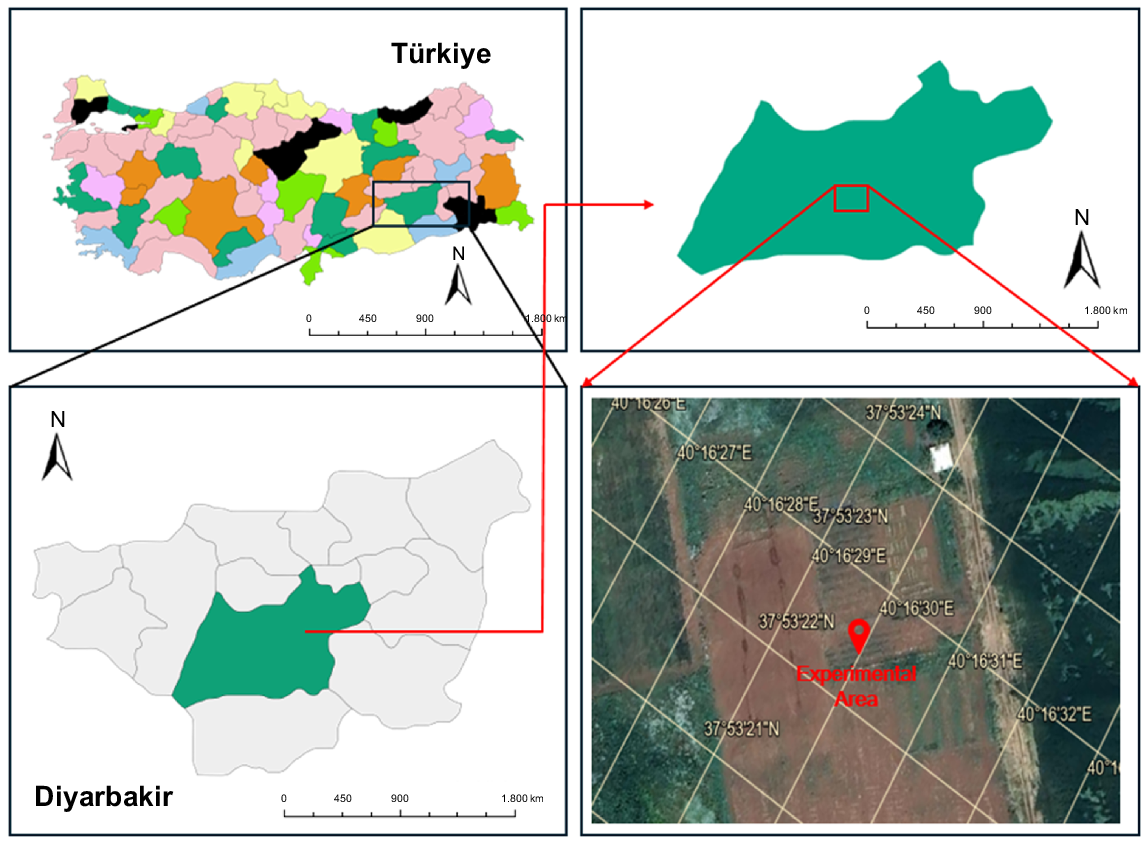
The study was conducted in the 2024 crop season, at Dicle University Agriculture Faculty Experimental Area, in Diyarbakir of south-eastern Anatolia, Türkiye (37°53′22″N, 40°16′E32″, 667.86 masl) (Fig. 1).
The soil is classified as a typical brown. The experimental soil had a pH of 7.65, being slightly alkaline, the organic matter content was 1.2%, the phosphorus content was quite low (18.8 kg ha−1), and the lime content was at a medium level (11.71%). The nitrogen ratio was quite low (0.032%) and the potassium amount was at a medium level (1003.60 kg ha−1).
Climate data
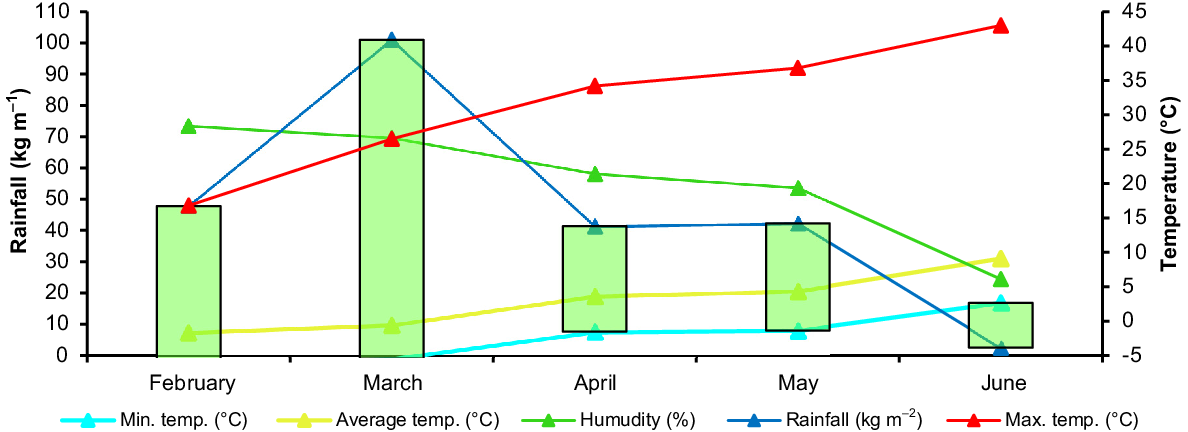
The climate is classified as Mediterranean climate, a major climate type of the Köppen classification, characterized by hot, dry summers and cool, wet winters.
The average temperature values were 9.8°C, 19.0°C and 20.6°C for March, April and May respectively. The maximum temperatures occurred in May (36.8°C). The total rainfall during the vegetation period was 235 kg m−2, and March (101.00 kg m−2) hadmore rain than did other months. The amount of rainfall in May, which was the flowering and pod period, was moderate (42.30 kg m−2). The average relative humidity was 55.90% during the vegetation period, and the lowest humidity was in June (Fig. 2).
Experimental design
In the study, chickpea crosses in F4 generation were obtained from seven chickpea cultivars crossed (ILC 482, ILC 3279, Cagatay, Hisar, Local desi, Diyar 95, AKN 7114) that had shown superior performance for some plant characters during cultivation in 2019 in Türkiye. The experiment was conducted as a randomized complete block design, with 29 chickpea crosses and three replications. Parents and crosses used are given in Table 1. Harvested single plants of F3 generation were sown on 21 February 2024. The plots were composed by two rows with 2 m long row spacing of 0.45 m and plant density of 55 plants m−2.
| Genotype code | Definition | Name/property | ||||
|---|---|---|---|---|---|---|
| G1 | Parent | ILC 482: ram-head shape; seed color, cream; plant height, 40–45 cm, semi-erect; 100-seed weight, 27–30 g; seed yield; 1660–2000 kg ha−1 | ||||
| G2 | Parent | Cagatay: ram-head shape; seed color, white; plant height, 40–50 cm, erect; 100-seed weight, 47–50 g; seed yield, 2000–2500 kg ha−1 | ||||
| G3 | Parent | ILC 3279: pea-shaped; seed color, cream; plant height;, 45–60 cm, erect; 100-seed weight, 28–29 g; seed yield, 900–1000 kg ha−1 | ||||
| G4 | Parent | Hisar: ram-head shape; seed color, red; plant height, 43–45 cm, erect; 100-seed weight, 45–46 g; seed yield, 950–1340 kg ha−1 | ||||
| G5 | Parent | Local desi: owl-head shape; seed color, black; plant height, 30–50 cm, semi-erect; 100-seed weight, 21–30 g; seed yield, 850–1000 kg ha−1 | ||||
| G6 | Parent | Diyar 95 (FLIP83-47C): ram-head shape; seed color, cream; plant height, 50–75 cm, erect; 100-seed weight, 40–45 g; seed yield, 1500–2000 kg ha−1 | ||||
| G7 | Parent | AK-71114: owl-head shape; seed color, cream; plant height, 35–40 cm, semi-erect; 100-seed weight, 38–40 g; seed yield, 1800–1900 kg ha−1 | ||||
| Crosses | ||||||
| G8 | Hisar × AK-71114 | G15 | ILC3279 × Cagatay | G22 | ILC 482 × Diyar 95 | |
| G9 | Hisar × AK-71114 | G16 | ILC3279 × Cagatay | G23 | Hisar × Cagatay | |
| G10 | AK-71114 × Hisar | G17 | ILC3279 × Cagatay | G24 | Hisar × Cagatay | |
| G11 | ILC 3279 × Hisar | G18 | ILC3279 × Cagatay | G25 | Hisar × Cagatay | |
| G12 | Hisar × ILC 3279 | G19 | AK-71114 × ILC 3279 | G26 | Cagatay × Hisar | |
| G13 | Hisar × ILC 3279 | G20 | Cagatay × AK-71114 | G27 | Cagatay × Hisar | |
| G14 | ILC3279 × Cagatay | G21 | AK-71114 × Local desi | G28 | Cagatay × Hisar | |
| G29 | Cagatay × Hisar | |||||
Measurements
The examined agro-morphologic traits were as follows: number of nodes that were the number of nodes at first flower plant−1; plant height (cm), measured as the distance from the soil to the top of the plant; number of pods plant−1, counted as the total number of pods plant−1; pod weight plant−1 (g), measured as the total weight of pods per plant, with a precision scale; plant biomass (g), measured as the total of above- and below-ground plant parts, with aprecision scale, at harvest; number of seeds plant−1, counted as the number of seeds plant−1; seed yield plant−1 (g), measured as the total seed weight, with a precision scale. Fertilization was not treated on soil. Weeds were controlled by hand. Plants were harvested from 15 to 25 June 2024.
Genetic values
The data from this study were extrapolated from phenotypic observations. The genetic values in this study were derived from phenotypic-based BLUP estimates, not from molecular genomic selection. Genetic values were formulated in R software (ver. 4.4.2; Xposit team 2025) (Table 2).
| Genetic parameter | Equation | Reference | |
|---|---|---|---|
| Vg | Subramanian and Sivasubramanian (1975) | ||
| MSg, mean square for genotypes; MSe, error mean square; r, the number of replication. | |||
| Vp | Subramanian and Sivasubramanian (1975) | ||
| , phenotypic variance; , genotypic variance; , environmental variance. | |||
| PCV | Subramanian and Sivasubramanian (1975) | ||
| GCV | Subramanian and Sivasubramanian (1975) | ||
| X, grand mean of traits. | |||
| h2 | Allard (1960) | ||
| h2 = 0–30%, low; 30–60% moderate; >60%, high | Robinson et al. (1949) | ||
| GA | h2 × k × σp | Allard (1960) | |
| GAM | Allard (1960) | ||
| k, constant value of selection intensity of 5% (k = 2.06); σp, phenotypic standard deviation, μ, grand populations mean for characters. | |||
| rp | Singh and Chaudhary (1985) | ||
| rp, phenotypic correlation coefficient; Pcov xy, phenotypic covariance between variables x and y; σ2px, phenotypic variance for characters X; σ2py, phenotypic variance for characters Y. | |||
| rg | Singh and Chaudhary (1985) | ||
| rg, genotypic correlation coefficient; Gcov xy, genotypic covariance between variables x and y; 2gx, genotypic variance for characters X; σ2gy, genotypic variance for characters Y. | |||
| Path coefficient | Dewey and Lu (1959) | ||
| p ij, direct effects of the independent characters; Σr ik.p kj, indirect effects of independent character (i) on a given dependent character (j) by all other independent characters (k) | |||
| P r | 1 − r ijP ij | Dewey and Lu (1959) | |
| r ij, mutual relation between the independent character (i) and dependent character (j); i, dependent variable; j, genotypic path coefficient; P r, residual factor. | |||
Abbreviations: Vg, genotypic variance; Vp, phenotypic variance; GCV, genotypic coefficient of variance; PCV, phenotypic coefficient of variance; h2, broad sense heritability; GA, genetic advance; GAM, genetic advance as percentage of mean.
REML/BLUP analysis
The variance sources were determined by restricted maximum likelihood (REML/BLUP) by using ‘waasb’ function in the prediction-maximization algorithm (Dempster et al. 1977). The significance of random effects was determined by likelihood ratio test (LRT) at a 0.01 probability. The variance components were predicted, including (phenotypic variance), (individual heritability in broad sense), h2mg (heritability of genotypes means), CVg (coefficient of genetic variation), CVr (residual variance) and CV (coefficient of variance). BLUP of the genotypes was computed by the following formula (Resende and Duarte 2007; Resende et al. 2014):
where μ is the overall mean of the genotypes (phenotypic mean), g is genetic deviation of an individual (genetic effects), PEV is the error variance of the genotypic values, and is the genotypic variance. The maximum values for plant height, plant biomass, number of pods plant−1, pod weight plant−1, number of seeds plant−1, seed yield plant−1 and number of nodes at first flower were used to identify ideal characters for examined genotypes. To calculate the index, the FAI–BLUP function was used in R software, by using the Metan package (ver. 4.4.2, http://www.posit.co/, Olivoto et al. 2019). The FMSB package was used for radar chart using the radar-chart function (Nakazawa 2018).
Principle component analysis
The principal component analysis of agro-morphological characters of the chickpea genotypes was performed in R software (ver. 4.4.2; Xposit team 2025) by coding FactoMineR (ver. 4.4.2, http://www.posit.co/), factoextra (ver. 4.4.2, http://www.posit.co/), tidyverse (ver. 4.4.2, http://www.posit.co/) and RColorBrewer (ver. 4.4.2, http://www.posit.co/) packages by using the ‘fviz_pca_biplot’ function (Kassambara and Mundt 2017). PCA was calculated on formula reported by Saporta and Niang (2009), as follows:
where f2i is the squared factor score of each observation and λl is the eigenvalue of the lth component.
Boruta–random forest analysis
Boruta–random Forest analysis was coded in R software (ver. 4.4.2), by using ‘plotImpHistory’ function to select features on the basis of the feature importance order calculation. Boruta–random forest was constructed to detect complex interactions between genotype and phenotypes. Feature selection was realized by random forest algorithms such as boruta, mlbench, caret and randomForest packages (Breiman 2001). This model was trained on the extended dataset (original features + shadow features). The feature importance of each feature was taken from the model. Boruta compared the importance values of the original features with the highest importance value of the shadow features. According to this model, if the importance value of a feature was greater than the maximum importance value of the shadow features, this feature was considered ‘relevant’. However, if it was lower, this feature was rejected as ‘irrevelant’. Boruta was based on the feature importance order calculation of the random forest algorithm, and is calculated by formula reported by Breiman (2001). Additionally, feature importance in random forest analysis was performed by using codes in matplotlib.pyplot packages in Python software Google Colab Notebook. The features were listed according to their importance, and the decided highest MaxImp value (Breiman 2001), as follows:
where T is the total number of trees in random forest, ΔIt is reduction contribution of the feature in the tth tree, and Xj is the information gain or Gini impurity. Additionally, dataset was normalized and denormalizated by the following formulas (Jain et al. 1996):
where SMnorm is normalized value (between 0 and 1), SMobserved is original observed value, SMmin is minimum of original values, SMmax is maximum of original values (Strobl et al. 2008),
In this equation, OOB defines separately the predicted values, and I(*) is the indicator function (Ahmed et al. 2021).
where MDA is the standard deviation of accuracy losses. Z-scores < normhits: features are marked as ‘irrelevant’ and ‘rejected’ Z-scores > normhits: features are marked as ‘relevant’ and ‘confirmed’.
FAI–BLUP analysis
Multi-trait selection was determined by coding for genetic parameters on the FAI–BLUP index in R software (Rocha et al. 2018). The factor analysis and ideotype-design (FAI–BLUP) index (Rocha et al. 2018) were calculated to rank the genotypes on the basis of multitraits by using MGIDI formula and ‘aku’ function.
The multi-trait genotype–ideotype distance index, MGIDI (Olivoto and Nardino 2020), was computed and used to select genotypes in plant breeding programs on the basis of multiple traits. The MGIDI index is computed as follows:
where MGIDIi is the multi-trait genotype–ideotype distance index for the ith genotype; Fij is the score of the ith genotype in the jth factor (i = 1, 2,.., g; j = 1,2,.., f), with g and f being the number of genotypes and factors respectively, and Fj is the jth score of the ideotype. The genotype with the lowest MGIDI is then closer to the ideotype, and therefore should present desired values for all the analyzed traits.
Cluster analysis
The cluster analysis was coded in R software (ver. 4.4.2; Xposit team 2025) dendextend package (ver. 4.4.2, http://www.posit.co/). Cluster analysis are based on the Ward’s minimum variance method using the Euclidean distance. This method optimizes by minimizing the within-group sum of squares, while maximizing the between-group sum of squares. The agglomerative process begins with x individual groups and progresses by combining observations into clusters. Clusters are merged in such a way that the total sum of squares is increased by the smallest amount at each merging step. The distance between two clusters is defined as the increase in the total internal variance when these clusters merge. The incremental total error squares are calculated as follows (Ward 1963):
where ΔE is the change in the total squared error (variance) resulting from the union of two clusters (e.g. Ci and Cj), is the summation taking into account all the elements in the union of clusters Ci and Cj (Ci∪Cj), is the data points in the clusters, is the mean of all data points in the union of Ci and Cj, is the sum of squared deviations of all elements in Ci from the mean of Ci(xi), is the sum of squared deviations of all elements in Cj from the mean of Ci(xj), Ci is the i-th cluster, Cj is the jth cluster, and Ci∪Cj is the union of clusters Ci and Cj.
Data analysis
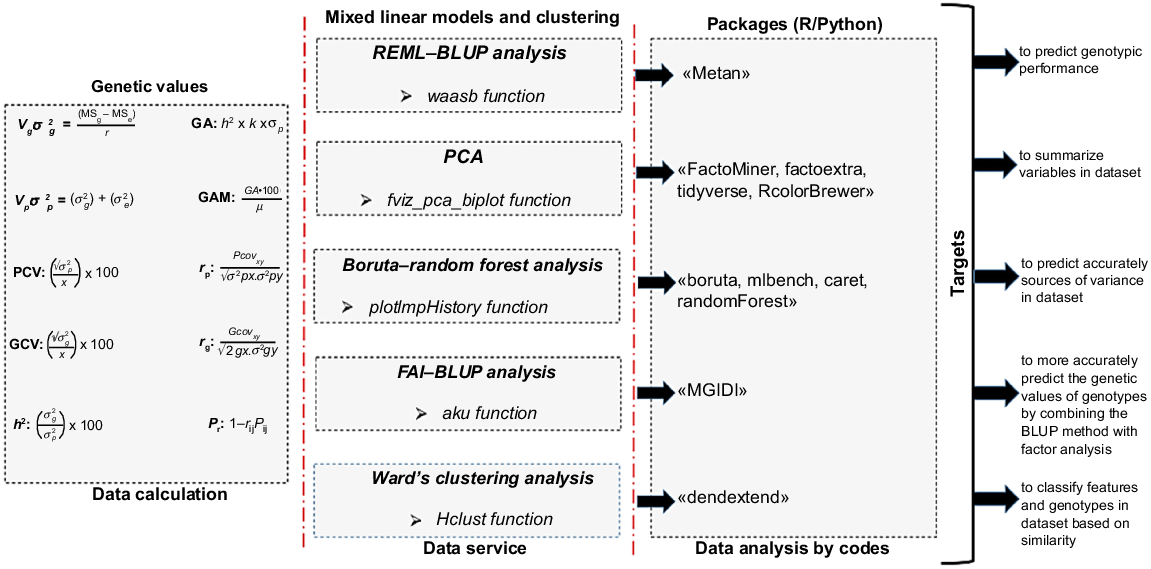
Data were analyzed on an individual-plant basis. The obtained data on agro-morphological characters were analyzed with ANOVA. Prediction of genetic parameters based on equations were coded in R software (ver. 4.4.2; Xposit team 2025). Genotypic and phenotypic correlation was performed to understand the characters of the genotypes and to determine how these characters are related to genetic and environmental factors. Genotypic and phenotypic path analysis was performed to understand the direct and indirect effects of environmental and genetic factors on characters. BLUPs analysis was performed to predict the genetic values of crosses/genotypes and to select individuals with high genetic value, taking into account both genetic and environmental effects. In addition to traditional BLUPs analysis, the FAI–BLUP index was used to calculate the factor structure of the traits and the common variance in the genetic data. To optimize the selection of crosses/genotypes having high genetic value was obtained by radar chart. PCA was performed to identify the main sources of variance in dataset. Cluster analysis based on the Ward’s minimum variance method was performed to determine the distance of the genotypes from each other in terms of the examined parameters. Boruta–random forest model was performed to find relevant features in the dataset and eliminate irrelevant features. To ensure the reliability and generalizability of the machine learning models, a five-fold cross-validation approach was implemented. In this procedure, the dataset was randomly divided into five equal subsets. In each iteration, four subsets were used for model training, whereas the remaining subset was employed for testing. This process was repeated five times so that each subset served once as the test data, and the results were averaged to estimate the overall model performance. This strategy was adopted to reduce potential bias arising from the limited sample size and to minimize the risk of overfitting. Random forest was performed to determine which features of the model carried more information and were more effective in predicting the target feature (seed yield plant−1). Flowchart for data analysis is given in Fig. 3.
Results
The ANOVAs of investigated characters are shown in Table 3. Differences among genotypes for all the characteristics were significant.
| Variation source | Plant biomass (g) | Plant height (cm) | Number of pods plant−1 | Pod weight plant−1 | Number of seeds plant−1 | Seed yield plant−1 | Number of nodes at first flower | |
|---|---|---|---|---|---|---|---|---|
| Genotype | 222.435* | 103.419** | 454.193** | 123.825** | 483.750** | 68.833** | 12.008** | |
| Error | 18.835 | 7.851 | 13.736 | 5.041 | 7.897 | 3.603 | 1.908 | |
| CV (%) | 17.58 | 6.54 | 11.20 | 13.39 | 8.51 | 15.97 | 9.88 |
*P ≤ 0.05; **P ≤ 0.01; n.s., not significant.
Prediction of genetic parameters
The study showed that there were highly significant (P ≤ 0.01) differences among genotypes for plant height, number of pods plant−1, pod weight plant−1, number of seeds plant−1, seed yield plant−1 and number of nodes at first flower. There were significant (P ≤ 0.05) differences among genotypes for plant biomass (Table 3). The highly significant variation among genotypes for all examined agro-morphological characters showed that the presence of wide variability, which supports scope for selecting superior and desired genotypes for food legumes breeders.
The analysis of estimated variance component, genetic advance, genetic advance as a percentage of mean and broad-sense heritability for all characters are shown in Table 4. The genotypic coefficient of variation (GCV) for number of nodes at first flower and plant height were recorded as 13.18%. GCV value was categorized as moderate (10–20%) for the number of nodes at first flower and plant height. GCV of the number of pods plant−1, pod weight, plant biomass, number of seeds plant−1 and seed yield plant−1 were 36.60%, 37.57%, 33.40%, 38.18% and 39.39% respectively. GCV values were categorized as high (>20%) for these characters. The phenotypic coefficient of variation (PCV) was 10–20% for the number of nodes at first flower and plant height. In contrast, PCV was >20% for the number of pods plant−1, pod weight, plant biomass, number of seeds plant−1 and seed yield plant−1 (Table 4).
| Item | Number of nodes at first flower | Plant height (cm) | Number of pods plant−1 | Pod weight plant−1 | Plant biomass (g) | Number of seeds plant−1 | Seed yield plant−1 | |
|---|---|---|---|---|---|---|---|---|
| Maximum value | 22.00 | 66.00 | 66.00 | 37.57 | 49.50 | 70.00 | 26.44 | |
| Minimum value | 8.00 | 32.00 | 12.00 | 5.09 | 10.26 | 14.00 | 3.05 | |
| Grand mean | 13.97 | 42.82 | 33.10 | 16.74 | 24.63 | 33.01 | 11.83 | |
| s.e.m. | 0.78 | 1.62 | 2.15 | 1.32 | 2.54 | 1.42 | 1.11 | |
| CD0.05 | 2.22 | 4.58 | 6.08 | 3.73 | 7.20 | 4.28 | 3.15 | |
| CD0.01 | 2.95 | 6.09 | 8.10 | 4.97 | 9.59 | 5.90 | 4.19 | |
| Ve | 1.84 | 7.84 | 13.86 | 5.20 | 19.36 | 7.33 | 3.70 | |
| Vg | 3.39 | 31.87 | 146.78 | 39.54 | 67.69 | 158.81 | 21.71 | |
| Vp | 5.23 | 39.70 | 160.63 | 44.74 | 87.05 | 166.14 | 25.42 | |
| ECV | 9.72 | 6.54 | 11.24 | 13.63 | 17.87 | 8.20 | 16.27 | |
| GCV | 13.18 | 13.18 | 36.60 | 37.57 | 33.40 | 38.18 | 39.39 | |
| PCV | 16.38 | 14.72 | 38.29 | 39.97 | 37.88 | 39.04 | 42.62 | |
| H(BS) | 0.65 | 0.80 | 0.91 | 0.88 | 0.78 | 0.96 | 0.86 | |
| GA | 3.05 | 10.42 | 23.86 | 12.18 | 14.95 | 25.38 | 8.88 | |
| GAM | 21.86 | 24.33 | 72.06 | 72.76 | 60.67 | 76.89 | 75.00 |
s.e.m., standard error of the mean; CD0.05, critical difference 5%; CD0.01, critical difference 1%; Ve, environmental variance; Vg, genotypic variance; Vf, phenotypic variance; ECV, environmental coefficient of variance; GCV, genotypic coefficient of variance; PCV, phenotypic coefficient of variance; H(BS), broad sense heritability; GA, genetic advance; GAM, genetic advance as percentage of mean; MS, mean square.
Genotypic (rg) and phenotypic (rp) correlation
Genotypic and phenotypic correlation results are given in Table 5. Seed yield plant−1 showed a positive and strongly significant correlation with pod weight (rg:0.98**, rp:0.92**). The number of pods plant−1 showed a positive and highly significant correlation with pod weight (rg:0.87**, rp:0.80**), number of seeds plant−1 (rg:0.93**, rp:0.88**) and seed yield plant−1 (rg:0.79**, rp:0.72**). Plant biomass showed a positive and highly significant correlation with plant height (rg:0.44*, rp:0.39**), number of pods plant−1 (rg:0.84**, rp:0.73**), pod weight plant−1 (rg:0.89**, rp:0.78**), number of seeds plant−1 (rg:0.71**, rp:0.63**) and seed yield plant−1 (rg:0.82**, rp:0.70**) (Table 5).
| Parameter | Plant biomass | Plant height | Number of pods plant−1 | Pod weight plant−1 | Number of seeds plant−1 | Seed yield plant−1 | Number of nodes at first flower | |
|---|---|---|---|---|---|---|---|---|
| Plant biomass | – | 0.39** | 0.73** | 0.78** | 0.63** | 0.70** | −0.08n.s. | |
| Plant height | 0.44* | – | 0.37** | 0.27* | 0.22* | 0.14n.s. | 0.07n.s. | |
| Number of pods plant−1 | 0.84** | 0.43* | – | 0.80** | 0.88** | 0.72** | −0.05n.s. | |
| Pod weight plant−1 | 0.89** | 0.34n.s. | 0.87** | – | 0.79** | 0.92** | −0.13n.s. | |
| Number of seeds plant−1 | 0.71** | 0.26n.s. | 0.93** | 0.83** | – | 0.75** | 0.02n.s. | |
| Seed yield plant−1 | 0.82** | 0.18n.s. | 0.79** | 0.98** | 0.78** | – | −0.12n.s. | |
| Number of nodes at first flower | −0.20n.s. | 0.06n.s. | −0.12n.s. | −0.20n.s. | −0.01n.s. | −0.22n.s. | – |
*P ≤ 0.05; **P ≤ 0.01; n.s., not significant.
Genotypic and phenotypic path coefficient
Genotypic and phenotypic path coefficient results are given in Table 6. Phenotypic and genotypic correlations were separated into direct and indirect effects to determine the significance of various traits on seed yield per plant. Path analysis was conducted at both the phenotypic and genotypic levels, using seed yield plant−1 as the dependent variable, to explore the causal factors and identify the shared components contributing to seed yield plant−1. Path analysis showed direct (diagonal) and indirect (off-diagonal) effect on seed yield plant−1 over examined characters. The greatest positive direct effects on seed yield plant−1 were in pod weight plant−1. In contrast, there were negative indirect effects on seed yield in all traits at both genotypic and phenotypic path analyses (Table 6).
| Item | Plant biomass | Plant height | Number of pods plant−1 | Pod weight plant−1 | Number of seeds plant−1 | Number of nodes at first flower | |
|---|---|---|---|---|---|---|---|
| Genotypic path analysis | |||||||
| Plant biomass | −0.10144 | −0.05849 | −0.13449 | 1.13180 | −0.01586 | −0.00056 | |
| Plant height | −0.04475 | −0.13257 | −0.06819 | 0.43456 | −0.00585 | 0.00018 | |
| Number of pods plant−1 | −0.08515 | −0.05642 | −0.16023 | 1.11241 | −0.02063 | −0.00033 | |
| Pod weight plant−1 | −0.08993 | −0.04512 | −0.13961 | 1.27670 | −0.01839 | −0.00056 | |
| Number of seeds plant−1 | −0.07231 | −0.03485 | −0.14852 | 1.05520 | −0.02225 | −0.00003 | |
| Number of nodes at first flower | 0.02010 | −0.00833 | 0.01903 | −0.25699 | 0.00020 | 0.0028 | |
| Residual = −0.0031 | |||||||
| Phenotypic path analysis | |||||||
| Plant biomass | 0.03910 | −0.04387 | −0.06410 | 0.70454 | 0.06923 | −0.00030 | |
| Plant height | 0.01522 | −0.11273 | −0.03267 | 0.24808 | 0.02434 | 0.00027 | |
| Number of pods plant−1 | 0.02864 | −0.04208 | −0.08753 | 0.72370 | 0.09666 | −0.00019 | |
| Pod weight plant−1 | 0.03047 | −0.03093 | −0.07007 | 0.90406 | 0.08684 | −0.00048 | |
| Number of seeds plant−1 | 0.02451 | −0.02485 | −0.07661 | 0.71096 | 0.11043 | 0.00006 | |
| Number of nodes at first flower | −0.00306 | −0.00815 | 0.00429 | −0.11436 | 0.00181 | 0.00378 | |
| Residual = 0.138 | |||||||
REML/BLUP of genotypes
The LRT values of genetic effects were significant (P ≤ 0.01) for all examined features, which showed that selection gains could be possible in chickpea genotypes (Table 7). The phenotypic expression () of plant biomass (87.1%), number of pods plant−1 (161%) and number of seeds plant−1 (166%) was higher than for other parameters, which showed the effect of environmental factors on the genetic parameters. Besides, seed yield plant−1 had the lowest phenotypic variance because of genetic effects, which showed that this parameter was less affected by environmental factors than were other parameters. This means that seed yield plant−1 may display similar phenotypic expression under different environmental conditions. Additionally, individual heritability in broad sense (h2g) of all examined parameters was of a higher level (>82.2%), which showed that a large of phenotypic variation was caused by genetic factors. This case showed that these parameters could be selected for other generation. However, h2g of number of nodes at first flower (71.8%) was lower than that of other parameters (Table 7), which showed that environmental variation on this parameter might be dominant and genetic progress might be slower.
| Item | Plant biomass | Plant height | Number of pods plant−1 | Pod weight plant−1 | Number of seeds plant−1 | Seed yield plant−1 | Number of nodes at first flower | |
|---|---|---|---|---|---|---|---|---|
| 87.1 | 39.7 | 161.00 | 44.7 | 166.00 | 25.4 | 52.3 | ||
| 82.2 | 84.2 | 93.1 | 90.7 | 96.5 | 88.3 | 71.8 | ||
| h 2mg | 96.5 | 97.0 | 98.8 | 98.3 | 99.4 | 97.8 | 93.9 | |
| rⓖg | 98.2 | 98.5 | 99.4 | 99.2 | 99.7 | 98.9 | 96.9 | |
| CVg | 34.3 | 13.00 | 36.9 | 38.1 | 38.3 | 40.1 | 13.9 | |
| CVr | 16.0 | 5.85 | 10.1 | 12.2 | 7.33 | 14.5 | 8.6 | |
| CV (%) | 2.15 | 2.31 | 3.67 | 3.12 | 5.23 | 2.75 | 1.60 | |
| LRTg | ** | ** | ** | ** | ** | ** | ** |
, phenotypic variance; , individual heritability in broad sense; h2mg, heritability of genotypes means; rⓖg, accuracy; CVg, coefficient of genetic variation; CVr, residual variance; CV, coefficient of variance; LRTg, likelihood ratio test for genetic effect based on P-value.
Selection accuracy (rⓖg), in genetic improvement and selection studies, refers to the degree of accuracy of the estimates obtained using REML/BLUP with the actual genetic values. As the heritability increases, the accuracy value also increases, and a higher h2g value provides a more accurate estimate of genetic values. The selection accuracy was high (>96%) for all studied parameters (Table 7).
Selecting individuals with high accuracy values for the examined characteristics can contribute more to genetic progress. The highest accuracy was determined for plant biomass (98.2%) in G23 and G28, for plant height (98.5%) in G7, G3 and G28, for number of pods plant−1 (99.4%) in G3, G7 and G17, for pod weight plant−1 (99.2%) in G7, G15 and G23, for number of seeds plant−1 (99.7%) in G3, G17 and G23, for seed yield plant−1 (98.9%) in G15, G23 and G27, and for number of nodes at first flower (96.9%) in G5, G10 and G22 (Fig. 4).
Predicted genetic values, by BLUP, of chickpea genotypes for plant biomass (PB), plant height (PH), number of pods plant−1 (NPP), pod weight plant−1 (PWP), number of seeds plant−1 (NSP), seed yield plant−1 (SYP) and number of nodes at first flower (NFFN), for 29 chickpea genotypes. Genotype codes: G1, ILC-482; G2, Cagatay; G3, ILC3279; G4, Hisar; G5, Local desi; G6, Diyar95; G7, AK-71114; G8, Hisar × AK-71114; G9, Hisar × AK-71114; G10, AK-71114 × Hisar; G11, ILC 3279 × Hisar; G12, Hisar × ILC 3279; G13, Hisar × ILC 3279; G14, ILC 3279 × Cagatay; G15, ILC 3279 × Cagatay; G16, ILC 3279 × Cagatay; G17, ILC 3279 × Cagatay; G18, ILC 3279 × Cagatay; G19, AK-71114 × ILC 3279; G20, Cagatay × AK-71114; G21, AK-71114 × Local desi; G22, ILC 482 × Diyar95; G23, Hisar × Cagatay; G24, Hisar × Cagatay; G25, Hisar × Cagatay; G26, Cagatay × Hisar; G27, Cagatay × Hisar; G28, Cagatay × Hisar; and G29, Cagatay × Hisar.
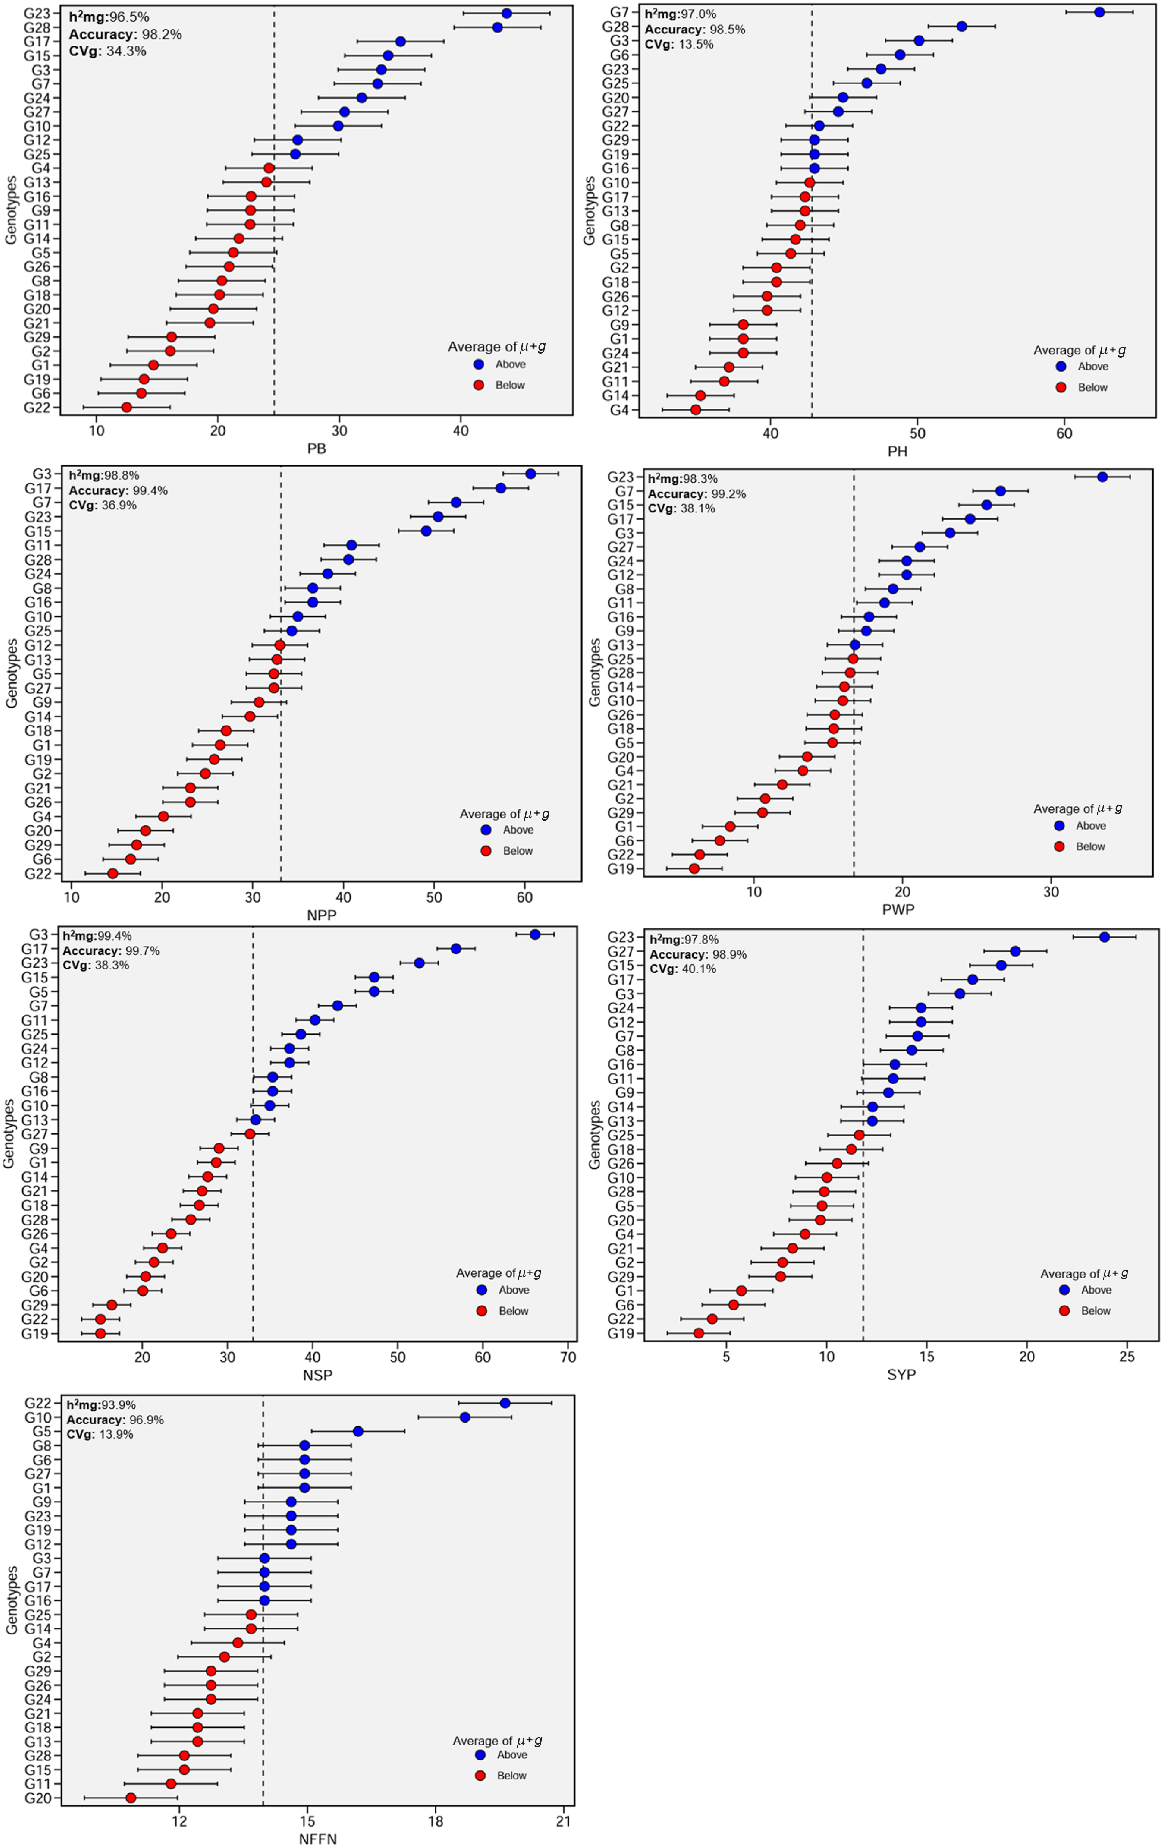
In our REML/BLUP model, the low CVr (residual variance) value for all features (below 10–20%) indicated that the explanatory power of the model was high. In contrast, medium CVr value of between 20% and 30% indicates that the unexplained variation in the model is slightly higher, but at an acceptable level, because there may be more error variance in phenotypic features.
However, a high CVr value (>30%) indicates that genetic and environmental effects cannot be sufficiently separated; therefore, the model is inadequate and the selected model should be reconsidered. In our study, the low CVr of all features showed that these features were stable and the selected model was correct and had high reliability (Fig. 4).
Coefficients of genetic variance (CVg) for plant biomass, plant height, number of pods plant−1, pod weight plant−1, number of seeds plant−1, seed yield plant−1 and number of nodes at first flower were 34.3%, 13.5%, 36.9%, 38.1%, 38.3%, 40.1% and 13.9% respectively. The highest CVg was recorded in seed yield plant−1 (40.1%), whereas the lowest value was recorded in plant height (13.5%) (Fig. 4).
The high h2mg (>93.9%) present in all traits will be more effective in genetic improvement of these features, because most of the phenotypic differences can be due to genetic differences (Fig. 3). There were positive genotypic effects for plant biomass in G3, G7, G10, G12, G15, G17, G23, G24, G25, G27 and G28 genotypes. In contrast, there were negative genotypic effects in G1, G2, G4, G5, G6, G8, G9, G11, G13, G14, G16, G18, G19, G20, G21, G22, G26 and G29 genotypes. Additionally, G23 and its reciprocal (G28) gave the highest predicted mean for plant biomass (43.8 and 43.0 g respectively). G22, G6, G19, G1, G2 and G29 exhibited a minimum estimated mean (Fig. 4).
There were positive genotypic effects for plant height in G7, G28, G3, G6, G23, G25, G20 and G27 genotypes. G22, G29, G19 and G16 had a plant height similar to the overall mean. There were negative genotypic effects in other genotypes. G7 (AK-71114) exhibited the highest predicted mean for plant height (62.4 cm). G4 (Hisar) and G14 (ILC 3279 × Cagatay) presented a minimum estimated mean, and there was no difference between these genotypes for the plant height (Fig. 4).
There were positive and high genotypic effects for number of pods plant−1 in G3, G17, G7, G23 and G15 genotypes, followed by G11 and G28 genotypes. G3 (ILC 3279: 60.7) and G17 (ILC 3279 × Cagatay: 57.4) presented the highest predicted mean for number of pods plant−1. The lowest negative genotypic effects were in G22 and G6 (Diyar 95) (Fig. 4).
There were positive and high genotypic effects for number of pods plant−1 in G23 (Hisar × Cagatay) genotypes, followed by G7 (AK-71114) genotypes. G23 (33.5 g) resented the highest predicted mean for number of pods plant−1. There were negative genotypic effects in 15 genotypes. The lowest negative genotypic effects were in G19 (AK-71114 × ILC 3279) and G22 (ILC 482 × Diyar 95) (Fig. 4).
There were positive and high genotypic effects for number of seeds plant−1 in G3 (ILC 3279) genotypes, followed by G17, G23, G15, G5, G7 and G11. G3 presented the highest predicted mean for seeds plant−1 (66.1). There were negative genotypic effects were in 17 genotypes. The lowest negative genotypic effects were in G19 (AK-71114 × ILC 3279 and G22 (ILC 482 × Diyar 95) (Fig. 4).
There were positive and high genotypic effects for seed yield plant−1 in G23 (Hisar × Cagatay) genotypes, followed by its reciprocal (G27). G23 presented the highest predicted mean for seed yield plant−1 (23.9 g). There were negative genotypic effects in 15 genotypes. The lowest negative genotypic effects were in G19 (AK-71114 × ILC 3279 and G22 (ILC 482 × Diyar 95) (Fig. 4).
There were positive and high genotypic effects for number of nodes at first flower plant−1 in G22 (ILC 482 × Diyar 95), followed by G10 (AK-71114 × Hisar) and G5 (Local desi) genotypes. G22 presented the highest predicted mean for number of nodes at first flower plant−1 (19.6). There were negative genotypic effects in 14 genotypes. The lowest negative genotypic effects were in G20 (Cagatay × AK-71114) (Fig. 4). Consequently, the genotypes G3, G7, G10, G17, G22, G23 and G28 showed high genetic potential on the basis of the BLUP method.
Principal component analysis
In the study, the genetic diversity among genotypes was determined by principal component analysis (PCA). PCA was performed for agro-morphological characters of chickpea genotypes (Table 8). Of seven PCs, only 2 presented an eigenvalue of >1.0. The seven characters tested in the study were low in two main components, which accounted for 78.8% of the phenotypic variation (Fig. 5). The PC1 accounted for 63.2% of total variation, followed by PC2 (15.6%) and PC3 (12.1%). PC1, PC2 and PC3 presented the highest contribution to total variability. However, PC1 exhibited maximum variability among all principal components. The characters associated with seed yield except for the number of nodes at first flower were to the right of PC1. G7, G3, G17, G15, G24, G11, G27, G28, G25, G16 and G12 showed high values for the examined all characters, except for number of nodes at first flower. G23 exhibited a great relationship to seed yield plant−1 (SYP).
| Principal component | Eigenvalue | Variance (%) | Cumulative variance (%) | |
|---|---|---|---|---|
| PC1 | 4.43 | 63.2 | 63.2 | |
| PC2 | 1.09 | 15.6 | 78.8 | |
| PC3 | 0.85 | 12.1 | 91.0 | |
| PC4 | 0.35 | 4.95 | 95.9 | |
| PC5 | 0.21 | 2.93 | 98.8 | |
| PC6 | 0.06 | 0.83 | 99.7 | |
| PC7 | 0.02 | 0.32 | 100 |
PCA for genotypes and genetic parameters. PB, plant biomass; PH, plant height; NPP, number of pods plant−1; PWP, pod weight plant−1; NSP, number of seeds plant−1; and NFFN, number of nodes at first flower for 29 chickpea genotypes. Genotype codes: G1, ILC-482; G2, Cagatay, G3, ILC3279; G4, Hisar; G5, Local desi; G6, Diyar95, G7, AK-71114; G8, Hisar × AK-71114; G9, Hisar × AK-71114; G10, AK-71114 × Hisar; G11, ILC 3279 × Hisar; G12, Hisar × ILC 3279; G13, Hisar × ILC 3279; G14, ILC 3279 × Cagatay; G15, ILC 3279 × Cagatay; G16, ILC 3279 × Cagatay; G17, ILC 3279 × Cagatay; G18, ILC 3279 × Cagatay; G19, AK-71114 × ILC 3279; G20, Cagatay × AK-71114; G21, AK-71114 × Local desi; G22, ILC 482 × Diyar95; G23, Hisar × Cagatay; G24, Hisar × Cagatay; G25, Hisar × Cagatay; G26, Cagatay × Hisar; G27, Cagatay × Hisar; G28, Cagatay × Hisar; and G29, Cagatay × Hisar.
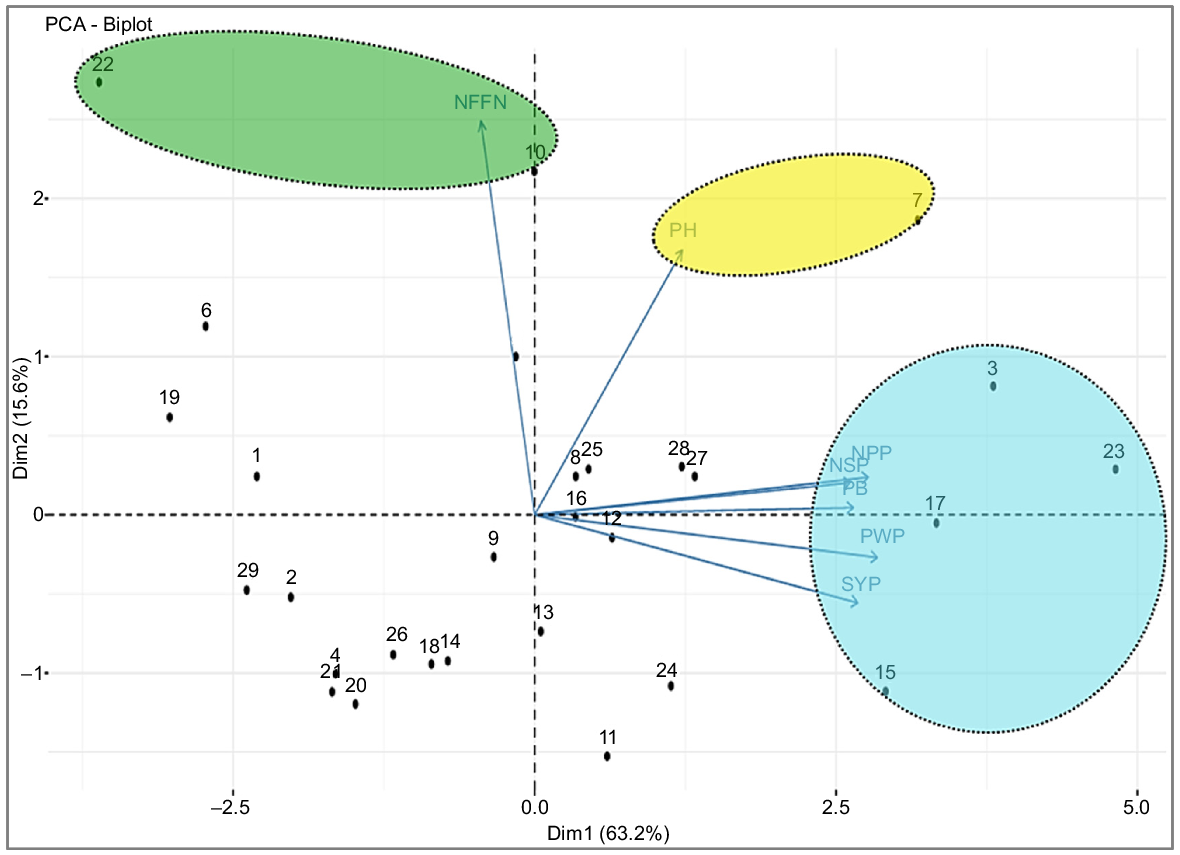
G15 showed a great relationship to seed yield plant−1 (SYP) and pod weight plant−1 (PWP). G17 showed a great relationship to number of pods plant−1 (NPP) and plant biomass (PB) and number of seeds plant−1 (NSP). G22 (ILC482 × Diyar95) showed a great relationship to number of nodes at first flower. Diyar 95 is a tall and late-maturing parent, whereas ILC 482 is an early maturing and medium plant-height parent. Because the number of nodes at first flower in their obtained crosses is related to earliness and lateness, it showed the characteristics of the ’male’ parent (Fig. 5).
Feature importance ranking in boruta–random forest
Feature importance ranking was determined by using boruta–random forest (Breiman 2001). The boruta feature selection was realized by using some algorithms that could extract important features. The boruta feature selection showed the order of feature importance (Table 9).
The mean, median, minimum and maximum important on seed yield plant−1 were the highest in pod weight plant−1 (17.68%, 17.70%, 14.80% and 19.43%). However, plant height showed negative results for mean (−1.47%), median (−1.35%), minimum (−3.13%) and maximum (−0.52%) important.
All examined features except for plant height were confirmed by boruta–random forest model. Pod weight plant−1, plant biomass, number of pods plant−1, number of seed plant−1 and number of nodes at first flower nodes were determined as the most effective features on target variable (seed yield plant−1) (Fig. 6).
Boruta feature selection for examined chickpea genotypes. PB, plant biomass; PH, plant height; NPP, number of pods plant−1; PWP, pod weight plant−1; NSP, number of seeds plant−1; and NFFN, number of nodes at first flower for 29 chickpea genotypes.
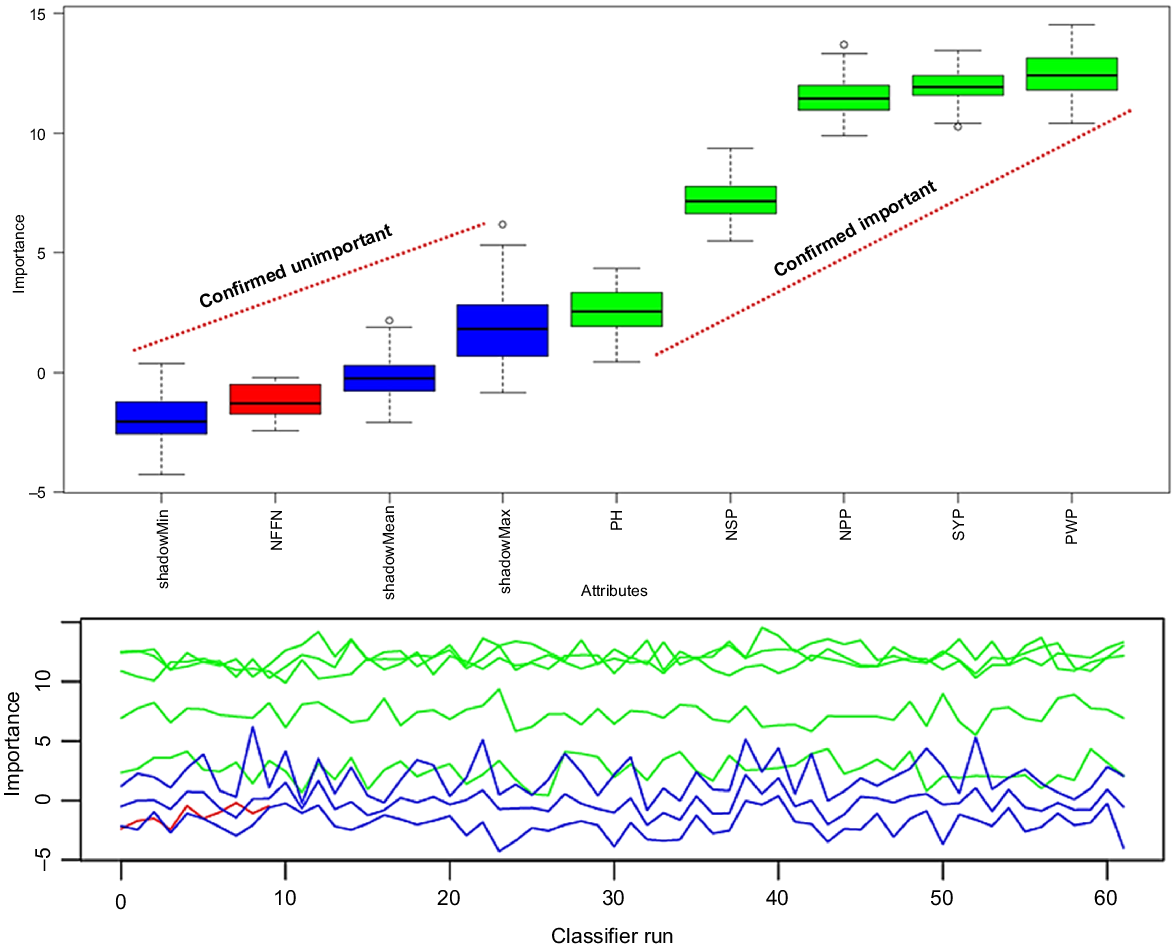
Features were ranged from 0 to 1 by boruta algorithm. The seven features were ranked by boruta analysis. The results showed that there were differences in the ranking of features by boruta feature selection. Plant biomass, number of nodes at first flower plant−1, number of pods plant−1, pod weight plant−1 and number of seeds plant−1 of chickpea genotypes were confirmed important on seed yield plant−1 (normhits value of >0.5), whereas plant height was rejected (normhits value of <0.5) (Table 9, Fig. 6). The performance of pod weight plant−1 was higher than plant biomass, number of pods plant−1, number of seeds plant−1 and number of first flower nodes.
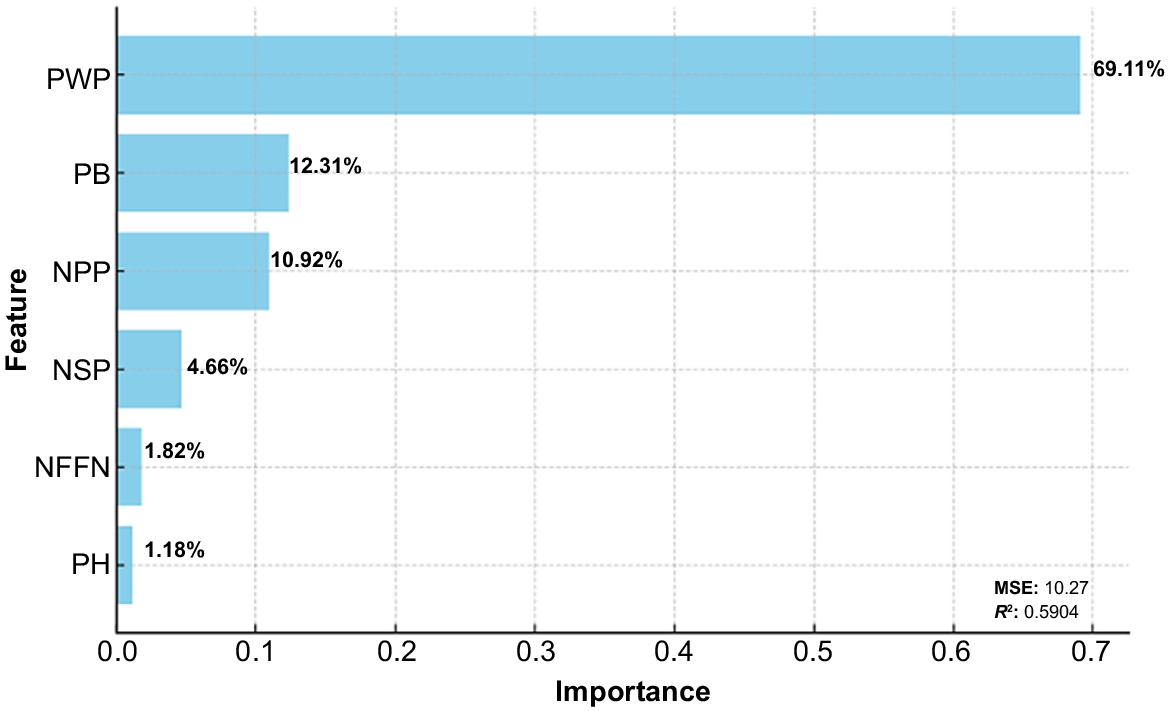
The superior features closely related to seed yield plant−1 were determined in chickpea genotypes. The highest contribution was in pod weight plant−1 (69.11%), followed by plant biomass (12.31%) and number of pods plant−1 (10.92) in boruta feature-selection model. The lowest contribution was in plant height (1.18%) (Fig. 7). As a result, plant height was not a selected feature for the tested chickpea genotypes. Therefore, features except for plant height should be tested in the future generations of studied chickpea genotypes. The superior features closely correlated with seed yield plant−1 were determined in chickpea genotypes.
In the FAI–BLUP analysis performed to determine the ideotype identified two factors. Factor 1 showed high genetic correlation with pod weight plant−1 and number of pods plant−1; in contrast, Factor 2 had correlation with the number of nodes at first flower plant−1 and plant height (Table 10). The selection genetic gain (SGperc) indicated the possibility of increase in all characters. The highest SGperc was recorded in pod weight plant−1 (47.7%), followed by plant height (47.5%) and the number of pods plant−1 (45.0%). The minimum SGperc was in seed yield plant−1. Generally, the examined genotypes had desirable properties in terms of genetic structure. The general variance (communality mean) was 79% of the genetic variability in the examined dataset. Uniquenesses of genotypes for examined characters was higher in plant height than other characters. Communality, which was the proportion of genotype variance explained by the factors, was highest in pod weight (94.00%), followed by number of pods plant−1 (89.00%) and seed yield plant−1 (86.00%) (Table 10). This indicated that the genotypes fitted well to factors in the model.
| Item | Factor I | Factor II | Communality | Uniquenesses | SGperc | |
|---|---|---|---|---|---|---|
| PB | −0.89 | −0.08 | 0.80 | 0.20 | 36.6 | |
| PH | −0.38 | −0.59 | 0.50 | 0.50 | 47.5 | |
| NPP | −0.93 | −0.14 | 0.89 | 0.11 | 45.0 | |
| PWP | −0.97 | 0.03 | 0.94 | 0.06 | 47.7 | |
| NSP | −0.88 | −0.13 | 0.79 | 0.21 | 34.3 | |
| NFFN | 0.21 | −0.83 | 0.74 | 0.26 | 16.2 | |
| SYP | −0.92 | 0.13 | 0.86 | 0.14 | 7.45 | |
| Communality mean: 0.79 | ||||||
| Selected examined parent and crosses: G7, G3, G10 and G23 Selected crosses: G23, G27 and G28 | ||||||
SGperc is selection gain percentage (%) uniquenesses and determines the extent to which individuals differ genetically or phenotypically from other individuals.
LRT, likelihood ratio test based on P-value.
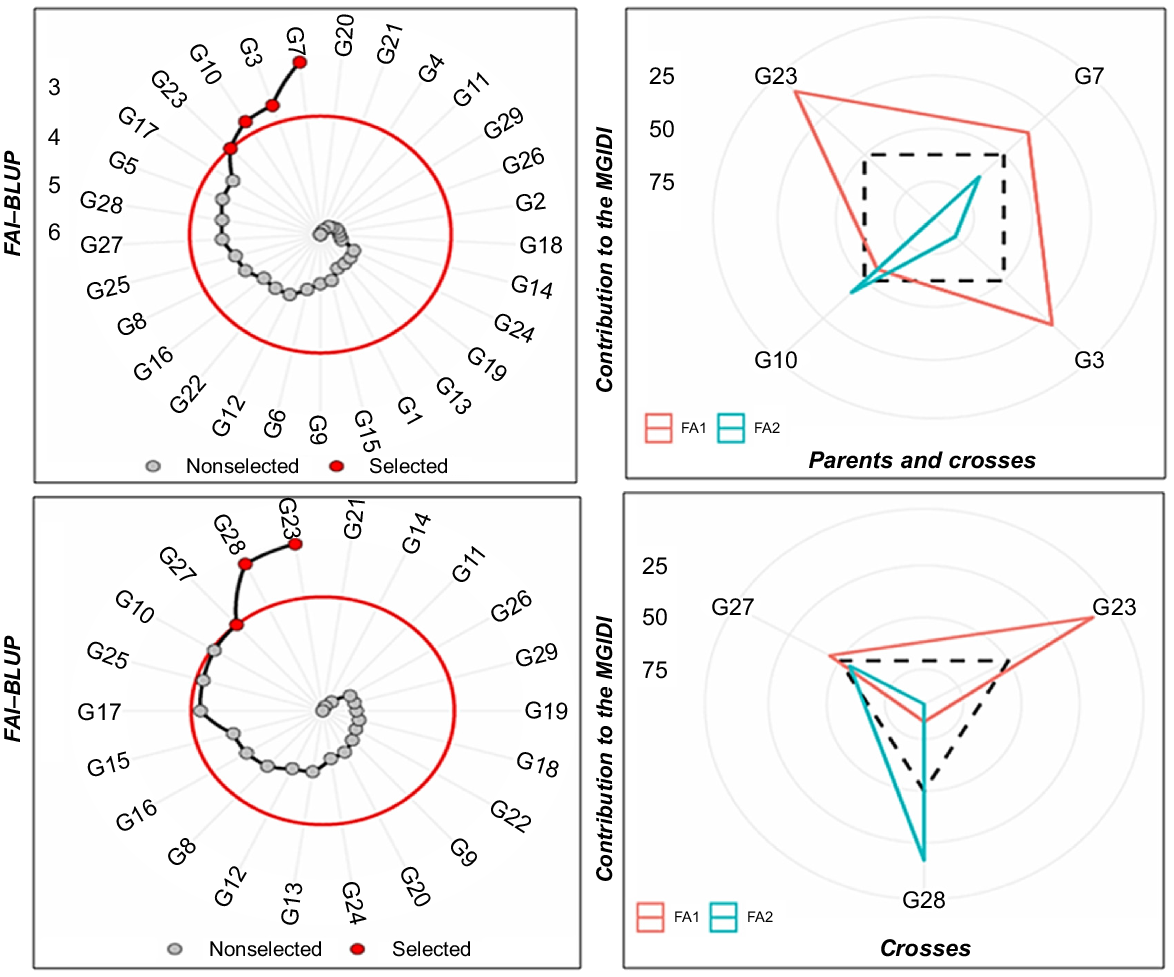
FAI–BLUP index determined genotypes with characters closest to the ideotype (Fig. 8). Fig. 8 shows the ranking of the 29 chickpea genotypes on the basis of the FAI–BLUP index. The four chickpea genotypes including G3, G7, G10 and G23, two of which were parents (G23 and G10), were selected by the FAI–BLUP index for examined characters. FAI–BLUP index showed that the highest performance was in G23 followed by G10, G3 and G7. In individual performance of crosses, FAI–BLUP index selected G23 (Hisar × Cagatay) and its reciprocal (G27 and G28) crosses. G27 and G28 showed similar and high performance. However, G10, G17 and G25 were also near to the selection strength in circle. The other genotypes, which were located in the red circle, were not selected for multiple traits (Fig. 8). Genotypes located outside the red circle showed high performance for multiple traits; therefore, these genotypes should be selected as multi-trait and high-performance genetic material in breeding programs.
Multi-trait genotype–ideotype distance index (MGIDI) and strength–weakness view of parents and crosses. Genotype codes: G1, ILC-482; G2, Cagatay, G3, ILC3279; G4, Hisar; G5, Local desi; G6, Diyar95, G7, AK-71114; G8, Hisar × AK-71114; G9, Hisar × AK-71114; G10, AK-71114 × Hisar; G11, ILC 3279 × Hisar; G12, Hisar × ILC 3279; G13, Hisar × ILC 3279; G14, ILC 3279 × Cagatay; G15, ILC 3279 × Cagatay; G16, ILC 3279 × Cagatay; G17, ILC 3279 × Cagatay; G18, ILC 3279 × Cagatay; G19, AK-71114 × ILC 3279; G20, Cagatay × AK-71114; G21, AK-71114 × Local desi; G22, ILC 482 × Diyar95; G23, Hisar × Cagatay; G24, Hisar × Cagatay; G25, Hisar × Cagatay; G26, Cagatay × Hisar; G27, Cagatay × Hisar; G28, Cagatay × Hisar; and G29, Cagatay × Hisar.
Cluster analysis
The ward cluster analysis based on Euclidean distance matrix, constellation plot and scatterplot matrix grouped 29 chickpea genotypes into three clusters of 13 (Cluster I), 10 (Cluster II) and six (Cluster III) genotypes. Cluster I was the largest cluster of 13 chickpea genotypes (G1, G2, G4, G6, G9, G14, G18, G1, G20, G21, G22, G26 and G29), followed by Cluster II (G5, G8, G10, G11, G16, G12, G13, G24, G25 and G27). Cluster III was latest cluster including G3, G7, G15, G17, G23 and G28 (Table 11, Fig. 9). Cluster I was marked by having the highest cluster means for plant height (40.49 cm), followed by number of pods plant−1 (22.74) and number of seeds plant−1 (22.51) (Table 11).
| Cluster | Percentage (%) | Counted genotypes | PB | PH | NPP | PWP | NSP | SYP | NFFN | |
|---|---|---|---|---|---|---|---|---|---|---|
| I | 44.82 | G1, G2, G4, G6, G9, G14, G18, G19, G20, G21, G22, G26 and G29 | 17.90 | 40.49 | 22.74 | 11.69 | 22.51 | 8.27 | 13.85 | |
| II | 34.49 | G5, G8,G10, G11,G16, G12, G13, G24, G25 and G27 | 25.65 | 41.70 | 35.23 | 18.27 | 37.27 | 13.39 | 14.43 | |
| III | 20.69 | G3, G7, G15, G17, G23 and G28 | 37.53 | 49.72 | 52.00 | 25.14 | 48.67 | 16.94 | 13.44 | |
| R2 | 0.77 | 0.77 | 0.38 | 0.85 | 0.67 | 0.68 | 0.54 |
R2 showed portion of total variation in each column absorbed by clustering. Genotype codes: G1, ILC-482; G2, Cagatay, G3, ILC3279; G4, Hisar; G5, Local desi; G6, Diyar95, G7, AK-71114; G8, Hisar × AK-71114; G9, Hisar × AK-71114; G10, AK-71114 × Hisar; G11, ILC 3279 × Hisar; G12, Hisar × ILC 3279; G13, Hisar × ILC 3279; G14, ILC 3279 × Cagatay; G15, ILC 3279 × Cagatay; G16, ILC 3279 × Cagatay; G17, ILC 3279 × Cagatay; G18, ILC 3279 × Cagatay; G19, AK-71114 × ILC 3279; G20, Cagatay × AK-71114; G21, AK-71114 × Local desi; G22, ILC 482 × Diyar95; G23, Hisar × Cagatay; G24, Hisar × Cagatay; G25, Hisar × Cagatay; G26, Cagatay × Hisar; G27, Cagatay × Hisar; G28, Cagatay × Hisar; and G29, Cagatay × Hisar.
PB, plant biomass; PH, plant height; NPP, number of pods plant−1; PWP, pod weight plant−1; NSP, number of seeds plant−1; SYP, seed yield plant−1; NFFN, number of nodes at first flower, for 29 chickpea genotypes.
Hierarchical cluster dendrogram obtained from Euclidean distance using Ward method. Numbers show genotype codes. Scatterplot shows the relationship among characters, and constellation plot shows the distance between genotypes. PB, plant biomass; PH, plant height; NPP, number of pods plant−1; PWP, pod weight plant−1; NSP, number of seeds plant−1; NFFN, number of nodes at first flower, for 29 chickpea genotypes.
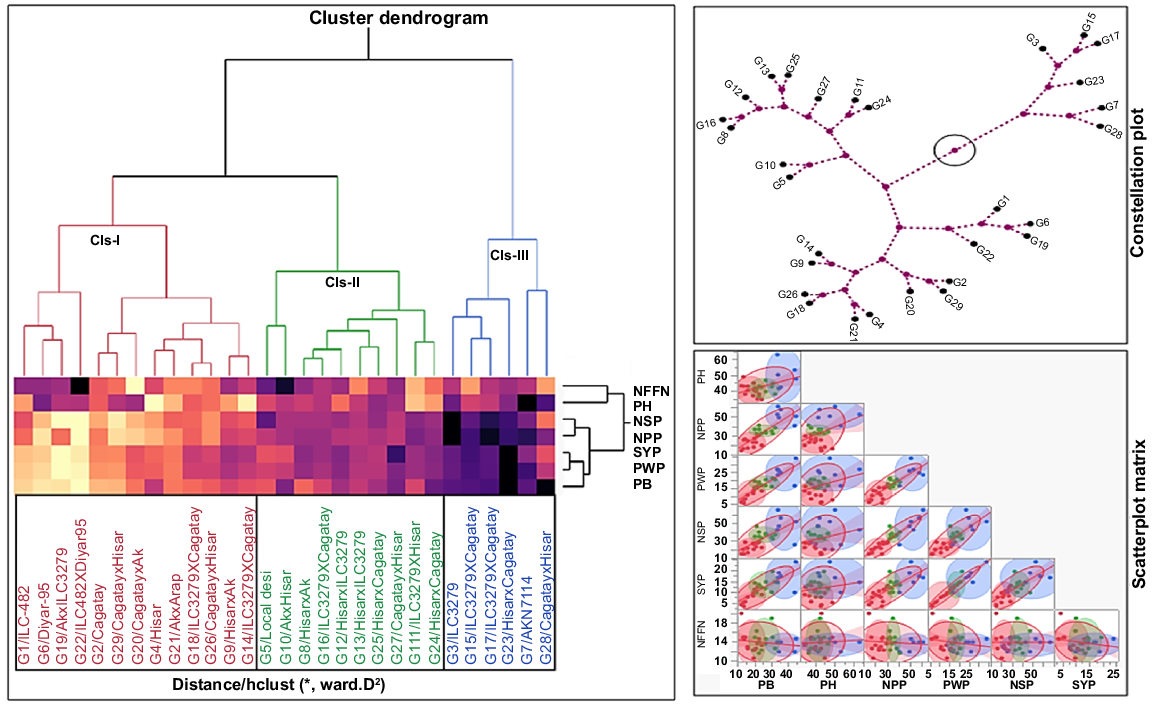
Dendrogram, constellation plot and scatterplot matrix showed that the maximum Euclidean distance was in Cluster III. G3, G7, G15, G17, G23 and G28 genotypes located in Cluster III were the most diverse for examined characters. Chickpea genotypes in Cluster II (G5, G8, G10, G11G12, G13, G16, G24, G25 and G27) also showed high similarity (Fig. 9).
The lowest cluster mean was in seed yield plant−1 (8.27 g). Similarly, Cluster II showed the highest mean for plant height (41.70 cm), whereas the lowest mean was for seed yield plant−1 (13.39 g). Cluster III showed the highest mean for the number of pods plant−1 (52.00), in contrast to number of nodes at first flower, which had the lowest mean (13.44). According to the performance of regression models (R2), pod weight plant−1 (R2 = 0.85), plant biomass (R2 = 0.77) and plant height (R2 = 0.77) from dependent variables constituted the majority of the total variance. Number of pods plant−1 showed the lowest variation (R2 = 0.38) in total variance (Table 11). These results showed that it is possible to improve genotypes from different clusters through crossing.
According to the constellation plot, genotypes that showed strong relationships with each other in each cluster are marked with black dots at the ends of the dashed lines. In the heat map, which shows the similarity between characters and genotypes in the cluster, dark colors indicate that the genotypes in the same cluster have high similarity for the characters. G22 located in Cluster I showed the highest similarity with G1, G6 and G19 for the number of nodes at first flower nodes plant−1. Similarly, G5 and G10 located in Cluster II showed a high similarity for this character.
Genotypes located in Cluster III showed a high similarity for all characters except for the number of nodes at first flower nodes plant−1. G7 and G8 showed a high similarity for plant height and plant biomass. G23 showed a high similarity with G3, G15 and G17 for seed yield plant−1, pod weight plant−1 and plant biomass. G17 showed high similarity with G15 for the number of pods plant−1, and G3 showed high similarity with G15 for the number of seeds plant−1 and number of pods plant−1 (Fig. 9).
In the scatterplot matrix in Fig. 9, characters that have a strong relationship with each other show regular distribution (colored dots) on the solid red line (regression line). Additionally, it was observed that as the relationship between features increased, the circles narrowed. The irregular distribution on this line and the enlargement of the circle indicate that the relationship strength was decreasing. In both the heat map and the scatterplot matrix, a strong relationship was seen between the number of seeds plant−1 and number of pods plant−1 and seed yield plant−1, pod weight plant−1 and plant biomass (Fig. 9).
Discussion
Genetic variability of a feature in plant breeding studies has a significant effect on yield and yield-related features. Therefore, yield can be increased by selecting features that contribute to heritability and have a strong relationship with yield. Feature selection is significant for obtaining desired combination of features in future generations of genetic material and for deciding improvement in future breeding procedure. In the present study, to infer the defining power of the examined genotypes and features, genetic values were derived from phenotypic-based BLUP estimates. Prediction of genetic parameters such as Ve, Vg, Vp, ECV, GCV, PCV, HBS, GA and GAM, genotypic and phenotypic path coefficient of features, REML/BLUP analysis, PCA, FAI–BLUP multi-trait selection, boruta + feature selection and cluster analysis were performed. ANOVA showed that there was a highly significant variation among genotypes for all examined agro-morphological characters (Table 3). This case can support the scope for selecting superior and desired genotypes for chickpea breeders. Although the value of PCV for all characters was higher than the GCV, the differences were generally small (Table 4). It showed a lower influence of environment on the characters.
Genotypes can be further improved by selection because of a wide variation in genetic base (Patel et al. 2021). Genetic advance (GA) and GAM ranged from 3.05% to 21.86% in the number of nodes at first flower, to 25.38–76.89% in the number of seeds plant−1 respectively (Table 4). It is suggested that these traits were minimally influenced by environmental factors, and significant improvement could be achieved through direct selection, because they are primarily controlled by additive genes. Heritability estimates ranged from 65% for the number of nodes at first flower, to 96% for the number of seeds plant−1. Because the heritability of these characters was greater than 60%, according to classification of Robinson et al. (1949), they had high heritability. The observed variation was primarily controlled by genetic factors, with a minimal influence from the environment, suggesting potential progress through selection. However, high broad-sense heritability alone does not necessarily ensure a strong prediction of genetic gain for effective improvement. Instead, effective selection is better supported by the combination of high heritability, alongside elevated estimates of GCV and GAM (Geneti et al. 2022). Determining the relationships among features at genotypic (rg) and phenotypic (rp) level can facilitate plant breeders to decide on an action of a suitable breeding strategy. Seed yield plant−1 showed a positive and strongly significant genotypic and phenotypic correlation with pod weight. The number of pods plant−1 showed a positive and highly significant genotypic and phenotypic correlation with pod weight, number of seeds plant−1 and seed yield plant−1 (Table 5).
Because seed yield is a complex and polygenic trait in chickpea breeding, it is highly advantageous to use indirect selection criteria with high genetic correlation with it, rather than direct seed yield. Seed yield of legume crops is mostly affected by the number of pods per plant, the number of seeds per pod and biomass yield (Mesfin et al. 2023). Chickpea production provides significant yield advantages, especially under environmental conditions where traits such as the number of pods plant−1 and biomass yield are well expressed by influencing seed number and yield (Singh et al. 2021; Prasanthi et al. 2024). The number of pods plant−1, a trait controlled by additive genetic effects, has a high heritability and can be used as a powerful tool in phenotypic selection because this trait is less affected by the environment and indicates a high yield potential (Parida et al. 2018). Plant biomass is vital for increasing yield, by enhancing photosynthetic production capacity. However, many environmental factors such as temperature, water stress, and nutrient deficiencies can significantly affect pod set, crop production and final yield (Gurumurthy et al. 2024). The positive and significant genotypic and phenotypic correlation of seed yield plant−1 with other yield-related features was noted by Tutlani et al. (2023). The direct and indirect effect of yield-related features on seed yield plant−1 is critical in selection of high-yielding superior genotypes, and the direct selection for yield-related features can improve the single plant yield (Agrawal et al. 2018). Genotypic and phenotypic path coefficient showed that the highest direct effects on seed yield plant−1 were supported by pod weight plant−1; almost all characters had positive indirect effects on seed yield via pod weight plant−1 (Table 6). The findings were similar to the findings reported by other researchers (Agrawal et al. 2018; Manikanteswara et al. 2018; Singh et al. 2021).
Prediction of genetic values by REML/BLUPs method is significant for plant breeders, because this method assumes actual values in predicting individually genetic potential of genetic material (Cortes et al. 2019). In our REML/BLUP model, seed yield plant−1 showed the lowest owing to genetic effects (Table 7), which indicated that this parameter was less affected by environmental factors than were other parameters (Paulan and Pupin 2019). In contrast to our findings on related value of seed yield, Karimizadeh et al. (2023) reported that value was 71.74% for studied chickpea genotypes.
In the present study, the high h2mg (>93.9%) in all features would be more effective in genetic improvement (Table 7). Actually, a high h2mg can indicate high phenotypic differences owing to genetic differences. Hussain et al. (2021) obtained similar findings, with the h2mg value being similar to our findings for seed yield plant−1; however, h2mg value of the number of pods plant−1 was lower than our findings. The selection accuracy (rⓖg) increased for all studied parameters, and the highest accuracy was obtained from plant biomass, pod weight plant−1, number of seeds plant−1 and seed yield plant−1 in G23 (Hisar × Cagatay) cross.
In the results of PCA, G23 also exhibited a great relationship to seed yield plant−1 (SYP) (Fig. 4). Similarly, in a recent study, Mascarenhas et al. (2024) stated that the REML/BLUP showed that the section accuracy was rⓖg ≥ 70, and highlighted a strong correlation between the actual and predicted genotypic values. Vigneshwari et al. (2025) reported that REML/BLUP analysis can provide successful selection accuracy between actual and estimated values; therefore, selection accuracy can be a significant tool for defining the superior genetic material. Additionally, the highest coefficients of genetic variance (CVg) were recorded in seed yield plant−1, whereas the lowest CVg was recorded in plant height (Table 7). In contrast, Hussain et al. (2021) reported a lower CVg value than our findings. High CVg can be advantageous when searching for superior genetic constitutions, because this genetic parameter measures the extent of genetic variation for genotype selection. High variation is related to high retraction effects on predicted means for features; this case inferred that genotypes that had a high CVg could possess desirable alleles for seed yield plant−1. The low CVr (residual variance) value for all features (below 10–20%) indicated that there were favorable alleles for plant yield (Meier et al. 2021) and the predicted values in the model were closer to the actual values.
In our study, the estimation of genetic values with many models such as BLUP, FAI–BLUP and PCA also offered significant advantages, as has been indicated also by other researchers (Woyann et al. 2020; Ambrósio et al. 2024; Yorulmaz et al. 2025). The highest Z-score was recorded for pod weight plant−1, plant biomass, number of pods plant−1, number of seeds plant−1 and number of nodes at first flower (Fig. 6), and estimation accuracy (R2) was restricted to 59.04% for seed yield plant−1 according to random forest (Fig. 7). Rajković et al. (2022) used random-forest ensemble models for prediction of yield and yield-related features and that the predicted accuracy was 0.95%. Higher predicted accuracy reported than our findings could have been caused by the small size of the dataset, interactions among the features, and the accurate reflection of these interactions in the model.
In the FAI–BLUP analysis, the maximum selection genetic gain was recorded in pod weight plant−1, and the four chickpea genotypes (G3, G7, G10 and G23) were selected by the FAI–BLUP index for examined characters (Table 10, Fig. 8). Thus, these genotypes should be selected to improve for the multi-traits next generations. Similarly, some researchers have noted that the FAI–BLUP index provides perfect multi-trait selection to plant breeders (Olivoto et al. 2019; Ambrósio et al. 2024; Amrate et al. 2025).
Ward’s dendrogram of clustering depended on Euclidean distance constructs that the genotypes with higher intra-group and inter-group intervals show higher genetic variability than do those with lower intervals (Janghel et al. 2020). Accordingly, G3, G7, G15, G17, G23, and G28 genotypes located in Cluster III had genetically higher diversity than did other genotypes located in Cluster I and Cluster II (Fig. 9). Thus, selection of these genotypes located in Cluster III may be more advantageous in future breeding program. Some researchers have also stated that Ward’s cluster methods could be useful in genetic improvement program (Kaur and Prasad 2023; Mahmood et al. 2024; Praween et al. 2024).
The limited sample size of 29 F4 chickpea genotypes used in this study may be considered a constraint, because it could reduce the statistical power and increase the risk of overfitting, particularly when applying complex machine learning algorithms. Previous studies have emphasized that small sample sizes are more prone to overfitting, which may compromise the generalizability of the models (Hawkins 2004). Overfitting occurs when a model achieves high accuracy on training data but fails to maintain its performance on independent datasets. To minimize this risk, we employed a boruta–random forest framework. The boruta algorithm helps mitigate overfitting by identifying only statistically relevant and biologically meaningful features, whereas random forest, as an ensemble-based resampling method, provides more balanced and generalizable predictions, even with small datasets. Furthermore, a five-fold cross-validation scheme was implemented, with an explicit training–testing split, to ensure robust model evaluation.
As highlighted in the literature, cross-validation and bootstrap-based approaches are recommended for studies with limited sample sizes, because they enhance the reliability and stability of model performance (Ying 2019). Therefore, although the present study was constrained by a relatively small number of genotypes, the careful modeling strategy adopted herein strengthens the reliability of the results. Nevertheless, expanding the genotype panel in future studies would further increase the statistical power of the models and improve the generalizability of the findings across diverse environmental conditions.
Conclusions
In the present study, the highly significant variation among genotypes for all examined agro-morphological features showed that the presence of wide variability, which supports the scope for selecting superior and desired genotypes for chickpea breeders. REML/BLUP, PC and FAI–BLUP analyses identified that G23 (Hisar × Cagatay) had high genetic potential owing to a high seed yield plant−1, with performnce being close to that of the parents; therefore, this cross should be evaluated in future generations. In boruta feature selection, pod weight closely related with seed yield plant−1 was determined in chickpea genotypes. Cluster analysis illustrated that G3 (Parent/ILC3279), G7 (Parent/AK-71114), G15 (ILC 3279 × Cagatay), G17 (ILC3279 × Cagatay), G23 (Hisar × Cagatay), and G28 (Cagatay × Hisar) crosses located in Cluster III had genetically higher diversity; therefore, these genotypes could be selected for chickpea breeding programs for future generations. Finally, the results showed that the use of mixed analysis models such as REML/BLUP, FAI–BLUP, PCA, boruta–random forest and clustering could be performed successfully for the selection of chickpea genotypes in F4 generation. Althoughthe models employed in the present study yielded successful results, the fact that the study was conducted in a single planting season and at a single location limits the stability of the selected genotypes, particularly the genetic value estimates and trait rankings. Consequently, the genotypes employed in this investigation will be evaluated in multi-location and multi-year trials to substantiate the findings in the future. This limitation is to be overcome by integrating genotypic data alongside phenotypic data.
Declaration of funding
The authors declare that no funds, grants, or other support were received during the preparation of this paper.
References
Agrawal T, Kumar A, Kumar S, Kumar A, Kumar RR, Kumar S, Singh PK (2018) Correlation and path coefficient analysis for grain yield and yield components in chickpea (Cicer arietinum L.) under normal and late sown conditions of Bihar, India. International Journal of Current Microbiology and Applied Sciences (IJCMAS) 7, 1633-1642.
| Crossref | Google Scholar |
Ahmed AAM, Deo RC, Ghahramani A, Raj N, Feng Q, Yin Z, Yang L (2021) LSTM integrated with Boruta-random forest optimiser for soil moisture estimation under RCP4.5 and RCP8.5 global warming scenarios. Stochastic Environmental Research and Risk Assessment 35, 1851-1881.
| Crossref | Google Scholar |
Ambrósio M, Daher RF, Santos RM, Santana JGS, Vidal AKF, Nascimento MR, et al. (2024) Multi-trait index: selection and recommendation of superior black bean genotypes as new improved varieties. BMC Plant Biology 24, 525.
| Crossref | Google Scholar |
Amrate PK, Nataraj V, Shivakumar M, Shrivastava MK, Rajput LS, Mohare S, et al. (2025) Best linear unbiased prediction (BLUP)-based models aided in selection of high yielding charcoal rot and yellow mosaic resistant soybean genotypes. Genetic Resources and Crop Evolution 72, 5593-5611.
| Crossref | Google Scholar |
Breiman L (2001) Random forests. Machine Learning 45, 5-32.
| Crossref | Google Scholar |
Cortes DFM, Santa-Catarina R, Vettorazzi JCF, Ramos HCCR, Viana AP, Pereira MG (2019) Development of superior lines of papaya from the Formosa group using the pedigree method and REML/Blup procedure. Bragantia 78, 350-360.
| Crossref | Google Scholar |
Dehbaoui NE, Gentzbittel L, Drevon JJ, Lazali M (2024) Diversity analyses of chickpea (Cicer arietinum L.) through agro-morphological traits. Plant Genetic Resources: Characterization and Utilization 22, 1-7.
| Crossref | Google Scholar |
Dempster AP, Laird NM, Rubin DB (1977) Maximum likelihood from incomplete data via the EM algorithm. Journal of the Royal Statistical Society: Series B (Methodological) 39, 1-22.
| Crossref | Google Scholar |
Dewey DR, Lu KH (1959) A correlation and path-coefficient analysis of components of crested wheatgrass seed production. Agronomy Journal 51, 515-518.
| Crossref | Google Scholar |
FAOSTAT (2023) Crops and livestock products. Available at https://www.fao.org/faostat/en/#data/QCL [accessed 10 October 2024]
Geneti GS, Kebede SA, Mekonnen TB (2022) Genetic variability and association of traits in bread wheat (Triticum aestivum L.) genotypes in Gechi district, South West Ethiopia. Advances in Agriculture 2022, 7132424.
| Crossref | Google Scholar |
Ghavidel S, Pour-Aboughadareh A, Mostafavi K (2024) Identification of drought-tolerant genotypes of barley (Hordeum vulgare L.) based on selection indices. CSRAR 5, 671-687.
| Crossref | Google Scholar |
Gurumurthy S, Ashu A, Kruthika S, Solanke AP, Basavaraja T, Soren KR, et al. (2024) An innovative natural speed breeding technique for accelerated chickpea (Cicer arietinum L.) generation turnover. Plant Methods 20, 177.
| Crossref | Google Scholar |
Hawkins DM (2004) The problem of overfitting. Journal of Chemical Information and Computer Sciences 44, 1-12.
| Crossref | Google Scholar | PubMed |
Hussain T, Akram Z, Shabbir G, Manaf A, Ahmed M (2021) Identification of drought tolerant chickpea genotypes through multi trait stability index. Saudi Journal of Biological Sciences 28, 6818-6828.
| Crossref | Google Scholar |
Ipekesen S, Basdemir F, Tunc M, Bicer BT (2022) Minerals, vitamins, protein and amino acids in wild Cicer species and pure line chickpea genotypes selected from a local population. Journal of Elementology 27, 27-140.
| Crossref | Google Scholar |
Jain AK, Mao J, Mohiuddin KM (1996) Artificial neural networks: a tutorial. Computer 29, 31-44.
| Crossref | Google Scholar |
Jakhar DS (2014) Genetic diversity studies in chickpea (Cicer arietinum l.). Bangladesh Journal of Botany 45, 459-464.
| Google Scholar |
Janghel DK, Kumar K, Sunil R, Chhabra AK (2020) Genetic diversity analysis, characterization and evaluation of elite chickpea (Cicer arietinum L.) genotypes. International Journal of Current Microbiology and Applied Sciences 9, 199-209.
| Crossref | Google Scholar |
Jayalakshmi V, Reddy AL, Devi SR, Imran MM (2022) Genetic diversity study through K-Means clustering in germplasm accessions of chickpea (Cicer arietinum L.). Electronic Journal of Plant Breeding 13, 1402-1407.
| Crossref | Google Scholar |
Joshi P, Yasin M, Sundaram P (2018) Genetic variability, heritability and genetic advance study for seed yield and yield component traits in a chickpea recombinant inbred line (RIL) population. International Journal of Pure & Applied Bioscience 6, 136-141.
| Crossref | Google Scholar |
Karimizadeh R, Pezeshkpour P, Mirzaee A, Barzali M, Sharifi P, Khoshkhoy Nilash EA, et al. (2023) Identification of stable chickpeas under dryland conditions by mixed models. Legume Science 5, e206.
| Crossref | Google Scholar |
Kassambara A, Mundt F (2017) Factoextra: extract and visualize the results of multivariate data analyses: R package version 1.0.5.999. Available at http://www.sthda.com/english/rpkgs/factoextra [accessed 13 January 2024]
Kaur R, Prasad K (2023) Characterization and classification of selective Indian chickpea cultivars based on physical and hydration properties, using image and multivariate analysis. Legume Science 5, e168.
| Crossref | Google Scholar |
Mahmood MT, Hussain K, Amin A, Batool A, Aziz A, Kaukab S, et al. (2024) Genetic variability assessment among elite chickpea (Cicer arientinum) genotypes under water deficit conditions. PEJMLS 7, 31-38.
| Crossref | Google Scholar |
Manikanteswara O, Lavanya GR, Ranganatha YH, Chandu MMS (2018) Estimation of genetic variability, correlation and path analysis for seed yield characters in chickpea (Cicer arietinum L.). International Journal of Current Microbiology and Applied Sciences 7, 843-849.
| Crossref | Google Scholar |
Mascarenhas SNAdP, Almeida ÍFd, Almeida RVd, Pinto BRC, Fernandes GA (2024) Prediction of genotypic values via REML/BLUP and path analysis in maize half-sib families. Revista Caderno Pedagógico 21, e11165.
| Crossref | Google Scholar |
Meier C, Marchioro VS, Meira D, Olivoto T, Klein LA (2021) Genetic parameters and multiple-trait selection in wheat genotypes. Pesquisa Agropecuária Tropical 51, e67996.
| Crossref | Google Scholar |
Mesfin S, Gebresamuel G, Haile M, Zenebe A (2023) Potentials of legume rotation on yield and nitrogen uptake of subsequent wheat crop in northern Ethiopia. Heliyon 9, e16126.
| Crossref | Google Scholar |
Nakazawa M (2018) Fmsb: functions for medical statistics book with some demographic data. Available at https://cran.r-project.org/package/fmsb [accessed 25 December 2024]
Naveen A, Singh SP, Singhal T, Reddy S, Bhargavi HA, Yadav S, et al. (2025) Delineation of selection efficiency and coincidence of multi-trait-based models in a global germplasm collection of pearl millet for a comprehensive assessment of stability and high performing genotypes. Genetic Resources and Crop Evolution 72, 4843-4859.
| Crossref | Google Scholar |
Olivoto T, Nardino M (2020) MGIDI: toward an effective multivariate selection in biological experiments. Bioinformatics 37, 1383-1389.
| Crossref | Google Scholar |
Olivoto T, Lúcio ADC, da Silva JAG, Sari BG, Diel MI (2019) Mean performance and stability in multi-environment trials II: selection based on multiple traits. Agronomy Journal 111, 2961-2969.
| Crossref | Google Scholar |
Parida G, Saghfi S, Eivazi A, Akbarzadeh A (2018) Study of genetic advance and broad-sense heritability for grain yield and yield components of chickpea (Cicer arietinum L.) genotypes. Advances in Biology & Earth Sciences 3, 5-12.
| Google Scholar |
Patel RRS, Sharma D, Das BK, Mondal S, Sahu PK, Vishwakarma G, et al. (2021) Study of coefficient of variation (GCV & PCV), heritability and genetic advance in advanced generation mutant line of rice (Oryza sativa L.). The Pharma Innovation Journal 10, 784-787.
| Crossref | Google Scholar |
Paulan SDC, Pupin S (2019) ‘Genética e Melhoramento de Plantas e Animais.’ (Editora e Distribuidora Educacional: Londrina, Brazil) doi:10.22533/at.ed.192191710 [accessed 11 December 2024] (In Spanish)
Prasanthi G, Jayalakshmi V, Reddy AT, Khayumahammed S (2024) Genetic variability parameters and character association studies among phenological traits, yield traits and quality traits under different dates of planting in chickpea (Cicer arietinum L.). Journal of Food Legumes 36, 126-135.
| Crossref | Google Scholar |
Praween N, Kumar Y, Sikarwar RS, Basu PS, Bharadwaj C, Mondal B, Dixit GP (2024) Genetic analysis of chickpea (Cicer arietinum L.) genotypes for seed yield under changing cropping environments. Journal of Food Legumes 37, 373-382.
| Crossref | Google Scholar |
Qulmamatova DE (2023) Chickpea (Cicer arietinum L.) genotypes evaluation for high yield through multivariate analysis. SABRAO Journal of Breeding and Genetics 55, 107-114.
| Crossref | Google Scholar |
Rajković D, Marjanović Jeromela A, Pezo L, Lončar B, Zanetti F, Monti A, Kondić Špika A (2022) Yield and quality prediction of winter rapeseed: artificial neural network and random forest models. Agronomy 12, 58.
| Crossref | Google Scholar |
Resende MDVd, Duarte JB (2007) Precisão e controle de qualidade em experimentos de avaliação de cultivares. Pesquisa Agropecuária Tropical 37, 182-194 [In Spanish].
| Google Scholar |
Resende MDV, Silva FF, Azevedo CF (2014) Estatística matemática, biométrica e computacional: modelos mistos, multivariados, categóricos e generalizados (REML/BLUP), inferência bayesiana, regressão aleatória, seleção genômica, qtl-gwas, estatística espacial e temporal, competição, sobrevivência. Editora UFV, Viçosa, MG, Brazil. [in Portuguese]
Robinson HF, Comstock RE, Harvey PH (1949) Estimates of heritability and the degree of dominance in corn. Agronomy Journal 41, 353-359.
| Crossref | Google Scholar |
Rocha JRDASDC, Machado JC, Carneıro PCS (2018) Multitrait index based on factor analysis and ideotype-design: proposal and application on elephant grass breeding for bioenergy. GCB Bioenergy 10, 52-60.
| Crossref | Google Scholar |
Singh B, Kumar V, Mishra SP (2021) Genetic variability, path analysis and relationship among quantitative traits in chickpea (Cicer arietinum L.) genotypes. The Pharma Innovation Journal 10, 1564-1568.
| Google Scholar |
Strobl C, Boulesteix A-L, Kneib T, Augustin T, Zeileis A (2008) Conditional variable importance for random forests. BMC Bioinformatics 9, 307.
| Crossref | Google Scholar |
Subramanian M, Sivasubramanian P (1975) X-ray-induced fused perianth in Ricinus communis (L). Radiation Botany 15, 307-308.
| Crossref | Google Scholar |
Tunc M, Rufaioglu SB, Ipekesen S, Yakar M, Yorulmaz L, Bicer BT (2025) Evaluation of the possibility of using fuzzy C-means clustering, AMMI analysis and GGE biplot methods to predict the yield of chickpea genotypes cultivated in different environments. Agronomy 15, 300.
| Crossref | Google Scholar |
Tutlani A, Kumar R, Banshidhar , Kumari S, Chouhan S (2023) Correlation and path analysis for yield and its phenological, physiological, morphological and biochemical traits under salinity stress in chickpea (Cicer arietinum L.). IJBSM 14, 878-890.
| Crossref | Google Scholar |
Vigneshwari R, Shanthi RM, Pathy TL, Mohanraj K (2025) Estimates of genetic parameters and prediction of breeding values among full-sib sugarcane families for commercial cane sugar yield traits through REML/BLUP analysis. Sugar Tech 27, 67-77.
| Crossref | Google Scholar |
Ward JH, Jr (1963) Hierarchical grouping to optimize an objective function. Journal of the American Statistical Association 58, 236-244.
| Crossref | Google Scholar |
Woyann LG, Meira D, Matei G, Zdziarski AD, Dallacorte LV, Madella LA, Benin G (2020) Selection indexes based on linear–bilinear models applied to soybean breeding. Agronomy Journal 112, 175-182.
| Crossref | Google Scholar |
Xposit team (2025) RStudio: Integrated Development Environment for R. Posit Software, PBC, Boston, MA, USA. Available at http://www.posit.co/
Ying X (2019) An overview of overfitting and its solutions. Journal of Physics: Conference Series 1168, 022022.
| Crossref | Google Scholar |
Yorulmaz L, Ipekesen S, Oner M, Akinci C, Bicer BT (2025) Screening of drought-tolerant level of some wheat cultivars (Triticum durum Desf.) under water stress. Journal of Animal & Plant Sciences 35, 197-208.
| Crossref | Google Scholar |
Zali H, Pour-Aboughadareh A, Gholipour A, Kohkan S, Barati A, Jabari M, et al. (2023) Selection of barley superior promising lines using selection indexes of multi-trait. SAPS 33, 1-16.
| Crossref | Google Scholar |