

Improving operational efficiency through condition-based monitoring and Internet of Things (IoT) technologies
Mohamed Ibrahim A * , Michael Clark A and Will Castelnau A *A

Mohamed Ibrahim Hafez Mohamed, PhD, holds a Doctorate in Petroleum Engineering and is skilled in data science and machine learning (ML) with extensive experience in delivering innovative solutions to optimise and solve operational challenges to improve profitability and corporate reputation. His specialty is resolving complex problems through resolutions that integrate new technologies, innovation and strategic actions that are aligned with organisations’ goals and priorities. Mohamed thrives to grow relationships through feedback rich culture and formalise cross BUs engagements, and has the ability to present to executive levels and field operations. Currently Mohamed is the Data Science and Advanced Analytics Manager at Woodside Energy Ltd. |

Michael Clark holds an MSc in Petroleum Geoscience from Victoria University (Wellington) and a BSc (Hons) in Physics from the University of Canterbury. He is a ML specialist with extensive experience applying AI techniques to solve complex problems across the energy, mining, and healthcare sectors. His technical focus spans deep learning, time series forecasting, reinforcement learning, and applied computer vision. He contributes actively to the open-source community, develops educational resources for ML practitioners in the resource sector, and is a long-standing member of the Perth machine learning scene. Michael’s research interests center on safe AI, particularly alignment and reinforcement learning systems in real-world environments. |

Will Castelnau holds a Master’s in Applied Physics with a major in instrumentation. With extensive experience across defence, security, and oil and gas sectors, his career is marked by his adeptness at growing and maturing novel technologies through to adoption. Mr Castelnau has over 25 years’ experience in delivering complex software engineering solutions that facilitate data analysis, particularly in machine learning and computer vision systems. At Woodside, he has utilised his multidisciplinary background in electronics, mechanical, and software engineering to address and solve complex business problems through the application of advanced sensing technologies. |
Abstract
Woodside Burrup Pty Ltd (‘Woodside’) has operated the world-class Pluto liquefied natural gas (LNG) plants safely and reliably since 2012. This complex facility employs numerous heat exchangers to cool and liquefy natural gas. The heat transfer process is facilitated by large fin fans forcing ambient air through heat exchangers containing rows of hot finned tubes. Fin fans are crucial for the efficacy of this thermodynamic cycle. Hence, minimising their downtime and maintaining them is vital for achieving high production. Woodside developed low-resolution and low-cost wireless Internet of Things (IoT) vibration sensors coupled with advanced analytics techniques, to reduce maintenance costs and increase production efficiency. Data from the sensors, mounted on the rolling elements of fans and motors, detect performance changes and diagnose potential failures, reducing the need for human inspection. IoT technology has been instrumental in facilitating frequent and continuous data collection, enabling predictive maintenance. Shifting from reactive to proactive maintenance yields several benefits, primarily reducing operational costs and enhancing safety standards. This research highlights the successful implementation of minimum covariance determinant model and median absolute deviation for threshold setting to identify abnormal vibrations, with post-processing steps to manage alarm frequency. We demonstrate that the combination of low-cost sensing and high-density data coupled with our novel approach produces high accuracy by correlating real faults. This innovative exploitation of IoT presents profound possibilities to elevate operational efficiency through the strategic use of timeseries data, optimal anomaly detection, reducing potential failures and optimising maintenance. The insights are visualised through an interactive analytics platform, facilitating informed decision-making and enhancing operational effectiveness.
Keywords: condition based monitoring, data analytics, energy efficiency, IoT, low cost sensors, LNG, personal safety, predictive failure.
Introduction
Traditionally, industrial plants like Woodside’s Pluto liquefied natural gas (LNG) facility have relied on fixed physical industrial Internet of Things (IoT) sensors, integrated into the plant’s Operational Technology (OT) Distributed Control System (DCS), to monitor industrial processes. For example, over 200,000 sensors alone are embedded at Woodside’s Pluto plant collecting data behind a pane of glass platform called Fuse (Burgin and Wallace 2023; Biegel et al. 2024). While conventional fixed sensors allow for comprehensive data collection, their implementation in the context of an LNG production facility is often costly and challenging, and require consideration regarding the need for safe power, wiring and communications in potentially explosive atmospheres.
Advancements in low-cost electronics hardware, material fabrication and ubiquitous connectivity networks of sensors have been employed widely across the industry, enabling real-time situation awareness, most knowingly for autonomous driving and equipment monitoring. By leveraging this trend and the innovations in sensing components over the past decades, Woodside has recently developed its own low-cost wireless battery powered sensor platforms that are safe for installation in explosive atmospheres (IECEx compliance). Woodside’s sensor platform is built on the Long Range (LoRa) wireless communication protocol, which can pierce through complex industrial environments, thus allowing instrumentation of hard-to-reach equipment. Coupled with an ultra-low-power hardware architecture, these IoT sensors have an expected service life of up to 10 years.
We demonstrate that an end-to-end solution comprising of low-cost IoT vibration sensors and smart algorithms to detect anomalies has the potential to replace manual routine inspections. With the advantages of prompt or even early warning failure alerts, equipment maintenance planning can be optimised and unexpected damage or loss of production mitigated.
IoT sensors
The IoT sensors devices deployed on the fin fan banks to monitor vibration anomalies are composed of one base unit and four vibration sensor probes connected to the base unit. As shown in Fig. 1a, both the base unit (white) and external vibration probes (blue) are easily mounted to capture equipment vibration and temperature through built-in magnetic attachments.
(a) IoT device platform with four external sensor probes. (b) Sub-optimal placement of vibration probes within a cooling package (motor accessible but fin fan inaccessible behind support metal beam and protective cage).
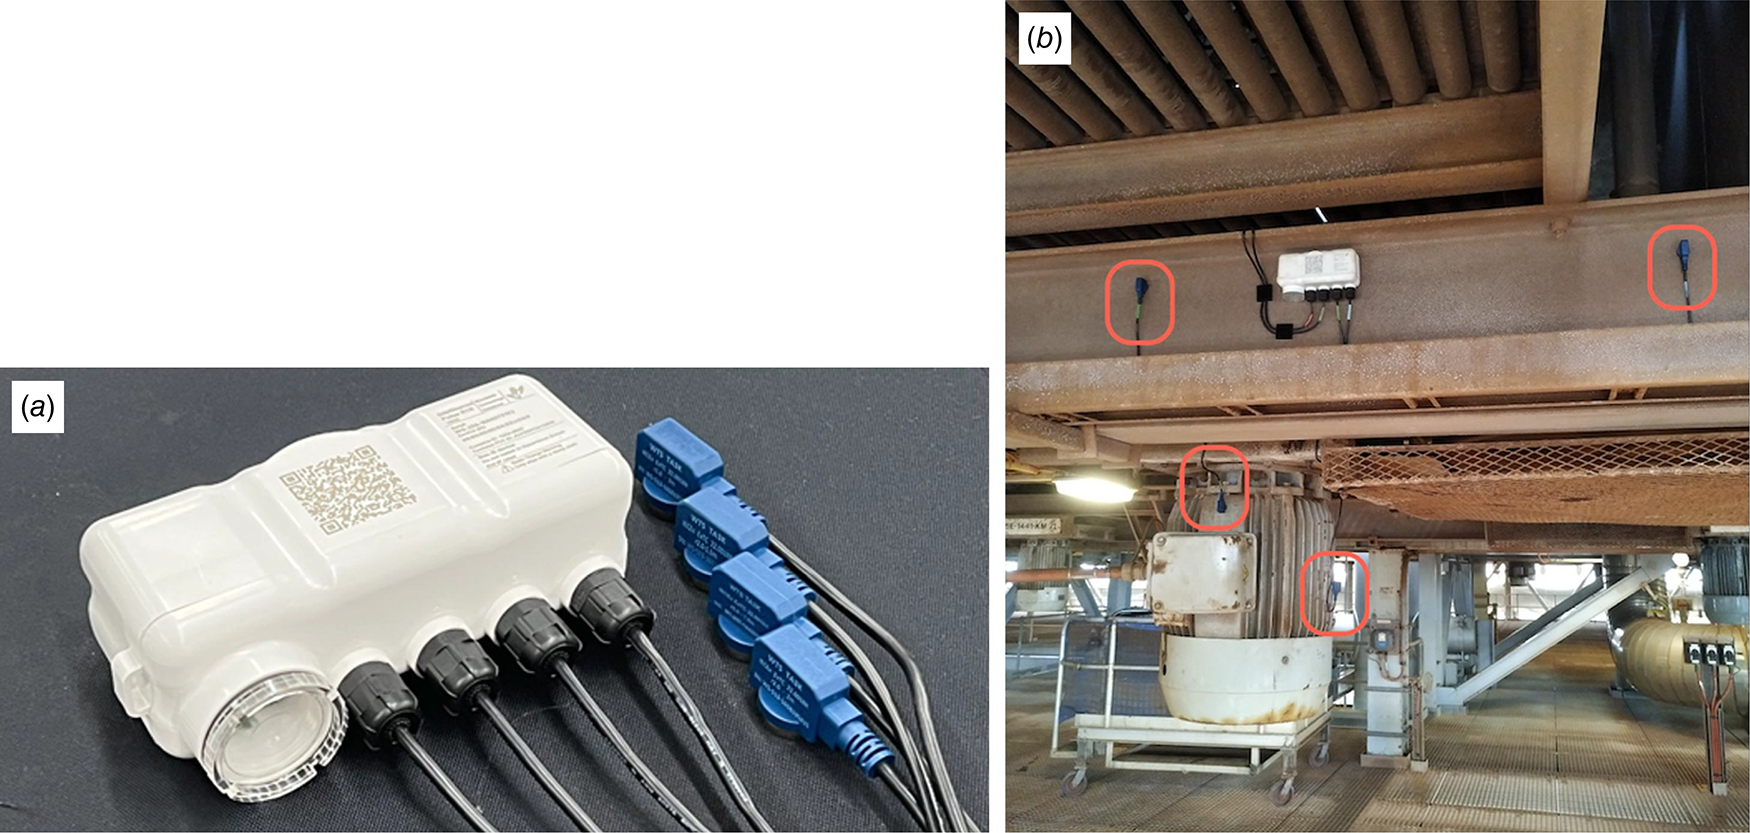
A base unit is equipped with long-life batteries and ultra-low-power electronics, including a signal processing chip to perform payload calculations and transmit data via a LoRa network. Depending on needs, data transmission frequency is configurable to balance battery life and data volume. The sensor probes are equipped with accelerometers featuring a bandwidth of 3.2 kHz, providing sufficient capability to detect fan anomalies while being more cost-effective than higher-frequency sensors.
Sensor placement
The objective is to continuously monitor the condition of the bearings and rotating gear on fin fans, thereby enabling the detection of faults, imbalances and even belt failures. To achieve this, the placement and mechanical coupling of the sensor relative to the bearing monitored is critical, as the further away the sensor is placed, the lower the quality of the recorded signal. Ideally, sensors should be positioned directly on the external bearing casing to accurately detect the condition of its rolling elements and to minimise noise from surrounding structures and adjacent fans, thus allowing for a comprehensive frequency analysis. However, direct access to these placements on fin fan packages is often challenging and impractical due to cost and safety concerns during and post installation.
Consequently, we opted to install sensors at the nearest accessible locations, which are often supporting beams in proximity to the rotating element. This represents a deliberate trade-off between the cost and ease of installation versus compensating for suboptimal sensor placement by employing more sophisticated, self-adapting anomaly detection algorithms (Fig. 1b). These also closely match the measurement positions used during manual inspection routines with a hand-held accelerometer. Transferring raw vibration data is bandwidth intensive and detrimental to battery life; feature extraction is essential to not only reduce the size of the data transmissions and yet still convey sufficient information for upstream cloud processing and anomaly detection. To illustrate this principle, we demonstrate the efficacy of the following pipeline:
Time Domain Vibration Capture: this is the first step where vibration is collected in the time domain using a mems-based accelerometer.
Frequency Domain Transform: the captured time-domain signals are transformed into the frequency domain (e.g. using Fast Fourier Transform (FFT) and spectral analysis techniques).
Filtering: in this step, the frequency data undergoes filtering to remove noise or irrelevant frequency components.
Feature Extraction: relevant features such as peak frequencies, spectral energy and statistical moments (mean, variance, etc.) are extracted from the filtered data. These features are important for further analysis.
Transmit Features to Cloud: the extracted features are then transmitted to a cloud-based platform for storage, analysis and visualisation.
Conceptually, a feature is primarily computed by integrating the spectral energy within specific frequency bands, by segmenting spectral data relative to the revolutions per minute of the machine. Thus, an imbalance fault generates high energy in the feature band overlapping with the primary frequency generated by the rotation of the machine, whilst inner or outer bearing race defects generate energy in higher order feature bands.
Data processing
Feature data is stored and indexed by cloud services, allowing for fast retrieval by caching and segmentation based non time ranges for pipeline processing. Data preprocessing is then a crucial phase to ensure data hygiene by reducing noise as much as possible prior to anomaly detection. First, data is normalised based on quantiles. This is done by centring data to the median and component wise scale according to the interquartile range, which mitigates the influence of outliers. Next, noise tagging is performed to identify points below the noise floor based on the operational state of the machine (on/off states). Data from all sensors is processed concurrently to preserve temporal alignment and granularity to ensure cleanliness and readiness for modelling. Finally, event-based anomaly labelling is performed, for use as input to model training and evaluation.
Anomaly detection models and post processing
The anomaly detection model is based on the minimum covariance determinant (MCD) algorithm, chosen for its simplicity and effectiveness in identifying anomalies in multidimensional/multivariant time series data. MCD is a popular method for anomaly detection, it calculates the Mahalanobis distance between a data point and a multi-dimensional cluster of prior samples represented by their means and covariance matrix. To mitigate the effect of outliers to the sample means and covariances, MCD only uses the subset from the samples that has the smallest variance–covariance matrix determinant to represent the sample means and covariances.
The model calculates the anomaly scores (i.e. distances) of any new data point to the data samples collected over the last 2 days. A threshold, derived using the PyThresh library (https://pythresh.readthedocs.io/en/stable/), maps these scores to pseudo-probabilities through a log-sigmoid transformation. This ensures that the threshold corresponds to a probability of 0.5, making scores interpretable. Feature-level anomaly contributions are computed by decomposing the score into per-feature components, providing granular insights into which features contribute most to anomalies. Postprocessing refines these scores into actionable alarms by aggregating them across time windows, suppressing duplicates. This approach mimics real-world deployment by ensuring scores and alarms depend only on historical data.
The integration of human-labelled fault data and feedback from condition-based monitoring (CBM) technicians ensures continuous improvement of the labelling process, anomaly definitions, and overall performance. The iterative deployment has demonstrated success in detecting anomalies early and providing actionable insights, highlighting the utility of IoT data in proactive fault detection.
The current implementation operates on a per-sensor basis, but the architecture supports transitioning to a unified model that learns across all sensors, leveraging global patterns.
Model results
As an entirely unsupervised method, we evaluated the entire dataset and used the Area Under ROC Curve, which represents the probability that the model, if given a randomly chosen positive and negative example, will rank the positive higher than the negative. We achieved an Area Under Curve (AUC) of 0.88, which is significantly better than random chance. As we deploy this solution there will be the further opportunities to refine and apply standard post-processing which would drastically cut down on the number of repeated false positives due to fan maintenance and other conditions not labelled in the dataset. Fig. 2 shows that, for an example of seven operational fans, there will be one true positive and one false positive for operators to review each month, which is considered acceptable. Table 1 shows the confusion matrix, which is a table used to measure the performance for machine learning classification problem.

Conclusion
This project demonstrated the successful integration of low-cost IoT sensors with advanced anomaly detection models to optimise real-time monitoring of fin fans. By leveraging robust preprocessing techniques and the MCD model, the system effectively identified faults promptly, minimising downtime and maintenance costs while improving safety and reliability. Key innovations include dynamic noise filtering, robust scaling and causal inference for real-time deployment. The framework developed has proven effective in detecting anomalies, offering actionable insights and enhancing operational efficiency.
References
Biegel G, Bower N, Castelnau W (2024) The Fuse Platform: Integrating data from IoT and other Sensors into an Industrial Spatial Digital Twin. The International Archives of the Photogrammetry, Remote Sensing and Spatial Information Sciences 48, 79-84.
| Crossref | Google Scholar |
Burgin L, Wallace L (2023) Sense, Insight, Action – Woodside’s Intelligent Asset Journey. The APPEA Journal 63, S159-S163.
| Crossref | Google Scholar |
Mohamed Ibrahim Hafez Mohamed, PhD, holds a Doctorate in Petroleum Engineering and is skilled in data science and machine learning (ML) with extensive experience in delivering innovative solutions to optimise and solve operational challenges to improve profitability and corporate reputation. His specialty is resolving complex problems through resolutions that integrate new technologies, innovation and strategic actions that are aligned with organisations’ goals and priorities. Mohamed thrives to grow relationships through feedback rich culture and formalise cross BUs engagements, and has the ability to present to executive levels and field operations. Currently Mohamed is the Data Science and Advanced Analytics Manager at Woodside Energy Ltd. |
Michael Clark holds an MSc in Petroleum Geoscience from Victoria University (Wellington) and a BSc (Hons) in Physics from the University of Canterbury. He is a ML specialist with extensive experience applying AI techniques to solve complex problems across the energy, mining, and healthcare sectors. His technical focus spans deep learning, time series forecasting, reinforcement learning, and applied computer vision. He contributes actively to the open-source community, develops educational resources for ML practitioners in the resource sector, and is a long-standing member of the Perth machine learning scene. Michael’s research interests center on safe AI, particularly alignment and reinforcement learning systems in real-world environments. |
Will Castelnau holds a Master’s in Applied Physics with a major in instrumentation. With extensive experience across defence, security, and oil and gas sectors, his career is marked by his adeptness at growing and maturing novel technologies through to adoption. Mr Castelnau has over 25 years’ experience in delivering complex software engineering solutions that facilitate data analysis, particularly in machine learning and computer vision systems. At Woodside, he has utilised his multidisciplinary background in electronics, mechanical, and software engineering to address and solve complex business problems through the application of advanced sensing technologies. |