

Applying petrophysics and rock property modelling to enhance play-based assessments of the geological storage potential for carbon dioxide: western Eromanga Basin case study
Barry E. Bradshaw A * , Tom Bernecker A , Mavise Beattie B , Jeremy Iwanec C , Ray Spicer D , David Lund E and Ryan Owens AA
B
C
D
E

Barry Bradshaw is a Geoscientist with 33 years of experience undertaking regional geological and geophysical studies and play-based resource assessments for hydrocarbon resources and geological storage projects. Barry is currently employed as the Energy Resources and Advice Activity Leader at Geoscience Australia, and he has previously worked as a Principal Geologist at CGSS consultants, a Senior Research Scientist at the Australian Geological Survey Organisation/Geoscience Australia, and a Research Scientist at Texas A&M University (USA). Barry graduated from the University of Sydney in 1988 and completed a PhD in Earth Sciences at the University of Waikato (New Zealand) in 1991. |

Thomas (Tom) Bernecker is a Geoscientist who holds an MSc from the University of Aachen, Germany, and a PhD from La Trobe University, Melbourne. His early geological work involved the development of models for siliciclastic and carbonate depositional systems in northwestern Europe and in Australia. After a lectureship at the University of Melbourne, Tom joined the Victorian Department of Natural Resources and Energy where his work focused on the hydrocarbon prospectivity of the Gippsland and Otway basins. Tom joined Geoscience Australia in 2007 and is currently the Director of Energy Resources Advice and Promotion. |

Mavise Beattie is a seasoned Geoscientist with over 20 years of global experience in the oil and gas industry, holding a PhD from the University of Wollongong. Her career began with Shell as a Sedimentologist/Reservoir Geologist, and she has since worked with prominent companies like Oil Search, INPEX, KUFPEC, Drillsearch Energy, Santos, Geoscience Australia and, currently, ADZ Energy. Mavise has contributed to significant projects across various regions, including Borneo (Malaysia), Papua New Guinea (PNG), Australia, the Philippines and Alaska. Her expertise spans reservoir modelling, field development, well planning, resource and reserves assessment, assurance, project management and team leadership. |

Jeremy Iwanec is a Geoscientist with 21 years of petroleum industry experience. He completed a BSc (Honours) in Applied Geology from the University of New South Wales in 2002 before joining Oil Search Limited in 2003. At Oil Search, he worked on various projects across PNG, Yemen and Kurdistan, specialising in play-based exploration, 2D and 3D seismic interpretation, structural and stratigraphic modelling, well planning and delivery, and resource assessments. In 2021, Jeremy joined Geoscience Australia where he conducted studies of sediment-hosted energy resources through geological modelling and play-based mapping. In 2024, Jeremy began working with the NSW Department of Climate Change, Energy, the Environment and Water, focusing on long-duration energy storage technologies. |

Ray Spicer gained his qualifications from the National Centre for Petroleum Geology and Geophysics and the University of Adelaide. His experience has been gained in all aspects of petrophysics, including new ventures, exploration, appraisal, development and abandonment. As well as working within the majority of both onshore and offshore Australian basins he has also worked on, or had exposure to, basins in PNG, New Zealand, the Middle East and North Africa, Southeast Asia and the Former Soviet Union. |

David Lund is a Development Geologist with over 25 years of petroleum industry experience. He joined Horizon in 2023, working the company's China and Australian assets. Prior to joining Horizon, David was a Geological Advisor with Oil Search, working extensively on the PNG oil and gas fields, and as an Energy Resources Assessment Geoscientist with Geoscience Australia. |

Ryan Owens is an Energy Resources Geoscientist in the Energy Resources and Advice team at Geoscience Australia. He graduated from the Australian National University (ANU) in 2007 with a BSc in Geology (Honours). Subsequently, he worked in mineral exploration before undertaking further studies in paleoceanography at the Research School of Earth Sciences, ANU. Ryan joined Geoscience Australia in 2014 through the graduate program and has contributed to a variety of projects, including the northern Houtman Sub-basin prospectivity study, the Geological and Bioregional Assessment Program and Offshore Acreage Releases. |
Abstract
Identifying basin areas that are prospective for the geological storage of carbon dioxide (GSC) is essential to support Australia’s transition to a net-zero emissions energy future. Geoscience Australia has developed a play-based common risk segment (CRS) mapping approach to evaluate GSC prospectivity based on four geological risk elements: (1) injectivity, (2) storage effectiveness, (3) containment and (4) structural complexity. Various geological criteria are used to evaluate these risk elements using post-drill data/analysis, gross depositional environment (GDE) maps, rock property maps, and depth structure and isochore maps. Rock property maps form an essential component in defining the CRSs for GSC prospectivity maps. This paper provides a case study from Geoscience Australia’s assessment of the GSC potential for the western Eromanga Basin (WEB). Rock property maps are constructed in the Petrel Software Platform (©SLB). Inputs for these models include a 3D structural model incorporating 14 play intervals, GDE maps and sub-surface rock properties derived from petrophysical analyses of wireline log data (such as volume of clay/shale, total and effective porosity, Timur-Coates permeability and apparent water salinity). Key outputs from the geological model include permeability thickness (used to assess injectivity), effective porosity (used together with depth structure maps to assess storage effectiveness), and net seal thickness (used to assess containment). Results from the CRS mapping show the WEB has potential to support industrial-scale (>1 mtpa) GSC projects using migration assisted storage in structurally simple areas where there is favourable stacking of effective reservoirs overlain by impermeable seals.
Keywords: common risk segment maps, effective porosity, geological model, geological storage of carbon dioxide, permeability thickness, petrophysics, play-based assessments, rock property maps.
Introduction
Carbon capture and storage (CCS) is a mature technology that prevents the release of carbon dioxide (CO2) to the atmosphere from stationary anthropogenic sources. It can also be used to remove historic CO2 emissions directly from the atmosphere through direct air capture and storage (IEA 2022a, 2022b). The scientific consensus is that achieving net-zero emissions by 2050 will be extremely challenging without a significant global scale up of CCS (IPCC 2022).
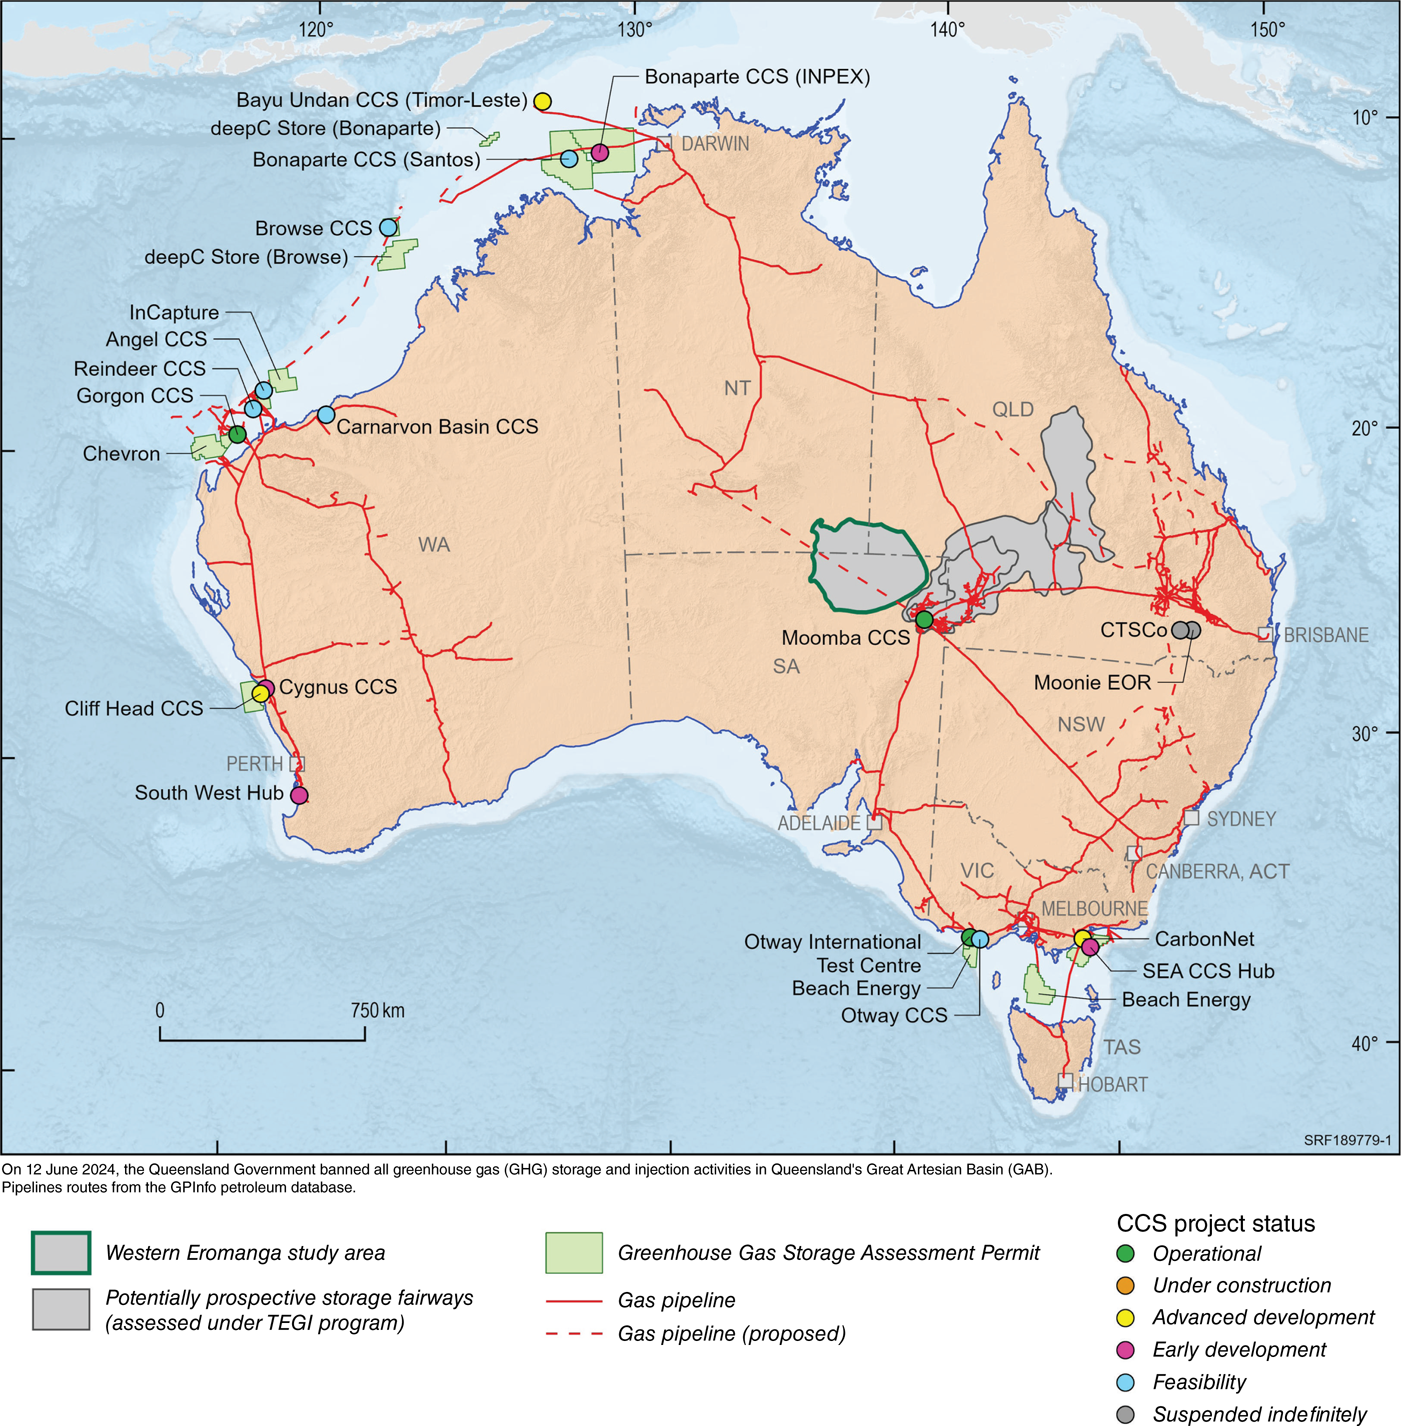
Australia has legislated targets to reduce its emissions to 43% below 2005 levels by 2030 and achieve net-zero by 2050 (DISR 2024). The Commonwealth Government’s Safeguard Mechanism provides an incentive to increase the exploration and development of CCS projects to abate CO2 emissions. O’Brien et al. (2024) estimated that achieving these national targets will likely require 20–40 CCS projects, each storing approximately 4 mtpa. Australia currently has two operating commercial-scale CCS projects: (1) the Gorgon CCS facility and (2) the Moomba CCS project. Several other commercial-scale projects are at various stages of development (Fig. 1). Additional CCS opportunities need to be identified in Australia to meet net-zero targets by 2050.
Location of potentially prospective geological storage of carbon dioxide fairways as assessed by Geoscience Australia’s western Eromanga Basin study and Trusted Environmental and Geological Information (TEGI) Program between 2021 and 2024. Also shown is the status of CCS projects in Australia and locations of offshore Greenhouse Gas Storage Assessment permits (as of December 2024). Note that the Queensland Government has since banned all greenhouse gas storage and injection activities in the Great Artesian Basin, including the Eromanga Basin. EOR, enhanced oil recovery; SEA CCS, South East Australia Carbon Capture and Storage; CTSCo, Carbon Transport and Storage Corporation.
Over the past 25 years, several regional screening studies have been undertaken in Australia with a common aim to develop a portfolio of basin areas that have the potential to support future CCS projects (Bradshaw et al. 2002, 2009; Gibson-Poole et al. 2006; Carbon Storage Taskforce 2009; Golab 2010). These studies focused on assessing three main geological risks associated with subsurface CO2 storage:
storage effectiveness – the presence of suitable pore volumes and supercritical CO2 storage conditions
injectivity – the presence of effective reservoirs that can sustain industrial-scale injection rates (≥1 mtpa)
containment – the likelihood of containing a CO2 plume within the storage interval as demonstrated by the presence of an effective top seal and the absence of leakage pathways to the surface.
In this study, an additional geological risk element of structural complexity is incorporated into the screening process. This element integrates aspects of storage effectiveness (aerial sweep efficiency), injectivity (open versus compartmentalised storage intervals) and containment (presence/absence of leakage pathways).
Regional assessments often include estimated theoretical storage volumes to rank the relative suitability of basins for large-scale CO2 storage. Such estimates require an understanding of variations in pore volumes, storage efficiency factors and supercritical CO2 density across potential storage intervals in a basin. However, basin-scale theoretical storage volumes will be several orders of magnitude greater than the final realised storage resources, which may incorrectly emphasise storage effectiveness as the critical geological risk element. Outcomes from projects such as In Salah and ZeroGen have demonstrated that injectivity is often a key limiting factor in attaining forecast storage outcomes (Lane et al. 2021). Greater emphasis is therefore required on appropriate metrics for injectivity that link back to the proposed rates and duration of CO2 injection, underpinned by an understanding of the permeability thickness (kh) of potential storage intervals (Hoffman et al. 2015; Lane et al. 2021).
Geoscience Australia has recently undertaken regional-scale geological storage of carbon dioxide (GSC) assessments across several onshore basins in central and eastern Australia (Fig. 1), including the western Eromanga, central Eromanga, Cooper, Galilee, and northern Bowen basins (Bradshaw et al. 2023, 2024a; Furnass et al. 2023; O’Leary et al. 2023; Wainman et al. 2023). Assessments in the western and central Eromanga and Cooper basins have been underpinned by unpublished rock property models of porosity, kh and net seal thickness derived from petrophysics data and regional basin studies. The use of rock property models provides a greater level of certainty in assessing the geological risk elements, particularly by linking injectivity risk back to regional variations in modelled kh. The western Eromanga basin (WEB) assessment is used as a case study to highlight the importance of using rock property modelling to underpin regional GSC assessments.
Assessment area
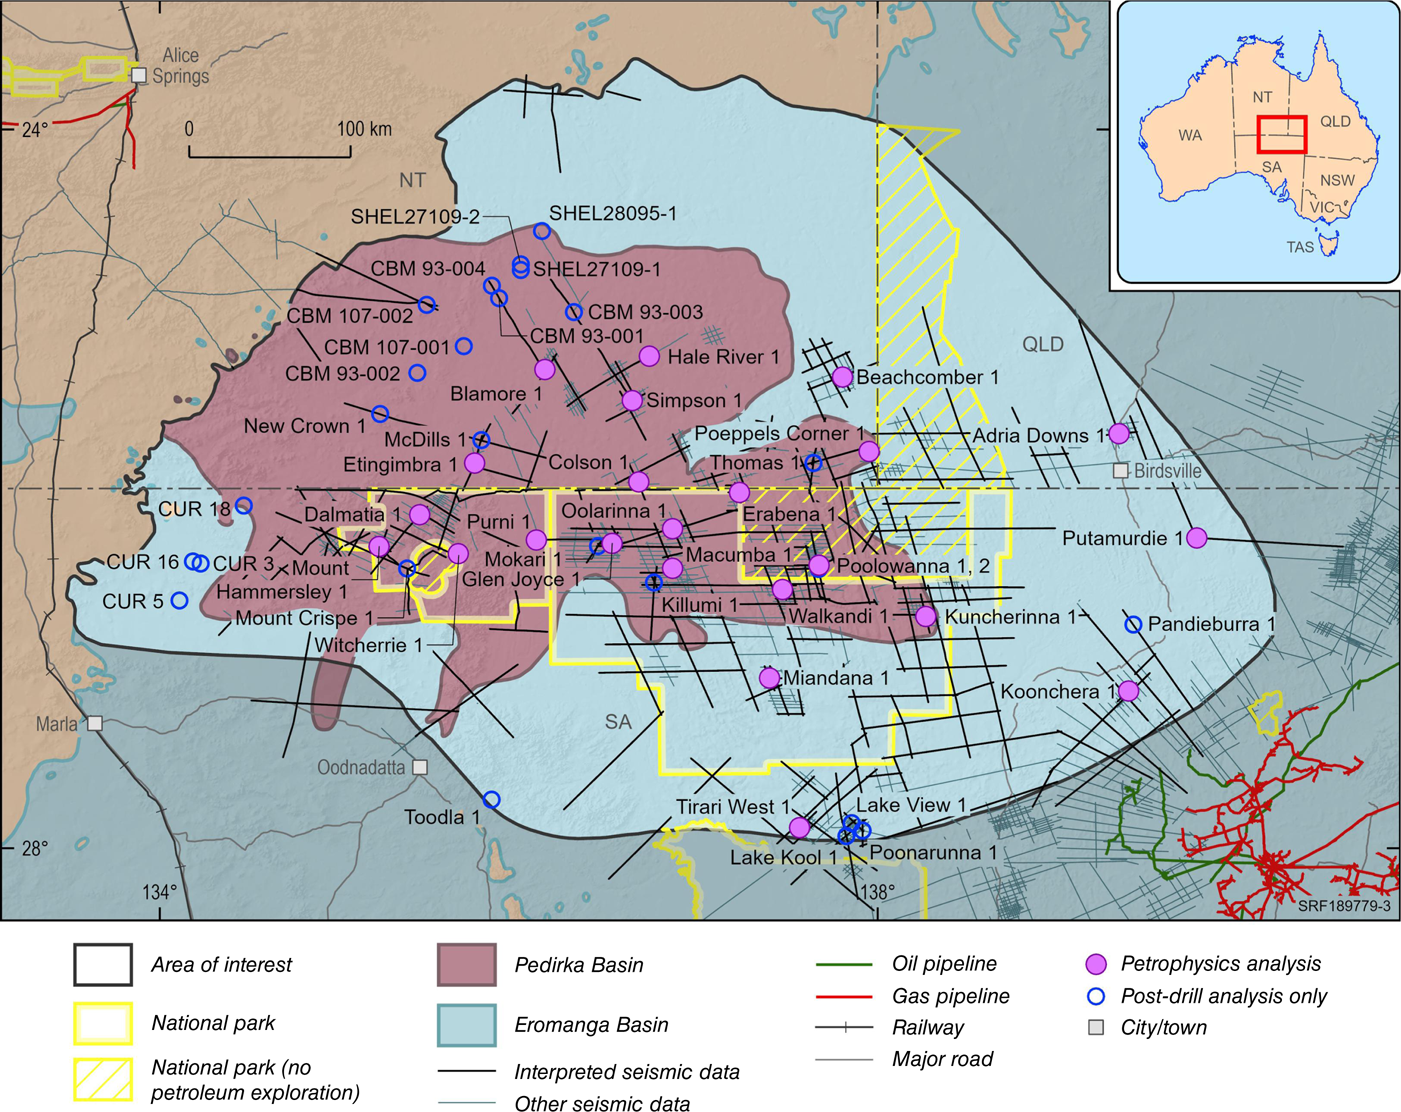
The assessment area extends over ~210,000 km2 across the Northern Territory, South Australia and Queensland, and it incorporates two stacked sedimentary basins separated by a regional unconformity – the western portion of the Eromanga Basin and the underlying Pedirka Basin (Fig. 2). Petroleum exploration in the area has been limited to just 42 exploration wells and only one sub-commercial oil discovery at Poolowanna 1 (Fig. 2). Interest in geological storage exploration is currently focused over gas storage tenements located to the south and southeast of the assessment area. Parts of the assessment area also underly national parks, with no petroleum exploration access allowed in the Munga Thirri Simpson Desert National Park. Exploration of the assessment area has also been limited by its remote location and lack of pipeline infrastructure. Seismic data coverage over the WEB is relatively sparse, with approximately 15,000 line-kilometres of 2D seismic data acquired since exploration began in the 1950s (Fig. 2). Reprocessing of 3750 km of seismic data by Geoscience Australia has significantly improved data quality, enabling the regional interpretation of all key stratigraphic intervals across the assessment area (Bernecker et al. 2024).
Extent of the Pedirka and western Eromanga assessment area highlighting the petroleum wells used for either petrophysical analysis or post-drill analysis and the seismic data used in the supporting geological study. Also shown is the extent of existing national parks over the assessment area.
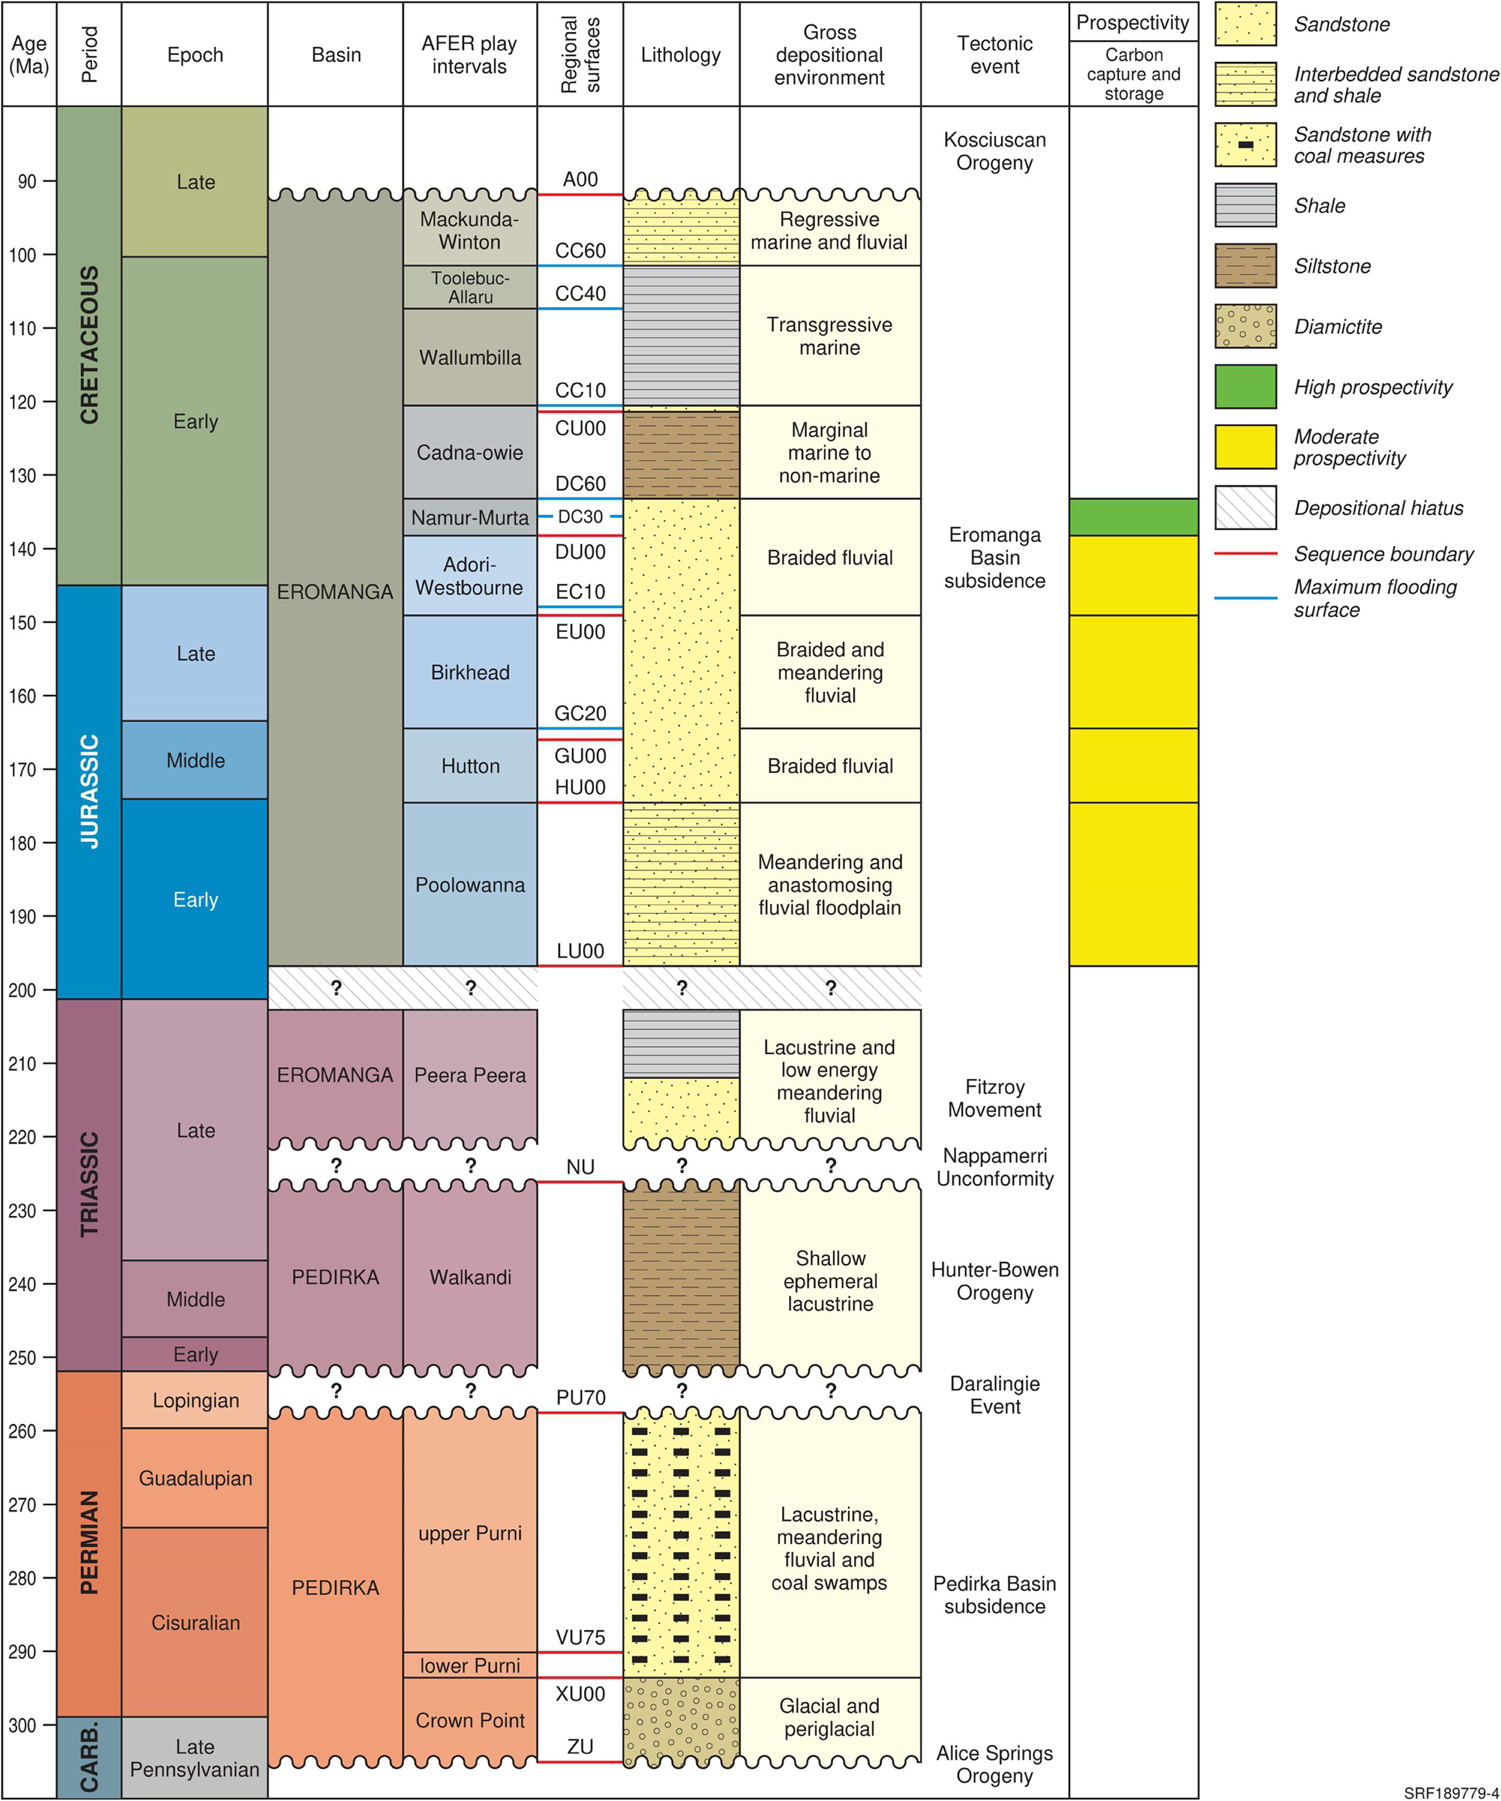
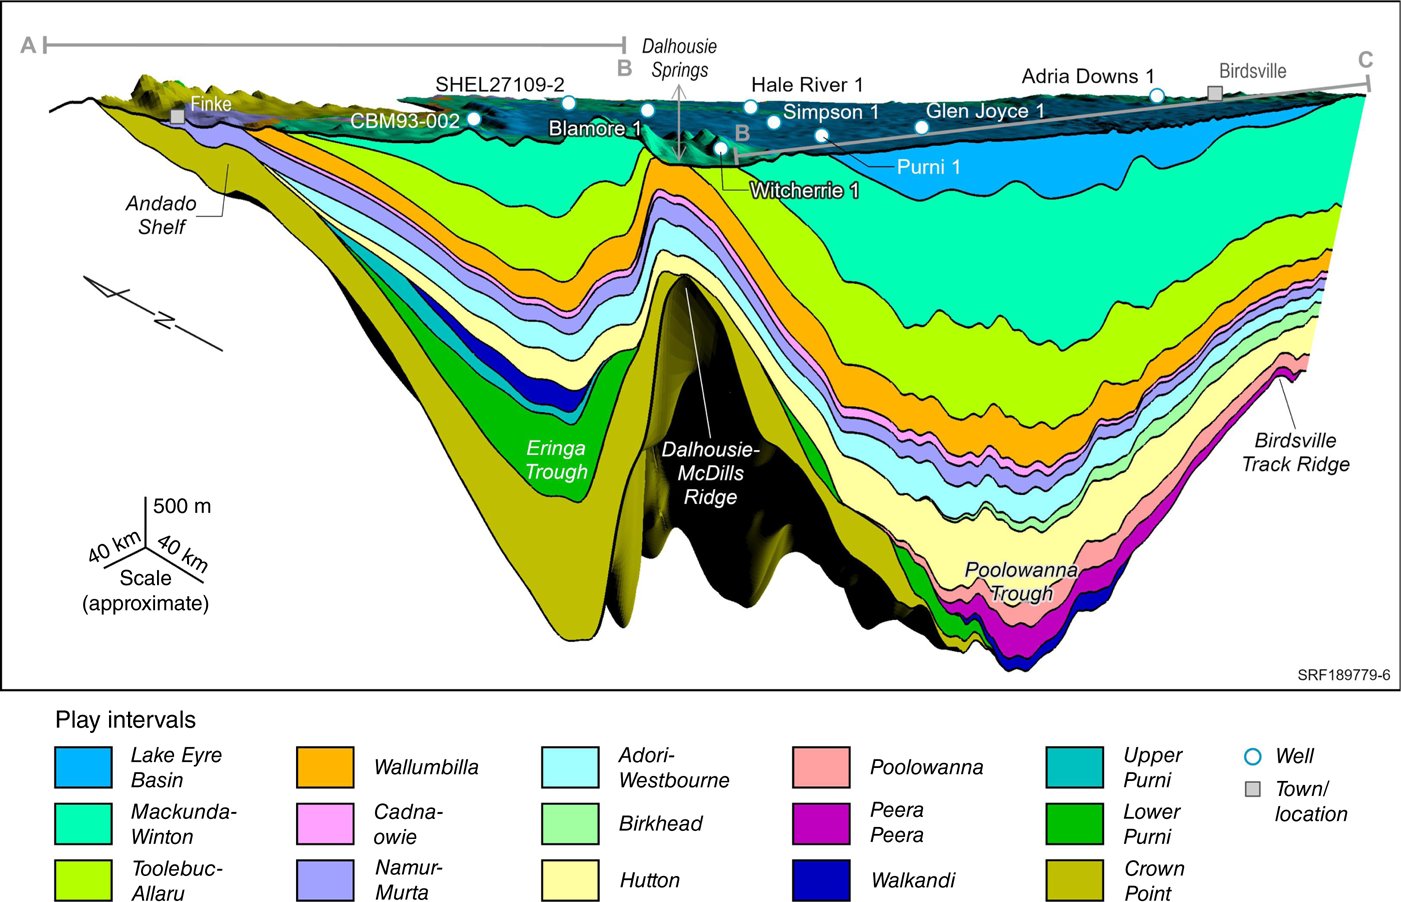
Sedimentary rocks in the Pedirka Basin range in age from latest Carboniferous to Late Triassic (approximately 305–228 Ma), whereas the WEB strata range from Late Triassic to Late Cretaceous in age (approximately 220–92 Ma; Fig. 3). Continental depositional environments dominated from the latest Carboniferous to Early Cretaceous times. Marine depositional systems later dominated during the development of the Early Cretaceous Eromanga Seaway, before a return to continental deposition in the Late Cretaceous (Passmore 1989). Permian sediments reach a maximum thickness of 1525 m in the Eringa Trough (Fig. 4). The Poolowanna Trough forms the main Mesozoic depocentre, with over 300 m of Triassic strata and 3000 m of Jurassic and Cretaceous sedimentary rocks (Fig. 4; Ambrose et al. 2007; Munson and Ahmad 2013).
Chronostratigraphic chart for the Pedirka and western Eromanga basins, showing the 14 play intervals used in the assessment and highlighting the play intervals evaluated with either high or moderate prospectivity for geological storage of carbon dioxide – all other intervals are evaluated as having low prospectivity (modified from Iwanec et al. 2023; geologic time scale after Gradstein et al. 2020). AFER, Australia’s Future Energy Resources Project.
Regional cross-section extracted from the geological model showing the spatial distribution of the 14 assessed play intervals from the Pedirka and Eromanga basins. Note that the Lake Eyre Basin is also shown but is not included in the assessed play intervals. The line of section is shown on Figs 6, 12, 13 and 14.
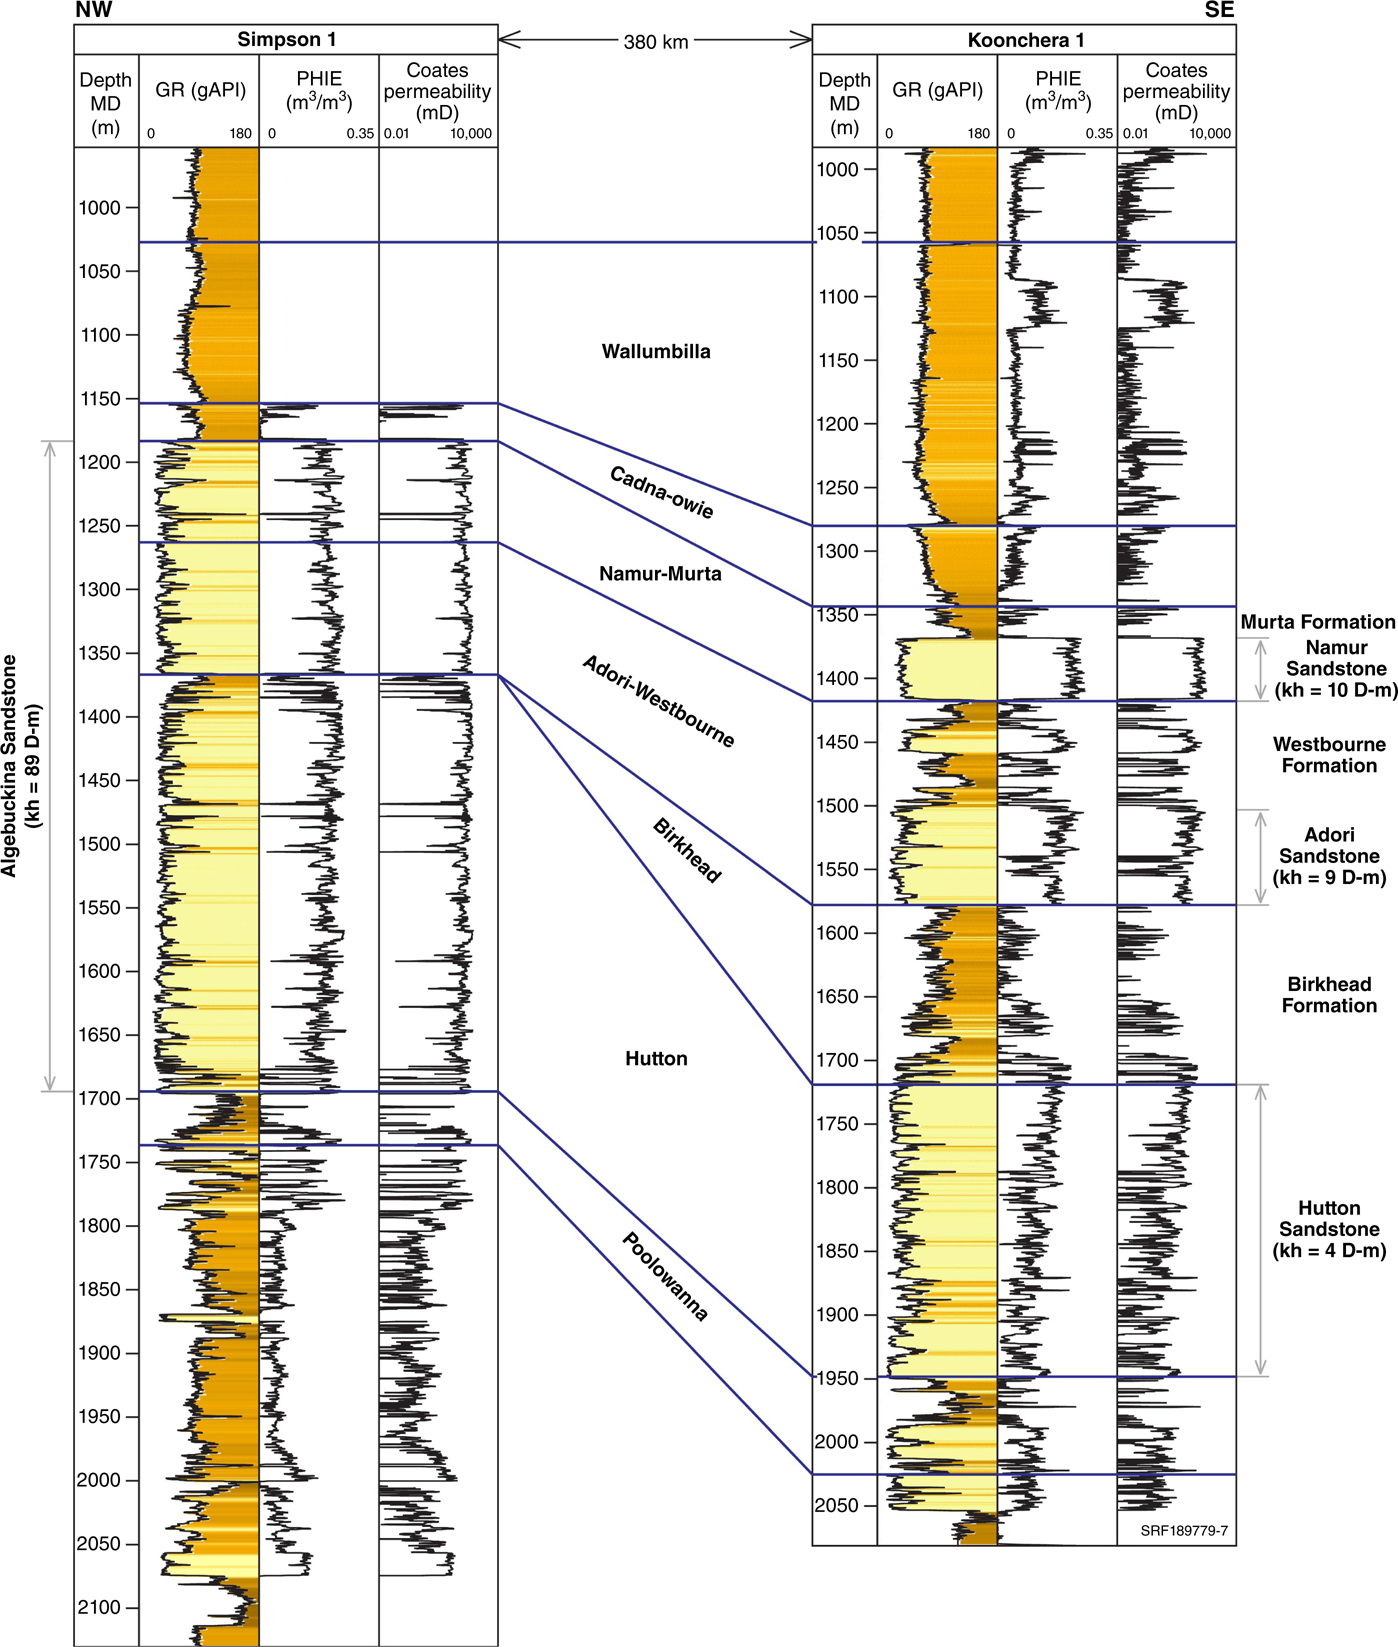
The stratigraphic section of the Pedirka and western Eromanga basins is divided into 14 play intervals for the GSC assessment (Fig. 3; Bradshaw et al. 2022, 2024b; Iwanec et al. 2023). Each play interval represents a regionally extensive reservoir/aquifer for one or more resources (hydrocarbons, GSC, groundwater) and is often with an associated seal/aquitard. The definition of play intervals in the WEB recognises that significant regional lithostratigraphic variations occur in the lower Jurassic to lower Cretaceous Hutton, Birkhead, Adori-Westbourne and Namur-Murta intervals. The four play intervals form a series of fluvial sandstones (Hutton, Adori and Namur sandstones) separated by fluvial-lacustrine shales, siltstones and sandstones (Birkhead, Westbourne and Murta formations) in the east, but they transition farther west into the amalgamated fluvial sandstones of the Algebuckina Sandstone (Fig. 5). This east–west transition from stacked fluvio-lacustrine reservoir-seal pairs to an amalgamated fluvial sandstone interval has a significant impact on regional variations in the GSC prospectivity over the WEB.
Well-log correlation across the western Eromanga basin showing the relationships between the play intervals used for the assessment and the lithostratigraphic units associated with the main reservoir and seal intervals. Also shown are the permeability thickness (kh) measurements for the reservoir intervals based on well-log petrophysics analysis. Well locations are shown in Figs 6, 12, 13 and 14. GR, gamma ray log; PHIE, effective porosity log; MD, measured depth.
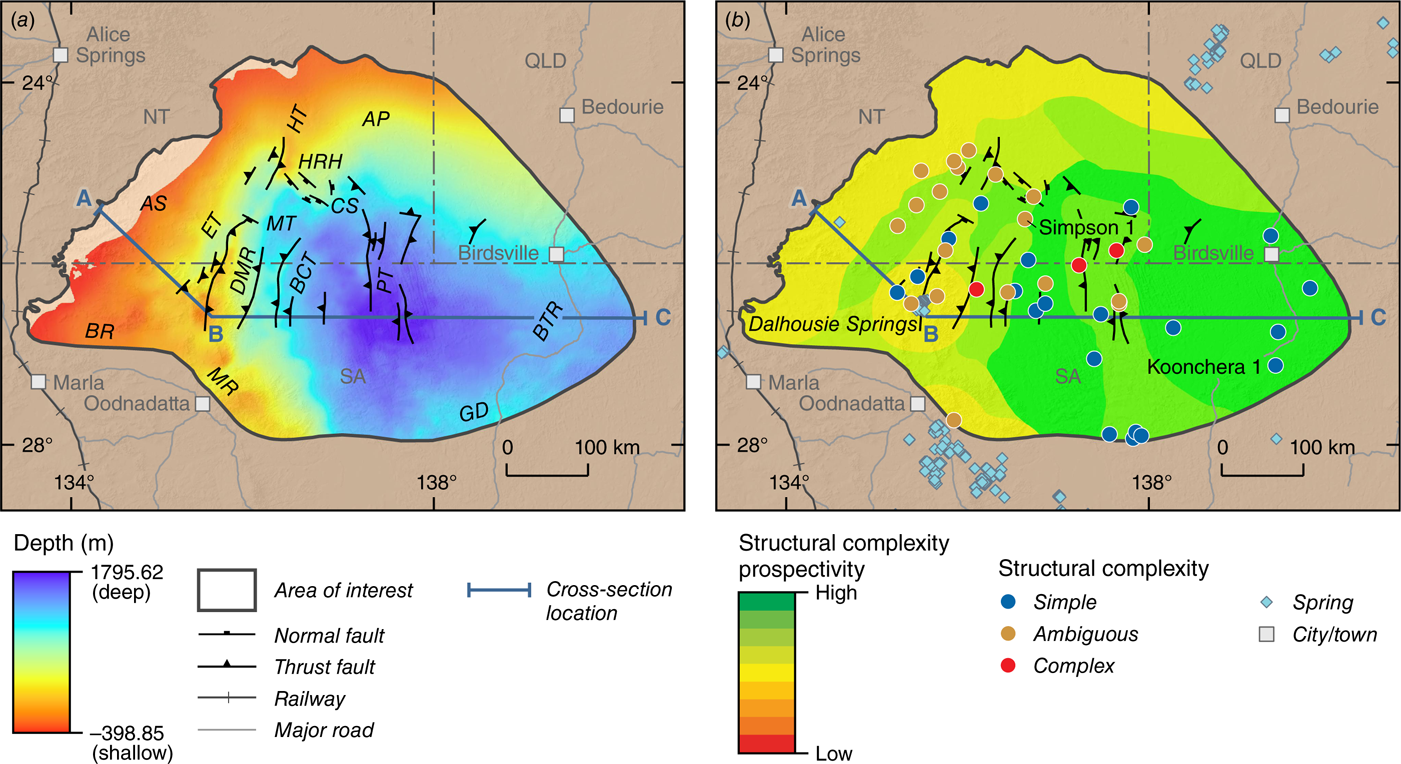
Much of the WEB strata is characterised by low regional dips with limited faulting evident in regional seismic data (Fig. 4). Parts of the basin exhibit prominent north–south-trending structural lineaments, including fault-propagation anticlines along the Dalhousie-McDills Ridge and Hector Trend and reverse fault systems along the Border-Colson Trend, the Purni Fault and the Poolowanna Trough (Fig. 6). These structural elements formed under compressional stresses applied in an east–west direction across the basin and were periodically reactivated during various periods of the basin’s evolution (Ambrose et al. 2007; Middleton et al. 2007; Bernecker et al. 2024). The exhumed western margins of the Andado Shelf and Arunta Platform form recharge zones for regional groundwater systems, whereas the southern extent of the Dalhousie-McDills Ridge and the Muloorina Ridge are environmentally sensitive areas for groundwater discharge (natural springs; Evans et al. 2024).
Structural complexity risk element assessment for the Namur-Murta play interval; (a) major structural elements in the western Eromanga Basin superimposed on a base regional seal depth structure map (datum = Australian Height Datum); (b) structural complexity common risk segment (prospectivity) map. AP, Arunta Platform; AS, Andado Shelf; BCT, Border-Colson Trend; BR, Bitchera Ridge; BTR, Birdsville Track Ridge; CS, Colson Shelf; DMR, Dalhousie-McDills Ridge; ET, Eringa Trough; GD, Gason Dome; HRH, Hale River High; HT, Hector Trend; MR, Muloorina Ridge; MT, Madigan Trough; PT, Poolowanna Trough.
Geological model
The GSC assessment is underpinned by a geological model built within the Petrel Software Platform (©SLB). This model is used to visualise and map the 3D structural architecture of the assessment area and is populated with rock properties, including lithofacies associated with gross depositional environments (GDEs) (Fig. 7), permeability (Fig. 8) and effective porosity (Fig. 9). The geological model incorporates the following interpretive data sets produced by Geoscience Australia’s study of the Pedirka and western Eromanga basins:
fourteen depth structure grids showing depths to the top of each play interval relative to the Australian Height Datum (AHD) in metres (Iwanec et al. 2024a)
sixteen GDE maps showing the main depositional systems associated with each major reservoir and seal interval (Bernecker et al. 2024)
deterministic well-log petrophysical interpretations for 24 wells to provide interpreted volumes of clay/shale (vshale), total and effective porosity, Timur-Coates permeability and apparent water salinity in sodium chloride equivalent (Spicer et al. 2024).
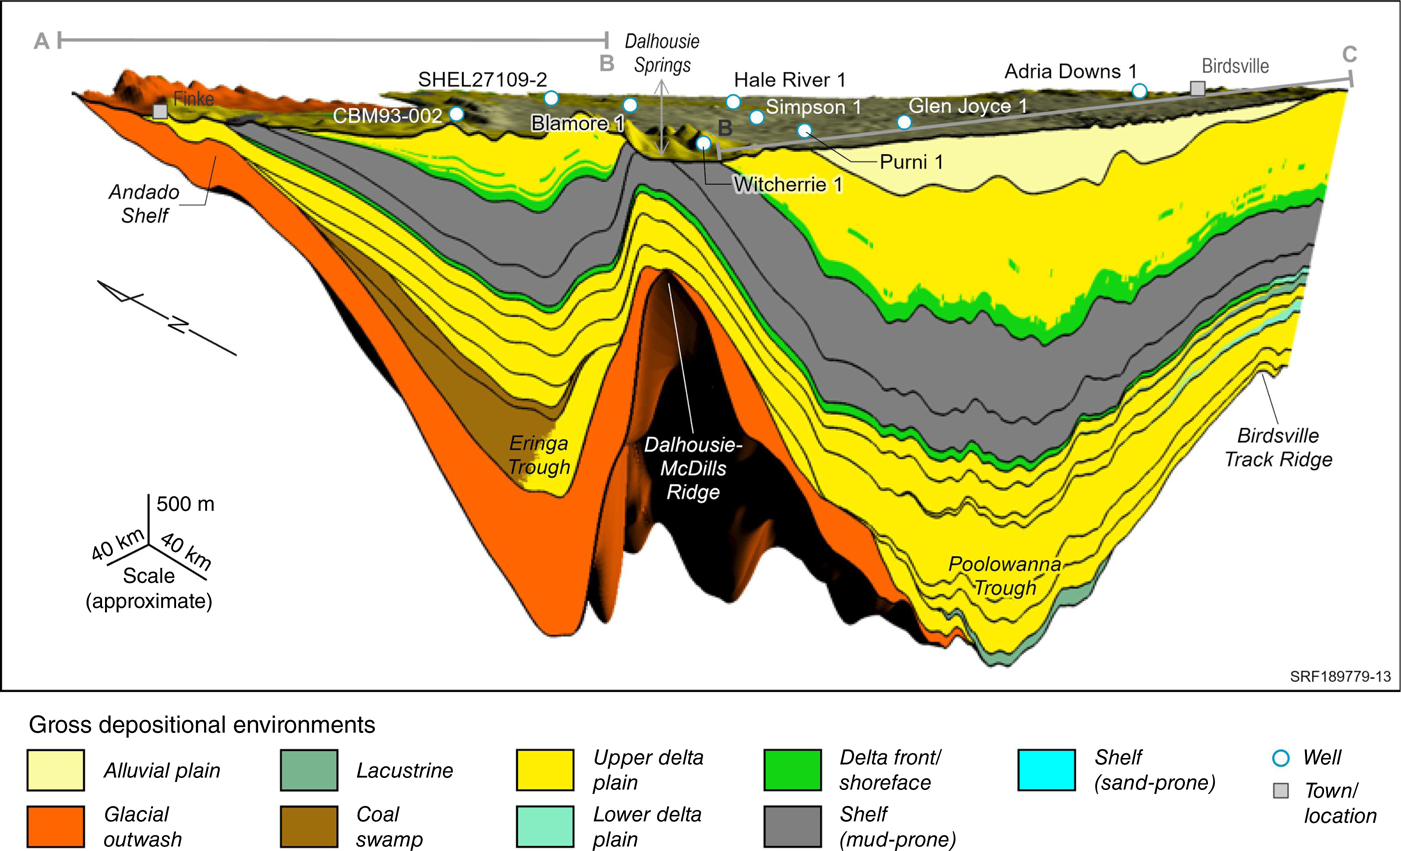
Regional cross-section extracted from the geological model showing the spatial distribution of gross depositional environments represented by the 14 assessed play intervals. The line of section is shown on Figs 6, 12, 13 and 14.
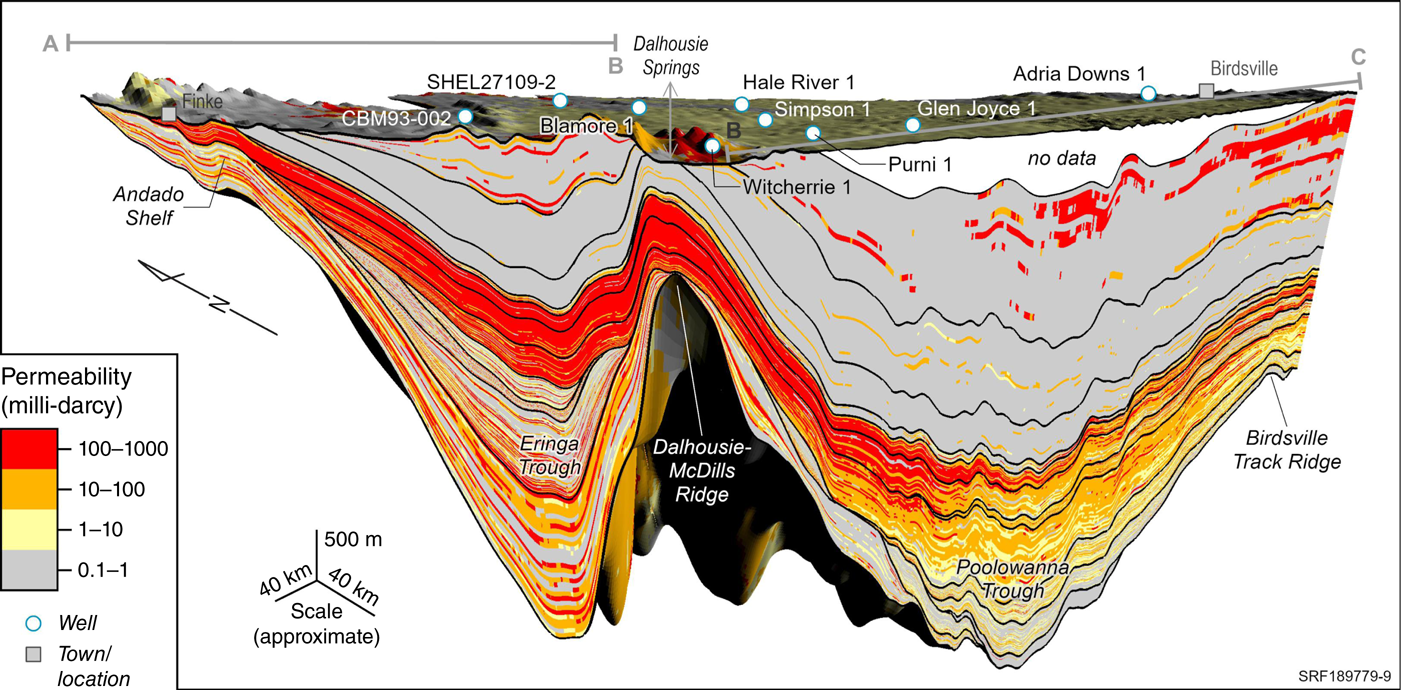
Regional cross-section extracted from the geological model showing the spatial distribution of permeability in the 14 play intervals. Potentially effective reservoir intervals for CO2 injection are highlighted in red and orange, tight reservoirs unsuitable for CO2 injection in yellow and potential seal intervals in grey. The line of section is shown on Figs 6, 12, 13 and 14.
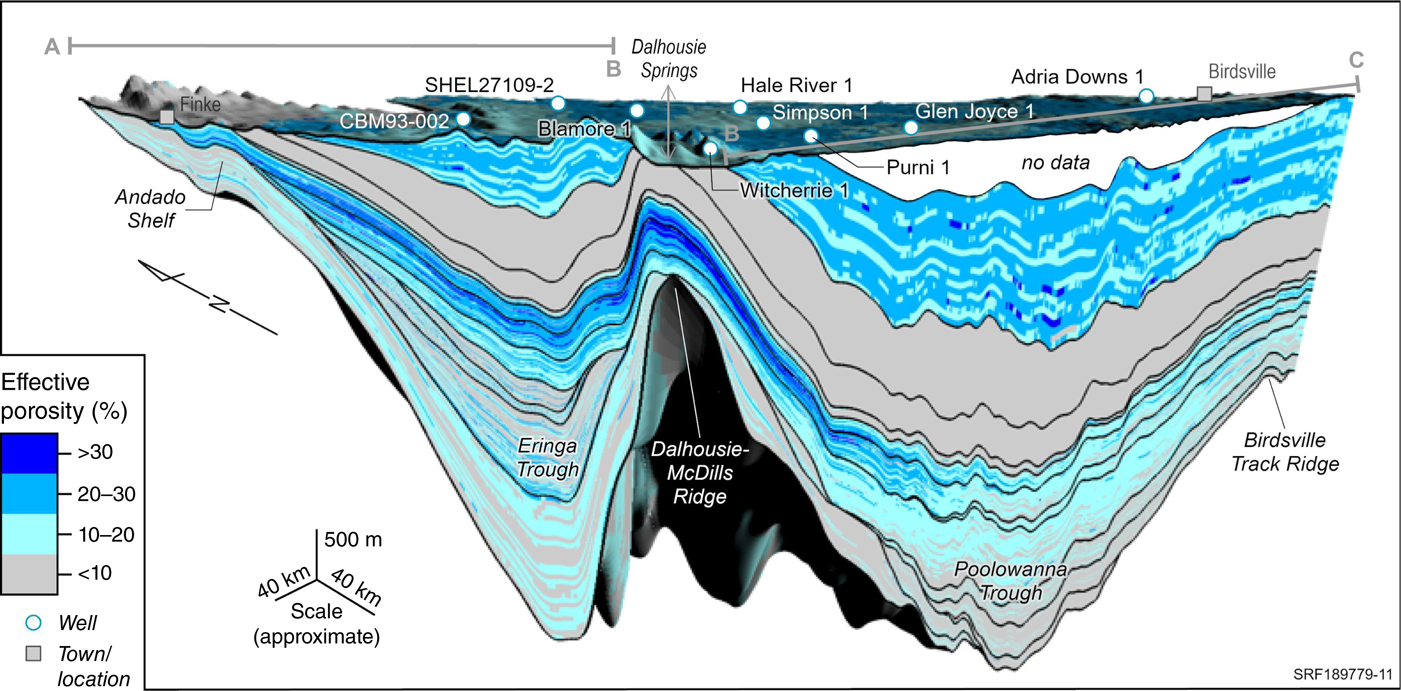
Regional cross-section extracted from the geological model showing the spatial distribution of porosity in the 14 play intervals. Potential reservoir intervals are highlighted in blue and potential seal intervals in grey. The line of section is shown on Figs 6, 12, 13 and 14.
Geological modelling workflow
A reservoir model has been developed to evaluate storage effectiveness, injectivity potential, containment and to calculate CO2 estimated ultimate storage (EUS) ranges. The model incorporates 16 horizons/surfaces (from overburden to pre-Permian) using existing 2D seismic data and well tops/markers. The model grid consists of 690(I) × 499(J) × 542(k) cells, totalling 1,866,160,202 grid cells.
A gamma ray property model has been built from gamma ray logs using the sequential Gaussian simulation (SGS) method. This property serves as a horizontal trend in the environment of deposition modelling process, which is populated using the truncated Gaussian simulation method. The lithofacies property in the model is derived from core and gamma ray log interpretations and is populated using the sequential indicator simulation method. Petrophysical interpretation of wireline logs – including porosity, permeability and salinity – are used to constrain these properties. The SGS method is employed to distribute the properties zone by zone. The zones in the model correspond to the play intervals within the Eromanga and Pedirka basins.
Pressure, temperature and CO2 density models were created using the Petrel property calculator. These models were used in CO2 EUS volume calculations and in the running of Petrel’s Monte Carlo probabilistic uncertainty analyses to provide P90, P50 and P10 estimates. Results from the CO2 EUS volume calculations are provided in Bradshaw et al. (2024a).
GDE lithofacies
A 3D visualisation of the GDE lithofacies property (Fig. 7) highlights the presence of abundant upper delta plain deposits in the WEB. These deposits are sandstone-dominated and therefore provide widespread potential reservoir/aquifer intervals. The model shows reservoirs are overlain by thick and regionally extensive seal lithologies, represented by delta front/shoreface silty mudstones of the Cadna-owie play interval and marine shelf mudstones of the Wallumbilla and Toolebuc-Allaru intervals.
Permeability
A 3D visualisation of the permeability property (Fig. 8) emphasises potential CO2 flow pathways essential for sustaining industrial-scale injection rates, with high permeability zones (>100 millyDarcy, mD) potentially suitable for industrial-scale injection projects marked in red. Highlighted in orange are moderate permeability zones (10–100 mD), where high injection rates might be possible but would potentially require more significant investment (e.g. additional injection wells, pressure management). Tight reservoirs (1–10 mD) unlikely to support high CO2 injection rates are shown in yellow. Low permeability zones (<1 mD) that are ineffective for CO2 injection but potentially effective as seals are highlighted in grey. The model suggests that much of the western and central basin areas contain high permeability reservoirs. There is, however, a regional trend of decreasing permeability over the Poolowanna Trough and Birdsville Track Ridge (Fig. 8).
Porosity
A 3D visualisation of the porosity property (Fig. 9) illustrates areas with suitable reservoirs for CO2 storage. Low porosity zones (<10%) with insufficient pore spaces for CO2 storage are shown in grey. High porosity zones (20–30% and >30%) with sufficient pore spaces for effective CO2 storage are in dark blue, whereas moderate porosity zones (10–20%), likely to have enough pore spaces for storage, are in light blue. The model indicates that high porosity zones extend over the western and central basin areas, whereas moderate but still adequate porosity zones extend over the deeper Poolowanna Trough and Birdsville Track Ridge areas (Fig. 9).
GSC assessment workflow
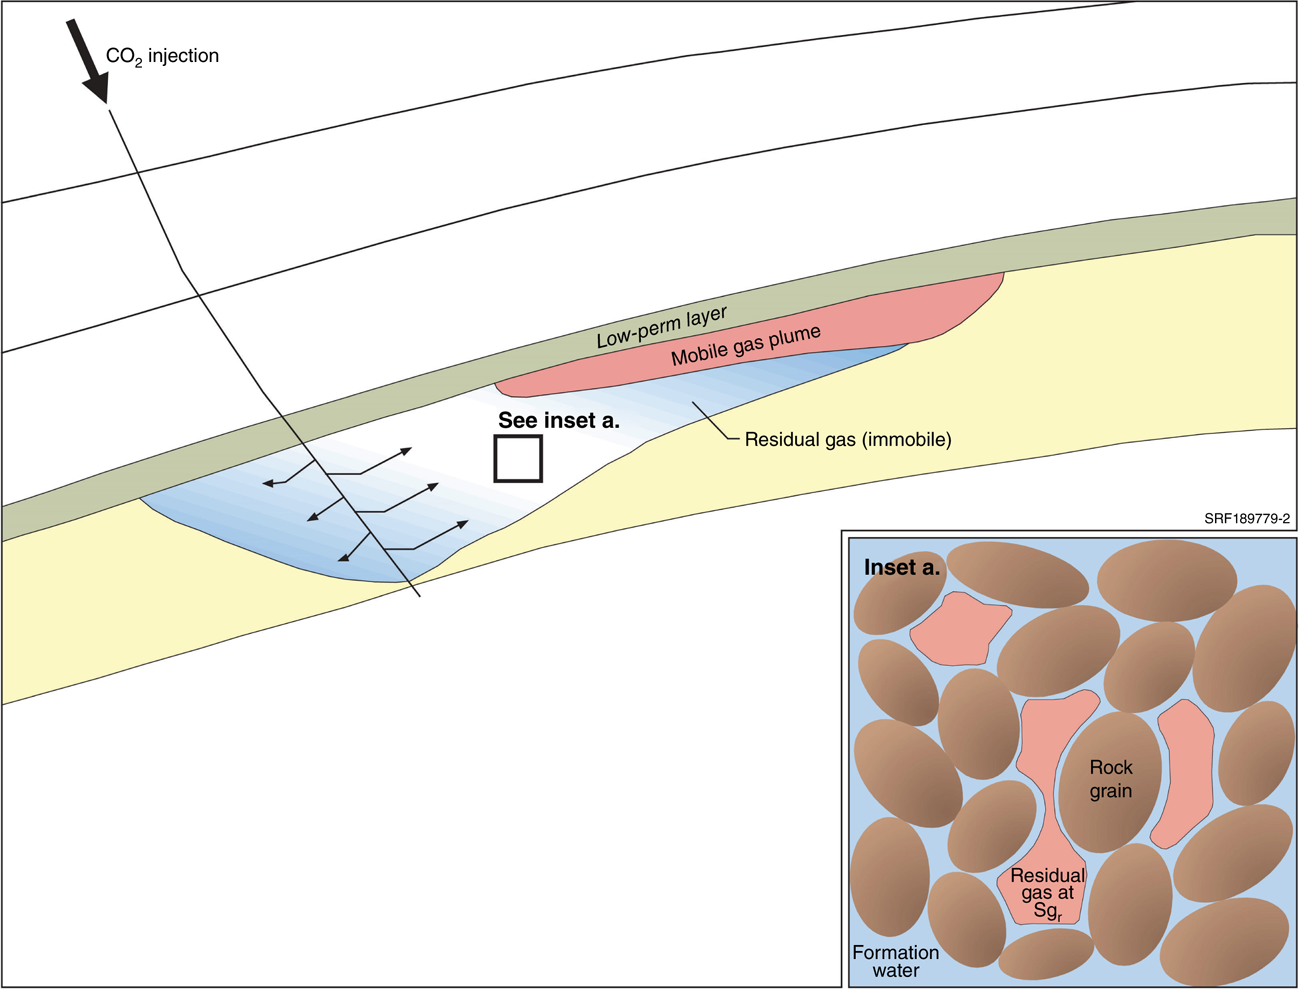
A play-based common risk segment (CRS) mapping workflow has been used for the WEB GSC assessment. This workflow is adapted from the hydrocarbon play-based exploration approach developed by the petroleum industry over several decades (e.g. Longley and Brown 2016). The workflow assesses the prospectivity for large-scale injection and storage of CO2 (≥1 mtpa) using migration assisted storage (MAS; Fig. 10; Bradshaw et al. 2009; Spencer et al. 2011). MAS involves injecting CO2 into an open reservoir system with low regional dips that facilitate the slow migration of a CO2 plume through buoyancy forces at the top of the storage interval, typically towards a structural culmination over distances of tens of kilometres. CO2 is permanently stored through a combination of residual gas bubbles being trapped in the rock matrix, as the plume migrates up-dip, and geochemical trapping of CO2, mainly through dissolution within the formation water with some eventual precipitation as mineral phases. MAS allows the permanent storage of very large CO2 volumes while mitigating pressure buildup during injection.
Schematic diagram highlighting the migration assisted storage concept using residual gas saturation trapping of CO2 in pore spaces as a CO2 plume migrates up-dip through buoyancy beneath a low dipping reservoir-seal interface (adapted from Bradshaw et al. 2009). Sgr, residual gas saturation.
Each play interval has been systematically assessed against four risk elements: (1) injectivity, (2) storage effectiveness, (3) containment and (4) structural complexity (Fig. 11). The evaluation relies on a series of metrics based on the minimum requirements for each risk element, which are then evaluated using post-drill analysis of petroleum well data together with geological and rock property maps. Post-drill analysis provides some control points for the CRS polygons, as documented by Iwanec et al. (2024b). However, the frontier status of the WEB limits post-drill analysis to just 42 wells. Geological and rock property maps are therefore essential to delineate the spatial extents of each CRS polygon and assess prospectivity based on the best available geological understanding of each play interval.
Geological Storage of CO2 (GSC) composite common risk segment map for the Namur-Murta play interval derived by stacking (multiplying) the four risk element CRS map layers of injectivity, storage effectiveness, containment and structural complexity. See Fig. 6 for structural element abbreviation definitions.
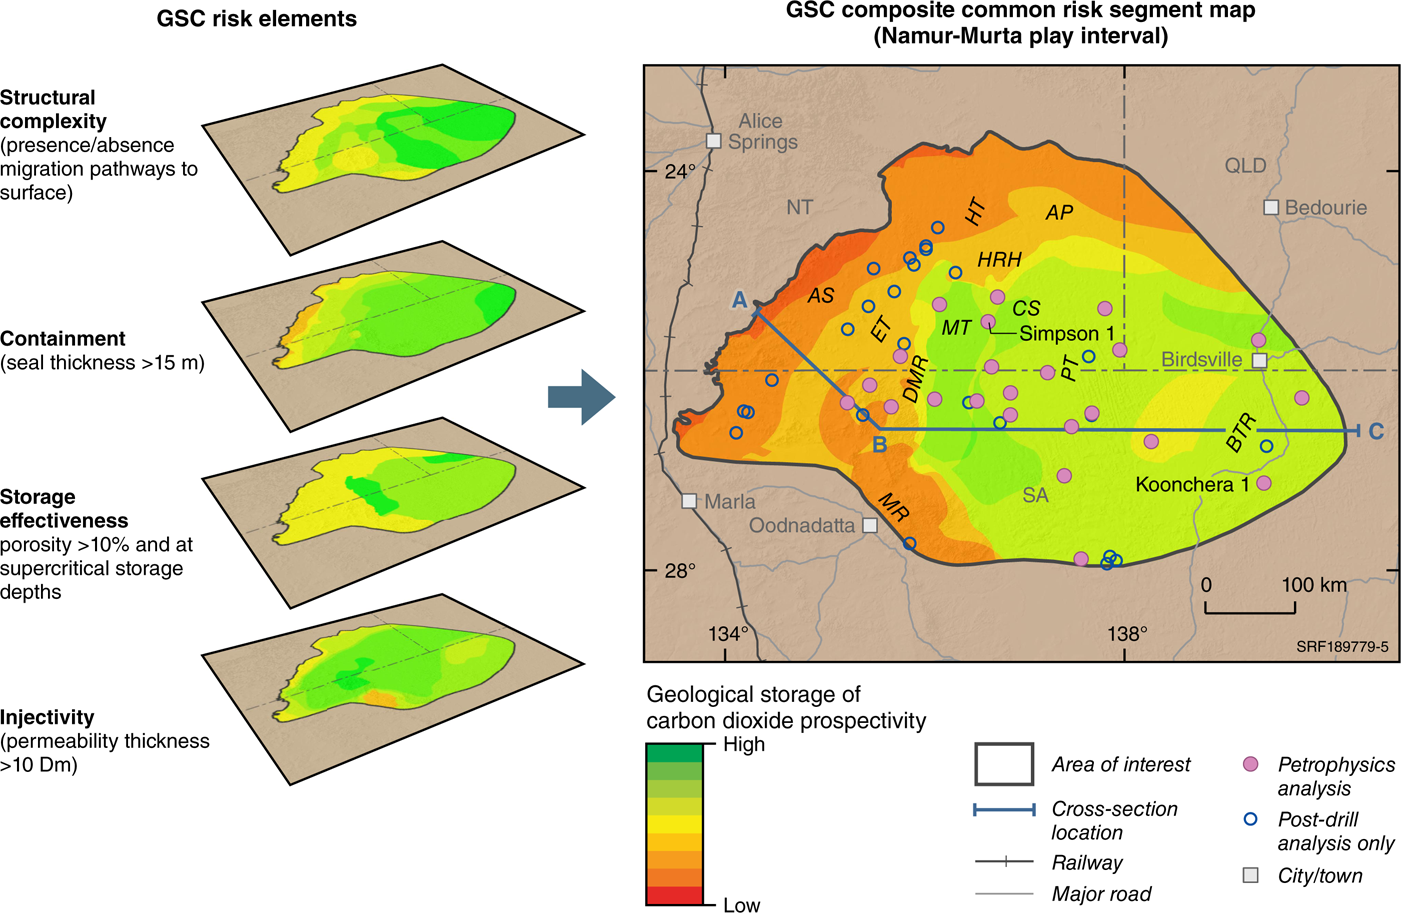
The Namur-Murta play interval, which underlies the regional seal interval in the WEB, is evaluated as the most prospective GSC interval (Fig. 3). A prospectivity map in Fig. 11 is generated by stacking (i.e. multiplying) the CRS maps for injectivity, storage effectiveness, containment and structural complexity of the Namur-Murta play interval. The results highlight a potentially large area of medium to high prospectivity that encompasses the Birdsville Track Ridge, Poolowanna Trough, Colson Shelf and Madigan Trough (see Fig. 6a for structural elements map). The CRS maps for the injectivity, storage effectiveness and containment risk elements are derived from the integration of post-drill analysis results with geological and rock property maps derived from the geological model.
The structural complexity CRS map (Fig. 6b) focuses on the structural architecture of the WEB at the top of the Namur-Murta play interval. It does not incorporate rock properties from the geological model. High prospectivity areas for this risk element have low regional dips culminating in structural highs lacking evidence for active faults in often sparse regional seismic data. Low prospectivity areas have complex fault compartments or aquifers that extend directly back to the surface into groundwater recharge or discharge zones (i.e. naturally ‘leaky’ basin areas). Further details on the assessment of structural complexity in the Namur-Murta interval are available in Bradshaw et al. (2024a).
Injectivity risk element (kh)
Injectivity evaluates the potential to sustain industrial-scale CO2 injection rates (≥1 mtpa) into the storage reservoir over the multi-decade timeframes typical of storage projects. Uncertainty regarding the presence of suitable geological conditions to sustain injection rates has been a key limiting factor in several storage projects (Lane et al. 2021). Sustaining high CO2 injection rates requires relatively homogenous, regionally extensive reservoirs with high permeabilities (Hoffman et al. 2015; Lane et al. 2021). The presence of thick, regionally extensive upper delta plain (fluvial) sandstones in multiple play intervals across the WEB (Fig. 7) provides potentially suitable geological conditions for sustaining high injection rates in reservoirs that are normally pressured and have relatively high permeabilities. Hydrostatic pressure gradients, calculated from drill stem test and mud weight data converted to an equivalent formation pressure, indicate that the Namur-Murta interval is normally pressured. The permeability model suggests that relatively high permeabilities (100–1000 mD) occur in upper delta plain sandstones across the Andado Shelf to the western flanks of the Poolowanna Trough. Moderate permeabilities (10–100 mD) are observed in deeper basin areas over the axis of the Poolowanna Trough and the Birdsville Track Ridge (Fig. 8).
Permeability thickness (kh) map
Injectivity is evaluated through integrating permeability and net reservoir thickness in the geological model to produce a kh map for the reservoir section beneath the regional seal (Fig. 12a). Injectivity in this study is evaluated using criteria published by Hoffman et al. (2015), where kh values of <10 Darcy-metres (Dm) are deemed unsuitable for CO2 storage, whereas kh that exceed 100 Dm are deemed highly prospective.
Injectivity risk element assessment for the Namur-Murta play interval; (a) permeability thickness map in units of Darcy-metres (Dm) for the Algebuckina Sandstone (western and central assessment area) and Namur Sandstone (eastern assessment area); (b) injectivity common risk segment (prospectivity) map. See Fig. 6 for structural element abbreviation definitions.
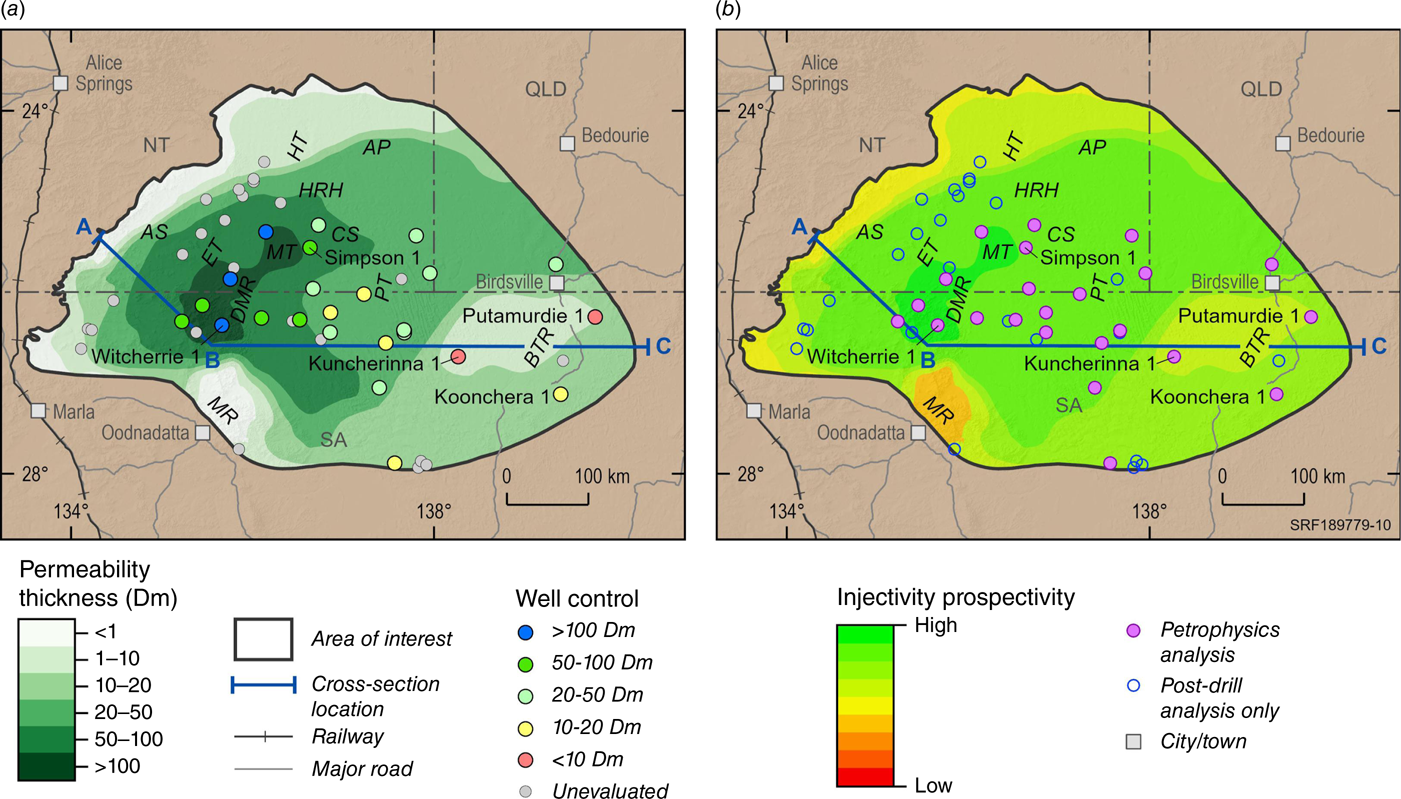
The kh map incorporates strata from the top of the Namur-Murta play interval to the first underlying intraformational seal interval. In the eastern part of the Poolawanna Trough and Birsdville Track Ridge area, the first potential intraformational seal is the Westbourne Formation (Fig. 5). The kh map therefore only incorporates the reservoir section from the Namur-Murta interval over the eastern assessment area. Farther west, the kh map incorporates the full stratigraphic section of the Algebuckina Sandstone (i.e. the Namur-Murta, Adori-Westbourne, Birkhead and Hutton play intervals) extending from the axis of the Poolowanna Trough to the western and northern extents of the assessment area.
A high kh (>100 Dm) fairway occurs along the Dalhousie-McDills Ridge and Madigan Trough (Fig. 12a), with a maximum of 143 Dm interpreted in petrophysical analysis from the Witcherrie 1 well. Over the Eringa Trough and Andado Shelf, kh decreases to 10–100 Dm as the Algebuckina Sandstone progressively thins to the west. Further decreases in kh are observed over the Colson Shelf and Poolowanna Trough as permeability decreases with depth. The geological model predicts kh values of 10–20 Dm for much of the Namur Sandstone’s extent over the eastern assessment area, with a potential low kh zone (1–10 Dm) identified between the Kuncherinna 1 and Putamurdie 1 wells (Fig. 12a).
Injectivity CRS map
The kh map is used to produce an injectivity CRS map in Fig. 12b, which shows relatively high prospectivity across most of the extents of the Algebuckina Sandstone and lower prospectivity over the extents of the Namur Sandstone in the east (Fig. 12b). Injectivity at rates of >1 mtpa may still be possible over much of this eastern area but are more likely to require pressure management through production of formation waters from the Namur Sandstone interval. Higher CO2 injection rates in the east may also be achieved by injecting into reservoirs from the underlying Adori-Westbourne and Hutton plays.
Storage effectiveness risk element
The storage effectiveness risk element evaluates the presence of supercritical storage depths and effective porosities.
Supercritical storage depths
CO2 is required to be a supercritical fluid for effective geological storage, which occurs at temperatures ≥31°C and reservoir pressures of ≥1071 psia. Temperatures of 31°C occur at relatively shallow depths of ~134 m below the surface in the assessment area. Temperature data from well completion reports show a mean geothermal gradient of 40°C/km, with the geothermal gradient increasing from 35°C/km in the west to 42°C/km in the east.
Pressure data indicate a freshwater to saline pressure gradient of 0.433–0.45 psi/ft from a recharge elevation of 170 m above the AHD. Supercritical storage pressures of 1071 psia are estimated to occur at depths of 660 m true vertical depth below sea-level (TVDSS), calculated from hydrostatic pressure gradients and regional potentiometric surface data published by Keppel et al. (2013). Supercritical storage conditions in the Namur-Murta play interval are therefore mapped in Fig. 13a as occurring at depths ≥660 m TVDSS. Suitable reservoir pressures of ≥1071 psia are interpreted to occur over the Madigan Trough, Colson Shelf, Poolowanna Trough and Birdsville Track Ridge. Basin areas to the north and west, however, are likely to have reservoir pressures below the threshold for supercritical storage of CO2.
Storage effectiveness risk element assessment for the Namur-Murta play interval; (a) depth to top Namur-Murta interval highlighting the 660 m TVDSS contour, which represents the onset of supercritical CO2 storage conditions; (b) effective porosity map highlighting the 20% porosity contour, which marks the transition from high to moderate reservoir porosities. (c) Storage effectiveness common risk segment (prospectivity) map. See Fig. 6 for structural element abbreviation definitions. mSS, metres below sea level.
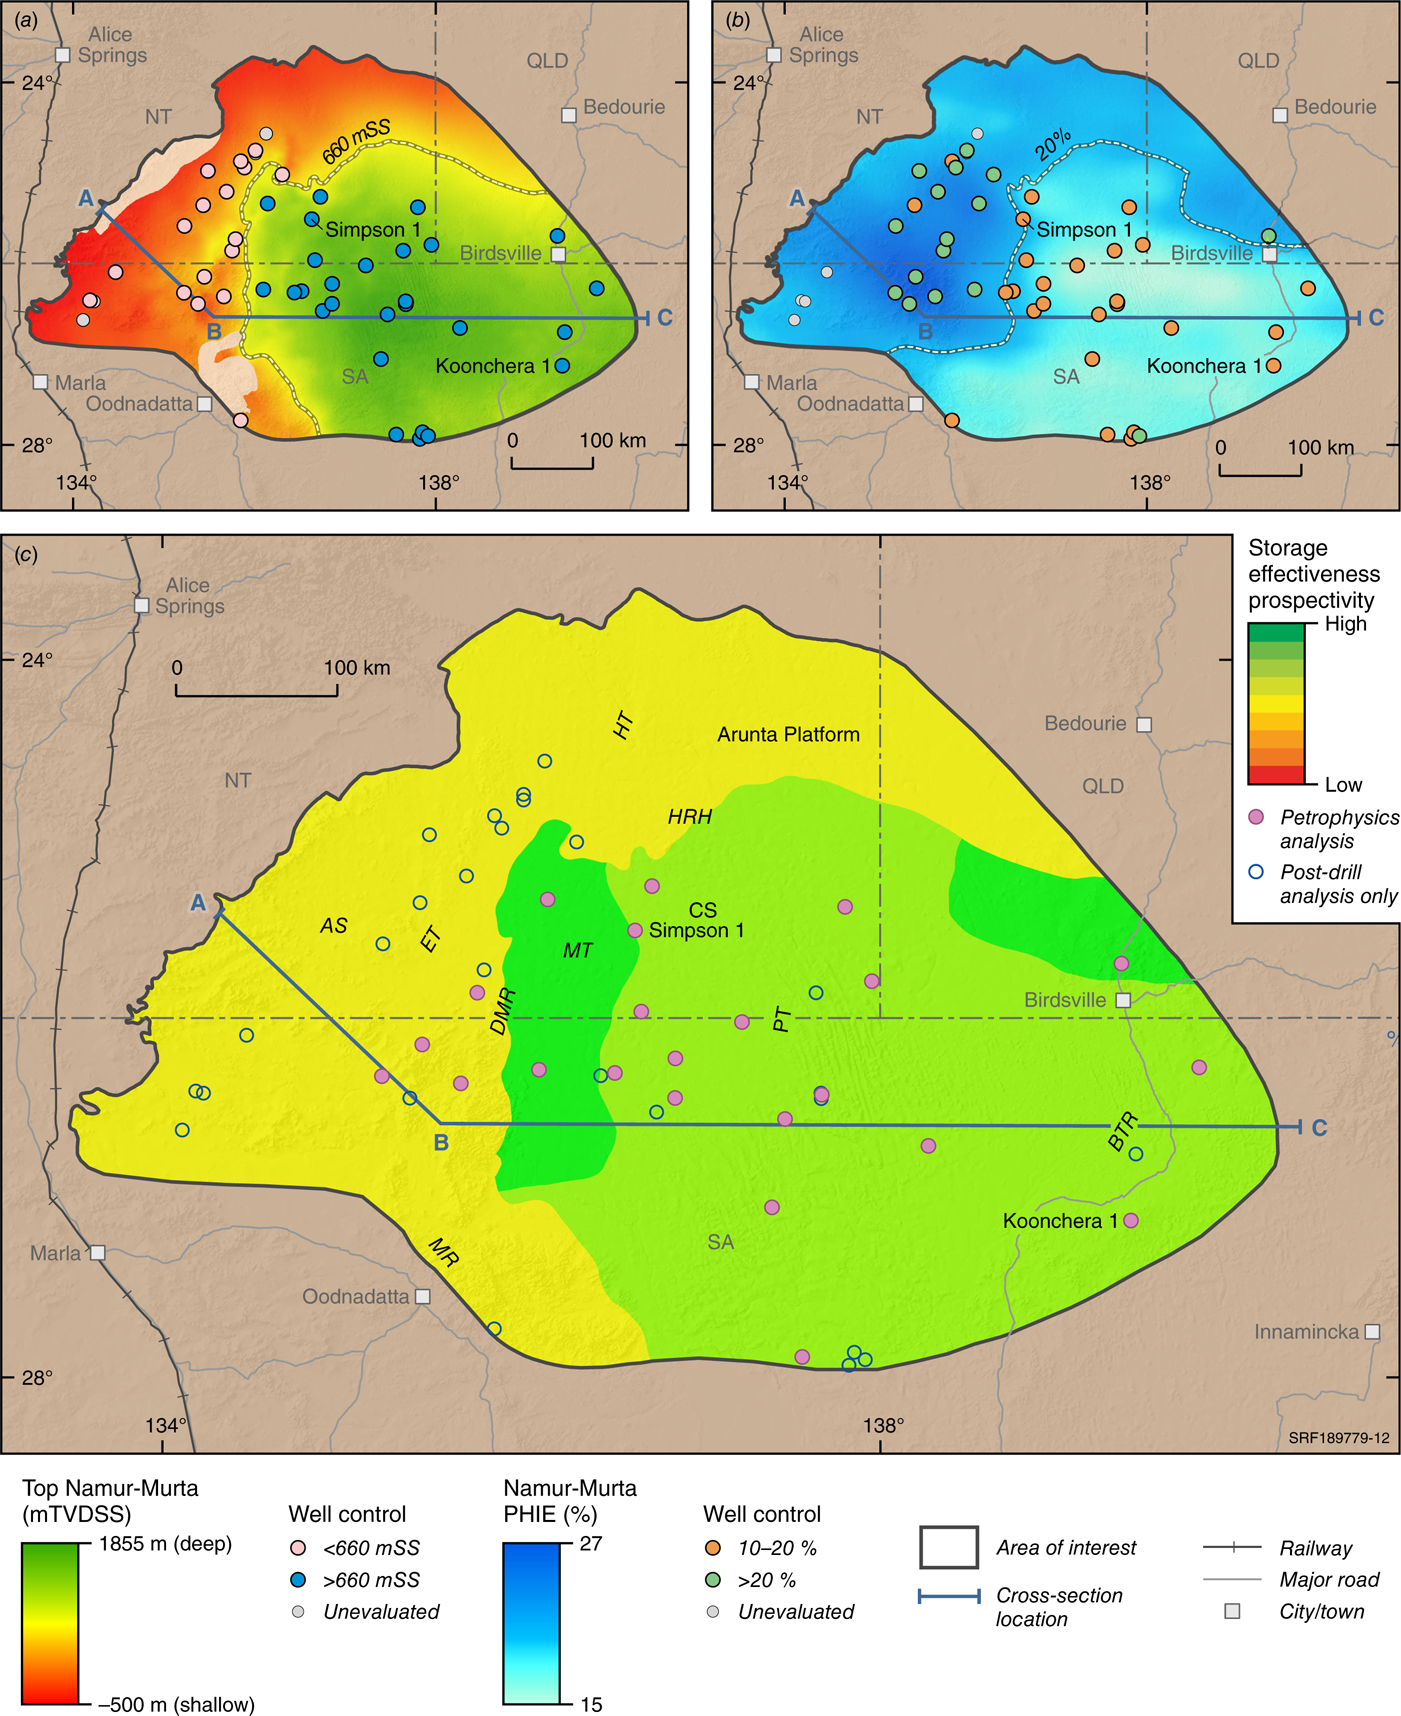
Effective porosity
Effective porosities <10% are considered unsuitable for CO2 storage (Bradshaw et al. 2009), whereas, for this assessment, effective porosities >20% are deemed highly prospective. Fig. 9 shows a cross-section extracted from the porosity model highlighting the relatively high effective porosities in reservoir intervals from the WEB across the Andado Shelf, Eringa Trough and Dalhousie-McDills Ridge. Porosities decrease in deeper basin areas across the Poolowanna Trough and Birdsville Track Ridge. This observation of decreasing effective porosity with depth is consistent with a regional trend related to diagenetic silicification (Green et al. 1989; Wecker 1989).
Evaluations of effective porosities for CO2 storage are based on a map of average effective porosity (Fig. 13b) for the Namur-Murta interval extracted from the geological model. The highest average effective log porosities (20–28%) occur over the Madigan Trough and western parts of the Colson Shelf and over the northeastern margin of the Poolowanna Trough. Similarly high porosities are modelled over the Eringa Trough, Andado Shelf and Arunta Platform based on porosity-depth trends. Average effective porosities range from 14–19% across most of the Poolowanna Trough and Birdsville Track Ridge areas.
Storage effectiveness CRS map
A storage effectiveness CRS map is produced in Fig. 13c by integrating the evaluations of supercritical storage depths and effective porosities. Areas with the highest prospectivity for storage effectiveness occur over the Madigan Trough, western parts of the Colson Shelf and the northeastern margin of the Poolowanna Trough, where the top of the Namur-Murta interval occurs at depths >660 m TVDSS and average effective porosities exceed 20%. Deeper basin areas over the Poolowanna Trough and Birdsville Track Ridge have slightly lower prospectivity due to the observed reduced porosity with depth. The Dalhousie-McDill Ridge, Eringa Trough, Andado Shelf, Hale River High and Arunta Platform areas are evaluated as having the lowest prospectivity for efficient storage conditions, despite the predicted high effective porosities, due to the Namur-Murta interval mapped as likely to occur above the predicted depths for supercritical storage of CO2 in the WEB.
Containment risk element (top seal presence)
Containment is evaluated in the context of preventing the vertical migration of CO2 from the storage interval as determined from the thickness of overlying sealing intervals. Potential leakage through fault systems is evaluated separately under the structural complexity risk element. Containment is assessed in this study as unsuitable for CO2 storage where net seal thickness is <15 m and highly prospective where net seal thickness exceeds 50 m. Conventional sealing lithologies in the WEB include mudstones, which are known to effectively trap hydrocarbons in the adjoining Cooper-Eromanga area (Alexander and Boult 2007). However, the assessment also incorporates unconventional seals comprising other non-reservoir lithologies (e.g. silty mudstones and tight sandstones). These unconventional seals can form confining systems, which either retard the vertical migration of fluids from underlying reservoirs or ultimately trap any migrated CO2 as residual gas (due to capillary effects) and via dissolution mechanisms in their very low permeability rock matrix (Bradshaw et al. 2009; Bump et al. 2023). Containment is evaluated using net seal isochore maps derived from the geological model together with post-drill analysis results and qualitative descriptions of the lithologies from well completion reports.
Net seal isochore maps
The Namur-Murta play interval underlies the regional seal interval for the Eromanga Basin, which formed during a regional marine transgression in the Early Cretaceous (Fig. 3). Marginal marine conditions were initially established during deposition of the Cadna-owie play interval and were followed by fully marine conditions during deposition of the Wallumbilla and Toolebuc-Allaru intervals (Fig. 3). The effectiveness of the Cadna-owie Formation as a regional seal for hydrocarbons has been questioned by several authors (Wecker 1989; Boult 1993; Boult et al. 1997; Draper 2002; Alexander and Boult 2007) due to its overall siltstone-dominated lithology. However, the lower argillaceous part of the Cadna-owie play interval in the WEB has very low permeabilities (<0.01 mD; Fig. 5) and is likely to impede vertical migration of CO2. The Cadna-owie Formation is also known to act as an effective aquitard for groundwater systems at the local-scale in the WEB (Keppel et al. 2013). Any CO2 that migrates into the Cadna-owie Formation is likely to do so over the time scale of millennia, eventually becoming trapped within the very low permeability siltstones (Bradshaw et al. 2009). Fluvio-lacustrine mudstones within the Murta Formation have been demonstrated to effectively trap hydrocarbons within underlying fluvial sandstones in the Cooper-Eromanga basins and are likely to provide additional locally effective seals to contain migrating CO2 (Alexander and Boult 2007).
A net seal thickness map for the combined upper Namur-Murta and Cadna-owie intervals produced from the geological model is shown in Fig. 14a. The map highlights a regional thinning of potential seal lithologies from >50 m over much of the Birdsville Track Ridge (maximum of 73 m at Koonchera 1); to 15–50 m over the Poolowanna Trough, Colson Shelf and Madigan Trough; and <15 m in basin areas to the west and north. This regional thinning of potential sealing lithologies reflects both the regional thinning of the Cadna-owie Formation and a lateral change to more proximal sand-prone facies in the north and west. The Cadna-owie play interval is exhumed over the western-most flanks of the Andado Shelf.
Containment risk element assessment for the Namur-Murta play interval; (a) seal thickness map for the Murta and Cadna-owie formations; (b) seal thickness map for the Wallumbilla Formation (c). Containment common risk segment (prospectivity) map. See Fig. 6 for structural element abbreviation definitions.
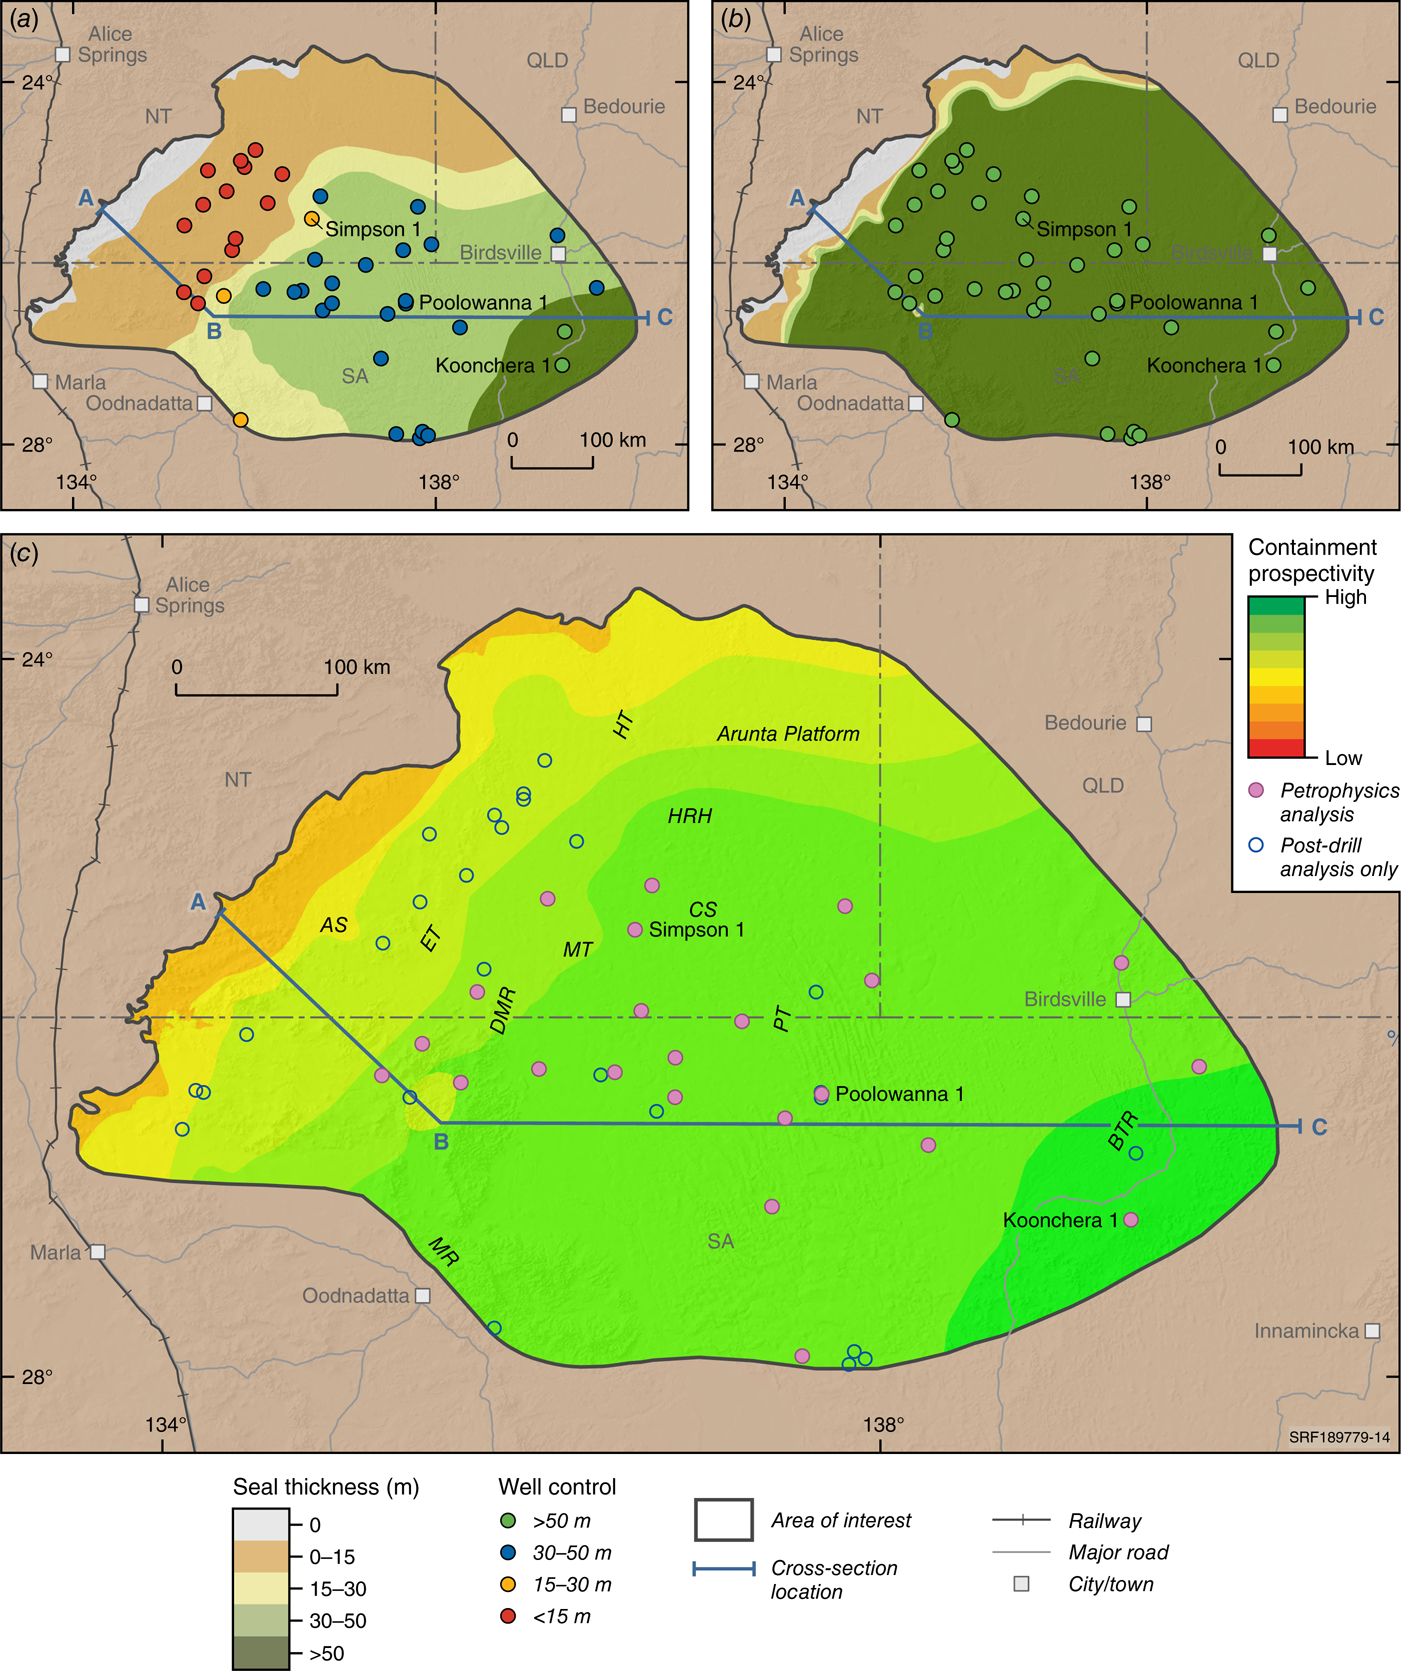
The overlying Wallumbilla play interval forms the basal section of a thick, widespread regional seal and groundwater aquitard that extends across the Eromanga Basin (Draper 2002; Alexander and Boult 2007; Evans et al. 2024). This marine mudstone succession is likely to provide an effective seal preventing any vertical migration of CO2 above the Cadna-owie play interval (Bradshaw et al. 2009). The net seal isochore map for the Wallaumbilla play interval in Fig. 14b shows sealing lithologies >50 m in thickness across most of the assessment area, with a maximum thickness of 227 m in the Poolowanna Trough (Poolowanna 1). Seal thickness decreases rapidly over the western flanks of the Andado Shelf and northern flanks of the Arunta Platform where the Wallumbilla play interval was uplifted and eroded.
Containment CRS map
A containment CRS map shown in Fig. 14c integrates the thickness of potential seal lithologies in the upper Namur-Murta and Cadna-owie play intervals together with the thickness of the known sealing lithologies in the Wallumbilla play interval. The highest prospectivity occurs over the Birdsville Track Ridge. Here, effective containment is likely to be provided by intraformational lacustrine mudstones together with marginal marine silty mudstones from the Cadna-owie play interval and overlying marine mudstones from the Wallumbilla interval. Containment prospectivity is evaluated as decreasing slightly over the Poolowanna Trough, Colson Shelf and Madigan Trough due to the loss of intraformational lacustrine mudstone and the decreasing thickness of the Cadna-owie Formation. However, the Wallumbilla interval continues to provide an effective regional seal in these central parts of the assessment area. Seal effectiveness is evaluated as lowest over the Eringa Trough, Andado Shelf and northern parts of the Arunta Platform where the Cadna-owie play interval thins and transitions to more proximal and sand-prone paralic and coastal plain deposits and where marine mudstones from the Wallumbilla play interval are uplifted and eroded.
Conclusions
Geoscience Australia’s assessment of the WEB’s GSC potential demonstrates the value of applying a play-based exploration workflow to evaluate geological prospectivity for four mappable risk elements: (1) injectivity, (2) storage effectiveness, (3) containment and (4) structural complexity. Criteria used for each risk element are based on the requirements for large-scale injection and storage of CO2 (≥1 Mtpa) using MAS. By applying a CRS mapping approach supported by petrophysical analysis and rock property maps, this assessment bridges the current geological understanding with critical uncertainties relevant for future storage projects in the WEB.
The assessment highlights a potentially prospective play associated with the Namur-Murta play interval (incorporating the Algebuckina Sandstone and Namur Sandstone reservoirs) over the Birdsville Track Ridge, Poolowanna Trough, Colson Shelf and Madigan Trough (Fig. 11). The most prospective play fairway extends along the Colson Shelf and Madigan Trough where all four risk elements are evaluated as having relatively high likelihood of meeting the risking criteria. The Poolowanna Trough area is also likely to be prospective for industrial-scale GSC projects if reservoir quality is maintained within the Algebuckina Sandstone in the deepest basin areas. Fault systems along the axis of the Poolowanna Trough and around the margins of the Madigan Trough and Colson Shelf require further evaluation to determine if these are leaky or sealed structures that pose local risks for storage projects. Prospectivity is likely to be lower over the Birdsville Track Ridge due to the reduced kh of the Namur Sandstone in this area. However, sustainable injection rates may be achieved in this eastern basin area by utilising stacked multiple reservoir-seal pairs in underlying play intervals. The northern and western basin areas are at depths shallower than predicted for supercritical storage conditions in the WEB and often include active faults or aquifers that connect directly back to the surface (groundwater recharge and discharge zones). These basin areas are therefore unlikely to be suitable for GSC projects.
The GSC assessment is underpinned by a geological model, which captures the 3D structural architecture using regional seismic interpretations and is populated with rock properties from petrophysical interpretations of well logs. Rock property maps derived from this model are essential in ensuring that CRS maps incorporate the current knowledge regrading regional variations in the tectonostratigraphic architecture and petrophysical properties of potential storage intervals in this frontier region. New geological insights gained from any future exploration can be used to update the geological model and CRS maps to ensure that our understanding of potentially prospective areas is updated as key geological uncertainties are addressed. Exploration programs that appraise uncertainties regarding the potential for the Namur Sandstone to sustain large-scale injection rates and the Cadna-owie Formation to effectively contain or trap CO2 will be particularly important to reduce the uncertainty for any future GSC projects in the WEB.
Data availability
Data sharing is not applicable, as no new data were generated or analysed during this study.
Acknowledgements
The authors wish to thank Tehani Palu and Carmine Wainman for their constructive reviews, and Darwun Chau for drafting support. We also wish to acknowledge the contributions of the Northern Territory Geological Survey and South Australian Department for Energy and Mines as part of the Australia’s Future Energy Resource Project. This paper is published with the permission of the CEO, Geoscience Australia.
References
Ambrose GJ, Scardigno M, Hill AJ (2007) Petroleum geology of the Middle–Late Triassic and Early Jurassic sequences in the Simpson Basin and northern Eromanga Basin of central Australia. The APPEA Journal 47(1), 127-143.
| Crossref | Google Scholar |
Bernecker T, Bradshaw BE, Iwanec J, Bradey K, Owens R (2024) Regional geology of the Pedirka and western Eromanga basins. Australia’s Future Energy Resources (AFER) Project, Exploring For The Future Program. (Geoscience Australia) 10.26186/149701
Boult PJ (1993) Membrane seals and tertiary migration pathways in the Bodalla South oilfield, Eromanga Basin, Australia. Marine and Petroleum Geology 10, 3-13.
| Crossref | Google Scholar |
Bradshaw J, Bradshaw BE, Allinson G, Rigg A, Nguyen G, Spencer L (2002) The potential for geological sequestration of CO2 in Australia: preliminary findings and implications for new gas field development. The APPEA Journal 42, 25-46.
| Crossref | Google Scholar |
Bradshaw BE, Spencer LK, Lahtinen AC, Khider K, Ryan DJ, Colwell JB, Chirinos A, Bradshaw J (2009) ‘Queensland Geological Storage Atlas.’ (Compiled by Greenhouse Gas Storage Solutions on behalf of Queensland Department of Employment, Economic Development and Innovation) Available at https://geoscience.data.qld.gov.au/dataset/ds000035
Bradshaw BE, Rollet N, Iwanec J, Bernecker T (2022) A regional chronostratigraphic framework for play-based resource assessments in the Eromanga Basin. The APPEA Journal 62, 392-399.
| Crossref | Google Scholar |
Bradshaw BE, Wainman C, Ferdinando D, Furnass M, O’Leary R, Hostetler S, Orr M, Rees S, Mezzomo S, Woods M, McAlpine S (2023) Geological storage of carbon dioxide: Eromanga Basin, Trusted Environmental and Geological Information Program. (Geoscience Australia and CSIRO: Australia) 10.26186/147561
Bradshaw BE, Iwanec J, Beattie M, Bernecker T, Evans T, Lund D (2024a). ‘Assessment of the Geological Storage Potential for Carbon Dioxide: Pedirka and western Eromanga basins. Australia’s Future Energy Resources (AFER) Project.’ Record 2024/30. (Geoscience Australia: Canberra, ACT) Available at http://pid.geoscience.gov.au/dataset/ga/149622
Bradshaw BE, Iwanec J, Doig A, Strong P, Bernecker T (2024b). A geological framework to support play-based resource assessments in the Pedirka and Simpson basins. In ‘Proceedings of the Petroleum Exploration Society of Australia, vol. 2’. CABS IV Special Publication. pp. 145–157. 10.36404/OJTN5102
Bump AP, Bakhshian S, Ni H, Hovorka SD, Dunlap D, Olariu M, Hosseini S, Meckel TA (2023) Composite confining systems: rethinking geological seals for permanent CO2 sequestration. International Journal of Greenhouse Gas Control 126, 1-12.
| Crossref | Google Scholar |
DISR (2024) Commonwealth of Australia Future Gas Strategy Analytical Report. (Department of Industry, Science and Resources) Available at https://www.industry.gov.au/sites/default/files/2024-05/future-gas-strategy-analytical-report.pdf
Evans T, Bradshaw BE, Beattie M (2024) Summary of hydrogeology: Pedirka and Western Eromanga Basins. Australia’s Future Energy Resources (AFER) Project, Exploring For The Future Program. (Geoscience Australia: Canberra, ACT) 10.26186/149702
Furnass M, Wainman C, Bradshaw BE, O’Leary R, Ferdinando D, Hostetler S, Orr M, Rees S, Mezzomo S, Woods M, McAlpine S (2023) ‘Geological storage of carbon dioxide: North Bowen Basin, Trusted Environmental and Geological Information Program.’ (Geoscience Australia and CSIRO: Australia) 10.26186/147506
Hoffman N, Carman G, Bagheri M, Goebel T (2015) Site characterisation for carbon sequestration in the nearshore Gippsland Basin. The Carbon Net Project. AAPG SEG International Conference and Exhibition, pp. 13–16, September 2015, Melbourne, Australia. (Society of Exploration Geophysicists) 10.1190/ice2015-2209980
IPCC (2022) Climate Change 2022: Mitigation of Climate Change. In ‘Contribution of Working Group III to the Sixth Assessment Report of the Intergovernmental Panel on Climate Change’. (Eds PR Shukla, J Skea, R Slade, A Al Khourdajie, R van Diemen, D McCollum, M Pathak, S Some, P Vyas, R Fradera, M Belkacemi, A Hasija, G Lisboa, S Luz, J Malley), pp. 3–48. (Cambridge University Press: UK) 10.1017/9781009157926.001
Iwanec J, Strong P, Bernecker T (2023) Underexplored but not forgotten: assessing the energy resources potential of the greater Pedirka region through play-based mapping. The APPEA Journal 63(S1), 251-256.
| Crossref | Google Scholar |
Iwanec J, Lund D, Bradshaw BE, Bradey K (2024a) ‘Pedirka and Western Eromanga Basins Depth and Isochore Maps - Data Package and Explanatory notes.’ (Geoscience Australia: Canberra, ACT) 10.26186/149124
Iwanec J, Bradshaw BE, Bernecker T, Doig A, Ferdinando D, Jarrett A, Strong P, Yarmohammadtooksi Z (2024b) Post-drill analysis to assess the prospectivity and geological risks for energy resources in the Pedirka, Simpson and western Eromanga basins. In ‘Proceedings of the Petroleum Exploration Society of Australia, vol. 2’. CABS IV Special Publication. pp. 158–172. 10.36404/CZAN6731
Keppel MN, Karlstrom KE, Love AJ, Priestley S, Wohling D, De Ritter S-J (2013) ‘Allocating Water and Maintaining Springs in the Great Artesian Basin, Volume I: Hydrogeological Framework of the Western Great Artesian Basin.’ (National Water Commission: Canberra) Available at https://cdn.environment.sa.gov.au/landscape/docs/saal/awmsgab-volume-i.pdf
Lane J, Greig C, Garnett A (2021) Uncertain storage prospects create a conundrum for carbon capture and storage ambitions. Nature Climate Change 11, 925-936.
| Crossref | Google Scholar |
Longley IM, Brown J (2016) Why bother? (with play based exploration): The five reasons why play based exploration is worthwhile in a modern busy understaffed and overworked exploration company environment. In ‘Oral presentation given at AAPG/SEG International Conference and Exhibition’. Melbourne 13–16 September 2015. AAPG Search and Discovery Article, p. 110227. (AAPG) Available at https://www.searchanddiscovery.com/pdfz/documents/2016/110227longley/ndx_longley.pdf.html
Middleton MF, Barker CE, Heugh J (2007) The geology of the western part of the Pedirka Basin, Australia. In ‘Proceedings of the Central Australian Basins Symposium, Alice Springs, Northern Territory, 16–18 August, 2005’. Eds. TJ Munson, GJ Ambrose. Special Publication 2. pp. 409–426. (Northern Territory Geological Survey) Available at https://geoscience.nt.gov.au/gemis/ntgsjspui/handle/1/81567
Munson TJ, Ahmad M (2013) Chapter 38 – Pedirka Basin. In ‘Geology and Mineral Resources of the Northern Territory’. (Compilers M Ahmad, TJ Munson). Special Publication 5. (Northern Territory Geological Survey) Available at https://geoscience.nt.gov.au/gemis/ntgsjspui/handle/1/81486
O’Brien G, de Morton S, Bason D (2024) Securing the Australian CCS project rollout by improving aspects of the GHG storage legislation: a discussion paper. Australian Energy Producers Journal 64(1), 13-23.
| Crossref | Google Scholar |
O’Leary R, Wainman C, Bradshaw BE, Furnass M, Ferdinando D, Hostetler S, Orr M, Rees S, Mezzomo S, Woods M, McAlpine S (2023) Geological storage of carbon dioxide: Cooper Basin, Trusted Environmental and Geological Information Program. (Geoscience Australia and CSIRO: Australia) 10.26186/147511
Passmore VL (1989) Petroleum accumulations of the Eromanga Basin: a comparison with other Australian Mesozoic accumulations. In ‘Proceedings of the Petroleum Exploration Society of Australia. The Cooper and Eromanga Basins, Australia, 1989’. (Ed. BL O’Neil). pp. 371–389. (Petroleum Exploration Society of Australia)
Spencer LK, Bradshaw J, Bradshaw BE, Lahtinen A, Chirinos A (2011) Regional storage capacity estimates: prospectivity not statistics. Energy Procedia 4(2011), 4857-4864.
| Crossref | Google Scholar |
Spicer R, Yarmohammadtooski Z, Lund D, Beattie M, Iwanec J (2024) The Pedirka and western Eromanga basins well log petrophysics data package, metadata statement. (Geoscience Australia: Canberra, ACT) Available at http://pid.geoscience.gov.au/dataset/ga/149208
Wainman C, Ferdinando D, Bradshaw BE, Furnass M, O’Leary R, Hostetler S, Orr M, Rees S, Mezzomo S, Woods M, Bouma M, McAlpine S (2023) ‘Geological storage of carbon dioxide: Galilee Basin. Trusted Environmental and Geological Information Program.’ (Geoscience Australia and CSIRO: Australia) 10.26186/147509
Wecker HRB (1989) The Eromanga Basin. The APPEA Journal 29(1), 379-397.
| Crossref | Google Scholar |
Barry Bradshaw is a Geoscientist with 33 years of experience undertaking regional geological and geophysical studies and play-based resource assessments for hydrocarbon resources and geological storage projects. Barry is currently employed as the Energy Resources and Advice Activity Leader at Geoscience Australia, and he has previously worked as a Principal Geologist at CGSS consultants, a Senior Research Scientist at the Australian Geological Survey Organisation/Geoscience Australia, and a Research Scientist at Texas A&M University (USA). Barry graduated from the University of Sydney in 1988 and completed a PhD in Earth Sciences at the University of Waikato (New Zealand) in 1991. |
Thomas (Tom) Bernecker is a Geoscientist who holds an MSc from the University of Aachen, Germany, and a PhD from La Trobe University, Melbourne. His early geological work involved the development of models for siliciclastic and carbonate depositional systems in northwestern Europe and in Australia. After a lectureship at the University of Melbourne, Tom joined the Victorian Department of Natural Resources and Energy where his work focused on the hydrocarbon prospectivity of the Gippsland and Otway basins. Tom joined Geoscience Australia in 2007 and is currently the Director of Energy Resources Advice and Promotion. |
Mavise Beattie is a seasoned Geoscientist with over 20 years of global experience in the oil and gas industry, holding a PhD from the University of Wollongong. Her career began with Shell as a Sedimentologist/Reservoir Geologist, and she has since worked with prominent companies like Oil Search, INPEX, KUFPEC, Drillsearch Energy, Santos, Geoscience Australia and, currently, ADZ Energy. Mavise has contributed to significant projects across various regions, including Borneo (Malaysia), Papua New Guinea (PNG), Australia, the Philippines and Alaska. Her expertise spans reservoir modelling, field development, well planning, resource and reserves assessment, assurance, project management and team leadership. |
Jeremy Iwanec is a Geoscientist with 21 years of petroleum industry experience. He completed a BSc (Honours) in Applied Geology from the University of New South Wales in 2002 before joining Oil Search Limited in 2003. At Oil Search, he worked on various projects across PNG, Yemen and Kurdistan, specialising in play-based exploration, 2D and 3D seismic interpretation, structural and stratigraphic modelling, well planning and delivery, and resource assessments. In 2021, Jeremy joined Geoscience Australia where he conducted studies of sediment-hosted energy resources through geological modelling and play-based mapping. In 2024, Jeremy began working with the NSW Department of Climate Change, Energy, the Environment and Water, focusing on long-duration energy storage technologies. |
Ray Spicer gained his qualifications from the National Centre for Petroleum Geology and Geophysics and the University of Adelaide. His experience has been gained in all aspects of petrophysics, including new ventures, exploration, appraisal, development and abandonment. As well as working within the majority of both onshore and offshore Australian basins he has also worked on, or had exposure to, basins in PNG, New Zealand, the Middle East and North Africa, Southeast Asia and the Former Soviet Union. |
David Lund is a Development Geologist with over 25 years of petroleum industry experience. He joined Horizon in 2023, working the company's China and Australian assets. Prior to joining Horizon, David was a Geological Advisor with Oil Search, working extensively on the PNG oil and gas fields, and as an Energy Resources Assessment Geoscientist with Geoscience Australia. |
Ryan Owens is an Energy Resources Geoscientist in the Energy Resources and Advice team at Geoscience Australia. He graduated from the Australian National University (ANU) in 2007 with a BSc in Geology (Honours). Subsequently, he worked in mineral exploration before undertaking further studies in paleoceanography at the Research School of Earth Sciences, ANU. Ryan joined Geoscience Australia in 2014 through the graduate program and has contributed to a variety of projects, including the northern Houtman Sub-basin prospectivity study, the Geological and Bioregional Assessment Program and Offshore Acreage Releases. |