

Automatic rock strength prediction in data-limited wells
Max Millen A * , Scott Mildren B and Thomas Flottmann AA
B

Max Millen is an operations geologist, currently working with Origin Energy on APLNG’s coal seam gas operations. He holds a BSc (EarthSc) and a MPhil (Science) from Queensland University of Technology. Previous work includes a multidisciplinary seal capacity assessment for CO2 sequestration targets. Max’s recent work has focused on reducing the geological and geomechanical uncertainty in support of drilling, completions, workover and well abandonment operations. |

Scott Mildren is a geologist and entrepreneur based in Adelaide, Australia, with over 26 years of experience in petroleum geology and geomechanics. As Managing Director of Tech Limit Pty Ltd, he oversees the development of their workflow-oriented platform for integrated geomechanical solutions. He holds a BSc (Hons) and PhD from the University of Adelaide, where he is currently a Visiting Research Fellow and Partner Investigator for an Australian Research Council funded project on multiscale geomechanical modelling of basin-scale CO2 storage. Previously, he served as Solutions Lead for Ikon Science’s Geomechanics Centre of Excellence, following their acquisition of his company, JRS Petroleum Research, in 2012. Scott is a member of several professional organisations including SPE, EAGE and AAPG, and formerly served as President of PESA’s South Australian Section. |

Thomas Flottmann is a structural geologist, holds a degree, MSc and PhD (WITS, Darmstadt, Frankfurt), and has worked for over 40 years in academia and industry; the last 15 years for Origin Energy in various technical/managerial roles. His technical focus is adaptation of geomechanical concepts for reservoir optimisation, fracture stimulation and horizontal drilling operations. Thomas is Origin’s Chief Geoscientist. |
Abstract
Understanding in situ mechanical rock properties is critical for wellbore stability, hydraulic fracturing, reservoir characterisation and remediation/abandonment operations. These properties are determined using specialised wireline log data and performing well and drill core testing to calibrate and constrain the log-derived models. However, a significant number of wells lack the required logs and tests, making accurate mechanical characterisation a significant challenge. This study presents a novel approach for the prediction of mechanical properties in these data-limited well scenarios. A specific application for this is identifying ‘weak’ points in a well to guide cement-plug pressure testing during well abandonment operations. In the area of interest for this work (Surat Basin), the most common dataset for development wells is a ‘triple-combo’ wireline logging suite. Curves acquired using this logging suite include gamma-ray, bulk density, neutron porosity and resistivity data. The proposed methodology leverages machine-learning and rock-physics relationships to predict mechanical properties in data-limited wells. Key wells were identified as having the required wireline log data, well test data and core testing to characterise and model in situ mechanical properties. Data from these wells were then used to train and test a machine-learning model and constrain rock-physics relationships allowing for characterisation of mechanical properties in data-limited wells. This work addresses a pressing industry need and is particularly relevant to operations with high well density, reducing costs and improving well integrity and regulatory compliance. Also, it highlights the potential of machine-learning and data integration in improving our understanding of subsurface rock properties in data-constrained settings.
Keywords: data-limited wells, elastic properties, geomechanics, horizontal stress, machine learning, petrophysics, supervised regression, well abandonment.
Introduction
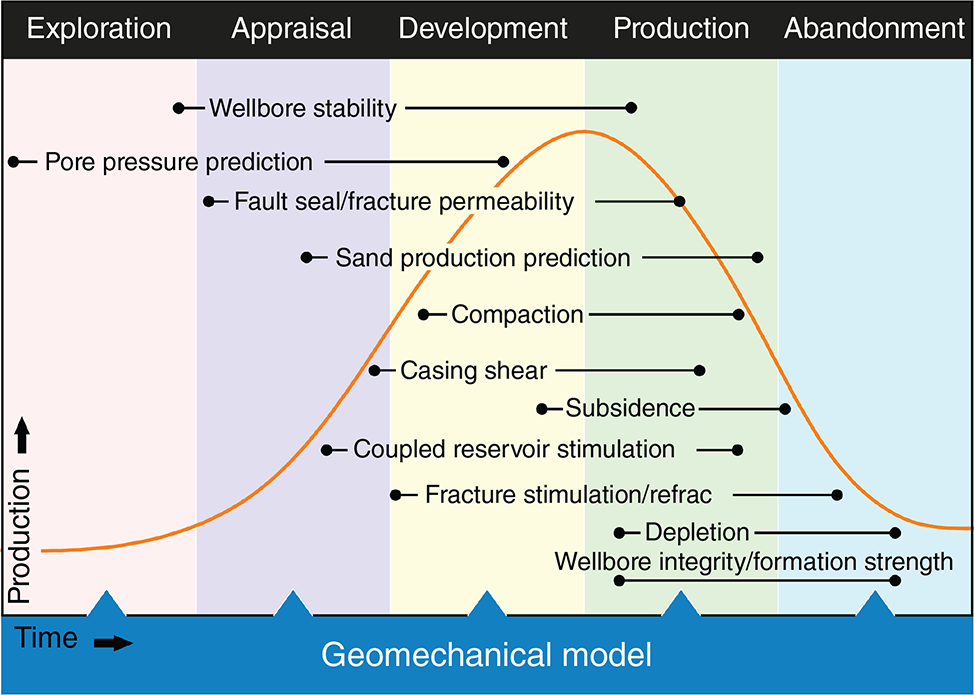
The life cycle of a well necessitates a comprehensive understanding geomechanical conditions from planning and drilling to completion, workovers and eventual abandonment (Fig. 1). During production and abandonment, several key formation properties are required to understand behaviour within the borehole: the inherent rock strength, the fracture gradient (the pressure required to create fractures at the borehole wall) and the minimum principal in situ stress in the formation away from the wellbore. An example of this is during abandonment operations, where the Code of Practice (RSHQ 2019) dictates that an abandonment plug be pressure-tested post-placement to a certain value above the weakest point in the underlying formations intersected by the well, i.e. the pressure that the borehole wall can withstand prior to leakage. The construction of a geomechanical model is required to constrain these limits and this requires a diverse and comprehensive dataset that includes an extensive wireline log set, core tests, pressure testing and image log data, to ensure accuracy and reliability.
Geomechanical modelling plays a significant role in the exploitation of oil and gas resources at all stages of the life cycle of a field from exploration to abandonment. Modified from Reservoir Geomechanics course lecture series (Zoback 2020).
Commercial coal seam gas (CSG) fields require high volumes of relatively closely spaced wells for optimal reservoir drainage and gas production; however, the economics and practicalities of this high well-density approach often preclude regular acquisition of complete datasets, resulting in a significant volume of data-limited wells with more complete datasets only available for a few key wells. This in turn compromises the ability to easily construct geomechanical models for many wells and requires an approach that optimises the use of data-rich wells.
Additionally, the time required to accurately construct a geomechanical model from wellbore data can vary significantly based on the quality and quantity of available data, the geological complexity and the specific objectives of the model itself. Commonly, a basic 1D geomechanical model can take anywhere from a few days to weeks or longer if waiting for laboratory testing of core samples. Alternative methods can involve construction of static 3D geomechanical models utilising seismic surveys, in addition to well data or geomodelling; however, the process can require multi-discipline integration and extend the timeline to months. In some instances, extended time requirements may impact negatively on the decision-making process and be at odds with operational requirements.
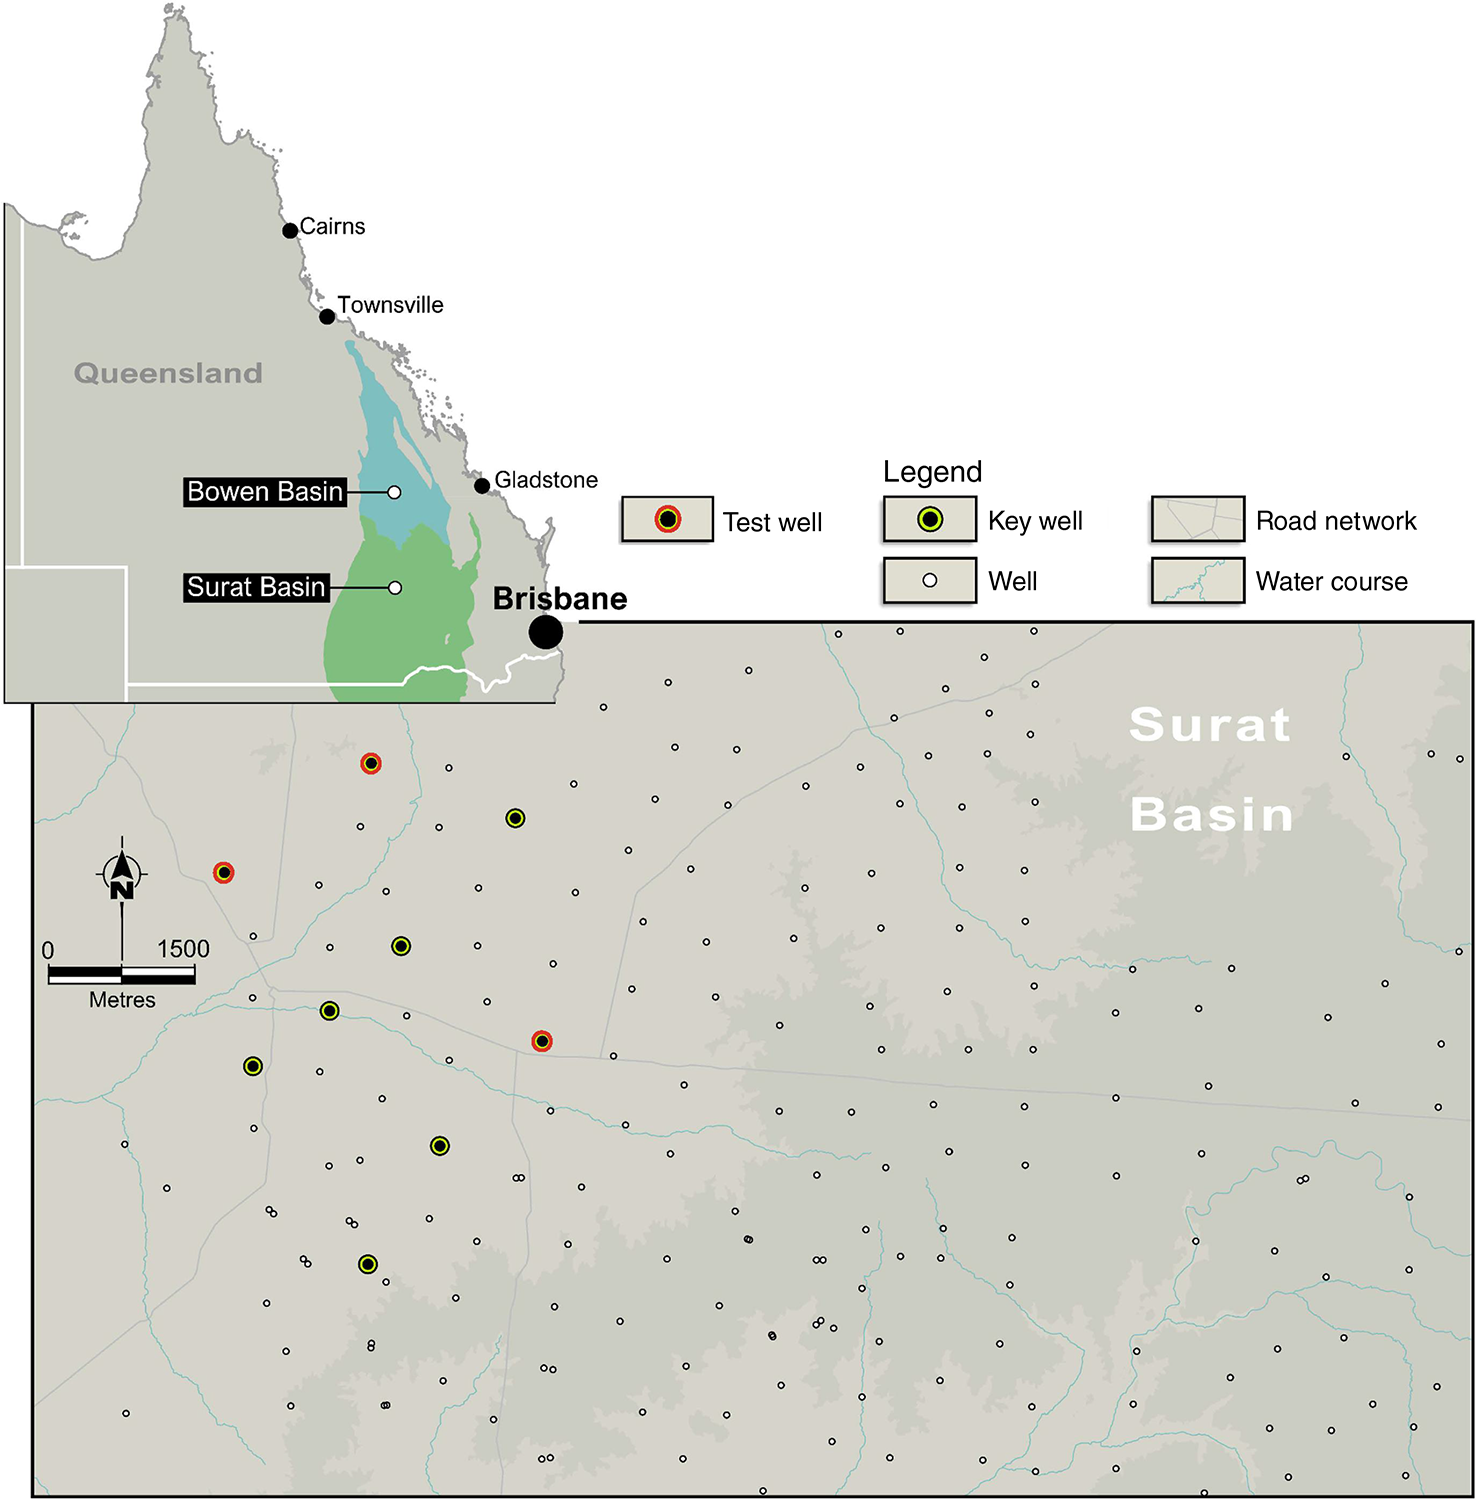
This study considers a dataset from a CSG field located within the Surat Basin of central Queensland, Australia (Fig. 2). The field has >500 operating wells across an area of almost 500 km2 with a standard well spacing of 750 m. In addition to the wells online, at the time of writing, there are a further ~130 wells currently suspended awaiting workover, remediation or abandonment.
Map of the study area showing key (and test) wells and standard development wells. CSG developments require many closely spaced wells to drain target reservoirs; however, to reduce costs, comprehensive data sets are obtained for only a few key wells (e.g. pilot or appraisal).
Most of these wells have been drilled and logged using the de-facto ‘triple-combo’ tool string which acquires a variety of data including neutron porosity, resistivity, gamma ray and density measurements. Compressional (Vp) and shear velocity (Vs) measurements, which are fundamental to deriving elastic properties and rock strengths, are not acquired in a triple-combo run, preventing the construction of geomechanical models. Furthermore, relevant core and formation testing required for robust geomechanical modelling is only present for a handful of these wells. However, a subset of nine wells across the study area had the required velocity and other data for model construction and calibration.
Here we describe a methodology that permits the construction of wellbore stress models for the data-limited wells that meet the following objectives:
Accurate prediction of velocities and derived elastic properties in data-limited wells.
Easily implemented workflow that can be executed on call with little delay.
Overcome requirement for detailed studies on well-by-well basis and minimise multi-disciplinary involvement if possible.
To this end we have implemented machine learning (ML) techniques in conjunction with a dynamically linked workflow that permits accelerated ‘drag and drop’ prediction of rock properties and stress conditions in data-limited wells.
Methods
Geomechanical modelling of data-rich wells
To establish baseline relationships and validate our approach, we first constructed comprehensive geomechanical models for the nine data-rich wells. These models served two purposes: (1) to identify key relationships between formation properties and (2) to provide reference cases for evaluating the accuracy of our proposed method for wells with limited triple-combo data only. Table 1 summarises the available data for each of these reference wells.
| Well | Wireline data | Formation test data | Core test data | |
|---|---|---|---|---|
| Key well 1 A | Triple-Combo, Acoustic, Image Log | MDT, DFIT, FS, FIT | – | |
| Key well 2 A | Triple-Combo, Acoustic, Image Log | MDT, FS, FIT | – | |
| Key well 3 A | Triple-Combo, Acoustic, Image Log | MDT, DFIT, FS, FIT | UCS, TCS, TSI, tensile strength, static material properties | |
| Key well 4 | Triple-Combo, Acoustic, Image Log | MDT, FS, FIT | – | |
| Key well 5 | Triple-Combo, Acoustic, Image Log | MDT, FS, FIT | – | |
| Key well 6 | Triple-Combo, Acoustic, Image Log | MDT, DFIT, FS, FIT | – | |
| Key well 7 | Triple-Combo, Acoustic, Image Log | MDT, FIT | UCS, TCS, MTCS, TSI, tensile strength, static material properties | |
| Key well 8 | Triple-Combo, Acoustic, Image Log | MDT, FS, FIT | – | |
| Key well 9 | Triple-Combo, Acoustic, Image Log | MDT, FS, FIT | – |
Eight wells had the results of fracture stimulation, with three of those having diagnostic injection testing to inform formation mechanical properties and in situ stress magnitudes. Two wells had comprehensive rock strength testing performed on core samples which included UCS, TCS, MTCS, TSI, tensile strength and static material property measurements (e.g. density and ultra-sonic velocity).
MDT, modular dynamic tester; DFIT, diagnostic fracture injection testing; FS, fracture stimulation; FIT, formation integrity test; UCS, unconfined compressive strength; TCS, triaxial compressive strength; TSI, TerraTek Scratch Index; MTCS, multi-stage triaxial strength.
A workflow using systematic calculations of the elastic properties, rock strength and vertical and horizontal stress magnitudes was defined in software and each calculation step was adjusted based on calibrations from appropriate tests and measurements (Fig. 3).
Creating accurate wellbore-scale geomechanical models involves integrating wireline logs, formation tests and core data. The process is iterative, with adjustments made to inputs and assumptions based on real-world data.
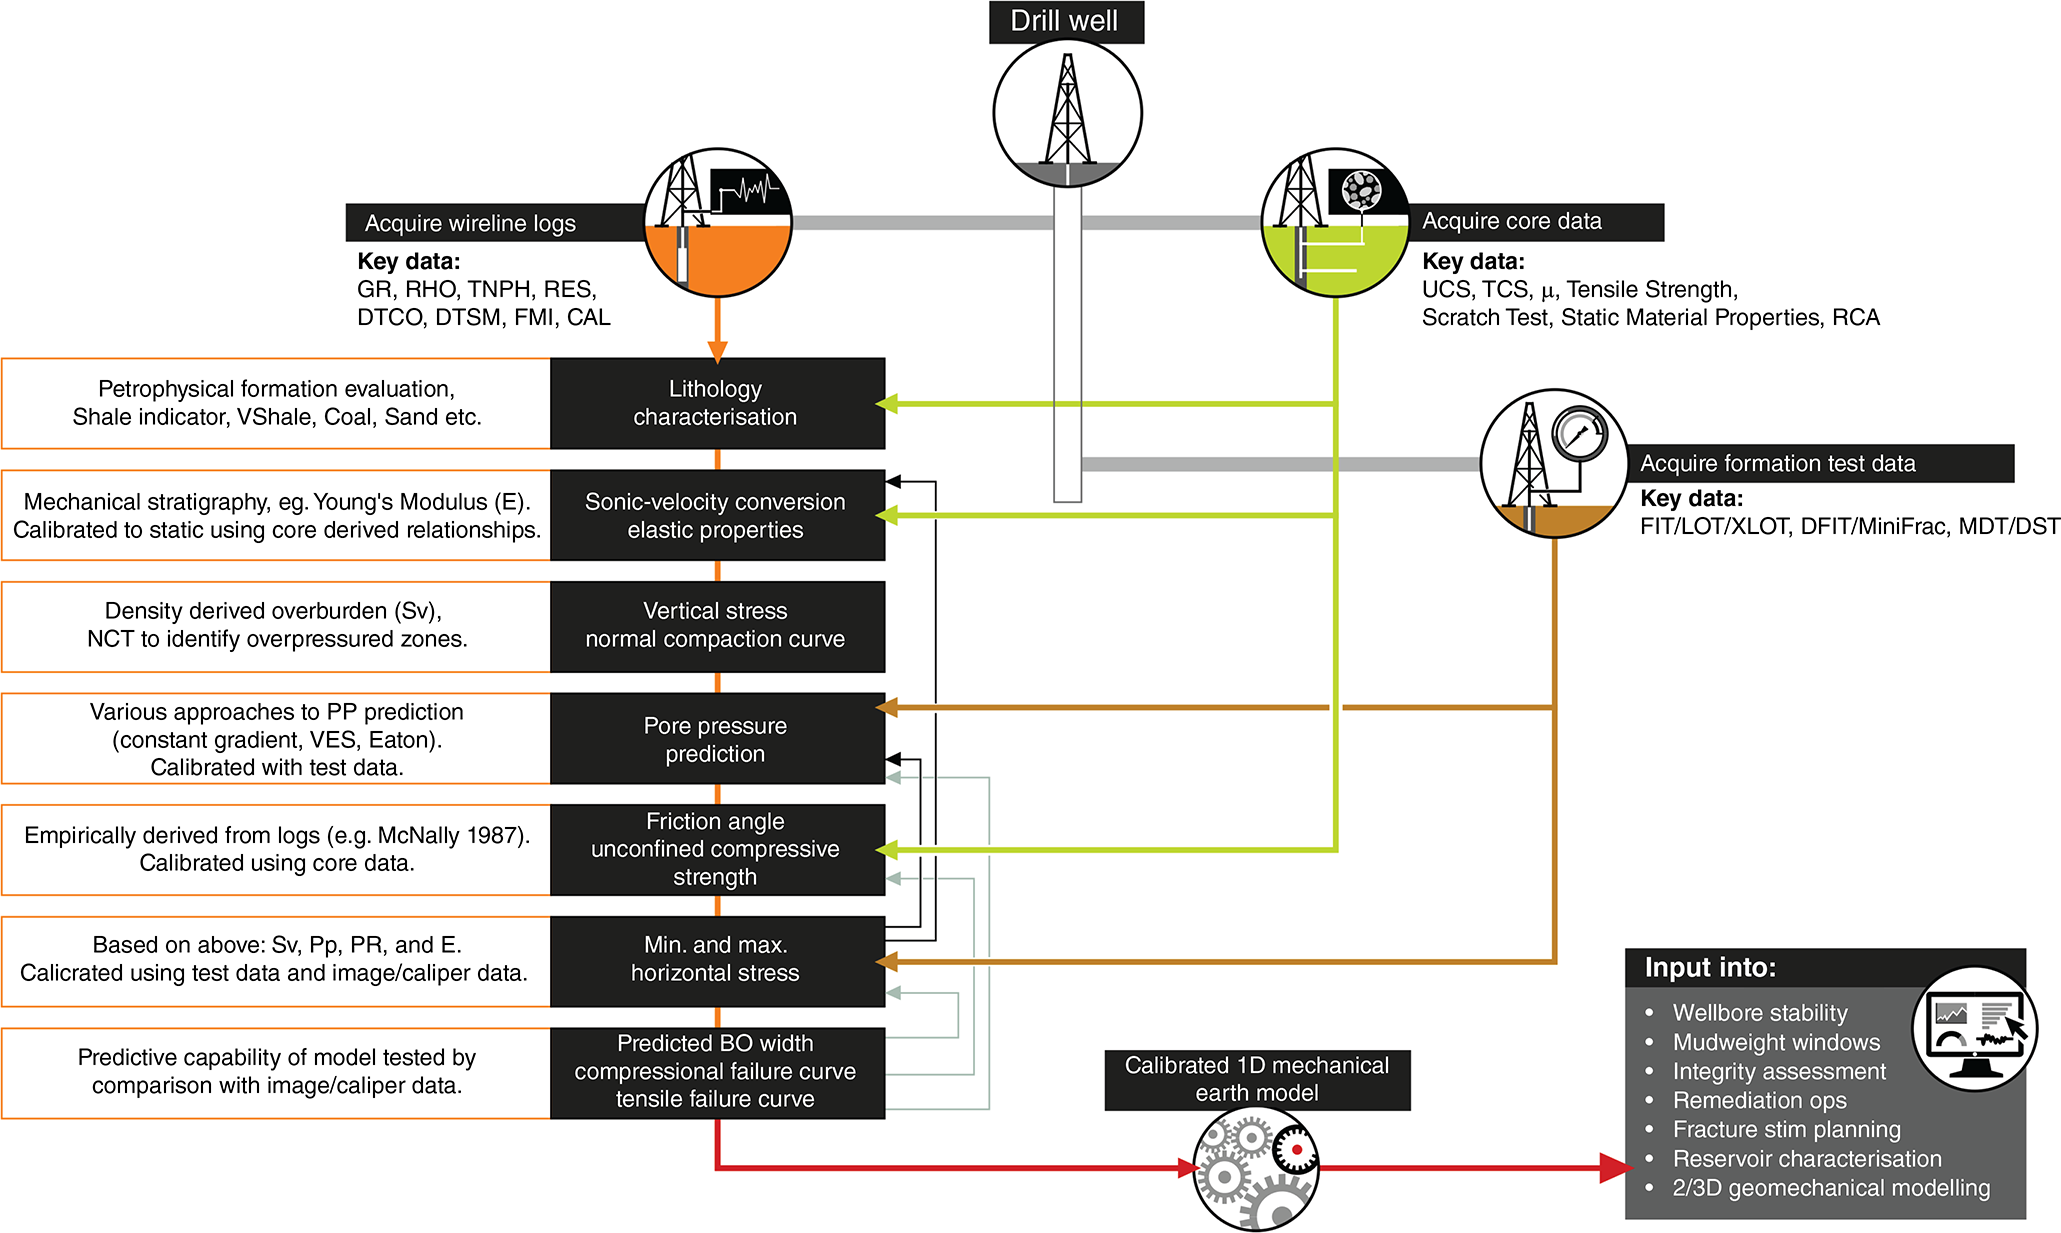
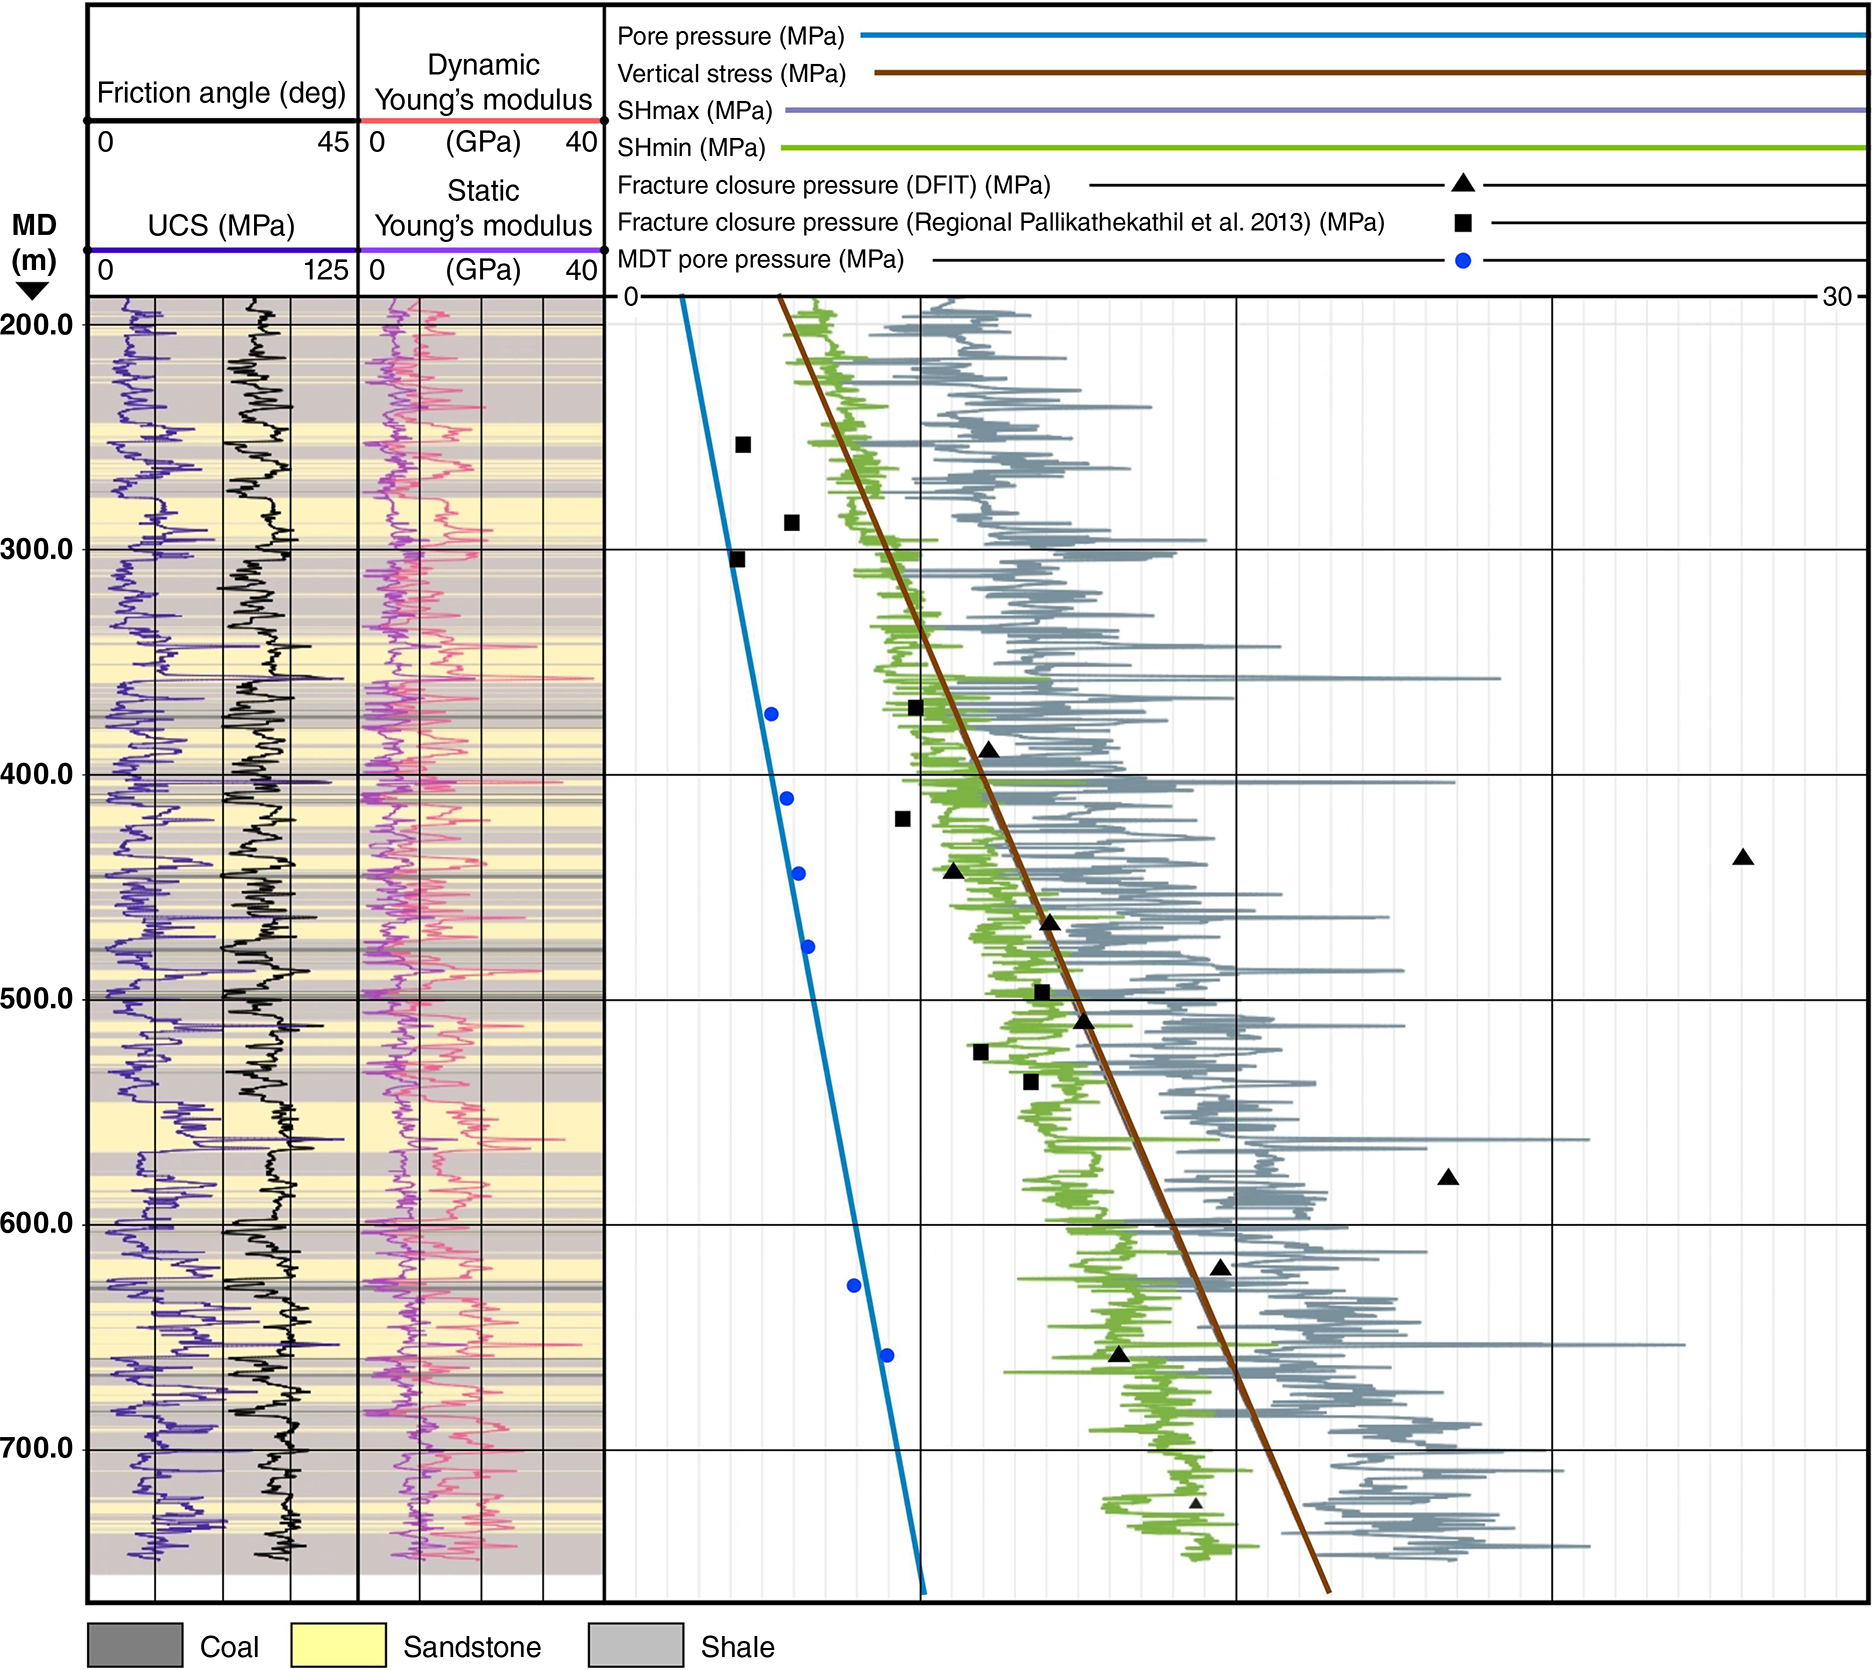
The workflow reflects the standard approach to geomechanical model construction applying poroelastic theory (Kümpel 1991; Wang 2001; Zoback 2010), permitting the calibration of dynamic property curves to static values utilising direct measurements from the laboratory or well testing. A key step in this workflow is the calculation and calibration of dynamic to static elastic properties (PR and E) from Vp and Vs. Final calibration of regional strains is made by matching wellbore deformation to geomechanical predictions of wellbore deformation (e.g. wellbore breakout and drilling induced tensile failure identified from borehole image log and caliper data) (Fig. 4).
Example of calibrated wellbore stress model for a key well. Regional DFIT data from SPE167069 (Pallikathekathil et al. 2013) were integrated into the model alongside wellbore specific data captured during drilling, completions and subsequent laboratory analysis to provide a robust view of the in situ mechanical properties.
Predicting Vp and Vs from triple combo data
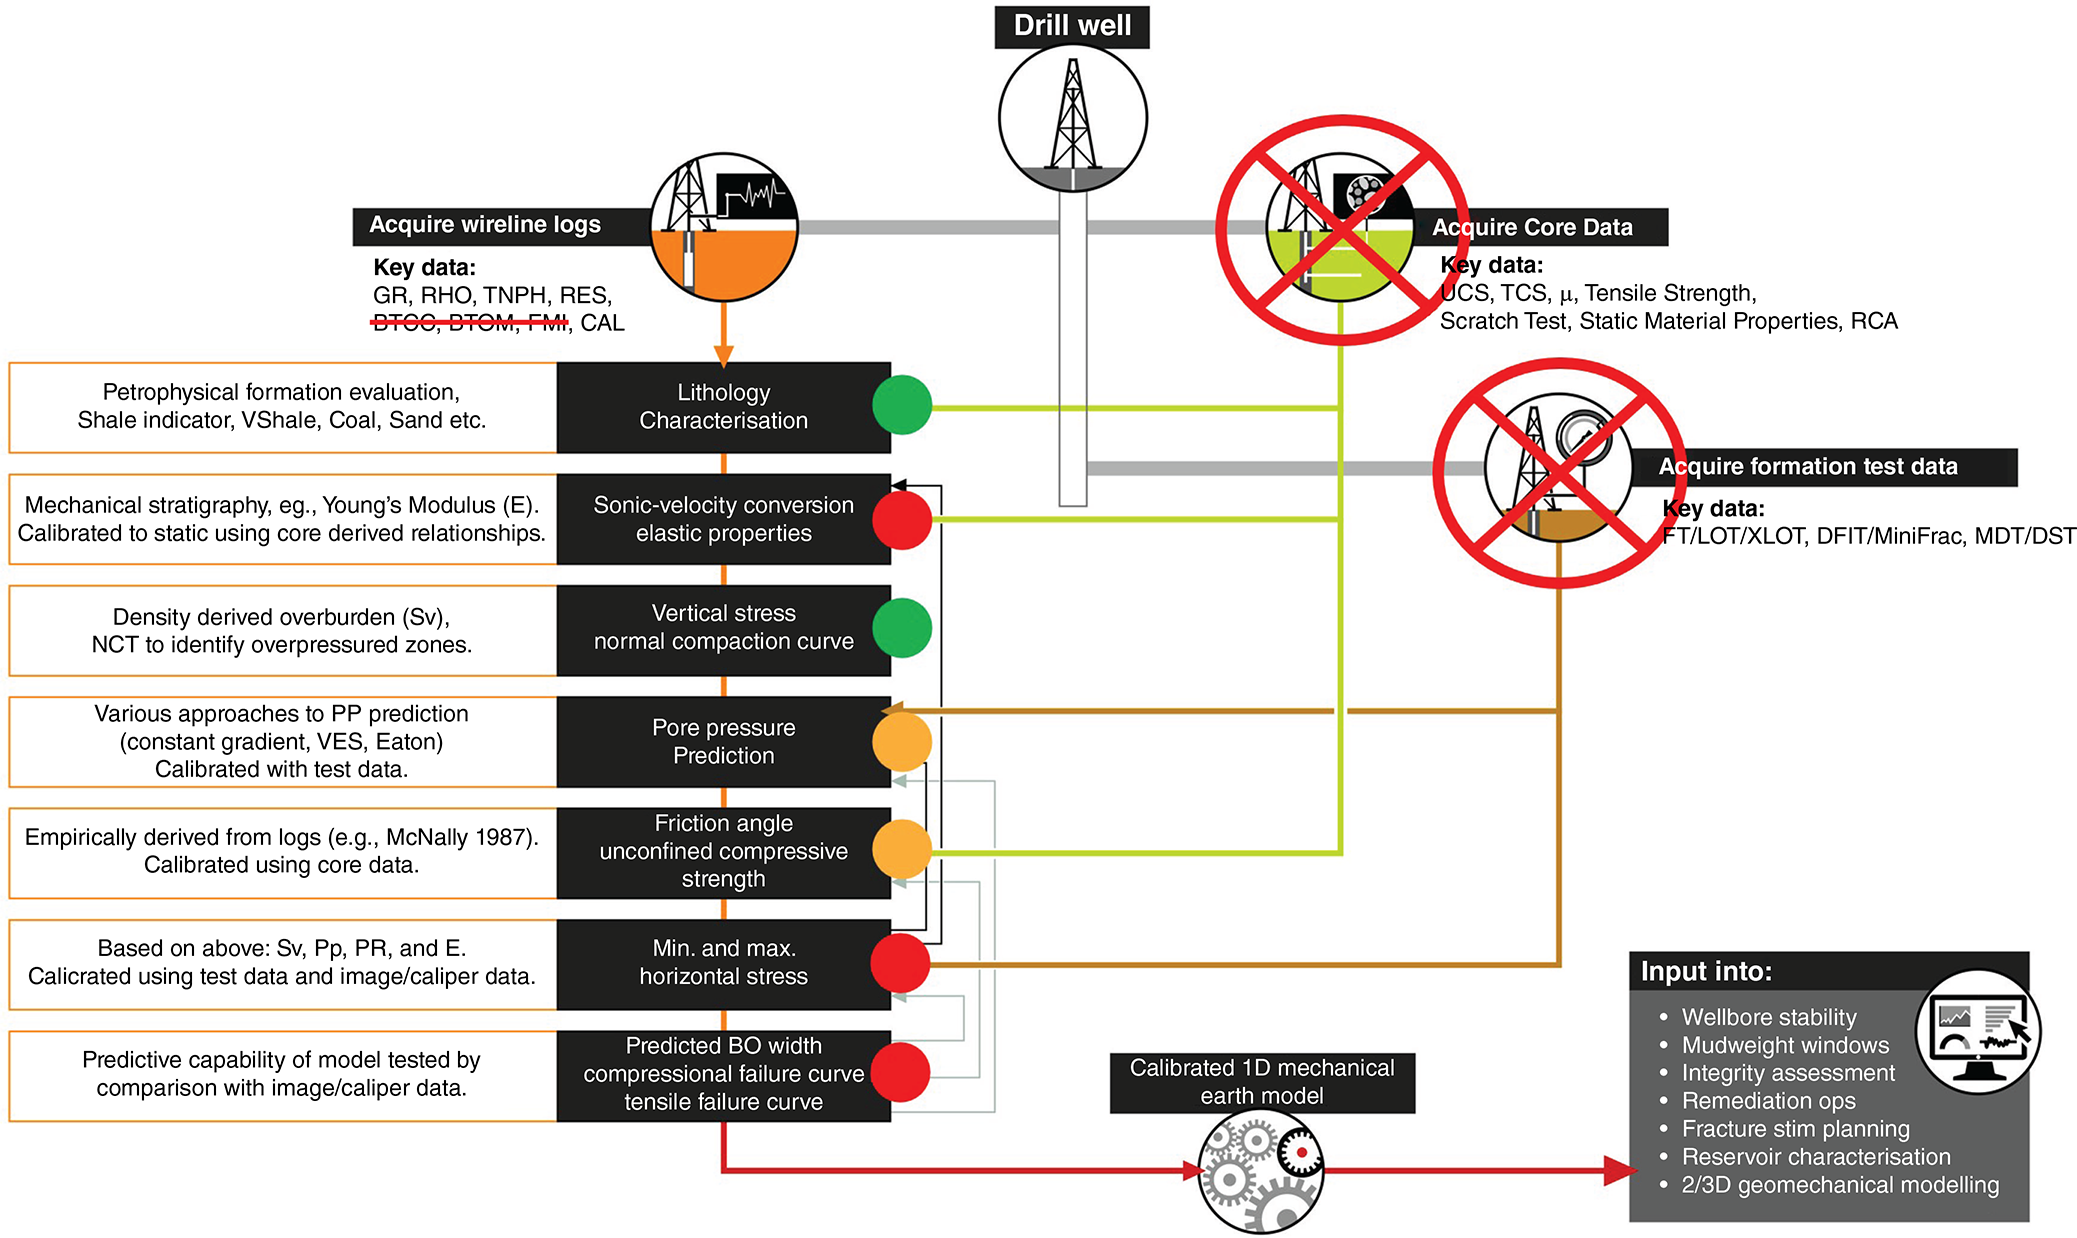
A key challenge in extending the geomechanical modelling workflow to data-limited wells is the absence of sonic velocity measurements (Fig. 5). While regional relationships from data-rich wells can compensate for missing core and well test data (providing calibrated values for regional strains, static–dynamic relationships, rock strength and friction properties), the absence of Vp and Vs presents a fundamental obstacle. These sonic measurements are essential inputs for defining the mechanical stratigraphy and deriving the regional stress profiles that form the foundation of the geomechanical model. We evaluated two approaches for velocity prediction that utilised the nine data-rich wells: conventional petrophysical correlations and a trained ML model.
In data-limited scenarios, the applied modelling workflow breaks down at various steps. Wireline log data acquisition for data-limited wells is usually limited to the minimum required for reservoir characterisation and completion design. Core and well test data are not acquired for data-limited wells. Green indicates no impact to workflow, orange indicates that the workflow is impacted with limited data, but alternative methods exist with available data, and red indicates that the workflow is impacted by limited data and no work-around exists (except synthetic log creation).
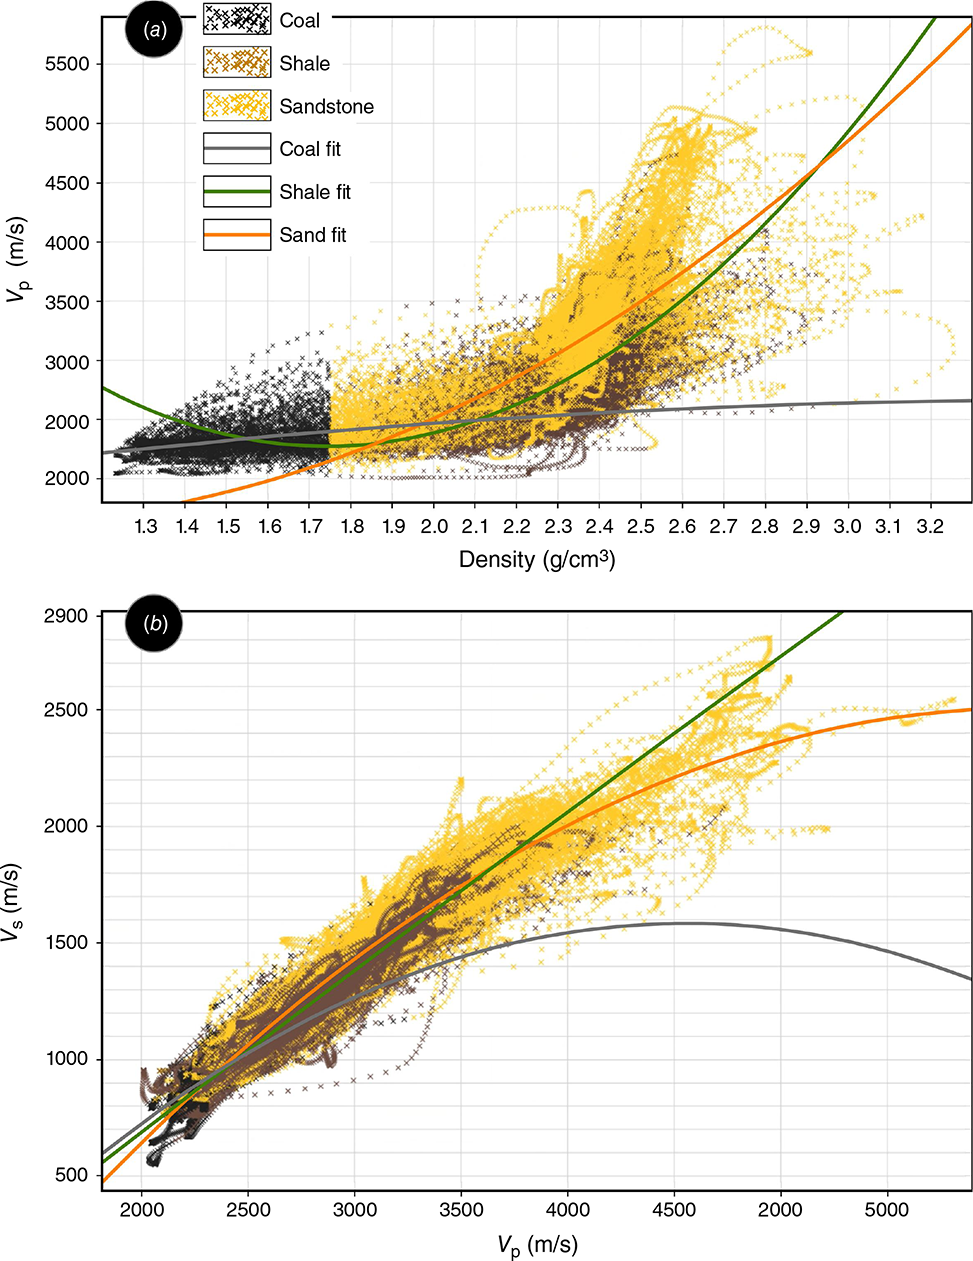
The petrophysical approach leverages well-established relationships between bulk density and Vp (Birch 1961; Gardner et al. 1974) calibrated using data from the reference wells. The logged interval within each well was classified into three lithologies (sand, shale and coal) using standard log cutoffs, with separate density–Vp and subsequently Vp–Vs relationships developed for each lithology type (Fig. 6).
Petrophysical correlation of key wells, identifying density–Vp and Vp–Vs relationships. A simple log cut-off schema is applied for facies discrimination into coal, shale and sandstone zones. (a) Density–Vp relationships are fitted for each of the litho-types and used to predict Vp in data-limited wells with density data. (b) Vp–Vs relationships are fitted for each of the litho-types and used to predict Vs from the previously predicted Vp in data-limited wells.
We evaluated three ML algorithms for velocity prediction: random forest, gradient boosting regressor and XGBoost. All models showed similar performance, indicating comparable capabilities in addressing the underlying prediction challenge. XGBoost was ultimately selected for implementation due to a slightly tighter residual pattern for mid-range values, faster training speeds and simple deployment.
XGBoost is a widely used ML algorithm that excels in regression and classification problems (Chen and Guestrin 2016). It is specifically known for its high accuracy and ability to handle complex relationships with built-in regularisation techniques to prevent overfitting. Additionally, it has highly efficient implementation that can rapidly handle large datasets, making it suitable for predicting both Vp and Vs directly from the triple combo data.
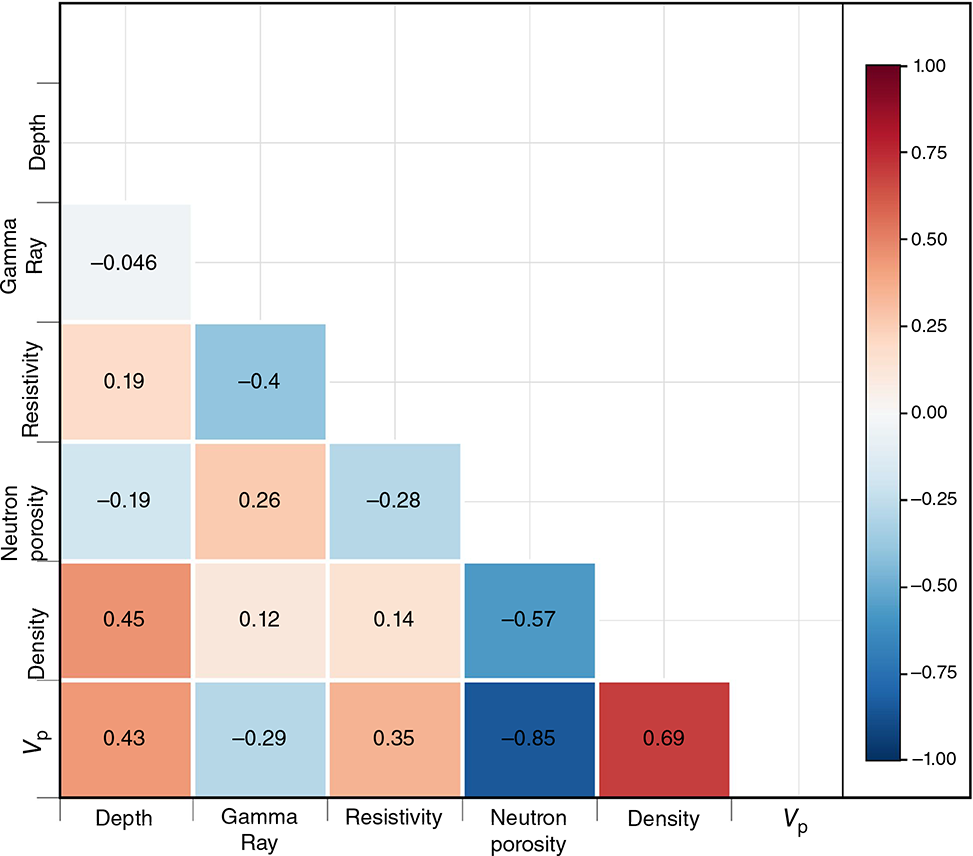
For model development, we divided the nine key wells into training and testing sets. Six of the nine key wells were utilised for training the Vp and Vs prediction models using four input features: gamma ray, density, neutron porosity and resistivity. These wells were selected to maximise the success of the model and minimise the error to the training dataset. The remaining three wells served as an independent test set to evaluate predictive performance. Fig. 7 illustrates a Pearson correlation matrix between the input features and the target Vp revealing varying correlation strengths and directions. The absence of extremely high correlations (>0.9) indicates minimal redundancy, while the diverse correlation patterns suggest each log type captures distinct formation characteristics.
An investigation of the Pearson correlation coefficients for the input features and the prediction target Vp of the training wells. Neutron porosity has the strongest correlation with Vp of the four features. Interestingly, Vp exhibits a stronger correlation with depth than gamma ray and resistivity features.
Results
Machine learning model analysis
Fig. 8 presents a comprehensive analysis of the XGBoost models performance through four diagnostic plots. Actual vs predicted values are generally distributed evenly around a 1:1 linear fit except for systematic underprediction of extreme values (>4000 m/s). The residuals analysis reveals increasing scatter with higher velocities, indicating heteroscedasticity in the model’s predictions. This pattern confirms the model’s tendency to underpredict high-velocity values and suggests varying prediction confidence across the velocity range.
XGBoost model analysis using a test well example. (a) Actual vs predicted Vp values show a reasonable distribution around a perfect fit (red dashed line of r = 1) for values below ~4000 m/s. A systematic underprediction is observed for actual values >4000 m/s. (b) Analysis of the residual shows some heteroscedasticity and again highlights poor predictions in zones with high actual Vp. (c) When plotted against depth, there is an increase in Vp with increased depth. The trend in the actual data appears to outpace the predicted values, causing an overprediction at shallow depths and an underprediction at greater depths. (d) Neutron porosity is the most important feature in the ML prediction, followed by density, resistivity and then gamma ray.
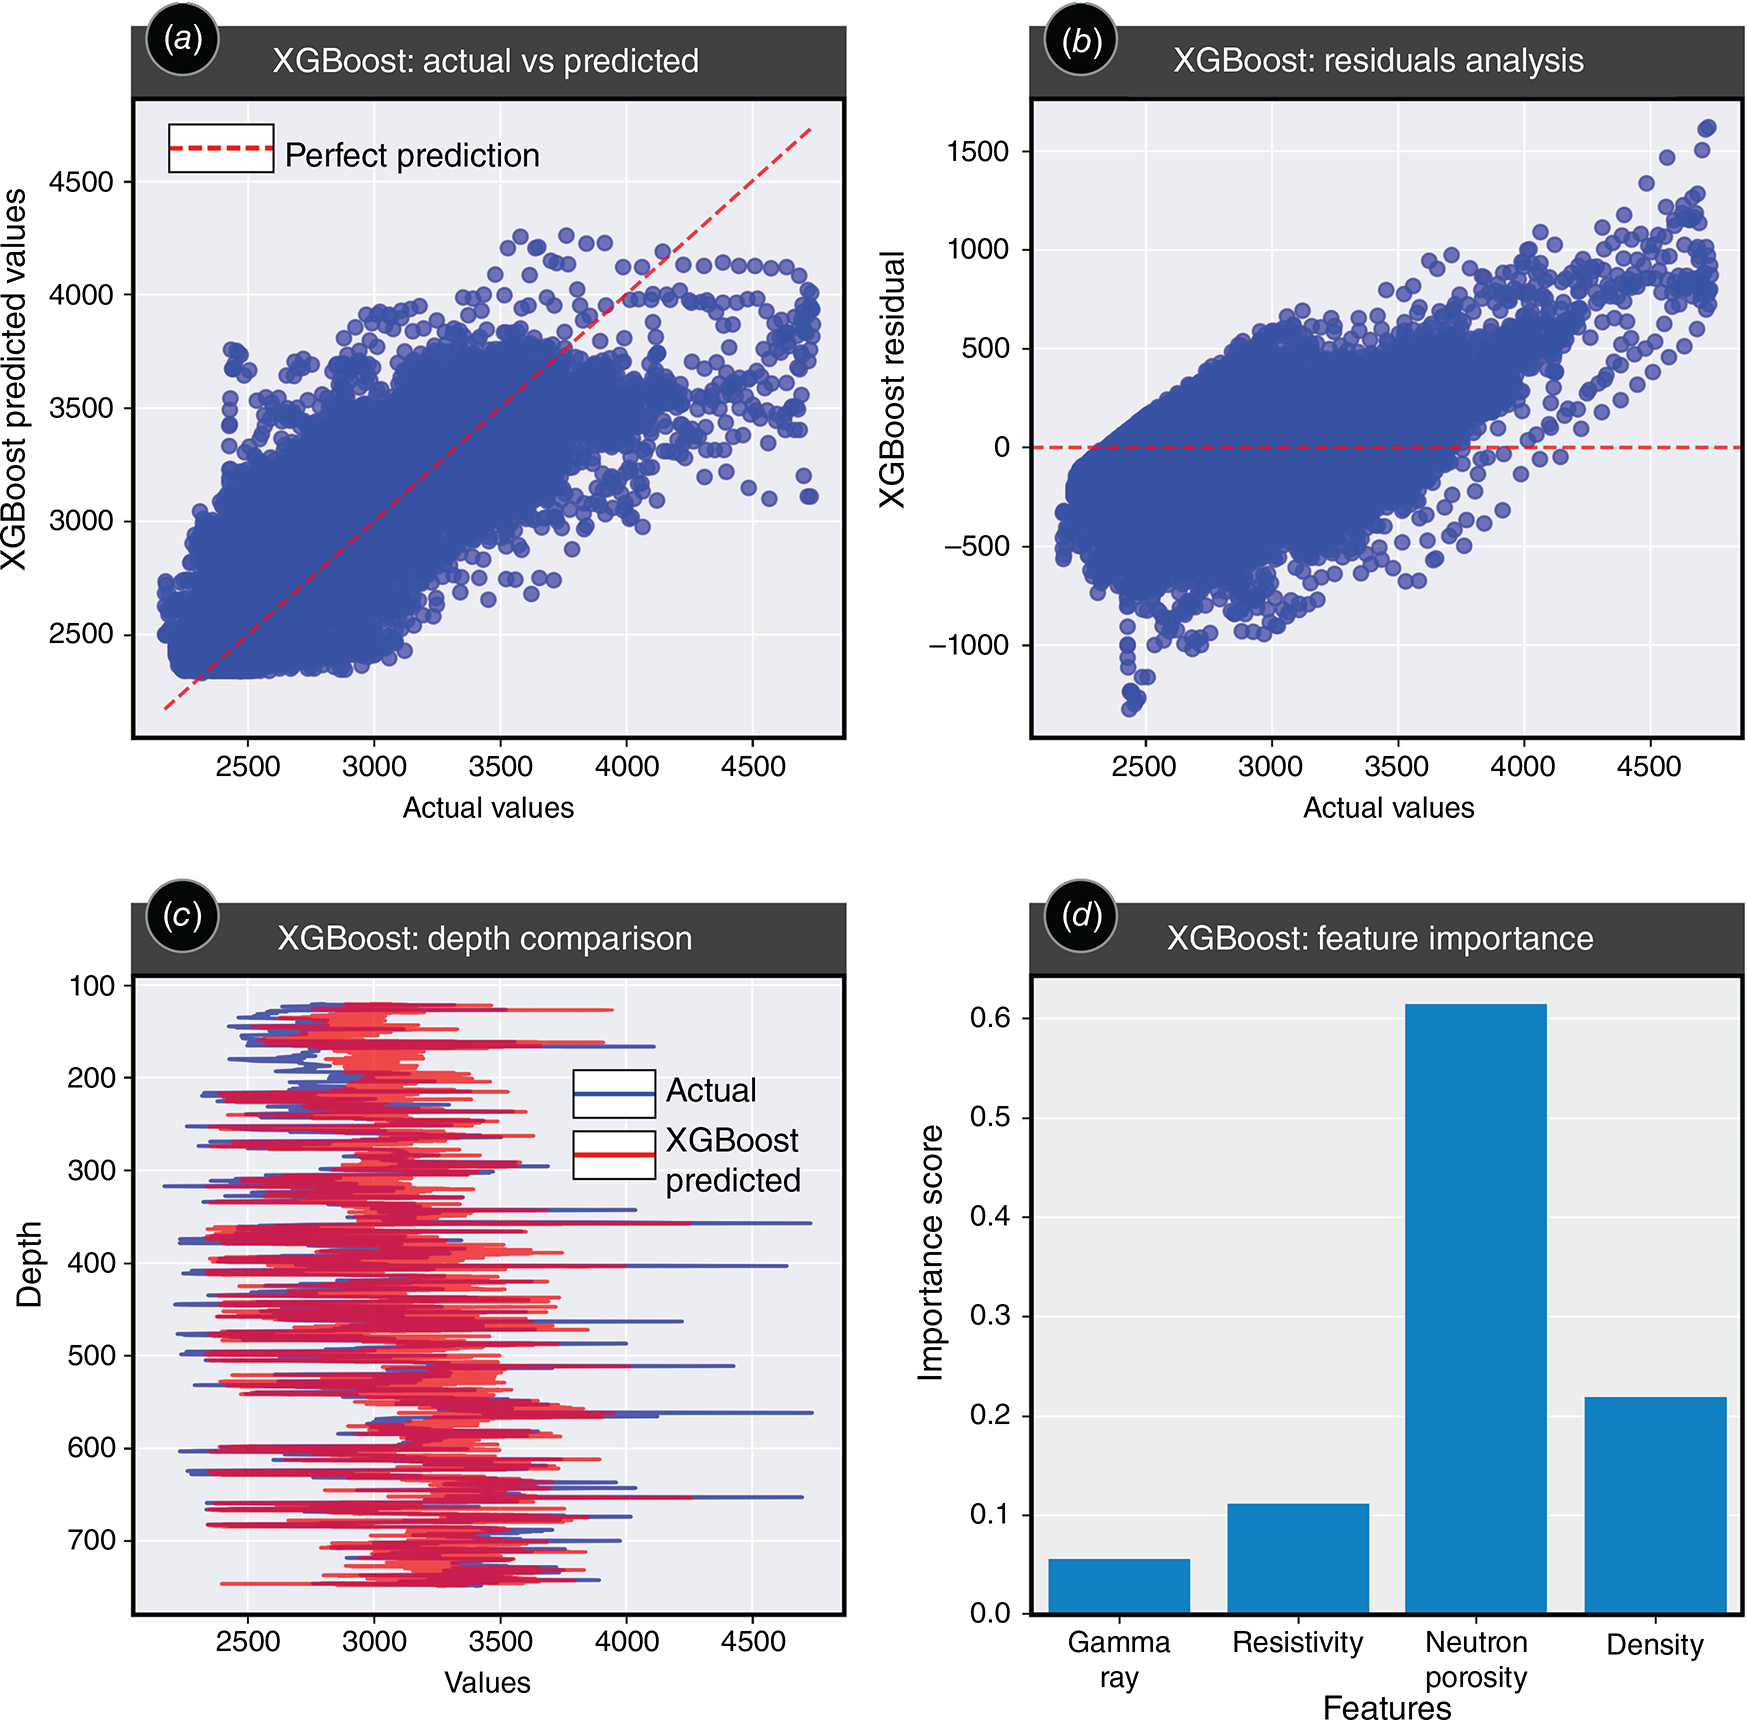
The depth plot demonstrates an increasing velocity trend with depth that is more pronounced in the actual data than the predictions. This leads to systematic overprediction at shallower depths and underprediction at greater depths. Furthermore, the actual velocity data exhibit a larger range with depth, a feature not fully captured by the model predictions.
Feature importance analysis identifies neutron porosity as the dominant predictor with a score of approximately 0.6, followed by density (0.2), resistivity (0.1) and gamma ray (0.05).
Accuracy of Vp and Vs combinations
We evaluated three combinations of the Vp and Vs predictive methods:
Petrophysical only (Pet-Pet): Vp derived from the bulk density correlation with Vs subsequently predicted from Vp–Vs correlation.
Hybrid (ML-Pet): ML-predicted Vp combined with the petrophysical prediction of Vs from Vp.
ML only (ML): both Vp and Vs derived from ML models.
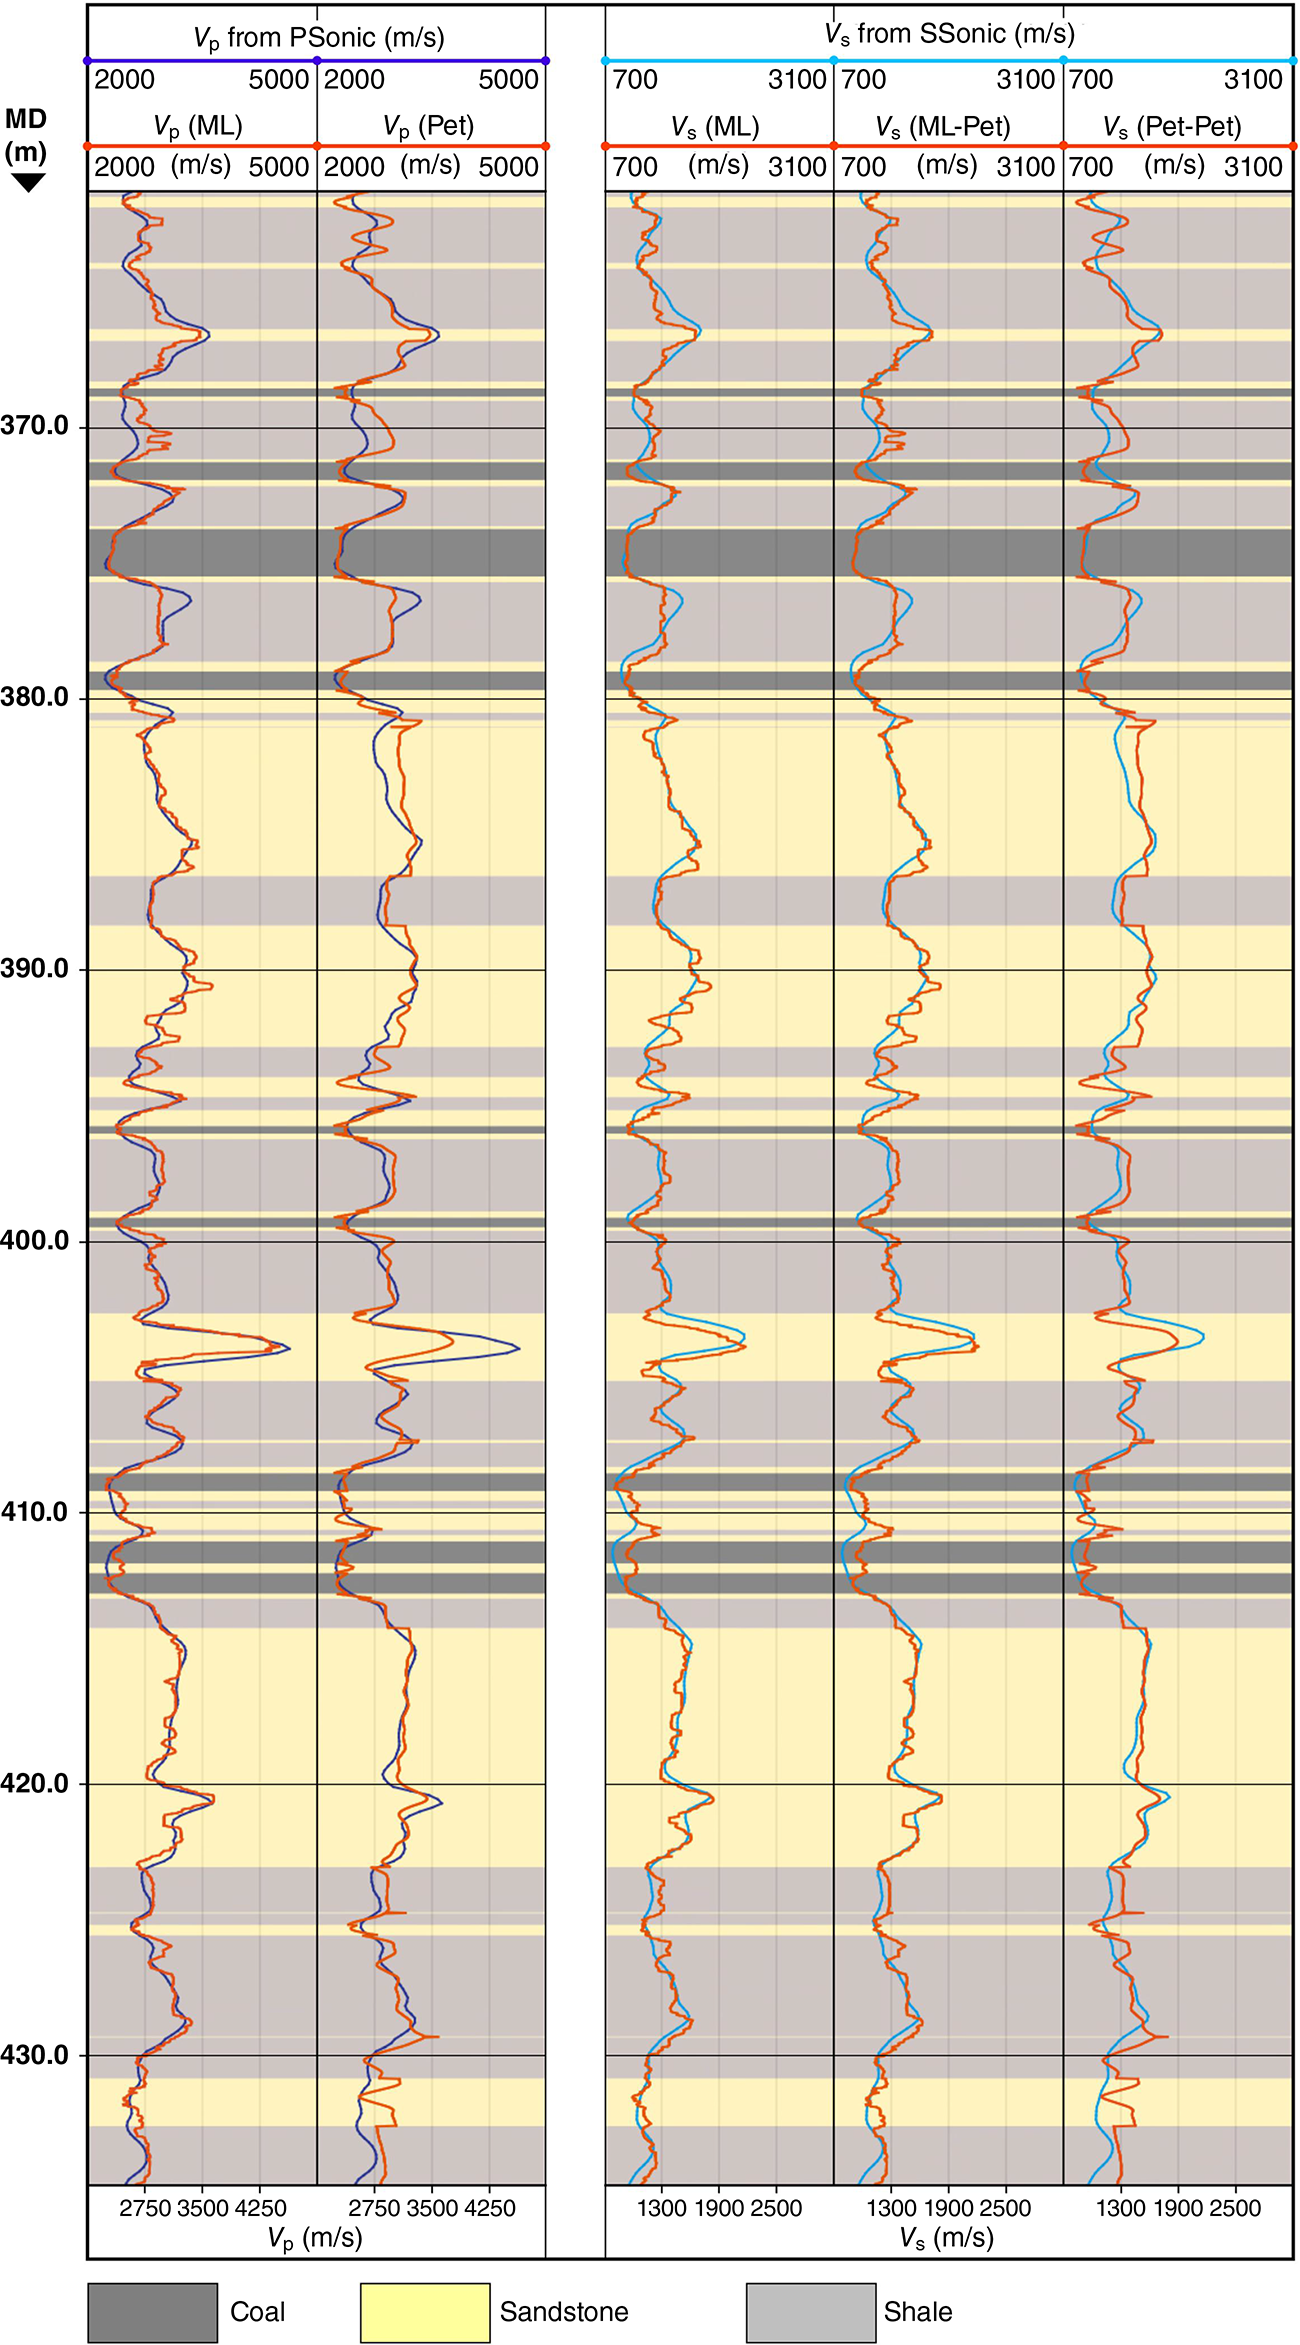
Table 2 compares the goodness-of-fit metrics for the three approaches, with an example of the predicted vs actual results for Key Well 3 shown in Fig. 9. The ML approach demonstrates superior performance in predicting Vp compared to the petrophysical method, achieving higher R2 values and lower root mean square error (RMSE) across the three test wells. For Vs prediction, both ML-based approaches (ML-Pet and ML) showed significant improvements over the Pet-Pet method, with comparable performance between the two ML-based methods. A notable advantage of the ML approach is its improved handling of layer boundaries compared to the petrophysical-based approach (Fig. 10).
| Well | Error | Vp prediction | Vs prediction | ||||
|---|---|---|---|---|---|---|---|
| ML | Pet | ML | ML-Pet | Pet-Pet | |||
| Key well 1 | RMSE | 130.46 | 218.86 | 118.45 | 119.41 | 167.21 | |
| R2 | 0.85 | 0.69 | 0.81 | 0.81 | 0.62 | ||
| Key well 2 | RMSE | 155.36 | 233.15 | 103.11 | 107.16 | 166.04 | |
| R2 | 0.80 | 0.57 | 0.83 | 0.82 | 0.56 | ||
| Key well 3 | RMSE | 146.68 | 261.11 | 124.68 | 123.19 | 174.65 | |
| R2 | 0.87 | 0.53 | 0.79 | 0.79 | 0.58 | ||
Actual vs predicted Vp and Vs for a test well using the various approaches. Orange curves are the predicted values with purple and blue being the actual Vp and Vs respectively.
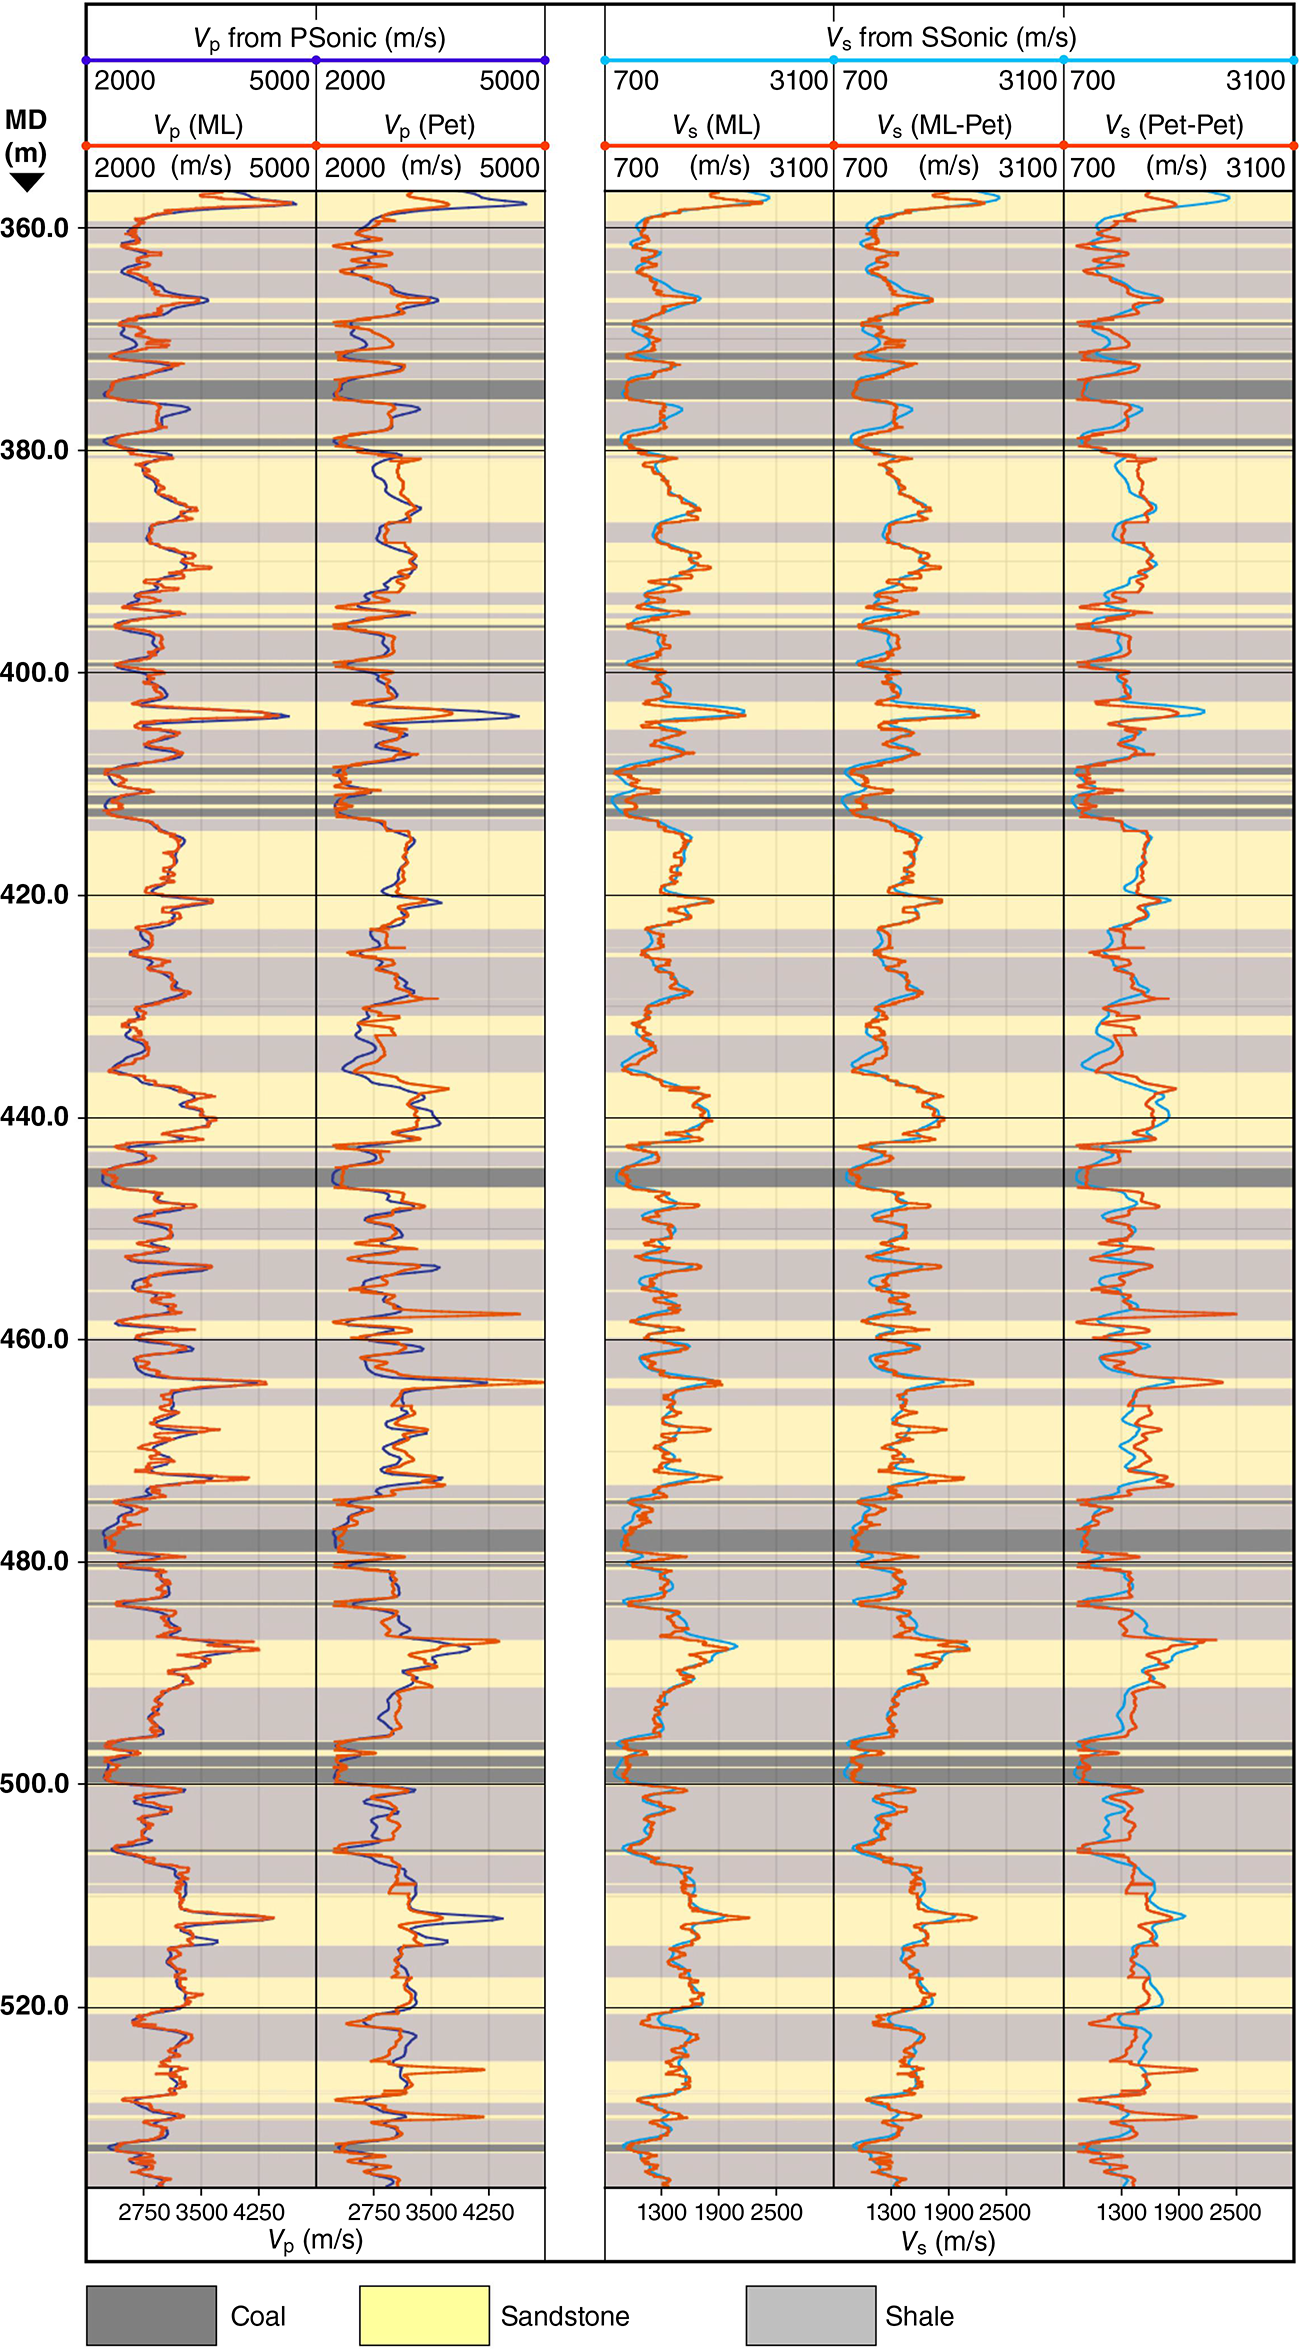
A larger scale view of the actual vs predicted Vp and Vs. The ML approach provides a more robust prediction of actual Vp and Vs than the petrophysical approach. This is especially apparent in heterogeneous stratigraphy where lithological cutoffs lead to artificially sharp layer boundaries in the petrophysical model.
Geomechanical modelling from triple combo data
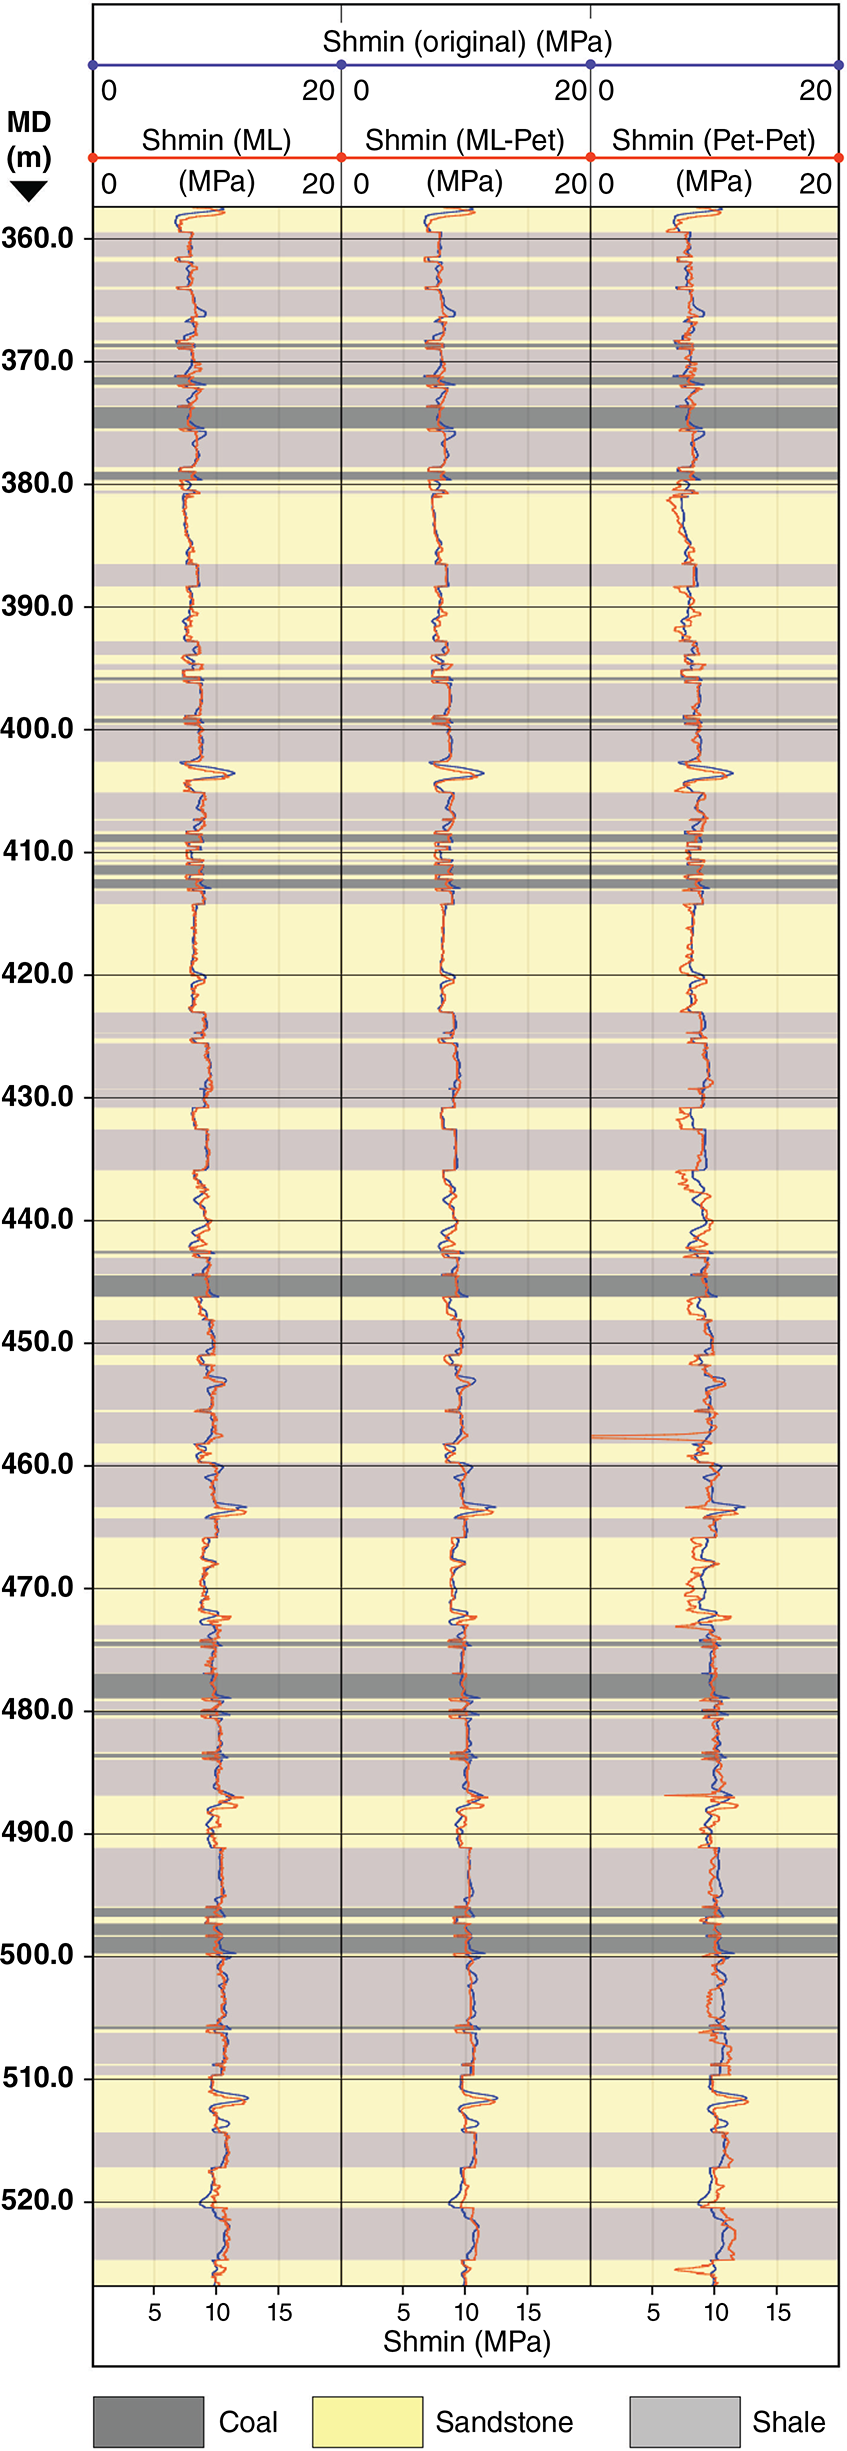
Geomechanical models were built for each of the three test wells, using each of the velocity prediction methods (ML, ML-Pet and Pet-Pet) and the calibrated parameters from the initial modelling of the key wells that includes regional strains, static–dynamic relationships, compressional/tensile rock strength and friction. The accuracy of the resulting horizontal stress predictions (Shmin and Shmax) is summarised in Table 3. Except for the Shmax from the Pet-Pet approach, which showed poorer performance, all methods produced comparable results in terms of goodness-of-fit to the measured stress profiles. Fig. 11 illustrates the consistency by comparing the predicted vs actual Shmin profiles for a representative test well.
| Well | Error | Shmin Comparison | Shmax Comparison | |||||
|---|---|---|---|---|---|---|---|---|
| ML | ML-Pet | Pet-Pet | ML | ML-Pet | Pet-Pet | |||
| Key well 1 | RMSE | 0.43 | 0.42 | 0.46 | 0.6 | 0.63 | 1.04 | |
| R2 | 0.98 | 0.98 | 0.97 | 0.97 | 0.97 | 0.92 | ||
| Key well 2 | RMSE | 0.35 | 0.36 | 0.41 | 0.7 | 0.71 | 1.04 | |
| R2 | 0.99 | 0.98 | 0.98 | 0.96 | 0.96 | 0.92 | ||
| Key well 3 | RMSE | 0.39 | 0.4 | 0.42 | 0.83 | 0.84 | 1.15 | |
| R2 | 0.98 | 0.98 | 0.98 | 0.96 | 0.96 | 0.92 | ||
Discussion
The ML approach demonstrated superior performance in velocity prediction compared to petrophysical correlations, while requiring significantly less implementation time – even with our simplified petrophysical workflow. The error analysis (Table 2) highlights this improved predictive capability. The depth-dependent patterns observed in the predictions (Fig. 8) and the moderately positive correlation with Vp (behind neutron porosity and density) suggests that incorporating depth as an additional input feature may improve predictive capability of the ML approach. Interestingly, the ML-Pet approach for Vs prediction achieved comparable accuracy to the ML prediction, suggesting that a robust Vp prediction is critical for Vs prediction when implementing a traditional petrophysical correlation method.
While more sophisticated petrophysical relationships might improve the Pet-Pet predictions, such refinements would have compromised our objective of developing a rapid, accessible workflow. Additionally, the strong correlation between neutron porosity and Vp (Fig. 7) suggests that a neutron porosity–Vp relationship might have been more effective than the conventional density–Vp approach. A key advantage of the ML method is its ability to predict velocities without requiring pre-defined lithological classifications, thereby eliminating artificial layer boundary effects from the predicted velocity curves (Fig. 8).
The consistency in stress predictions across different approaches to velocity estimation (Table 3) demonstrates the robustness of the modelling workflow. This also highlights the importance of well-calibrated reference models that constrain regional strains, static–dynamic relationships, compressional/tensile rock strength and friction properties among other critical inputs. It also highlights the opportunity to minimise multi-disciplinary (e.g. petrophysicists and geomechanists) inputs for routine, operational tasks being conducted at short notice, for data-limited wells (e.g. establishing satisfactory pressure values for abandonment cement-plug tests to meet regulatory requirements).
Conclusions
This study evaluated ML and petrophysical correlation approaches for predicting sonic velocities in data-limited wells to support geomechanical modelling. Our investigation yielded several key findings: ML using data commonly available across most data-limited wells as features (neutron porosity, resistivity, gamma ray and density) proved to be a very quick and accurate methodology for predicting velocities.
Depth-related trends in Vp were evident and did not appear to have been adequately addressed with the four features used in the ML prediction. Inclusion of depth as an input feature should be considered in future implementations.
Traditional petrophysical correlation, while functional, proved less accurate and more time consuming than the ML approach, even with simplified lithology discriminations.
Horizontal stress predictions were relatively robust, independent of technique.
The ML approach provides a powerful platform for rapid geomechanical insight for non-subject matter experts when used in conjunction with a dynamically linked modelling workflow calibrated to data-rich key wells.
The results of this study support the validity of using ML to quickly and accurately predict Vp and Vs data for data-limited wells; however, robust modelling and calibration of data-rich wells is critical.
A ‘drag and drop’ type workflow for quickly working up data-limited wells frees up resources for skilled workers to focus on creating, calibrating and fine-tuning wellbore mechanical models for crucial data-rich key wells while others can quickly apply these models to many data-limited development wells on an as-needed basis. However, reduced expert oversight poses a risk of utilising invalid outputs or data being used incorrectly or for unintended purposes.
The geological and geographical limits of this ML application remain undefined. Further investigation is required to determine whether models trained on specific fields can be extended to broader areas (e.g. within a defined radius, the entire Surat Basin, or across similar sedimentary basins) before broader application.
Data availability
The data that support this study cannot be publicly shared due to ethical or privacy reasons and may be shared upon reasonable request to the corresponding author if appropriate.
Acknowledgements
Steve Pickard is thanked for his contribution to the drafting and visualisation support.
References
Birch F (1961) The velocity of compressional waves in rocks to 10 kilobars: 2. Journal of Geophysical Research 66(7), 2199-2224.
| Crossref | Google Scholar |
Chen T, Guestrin C (2016) XGBoost: A Scalable Tree Boosting System, In ‘Proceedings of the 22nd ACM SIGKDD International Conference on Knowledge Discovery and Data Mining’, New York, NY, USA. pp. 785–794. (Association for Computing Machinery) 10.1145/2939672.2939785
Gardner GHF, Gardner LW, Gregory AR (1974) Formation Velocity and density – the diagnostic basics for stratigraphic traps. Geophysics 39(6), 770-780.
| Crossref | Google Scholar |
Kümpel H-J (1991) Poroelasticity: Parameters reviewed. Geophysical Journal International 105, 783-799.
| Crossref | Google Scholar |
Pallikathekathil ZJ, Puspitasari R, Altaf I, et al. (2013) Calibrated Mechanical Earth Models Answer Questions on Hydraulic Fracture Containment and Wellbore Stability in Some of the CSG Wells in the Bowen Basin. Paper presented at the SPE Unconventional Resources Conference and Exhibition-Asia Pacific, Brisbane, Australia, November 2013. (Society for Petroleum Engineers) 10.2118/167069-MS
RSHQ (2019) ‘Code of Practice for the Construction and Abandonment of Petroleum Wells and Associated Bores in Queensland.’ (Resources Safety and Health Queensland). Available at https://www.rshq.qld.gov.au/__data/assets/pdf_file/0006/1461093/code-of-practice-petroleum-wells-bores.pdf
Max Millen is an operations geologist, currently working with Origin Energy on APLNG’s coal seam gas operations. He holds a BSc (EarthSc) and a MPhil (Science) from Queensland University of Technology. Previous work includes a multidisciplinary seal capacity assessment for CO2 sequestration targets. Max’s recent work has focused on reducing the geological and geomechanical uncertainty in support of drilling, completions, workover and well abandonment operations. |
Scott Mildren is a geologist and entrepreneur based in Adelaide, Australia, with over 26 years of experience in petroleum geology and geomechanics. As Managing Director of Tech Limit Pty Ltd, he oversees the development of their workflow-oriented platform for integrated geomechanical solutions. He holds a BSc (Hons) and PhD from the University of Adelaide, where he is currently a Visiting Research Fellow and Partner Investigator for an Australian Research Council funded project on multiscale geomechanical modelling of basin-scale CO2 storage. Previously, he served as Solutions Lead for Ikon Science’s Geomechanics Centre of Excellence, following their acquisition of his company, JRS Petroleum Research, in 2012. Scott is a member of several professional organisations including SPE, EAGE and AAPG, and formerly served as President of PESA’s South Australian Section. |
Thomas Flottmann is a structural geologist, holds a degree, MSc and PhD (WITS, Darmstadt, Frankfurt), and has worked for over 40 years in academia and industry; the last 15 years for Origin Energy in various technical/managerial roles. His technical focus is adaptation of geomechanical concepts for reservoir optimisation, fracture stimulation and horizontal drilling operations. Thomas is Origin’s Chief Geoscientist. |