

An online system for calculating and delivering long-term carrying capacity information for Queensland grazing properties. Part 2: modelling and outputs
B. Zhang A D , G. Fraser A , J. Carter B , G. Stone A , S. Irvine A , G. Whish C , J. Willcocks A and G. McKeon AA Grazing Land Systems, Queensland Department of Environment and Science, Brisbane, Queensland 4001, Australia.
B Remote Sensing Centre, Queensland Department of Environment and Science, Brisbane, Queensland 4001, Australia.
C Animal Science, Queensland Department of Agriculture and Fisheries, Brisbane, Queensland 4001, Australia.
D Corresponding author: Email: baisen.zhang@qld.gov.au
The Rangeland Journal 43(3) 159-172 https://doi.org/10.1071/RJ20088
Submitted: 3 September 2020 Accepted: 17 September 2021 Published: 26 October 2021
Journal Compilation © Australian Rangeland Society 2021 Open Access CC BY-NC-ND
Abstract
A combination of field data and models have been used to estimate long-term carrying capacity (LTCC) of domestic livestock in Queensland grazing lands. These methods have been synthesised and coupled with recent developments in science and information technology to provide a fully-automated approach of modelling LTCC through the FORAGE online system. In this study, the GRASP model was used to simulate pasture growth with parameter sets and safe pasture utilisation rates defined for 225 land types across Queensland. Distance to water points was used to assess the accessibility of pastures to livestock. Spatial analysis classified the property into unique areas based on paddock, land type and distance to water points, which estimated pasture growth, pasture utilisation and accessibility at a sub-paddock scale. Thirteen foliage projective cover (FPC) classes were used in modelling the pasture system to deal with the non-linear relationship between tree and grass interactions. As ‘proof of concept’, remotely-sensed individual-date green ground cover data were used to optimise the GRASP model parameters to improve the model performance, and a Monte Carlo analysis provided uncertainty estimates for model outcomes. The framework provides an efficient and standardised method for estimating LTCC. To test the system, LTCCs from 43 ‘benchmark’ properties were compared with simulated LTCCs, and 65% of the modelled LTCCs were within ± 25% of the benchmark LTCCs. Due to uncertainties in model inputs at the property scale and in model simulation, the modelled LTCC should be used as a starting point for further refinement of actual property LTCC.
Keywords: adult equivalent, domestic livestock carrying capacity, land condition, optimisation, safe utilisation.
Introduction
Australia’s northern grazing lands have one of the most variable climates in the world (Fatichi et al. 2012), where multi-year wet and dry periods are a major climatic feature (Henry et al. 2007; McKeon et al. 2021). Grazing enterprises operating in these regions often have difficulty in matching domestic livestock numbers to available pasture due to high year-to-year and longer-term variability in rainfall (Stone et al. 2019; McKeon et al. 2021) and pasture growth (O’Reagain et al. 2014). Many graziers manage the grazing pressure well in response to the variable climate; however, high livestock numbers in drought periods have resulted in land degradation, with reduced pasture growth and soil loss (McKeon et al. 2004).
Stocking conservatively provides a feed reserve in drought years and increased potential for pasture recovery from drought in wetter years (O’Reagain et al. 2014). A long-term carrying capacity (LTCC) has been advocated (Stone et al. 2021), which has proven to be a simple but successful mechanism to achieve long-term productivity and sustainability (Scanlan et al. 1994; Johnston et al. 1996a, 1996b; Hall et al. 1998; McKeon et al. 2009; Whish et al. 2016). The LTCC is generally considered to be the number of domestic livestock that a paddock or property can support (on average) over a long period (multiple decades) without causing a reduction in land condition, allowing for pasture recovery after drought and minimising the frequency of forced responses to extreme drought (O’Reagain et al. 2014, 2018).
The LTCC of a property is determined by several factors including long-term annual pasture growth, an estimate of safe pasture utilisation rate and an estimate of animal intake. Additionally, distance to water for domestic livestock, grazing preference, topography and woody vegetation cover also influence pasture growth and accessibility (Scanlan et al. 1994; Johnston et al. 1996a, 1996b; Hall et al. 1998; Hunt et al. 2014; Cowley et al. 2015). Safe pasture utilisation is defined as the percentage of annual pasture growth eaten by domestic livestock that is not likely to cause long-term resource degradation, thus allowing for recovery of pastures after drought, and is generally between 10–30%, depending on rainfall variability, fertility and pasture composition (Johnston et al. 1996a, 1996b; Hall et al. 1998; Hunt 2008). For LTCC calculations, average long-term safe utilisations have been derived initially from grazier experience and simulated pasture growth (e.g. Scanlan et al. 1994; Johnston et al. 1996a, 1996b; Hall et al. 1998).
Modelling approaches to derive LTCC estimates have been developed over time and in parallel with computing/technological improvements (e.g. Scanlan et al. 1994; Johnston et al. 1996a, 1996b; Hall et al. 1998; Whish and Holloway 2016); however, they remain labour intensive, with the potential for inaccuracies in each type of data input (e.g. multiple land/pasture type mixtures, woody vegetation cover and water points). A more efficient, robust and automated approach that uses the latest spatial datasets, pasture models and information technology, was advocated for by the grazing industry, consultants and extension officers to estimate LTCC for facilitating grazing land and stock management decisions on a Queensland-wide basis (Whish and Holloway 2016).
FORAGE (https://www.longpaddock.qld.gov.au/forage/) is an online system that provides property-scale information for grazing land and environmental management. The system interfaces with a range of datasets (e.g. climate, soils, woody vegetation cover and satellite-derived ground cover) via the Queensland Government high performance computer (HPC), performs modelling analyses and data processing, and offers reports on climate, pasture growth and ground cover (Zhang and Carter 2018). The LTCC report (e.g. Stone et al. 2021) is the latest product in the FORAGE suite of reports. A comprehensive synthesis of the advances in grazing land sciences and modelling over the last a couple of decades has culminated in the LTCC report.
The LTCC information obtained from the FORAGE system can be used as a starting point for discussion on grazing land management, with the capacity for users to customise components to better represent their properties. A request for an LTCC report can be submitted from the FORAGE web interface on the Long Paddock website (https://www.longpaddock.qld.gov.au/); the user is provided with the PDF report and two accessory spreadsheets when the request is completed by the FORAGE system. The FORAGE system is maintained by the Queensland Government and is a free service.
This paper describes the components and procedures used in calculating and testing the LTCC in the FORAGE system and the modelling outputs for the LTCC report. Stone et al. (2021) has provided the background history and development of the new Queensland-based LTCC process, and a detailed presentation of the report from the new automated online system. The LTCC report is currently only available for properties in Queensland; however, the science, technology and modelling approach used in this study could provide useful implications for other regions in Australia and across global rangeland regions.
Our paper describes development of an automated online system for calculating LTCC, that addresses the climatic and ecological complexity of Queensland’s grazing lands. We describe our approach, which includes co-design through a ‘prototype’ version that end users can test, and how this approach addresses major knowledge gaps through user feedback and ongoing technological improvements in remote sensing and biophysical science.
Model components and FORAGE LTCC online system
The estimation of LTCC includes several major processes:
-
geographic information system (GIS) manipulation for spatial datasets such as property/paddocks boundaries, water points, land type (area of grazing land that has characteristic patterns of soil, vegetation and landform) and foliage projective cover (FPC, a measure of woody vegetation cover);
-
pasture growth modelling using the GRASs Production (GRASP) model (Rickert et al. 2000);
-
optimisation of the pasture model parameters using remotely sensed green ground cover (research model version only);
-
model uncertainty analyses using Monte Carlo method (El Safadi et al. 2015); and
-
quality control of model outputs and verification of the modelled LTCC.
The calculation of LTCC is carried out in three stages (Fig. 1) outlined below, which includes the above processes.

|
LTCC calculation components and equations
The LTCC for a property of interest is calculated using an equation adapted from previous studies (Scanlan et al. 1994; Johnston et al. 1996a, 1996b; Hall et al. 1998) and is described in more detail in Part 1 (Stone et al. 2021), as follows:
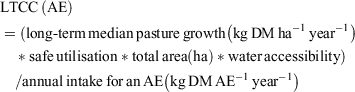
where LTCC is the total number of adult equivalents (AE), which are defined as 450 kg dry cattle, walking 7 km day−1 on level ground (for the purpose of intake calculation, we assume 450 kg cattle consume 8 kg DM day−1); total area is the area of the property or paddock of interest in hectares (ha); annual intake for an AE is set as 2920 kg DM year−1 (8 kg DM day−1; e.g. Stone et al. 2021); safe utilisation is the proportion of annual pasture growth that can be consumed by domestic livestock over a long period without causing degradation (Stone et al. 2021 provides further details on how safe utilisation has been derived for various pasture types); water accessibility is the proportion of the property or paddock that can be accessed by domestic livestock based on a function of distance to water points (Cowley et al. 2015).
The LTCC is calculated based on the assumption that the property is in ‘A’ (best) land condition (McIvor et al. 1995). For ‘B’, ‘C’ and ‘D’ land conditions, the proportions of modelled pasture growth are 0.75, 0.45 and 0.2 of the pasture growth in ‘A’ condition, respectively (after McIvor et al. 1995). These land condition states represent the overall relative impact of different biophysical degradation processes affecting infiltration, soil fertility and species composition. Users can modify the LTCC based on their knowledge of the land condition (see Stone et al. 2021).
The Spyglass grazing property, a Queensland Department of Agriculture and Fisheries (QDAF) Research Facility located in the Burdekin catchment of north-east Queensland, is used for an example of the calculation of LTCC in this paper.
GIS analyses
The FORAGE system uses a range of python computer programming scripts, which have been developed to use tools such as GDAL (https://gdal.org/) and MapServer (https://mapserver.org/). These tools manipulate the GIS analyses and generate maps presenting the LTCC for paddocks and land types across the property.
Property/paddock boundaries
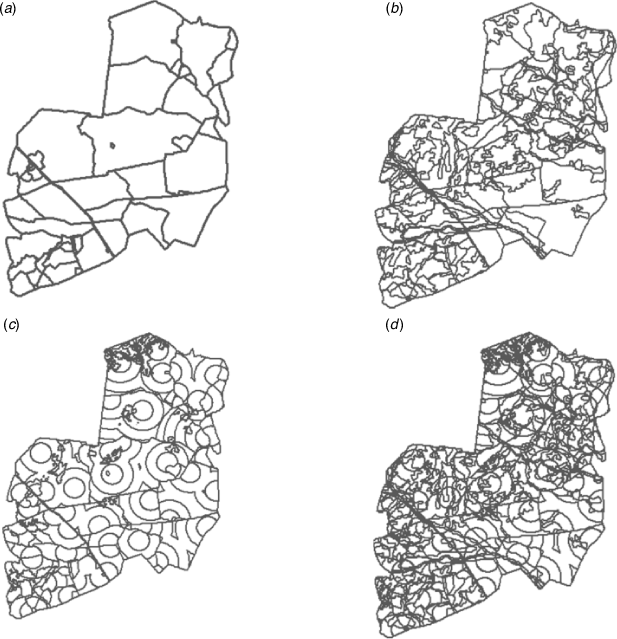
To request an LTCC report, the user identifies their land parcel of interest by providing/selecting ‘Lot(s) on Plan’ from the FORAGE web interface on the Long Paddock website (https://www.longpaddock.qld.gov.au/forage/). A ‘Lot on Plan’ is a consistent method for uniquely identifying land parcels in Queensland (QDNRME 2013). A paddock or property usually consists of one or more ‘Lots on Plan’. A GIS vector file (e.g. shapefile) of the land parcels is then retrieved by the FORAGE system from the current Queensland Digital Cadastral Database (DCDB). Alternatively, a user can upload a file of property/paddock boundaries using the My FORAGE Map web program interface (under development, see Stone et al. 2021), or draw it directly from the interface using tools provided in the program. The property/paddock boundary file is then used in the FORAGE system as a basis for the property report area (Fig. 2a).
|
Land types
A ‘land type’ is defined as an area of grazing land that has characteristic patterns of soil, vegetation and landform (e.g. Blackwood scrubs on structured clays), with representative pasture types (https://futurebeef.com.au/knowledge-centre/land-types-of-queensland/). Land types are similar to the concept and scale of ‘land units’ within larger ‘land systems’ mapping (Christian and Stewart 1968; Gallant et al. 2008). The Grazing Land Management (GLM) land type mapping (https://futurebeef.com.au/knowledge-centre/glm-land-type-mapping/) is the online spatial representation of the 225 land types described for Queensland. Safe annual pasture utilisation rates for each land type are provided in the State of Queensland (2019). Published literature (Scanlan et al. 1994; Johnston et al. 1996a, 1996b; Day et al. 1997) and unpublished studies (D. Phelps and P. Jones pers. comm.) along with other expert-derived estimates were used to determine the long-term mean percentage utilisation of annual pasture growth that would maintain the system in ‘A’ condition. Additionally, each grazing land type is represented by GRASP pasture growth parameters that allow simulation of likely year-to-year variability in pasture growth over time.
The GLM land type mapping was developed by associating land types with regional ecosystems (https://www.qld.gov.au/environment/plants-animals/plants/ecosystems), with on-going systematic review and updating of the land type spatial data (Irvine and Holloway 2019). The land type layer for the Spyglass property is shown in Fig. 2b.
Distance to water points
Water point information can be uploaded or drawn on the My FORAGE Map interface (in development); if no water point information is provided, it is assumed that domestic livestock have access to the entire paddock/property.
A ‘distance to water points’ vector file (if water point information is provided) is produced by buffering the points for 3000 m, 5000 m and >5000 m (Fig. 2c). Property topography (i.e. steep slopes) is also considered for the area available for grazing by adjusting the distance to water points. A grazing discount calculation is made, where domestic livestock travelling 100 m in a vertical plane is (approximately) equivalent to travelling 900 m in a horizontal plane, with the change in elevation calculated from nearest water points (Brosh et al. 2010).
Vector file overlay
The above-mentioned three vector files (property boundary, land type and distance to water) are then overlayed (superimposed) to obtain a composite vector file (Fig. 2d), which has multiple polygons. In the composite vector, the property area is classified into small polygons; each polygon having a unique combination of paddock, land type and distance to water point. The pasture growth and LTCC are calculated for each polygon and amalgamated to estimate pasture growth and LTCC for the paddocks, land types and property.
Woody vegetation cover
Woody vegetation cover is described by an FPC raster dataset (i.e. a grid of x and y coordinates displayed on an image), with a range of 0–100%. The raster is derived from Landsat imagery by the Queensland Remote Sensing Centre (RSC) (Armston et al. 2002). FPC is spatially averaged and classified into 13 FPC classes (0%, 1–5%, 5–10%, 10–15%, 15–20%, 20–25%, 25–30%, 30–35% 35–45%, 45–55%, 55–65%, 65–75%, 75–100%). The FPC classes have a narrower span at the lower end of the classes where tree-grass interaction is strongly ‘non-linear’ (Burrows et al. 1990; Scanlan and Burrows 1990). The classes (rather than individual pixel values) are used to minimise FPC estimate inaccuracies and the ‘computational overheads’ of processing at finer scales. The proportion of each FPC class within each unique polygon (e.g. Fig. 2d) are then calculated and used in the GRASP model to simulate the impact of trees on pasture growth. As a comparison, FPC values of 15%, 30% and 70% equate to tree basal areas (at 1.3 m aboveground) of ~6, 12 and 32 m2 ha−1 respectively (Armston et al. 2002).
Pasture growth modelling
The GRASP model (McKeon et al. 1990; Day et al. 1997; Carter et al. 2000; McKeon et al. 2000; Rickert et al. 2000) has a long history of use in Queensland and northern Australian pasture and grazing research analyses and is considered adequate to represent native pasture growth in a wide range of systems (e.g. Day et al. 1997; Carter et al. 2000). Pasture growth and biomass data and other ecological outputs have been used for over 10 years at both a property and broader spatial scale. In the context of the LTCC report, the primary GRASP model output is pasture growth; however, other model variables such as green ground cover, runoff and evapotranspiration (ET) are also produced for use in a diagnostic analysis for each land type.
Model parameters
A specialised GRASP model parameter file has been developed for each of 225 land types in Queensland. The parameter file defines the parameter values used by the GRASP model for modelling pasture growth and other outputs. The land type parameter file describes (for example) potential tree transpiration, soil water holding capacity, soil fertility and plant characteristics (such as sward structure, transpiration use efficiency, temperature response and potential nitrogen uptake and dilution). As some land types can extend over a range of ecological gradients, certain parameters are modified for local conditions. As an example, parameters relating to plant temperature response are adjusted as a function of long-term mean temperatures for that specific location; soil fertility and maximum rooting depth of trees may be adjusted higher or lower based on information obtained from the Soil and Landscape Grid of Australia (https://aclep.csiro.au/aclep/soilandlandscapegrid/).
Climate data
A historical climate dataset for the property obtained from the SILO database (https://www.longpaddock.qld.gov.au/silo/), includes data of daily temperature, rainfall, solar radiation, evaporation and vapour pressure. The climate dataset is used in the GRASP model to calculate the long-term (from 1975 onwards) median annual pasture growth. This time period is considered representative of the ‘living memory’ of a property manager and encompasses several ‘wet and dry periods’ (Stone et al. 2019; McKeon et al. 2021); and it is also well represented in the Landsat imagery record (from 1988 onwards).
Procedure for calculating LTCC: pasture growth modelling, parameter optimisation and uncertainty analyses
The three stages of the procedure to calculate LTCC are indicated in Fig. 1. At the time of writing (August 2021), Stage 1 (initial simulation of LTCC) and Stage 3 (uncertainty analysis) are operational. Stage 2 (model calibration and optimisation) represents new scientific research and hence on-going evaluation occurs under operational conditions.
Stage 1: initial simulation of LTCC
Using the SILO climate data, the GRASP model is run for each land type and the 13 levels of FPC within the property. For example, if there are 10 land types within the land parcel/property, then the GRASP model is run 130 times (i.e. 10 land types × 13 FPC levels). However, not all model outputs are used in calculating pasture growth for the selected property, as properties rarely have all 13 FPC classes represented.
‘GRASP model initial run’ evaluates the performance of the model parameters for each land type. This is achieved by comparing the modelled seasonal green ground cover with the remotely-sensed seasonal green ground cover (i.e. satellite-derived, from the RSC), using the Nash Sutcliffe efficiency coefficient analysis (Ritter and Muñoz-Carpena 2013). The remotely-sensed seasonal green ground cover images are used instead of an ‘individual-date’ green ground cover to reduce the computational workload at this point of the process. There are two possible sources of variation between modelled and remotely-sensed seasonal green ground cover: (1) inaccurate estimates of green ground cover; and (2) incorrect estimates of grazing history and pasture condition changes over time.
In Stage 1, grazing pressure is represented using regional stocking rates obtained from the AussieGRASS model (Carter et al. 2000), which in turn are sourced from agricultural census and survey data collected by the Australia Bureau of Statistics (ABS) and redistributed based on elements such as available land type, pasture productivity, topography and woody vegetation cover. Land types having a low (<0) Nash Sutcliffe efficiency coefficient for modelled seasonal green ground cover are considered to not adequately represent seasonal green ground cover dynamics. ‘Poor’ green ground cover representation can be due to the land types being incorrectly mapped, pastures not being in ‘A’ condition or due to spatial variability in species composition for a particular land type. The identification of a land type not meeting the Nash Sutcliffe criterion is documented in a diagnostic report for identification, further investigation and possible parameter optimisation.
Stage 1 is based on the best available information, including land type mapping and parameters, historical climate data and operational experience with regional application of AussieGRASS and FORAGE products (Stone et al. 2019, 2021). At the time of writing (August 2021), the LTCC calculation proceeds to Stage 3, where the uncertainty analysis is carried out and the LTCC report is generated.
Stage 2: model calibration and optimisation
The optimisation procedure is a new development and is part of the evolving improvement in LTCC calculation (Stone et al. 2021). When this procedure has been fully evaluated, the process will be automatically included in the operational LTCC analysis within the FORAGE system.
In the research version of the LTCC calculation, land types that do not meet the Nash Sutcliffe green cover test enter Stage 2 of the pasture modelling, ‘GRASP model parameter calibration run’ (Fig. 1). This calibration run involves applying a ‘constrained model parameter optimisation process’. The cloud-free Landsat green ground cover for individual dates from 1990 to present for each land type within the property are obtained from the RSC imagery archive and are treated as ‘observed’ green ground cover estimates. The observed green ground cover is used to calibrate several key land type parameters in GRASP (listed in Table 1) using a ‘Differential Evolution’ method (Rocca et al. 2011).

|
Stage 3: uncertainty analysis
The land type parameter sets are derived from a relatively small number of pasture growth measurements and soil attributes, such as fertility and water holding capacity (Stone et al. 2021). To estimate the consequences of known uncertainty in key parameters, a ‘modelled pasture growth uncertainty assessment’ is conducted using a Monte Carlo analysis method to provide a range of estimates of pasture growth. This method randomly changes several key parameters (within constraint limits, mostly ± 30%), while also accounting for inter-parameter correlations (e.g. maximum N uptake and total water holding capacity; see Table 1). The GRASP model is run 200 times to obtain a distribution of annual median pasture growths for all the land type and FPC combinations and resultant range of LTCC for each land type, paddock and the whole property. The mean LTCC from the Monte Carlo analyses is used as the estimated LTCC for the property, paddocks and land types with the standard deviation of the mean providing an estimated range of LTCC variation. During the Monte Carlo analysis, the GRASP model is run to simulate pasture growth without stock, but with nominal removal of biomass to avoid unrealistic build-up of ground cover.
Calculation of LTCC
For each polygon in Fig. 2d, the total growth for that polygon is calculated by summing up the total growth for each FPC class area in the polygon. The total growth for each FPC class area is calculated by multiplying the total area of the FPC class and the modelled long-term median annual pasture growth for the FPC class.
The quantity of total annual pasture growth (kg DM ha−1) that can be safely utilised (i.e. % safe pasture utilisation) by domestic livestock (for each polygon) is calculated by multiplying the safe pasture utilisation rate of the land type (each polygon only has one land type) by the long-term median pasture growth. The resultant value may then be further discounted according to the distance of the polygon area to the nearest water points. If the distance to water points is within 3000 m, no discounting is applied; between 3000 m and 5000 m, the total annual growth is discounted by 50%; and if the distance is >5000 m, the total growth that can be consumed is set to zero as it is assumed that domestic livestock may not access the pasture within the polygon at those distances from a water point (Cowley et al. 2015).
By amalgamating the ‘total safely eaten annual median growth’ for all the polygons, the ‘total safely eaten annual growth’ for each paddock, each land type area and the whole property can then be determined. The final calculation of LTCC is attained by dividing the total growth of a paddock, land type or the property, with the annual intake of an AE for the paddock, land type area or property.
For land types that contain mulga (Acacia aneura), domestic livestock consumption of topfeed (i.e. feeding mulga leaves) is considered in the calculation of the LTCC (using FPC to calculate the topfeed available; based on Johnston et al. 1996a). To illustrate how LTCC can guide stocking rate decisions, the GRASP model is run with a set of parameters that adjust stocking rate each year according to modelled pasture growth and safe utilisation (Fig. 3).

|
The stocking rate graph (Fig. 3) is calculated based on a procedure developed by Scanlan et al. (2011) and aims to reflect practical adjustments in stocking rate around the LTCC, in response to seasonal conditions to prevent resource degradation (O’Reagain and Scanlan 2013). The first step requires the model to be run to allow calculation of the LTCC (as described above). The starting stocking rate is then set to the LTCC for the start date of 1 April 1960 (i.e. 15 years before the graph in the report). The stocking rate is then adjusted annually on 1 April. The adjustment is calculated from the annual pasture growth from the previous year; 1 April–31March. This increment in stocking rate adjustment can range from a 0–20% increase through to a 0–20% decrease depending on the annual pasture growth. Additionally, limits are applied so that the stocking rate cannot go 50% above the LTCC and cannot go 50% below the LTCC over the entire simulation.
Multi-year droughts have been a feature of Queensland’s climate (e.g. Irvine 2021; McKeon et al. 2021) with drought episodes that have required the need for major destocking. Hence, such episodes are likely to be inevitable over a property manager’s lifetime. Grazier experience (e.g. Stone 2004) and grazing trials (e.g. O’Reagain et al. 2018) indicate that knowledge and use of LTCC can reduce the resource and financial impact of such episodes.
An estimate of feral animal and macropod (non-domestic animal) numbers is provided in the report as a guide only, and to make the user aware that there is likely to be additional pasture consumption by these animals. However, we do not have adequate data for non-domestic animals at the individual property scale, so these numbers are not included in the LTCC calculation; i.e. the land type safe pasture utilisation rates are only for domestic livestock.
Quality control of model outputs and model verification
For each property LTCC estimate, an internal diagnostic report is produced to assess whether the modelled results are ‘acceptable’, with respect to previous pasture measurements and derived empirical functions. For example, evapotranspiration and runoff are checked against the Zhang equation (Zhang et al. 2008); modelled green ground cover time series are checked against Landsat estimates (in research version only); the tree–grass competition is checked against functions derived from a range of field measurements in Queensland (Scanlan and Burrows 1990); and growth characteristics such as modelled actual radiation use efficiency and transpiration efficiency are checked to ensure they fall within an envelope of values (Fig. 4) derived from more than 100 field pasture growth measurements across Queensland and northern Australia (the GUNSYNPD dataset; Day et al. 1997). Additionally, safe pasture utilisation is compared with the function derived by Hall et al. (1998). Growth data for non-wooded areas are used to compare the likely rankings of growth between land types and actual LTCC compared with stock estimates from ABS and other regional safe stocking rate estimates. When one of the mentioned model outputs is significantly outside of the ‘normal’ range for any request of LTCC, an email alert message to the FORAGE team is automatically generated to initiate investigation of any calibration and data issues.

|
Buffel grass impact on calculation of LTCC
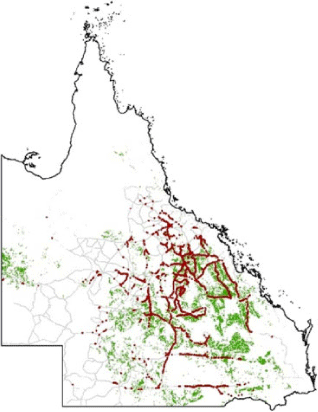
The online system has been developed to calculate LTCC for properties/paddocks with native pasture land types. However, non-native buffel grass (Cenchrus ciliaris) is a widespread sown pasture of in >30 of the 225 land types used in the online system (e.g. Peck et al. 2011, 2017). Early evaluation of the online system indicated the demand for the inclusion of buffel grass impact on calculation of LTCC. The buffel grass varieties have more resilient attributes in comparison to native pasture species (Martin et al. 2015), such as increased pasture growth response to higher soil fertility and deeper rooting systems that allow greater tolerance to grazing and drought. These buffel grass attributes support higher levels of pasture utilisation by domestic livestock and animal production per head and hectare than native pastures. To address the impact of buffel grass on LTCC calculated by the online system, 14 land type parameter sets have been developed to reflect buffel grass’s more productive growth and resilience. Field surveys during the period 1998–2007 (e.g. Hassett et al. 2000) have indicated those locations where buffel grass is likely to be dominant or common and have been cross-referenced with the 14 chosen fertile land types (Fig. 5).
|
To explicitly address the challenge of representing buffel grass’s effects on LTCC, the online system has the following procedure. When requesting an LTCC report on the FORAGE web page, there is an option to select ‘predominantly buffel grass pasture’, which invokes the following three processes:
-
If the user has selected the above option, and the land types suitable for buffel grass on the Lot on Plan have higher soil fertility and soil-water holding capacity, buffel grass land type parameter sets are used in the calculation of pasture growth. In addition, safe pasture utilisation is also increased by 15% (relative to the native pasture value).
-
If the user has selected the above option, but the land types suitable for buffel grass on the Lot on Plan indicate lower soil fertility or low soil-water holding capacity, native pasture parameters are used to calculate pasture growth and only the safe pasture utilisation is increased by 15% (as above); and
-
If the option is not selected, then native pasture parameters and associated safe pasture utilisation rates for that land type are used.
A major issue for buffel pasture is the rundown of available nitrogen following woodland clearing or pasture renovation (Peck et al. 2011, 2017). In addition, heavy pasture utilisation based on false expectations of continuing higher productivity exacerbates the decline in pasture productivity (e.g. Peck et al. 2011, 2017). To address the issue of potentially overestimating LTCC, model fertility parameters have been chosen to represent the more stable rundown state. As a consequence, users who have younger pastures (i.e. where there has been recent clearing or renovation) are likely to find that the LTCC calculation underestimates their current productivity.
Results
Model verification and validation
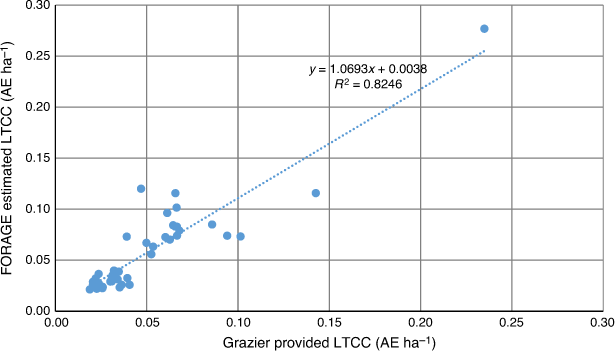
A verification/validation test of the modelled LTCC system was conducted by comparing the modelled LTCC estimates with the grazier-provided LTCC values for 43 benchmark properties across Queensland (Fig. 6). The benchmark properties were selected because they were regarded as well managed and in good (i.e. ‘A’) land condition. Hence, the grazier-provided LTCC values were considered as ‘true’ estimates of LTCC for these properties. Twenty of the benchmark properties are from the South-west Strategy project (Johnston et al. 1996a, 1996b) and 18 are from the Western Queensland Carrying Capacity Project, which were assessed in the mid-1990s (D. Phelps pers comm.). For a further five benchmark properties at a range of locations, LTCC values were provided by the co-authors for additional testing of the overall system. Modelling of the LTCC for all benchmark properties used approximately the same periods for the climate and FPC data as those used for the grazier estimations.
|
Twenty-eight (i.e. 65%) of the modelled LTCC estimates, were within ± 25% of grazier-provided LTCC values (Fig. 6). Further analysis indicated that agreement between benchmark property LTCCs and the online system LTCC calculations could be improved with the optimisation of ~20% of the land type parameter sets. This result supports the potential role of the optimisation procedure above.
The procedure used by Johnston et al. (1996a, 1996b) to calculate LTCC in south-west Queensland was different to the online system but had some similar components (Stone et al. 2021). Pasture growth was estimated from rainfall use efficiencies, which had been derived from simulations using the GRASP model, parameterised from pasture growth field studies. Safe pasture growth utilisation rates were estimated from grazing trials, benchmark properties and expert consensus (Johnston et al. 1996a). We regard the evaluation reported in Fig. 6 as both a verification of the complex computing and data systems, as well as a partial independent test of the validity of the approach.
FORAGE LTCC output
The FORAGE LTCC system produces a five-page PDF report with the overall LTCC for the property of interest, with further summaries of land parcels/paddocks and land types provided (see Supplementary material, available at the journal’s website). Areas considered not grazed (e.g. wetland or due to distance to water limitations) and LTCC under ‘A’, ‘B’, ‘C’ and ‘D’ condition for paddocks are summarised in a table in the report (Fig. 7). Graphical representation of the long-term historical safe stocking rate is provided in the LTCC report (Fig. 3).

|
Two accessory spreadsheets are also provided as a measure of transparency and to allow the user the capability to modify the base data and assess the impact of different grazing scenarios on overall property pasture condition and LTCC. One spreadsheet contains LTCC values and pasture growth data for each land parcel by land type combination; the other spreadsheet is based on land parcels/paddocks, which allows users to estimate LTCC for land condition states other than ‘A’. For more detailed information see Stone et al. (2021).
Diagnostic reports
An internally-used diagnostic report is also produced, which is designed for developers to assess ‘model fitness’. An example of the Monte Carlo analysis is shown in Fig. 8, where the points are the LTCC values of 200 runs of the assessment. The standard deviation of the mean of the 200 runs provides a ‘range of uncertainty’ for the LTCC of the property of interest.

|
Fig. 4 shows two examples of model quality control outputs. One is the ‘rainfall use efficiency’ and the other is the ‘evapotranspiration efficiency’. The two lines defining the areas with ‘normal’ values are derived from the field measurement of the GUNSYNPD dataset (Day et al. 1997). This form of diagnostic is being improved, by considering envelope relationships derived from 30-year simulations of pasture growth to calculate rainfall, radiation and evapotranspiration use efficiencies.
Apart from the FORAGE web interface for requesting the LTCC report, all other modelling and data analyses are conducted on a Queensland Government high performance computing (HPC) server. The time taken for the computation for LTCC is ~10–20 h, depending on the complexity of the land types and other user activity on the computing framework.
Discussion
The importance of on-ground property description
There are several issues that limit the accuracy of LTCC estimates. The online system does not have the detailed descriptions of woody vegetation cover and pasture condition (e.g. dominance of feathertop grass (Aristida latifolia) or Indian couch (Bothriochloa pertusa)) that can be provided by on-ground property surveys, such as carried out by Johnston et al. (1996a, 1996b). The online system relies on inputs from remotely-sensed data and broad-scaled surveys that are irregularly upgraded and improved. For example, remotely-sensed digital FPC maps are not updated annually and hence, the different effects of recent clearing, fire and woody regrowth cannot be taken into consideration for the calculation of pasture growth and LTCC. Similarly, changes in pasture type and condition have been irregularly assessed by field surveys (e.g. buffel grass and Indian couch). Users should have better knowledge of their own properties and hence can assess the implications of these inevitable uncertainties resulting from irregular input data updates. The future phases of development should address this issue by allowing users (graziers and/or advisors) to confidentially enter updated property details to better estimate LTCC for current property attributes. This issue is currently being addressed in the dynamic My FORAGE Map prototype.
The validation study indicated that 65% of properties were within ± 25% of owner-estimated LTCC with 26% within ± 10%. This variation between grazier estimates and online estimated LTCCs appears to be similar to other studies (Scanlan et al. 1994; Hall et al. 1998). However, in an evaluation survey, Johnston and Garrad (1999) found that for 217 properties, 66% of respondents reported that calculated grazier LTCC was ± 10% of respondents’ expectations. In the Johnston et al. (1996a, 1996b) studies, there had been detailed on-ground property surveys to accurately measure inputs of land types and woody vegetation cover. Thus, while not directly comparable with the online system, this comparison nevertheless supports the importance of on-ground surveys and/or knowledge of grazier inputs to improve the calculation of LTCC.
Automation of approach
A range of modelling approaches have been used by past and current researchers, extension providers, consultants and rural land valuers to calculate the LTCC for purposes such as stocking rate assessment, infrastructure planning and property sales. The FORAGE LTCC system brings together many of the key elements of the above approaches including modelling pasture growth, applying safe utilisation of pasture growth and considering distance to water points in utilising pastures. Importantly, the FORAGE LTCC system was developed so that all stages of the modelling processes are automated to provide a transparent, efficient and standardised methodology to obtain property-level LTCC estimates on a Queensland-wide basis. The FORAGE system considerably reduces the time required to calculate the LTCC estimates for users and prevents potential errors introduced from manual or semi-automated calculations (Zhang and Carter 2018). The FORAGE online system for calculating LTCC has been operational since the November 2020; during the 10 months period, over 4000 LTCC reports requested and delivered to users.
The FORAGE system also includes research components under development (e.g. parameter optimisation with green cover, tree–grass relationships, pasture growth for sown pastures and native pastures over sown with legumes such as stylos). As the application of the online system expands to a wider range of Queensland land types, this form of ‘active’ research is a necessary feature of the computer-based LTCC system, which will continually evolve by using the best available information and technology, as well as incorporating feedback from users. It is recommended that development of a similar automated system for other Australian or international regions also include diagnostic assessments for continual improvement.
Optimisation of key pasture growth parameters and calculation of uncertainty
Optimisation is a common approach used to improve model performance (Papapostolou et al. 2011). The research version of the FORAGE LTCC system uses the remotely-sensed individual-date green ground cover (~30 years of imagery) to compare with the modelled estimate (as ‘proof of concept’) to optimise key GRASP model parameters, when the modelled and remotely-sensed seasonal green ground cover are not in agreement. As field data are often unavailable or minimal (both spatially and temporally), remotely-sensed green ground cover data provide a robust and reliable surrogate for field-measured ground cover (i.e. for open or lightly wooded areas), and potentially helps to improve the GRASP model parameters through optimisation. Although the GRASP model parameters for land types are well calibrated at a regional scale, variation in mesoclimate, soil and vegetation at a property scale may require the parameters to be fine-tuned to provide better agreement. The optimisation process can assist in improving the model parameters and to enhance the reliability of the modelled pasture growth at property scale. However, the optimisation process is not effective for all land type, pasture species and FPC combinations due to the complex nature of the grazing land systems. Hence the process will continue to be refined, with the aim of including it operationally in the future FORAGE LTCC system calculation.
The Monte Carlo analysis is a common method used to assess the model uncertainty caused by model parameter variation (ElSafadi et al. 2015). Soil features and associated water holding capacity, nitrogen availability and the pasture re-growth potential are key parameters in modelling yearly pasture growth (Day et al. 1997). The Monte Carlo assessment produces a range of LTCC estimations caused by likely variation of the above-mentioned parameters and allows for a quantified assessment of model output uncertainty.
Improving estimates of woody vegetation cover
The influence of trees and other woody vegetation on pasture growth is non-linear, particularly at the lower end of the woody vegetation cover scale (Scanlan et al. 1994). The spatial analyses used in this study classified the FPC into 13 classes and captures the FPC value at pixel scale of the FPC raster dataset (30 × 30 m). This high resolution FPC data provides detailed woody vegetation cover input for representing tree-grass competition for the GRASP modelling of pasture growth. Some limitations to using the FPC data when modelling LTCC include recent clearing and regrowth that may have occurred since the FPC data were released. In addition, at Landsat scale, there are issues in discriminating tree foliage and green grass and determining the woody/non-woody boundaries at low woody vegetation cover; a problem currently being addressed by using higher resolution imagery.
Improving land type mapping and parameters
Land type mapping and modified pastures remain an issue for producing near-accurate on-ground estimates. The modelling system’s primary base is nominally a native pasture in ‘A’ condition. However, native perennial pastures may have been converted to another state (e.g. degraded or less productive pastures dominated by the exotic grass Indian couch, introduced/naturalised with buffel grass or planted to exotic legumes (e.g. Stylosanthes spp.)). As land type mapping (to a large extent) does not identify modified systems, estimates of LTCC will not reflect such transformations. However, the My FORAGE Map web interface (in development) will allow the user to adjust mapping attributes to achieve an improved property representation. Not all bio-physical processes in native pastures are fully described mathematically in the GRASP model, and some parameters may not be well determined. Nevertheless, we believe the multiple constraints approach generally gives reasonable results, and the system provides a uniformity of method across Queensland rather than variable ‘ad hoc’ model parameterisations by individual users.
Land type-based model parameterisation used in the FORAGE LTCC system is calibrated at the regional scale. At the property scale, the land types and the boundaries may not always be accurate due to the complex nature and scale of mapping of the regional ecosystems. Additionally, land type parameters for regions such as the Channel Country in south-west Queensland, Northern Gulf in north Queensland, and other complex regions may not be well calibrated due to lack of primary pasture growth calibration sites. Therefore, the modelled LTCC from these particular areas should be used principally as ‘discussion’ material with further investigation to combine LTCC with information obtained from relevant on-ground assessment.
Annual variability in pasture growth and LTCC estimates for certain land type(s) on a property may be inaccurate for reasons such as flood-out zones or a limited understanding of the grazing system. The more ‘dynamic’ My FORAGE Map web interface (in development) with user-defined inputs will have more capacity to deal with these complexities.
In the future, it is envisaged that the FORAGE system will enable assessment of climate change impacts on LTCC using high resolution dynamically down-scaled and bias corrected climate data developed by the Queensland Government (https://longpaddock.qld.gov.au/qld-future-climate). Evaluation of other scenario analyses applications, such as impact of ‘fencing to land type’, water point placement and paddock re-distribution are also intended within the My Forage Map web interface.
Conclusion
The automated modelling processes introduced by Stone et al. (2021) and described within, provide an efficient and standardised methodology to obtain property-level LTCC estimates for Queensland. The calculation of LTCC through systematic modelling approaches that simulate pasture growth for land types across Queensland, adjusted by safe utilisation rates, topography and distance to water points can be used to provide a systematic approach to estimating LTCC at a paddock or property scale across Queensland.
This automated system provides a consistent approach that is much faster than previous manual calculation methods, providing a discussion starter about LTCC, land condition and sustainable long-term planning. There are assumptions, such as native pastures being dominant and that the land is in ‘A’ (best) condition, which need to be considered and we recommend that some on-ground property-based knowledge and adjustments may be required for the LTCC estimates.
Conflicts of interest
Ms Giselle Whish and Ms Jacqui Willcocks are Guest Associate Editors of this Special Issue of The Rangeland Journal and are also co-authors of this paper. Ms Whish and Ms Willcocks were blinded from the peer-review process for this manuscript before its acceptance for publication.
Funding statement
This study was funded by the QDAF through the Drought and Climate Adaptation Program (DCAP) and the Queensland Government’s Queensland Reef Water Quality Program.
Acknowledgements
The authors thank Dr Peter Johnston and Dr David Phelps (QDAF) for providing benchmark property information for comparative analyses. We also thank our colleagues: Chris Holloway (QDAF), Dorine Bruget, Anthony Chun and David Ahrens (QDES) for varied assistances in developing the system described in this paper.
References
Armston, J. D., Danaher, T. J., Goulevitch, B. M., and Byrne, M. I. (2002). Geometric correction of Landsat MSS, TM, and ETM+ imagery for mapping of woody vegetation cover and change detection in Queensland. In: ‘Proceedings of the 11th Australasian Remote Sensing and Photogrammetry Conference’. Brisbane, Qld, Australia, September 2002. (Eds A. Apan, A. Phinn, K. Joyce, D. Jonas and T. Danaher.) pp. 985–1007.Brosh, A., Henkin, Z., Ungar, E. D., Dolev, A., Shabtay, A., Orlov, A., Yehuda, Y., and Aharoni, Y. (2010). Energy cost of activities and locomotion of grazing cows: A repeated study in larger plots. American Society of Animal Science 88, 315–323.
| Energy cost of activities and locomotion of grazing cows: A repeated study in larger plots.Crossref | GoogleScholarGoogle Scholar |
Burrows, W. H., Carter, J. O., Scanlan, J. C., and Anderson, E. R. (1990). Management of savannas for livestock production in north‐east Australia – contrasts across the tree grass continuum. Journal of Biogeography 17, 503–512.
| Management of savannas for livestock production in north‐east Australia – contrasts across the tree grass continuum.Crossref | GoogleScholarGoogle Scholar |
Carter, J. O., Hall, W. B., Brook, K. D., McKeon, G. M., Day, K. A., and Paull, C. J. (2000). AussieGRASS: Australian Grassland and Rangeland Assessment by Spatial Simulation. In: ‘Applications of Seasonal Climate Forecasting in Agricultural and Natural Ecosystems—The Australian Experience’. (Eds G. Hammer, N. Nicholls and C. Mitchell.) pp. 329–349. (Kluwer Academic Press: Dordrecht, The Netherlands).
Christian, C. S., and Stewart, G. A. (1968). Methodology of integrated surveys. In: ‘Aerial Surveys and Integrated Studies: Proceedings of the Toulouse Conference of 1964’. (Ed. P. Rey.) pp. 233–280. (UNESCO: Paris.)
Cowley, R. A., Jenner, D., and Walsh, D. (2015). What distance from water should we use to estimate paddock carrying capacity? In: ‘Innovation in the Rangelands: Proceedings of the 18th Australian Rangeland Society Biennial Conference’. Alice Springs, NT, Australia. (Ed. M. H. Friedel.) 4 pp. (Australian Rangeland Society: Parkside, South Australia.)
Day, K. A., McKeon, G. M., and Carter, J. O. (1997). Evaluating the risks of pasture and land degradation in native pasture in Queensland. Final report for Rural Industries and Research Development Corporation project DAQ124A. (Queensland Department of Natural Resources: Brisbane.) https://data.longpaddock.qld.gov.au/static/publications/DAQ124A_Final.pdf
El Safadi, E. A., Adrot, O., and Flaus, J. M. (2015). Advanced Monte Carlo Method for model uncertainty propagation in risk assessment. IFAC - Papers OnLine 48, 529–534.
| Advanced Monte Carlo Method for model uncertainty propagation in risk assessment.Crossref | GoogleScholarGoogle Scholar |
Fatichi, S., Ivanov, V. Y., and Caporali, E. (2012). Investigating interannual variability of precipitation at the global scale: Is there a connection with seasonality? Journal of Climate 25, 5512–5523.
| Investigating interannual variability of precipitation at the global scale: Is there a connection with seasonality?Crossref | GoogleScholarGoogle Scholar |
Gallant, J. C., McKenzie, N. J., and McBratney, A. B. (2008). Chapter 3: Scale. In: ‘Guidelines for Surveying Soil and Land Resources’. 2nd edn (Eds N. J. McKenzie, M. J. Grundy, R. Webster and A. J. Ringrose-Voase.) pp. 27–43. (CSIRO Publishing: Melbourne.)
Hall, W. B., McKeon, G. M., Carter, J. O., Day, K. A., Howden, S. M., Scanlan, J. C., Johnston, P. W., and Burrows, W. H. (1998). Climate change in Queensland’s grazing lands: 11. An assessment of the impact on animal production from native pastures. The Rangeland Journal 20, 177–205.
| Climate change in Queensland’s grazing lands: 11. An assessment of the impact on animal production from native pastures.Crossref | GoogleScholarGoogle Scholar |
Hassett, R. C., Wood, H. L., Carter, J. O., and Danaher, T. J. (2000). A field method for statewide ground-truthing of a spatial pasture growth model. Australian Journal of Experimental Agriculture 40, 1069–1079.
| A field method for statewide ground-truthing of a spatial pasture growth model.Crossref | GoogleScholarGoogle Scholar |
Henry, B., McKeon, G., Syktus, J., Carter, J., Day, K., and Rayner, D. (2007). Climate variability, climate change and land degradation. In: ‘Climate and Land Degradation’. (Eds M. V. K. Sivakumar and N. Ndiang’ui.) pp. 205–221. (Springer: New York.)
Hunt, L. P. (2008). Safe pasture utilisation rates as a grazing management tool in extensively grazed tropical savannas of northern Australia. The Rangeland Journal 30, 305–315.
| Safe pasture utilisation rates as a grazing management tool in extensively grazed tropical savannas of northern Australia.Crossref | GoogleScholarGoogle Scholar |
Hunt, L. P., McIvor, E. J. G., Grice, A. C., and Bray, S. G. (2014). Principles and guidelines for managing cattle grazing in the grazing lands of northern Australia: stocking rates, pasture resting, prescribed fire, paddock size and water points – a review. The Rangeland Journal 36, 105–119.
| Principles and guidelines for managing cattle grazing in the grazing lands of northern Australia: stocking rates, pasture resting, prescribed fire, paddock size and water points – a review.Crossref | GoogleScholarGoogle Scholar |
Irvine, S. A. (2021). Mapping drought declaration areas from 1936 to 1964 for Queensland, Australia. The Rangeland Journal 43, 109–119.
| Mapping drought declaration areas from 1936 to 1964 for Queensland, Australia.Crossref | GoogleScholarGoogle Scholar |
Irvine, S., and Holloway, C. (2019). Spatial Grazing Land Management Land Types of Queensland: Review and amendments (Version 5.4) – January 2019. Technical Report. Department of Agriculture and Fisheries, Queensland.
Johnston, P. W., and Garrad, S. W. (1999). Estimating livestock carrying capacities in south-west Queensland, Australia. In: ‘People and Rangelands, Building the Future. Proceedings of the 6th International Rangeland Congress’. (Eds D. Eldridge and D. Freudenberger.) pp. 861–862. (6th International Rangeland Congress Inc.: Aitkenvale, Qld.)
Johnston, P. W., McKeon, G. M., and Day, K. A. (1996a). Objective ‘safe’ grazing capacities for south-west Queensland Australia: development of a model for individual properties. The Rangeland Journal 18, 244–258.
| Objective ‘safe’ grazing capacities for south-west Queensland Australia: development of a model for individual properties.Crossref | GoogleScholarGoogle Scholar |
Johnston, P. W., Tannock, P. R., and Beale, I. F. (1996b). Objective ‘safe’ grazing capacities for south–west Queensland, Australia: model application and evaluation. The Rangeland Journal 18, 259–269.
| Objective ‘safe’ grazing capacities for south–west Queensland, Australia: model application and evaluation.Crossref | GoogleScholarGoogle Scholar |
Martin, T., Murphy, H., Liedloff, A., Thomas, C., Chadès, I., Cook, G., Fensham, R., McIvor, J., and van Klinken, R. (2015). Buffel grass and climate change: a framework for projecting invasive species distributions when data are scarce. Biological Invasions 17, 3197–3210.
| Buffel grass and climate change: a framework for projecting invasive species distributions when data are scarce.Crossref | GoogleScholarGoogle Scholar |
McIvor, J. G., Ash, A. J., and Cook, G. D. (1995). Land condition in the tropical tallgrass pasture lands 1. effects on herbage production. The Rangeland Journal 17, 69–85.
| Land condition in the tropical tallgrass pasture lands 1. effects on herbage production.Crossref | GoogleScholarGoogle Scholar |
McKeon, G., Day, K., Howden, S., Mott, J., Orr, W., Scattini, W., and Weston, E. (1990). Northern Australia savannahs: management for pastoral production. Journal of Biogeography 17, 355–372.
| Northern Australia savannahs: management for pastoral production.Crossref | GoogleScholarGoogle Scholar |
McKeon, G. M., Ash, A. J., Hall, W. B., and Stafford Smith, M. (2000). Simulation of grazing strategies for beef production in north–east Queensland. In: ‘Applications of Seasonal Climate Forecasting in Agricultural and Natural Ecosystems – The Australian Experience’. (Eds G. Hammer, N. Nicholls and C. Mitchell.) pp. 227–252. (Kluwer Academic Press: Netherlands.)
McKeon, G., Hall, W., Henry, B., Stone, G., and Watson, I. (2004). Pasture degradation and recovery. In: ‘Australia’s Rangelands: Learning from History’. (Queensland Department of Natural Resources, Mines, and Energy: Brisbane, Australia.) https://www.longpaddock.qld.gov.au/other-products/learning-from-history/ (accessed 15 December 2020)
McKeon, G. M., Stone, G. S., Syktus, J. I., Carter, J. O., Flood, N. R., Ahrens, D. G., Bruget, D. N., Chilcott, C. R., Cobon, D. H., Cowley, R. A., Crimp, S. J., Fraser, G. W., Howden, S. M., Johnston, P. W., Ryan, J. G., Stokes, C. J., and Day, K. A. (2009). Climate change impacts on northern Australian rangeland livestock carrying capacity: a review of issues. The Rangeland Journal 31, 1–29.
| Climate change impacts on northern Australian rangeland livestock carrying capacity: a review of issues.Crossref | GoogleScholarGoogle Scholar |
McKeon, G., Stone, G., Ahrens, D., Carter, J., Cobon, D., Irvine, S., and Syktus, J. (2021). Queensland’s multi-year Wet and Dry periods: implications for grazing enterprises and pasture resources. The Rangeland Journal 43, 121.
| Queensland’s multi-year Wet and Dry periods: implications for grazing enterprises and pasture resources.Crossref | GoogleScholarGoogle Scholar |
O’Reagain, P. J., and Scanlan, J. C. (2013). Sustainable management for rangelands in a variable climate: evidence and insights from northern Australia. Animal 7, 68–78.
| Sustainable management for rangelands in a variable climate: evidence and insights from northern Australia.Crossref | GoogleScholarGoogle Scholar | 23031187PubMed |
O’Reagain, P., Scanlan, J., Hunt, L., Cowley, R., and Walsh, D. (2014). Sustainable grazing management for temporal and spatial variability in north Australian rangelands – a synthesis of the latest evidence and recommendations. The Rangeland Journal 36, 223–232.
| Sustainable grazing management for temporal and spatial variability in north Australian rangelands – a synthesis of the latest evidence and recommendations.Crossref | GoogleScholarGoogle Scholar |
O’Reagain, P., Bushell, J., Pahl, L., and Scanlan, J. (2018). Wambiana Grazing Trial Phase 3: Stocking Strategies for Improving Carrying Capacity, Land Condition and Biodiversity Outcomes. Meat and Livestock Australia Final Report to Project B.ERM.0107. Meat & Livestock Australia, North Sydney, NSW.
Papapostolou, C., Kondili, E., and Kaldellis, J. K. (2011). Development and implementation of an optimisation model for biofuels supply chain. Energy 36, 6019–6026.
| Development and implementation of an optimisation model for biofuels supply chain.Crossref | GoogleScholarGoogle Scholar |
Peck, G., Buck, S., Hoffman, A., Holloway, C., Johnson, B., Lawrence, D. N., and Paton, C. J. (2011). Review of productivity decline in sown grass pastures. Project B.NBP.0624 Final Report. Meat and Livestock Australia Limited: North Sydney, NSW.
Peck, G., Buck, S., Johnson, B., and O’Reagain, J. (2017). Improving productivity of rundown sown grass pastures. Volume 1: Project overview, key findings and recommendations. Project B.NBP.0639 Final Report. Meat and Livestock Australia Limited: North Sydney, NSW.
Queensland Department of Natural Resources, Mines and Energy (QDNRME) (2013). Queensland Parcel Identification Standard 2013. SIG/2013/396 Version 4.01 13/02/2018. State of Queensland.
Rickert, K. G., Stuth, J. W., and McKeon, G. M. (2000). Modelling pasture and animal production. In: ‘Field and Laboratory Methods for Grassland and animal Production Research’. (Eds L.’t Mannetje and R. M. Jones.) pp. 29–66. (CABI Publishing: New York.)
Ritter, A., and Muñoz-Carpena, R. (2013). Performance evaluation of hydrological models: statistical significance for reducing subjectivity in goodness-of-fit assessments. Journal of Hydrology 480, 33–45.
| Performance evaluation of hydrological models: statistical significance for reducing subjectivity in goodness-of-fit assessments.Crossref | GoogleScholarGoogle Scholar |
Rocca, P., Oliveri, G., and Massa, A. (2011). Differential Evolution as Applied to Electromagnetics. IEEE Antennas & Propagation Magazine 53, 38–49.
| Differential Evolution as Applied to Electromagnetics.Crossref | GoogleScholarGoogle Scholar |
Scanlan, J. C., and Burrows, W. H. (1990). Woody overstorey impact on herbaceous understorey in Eucalyptus spp. communities in central Queensland. Austral Ecology 15, 191–197.
| Woody overstorey impact on herbaceous understorey in Eucalyptus spp. communities in central Queensland.Crossref | GoogleScholarGoogle Scholar |
Scanlan, J. C., McKeon, G. M., Day, K. A., Mott, J. J., and Hinton, A. W. (1994). Estimating safe carrying capacities of extensive cattle grazing properties within tropical, semi-arid woodlands of north-eastern Australia. The Rangeland Journal 16, 64–76.
| Estimating safe carrying capacities of extensive cattle grazing properties within tropical, semi-arid woodlands of north-eastern Australia.Crossref | GoogleScholarGoogle Scholar |
Scanlan, J. C., Pahl, L., Whish, G., Macleod, N., Cowley, R., and Phelps, D. G. (2011). Enhanced adoption of improved grazing and fire management practices in northern Australia: bio-economic analysis and regional assessment of management options. Final report: NBP.0578. Meat and Livestock Australia, Sydney, NSW.
State of Queensland (2019). Land types of Queensland. Version 3.1. Queensland Department of Agriculture and Fisheries, Brisbane, Qld. https://futurebeef.com.au/knowledge-centre/land-types-of-queensland-conditions-of-use/ (accessed 15 December 2020).
Stone, G. S. (2004). Analysis of grazing pressure from the long-term livestock records of two western Queensland pastoral properties. In: ‘Pasture Degradation and Recovery in Australia’s Rangelands: Learning from History’. (Eds G. M. McKeon, W. B. Hall, B. K. Henry, G. S. Stone and I. W. Watson.) pp. 191–235. (Queensland Department of Natural Resources, Mines and Energy.) Available at: https://www.longpaddock.qld.gov.au/other-products/learning-from-history/ (accessed 19 August 2020)
Stone, G., Dalla Pozza, R., Carter, J., and McKeon, G. (2019). Long Paddock: climate risk and grazing information for Australian rangelands and grazing communities. The Rangeland Journal 41, 225–232.
| Long Paddock: climate risk and grazing information for Australian rangelands and grazing communities.Crossref | GoogleScholarGoogle Scholar |
Stone, G., Zhang, B., Carter, J., Fraser, G., Whish, G., Paton, C., and McKeon, G. (2021). An online system for calculating and delivering long-term carrying capacity information for Queensland grazing properties. Part 1: background and development. The Rangeland Journal 43, 109–119.
| An online system for calculating and delivering long-term carrying capacity information for Queensland grazing properties. Part 1: background and development.Crossref | GoogleScholarGoogle Scholar |
Whish, G. L., and Holloway, C. (2016). An innovative approach to derive long-term carrying capacity estimates for extensive grazing properties in Queensland. In: ‘Proceedings of the Northern Beef Research Update Conference 2016’. p. 104. (Northern Australia Beef Research Council: Gympie, Qld, Australia.)
Whish, G., Pahl, L., and Holloway, C. (2016). Stage 1 – NRM SPATIAL HUB – underpinning better management decisions in the Rangelands INNOV-068-SISR-DAFF. Final Report. Department of Agriculture and Fisheries, Brisbane, Queensland. Available at: http://era.daf.qld.gov.au/id/eprint/5673/ (accessed 15 December 2020).
Zhang, B., and Carter, J. (2018). FORAGE – An online system for generating and delivering property-scale decision support information for grazing land and environmental management. Computers and Electronics in Agriculture 150, 302–311.
| FORAGE – An online system for generating and delivering property-scale decision support information for grazing land and environmental management.Crossref | GoogleScholarGoogle Scholar |
Zhang, L., Potter, N., Hickel, K., Zhang, Y., and Shao, Q. (2008). Water balance modeling over variable time scales based on the Budyko framework–Model development and testing. Journal of Hydrology 360, 117–131.
| Water balance modeling over variable time scales based on the Budyko framework–Model development and testing.Crossref | GoogleScholarGoogle Scholar |