

Prevalence of problematic pornography use: a meta-analysis
Peter K. H. Chew A * , Yong Jie Yow A and Charlize S. Y. Tan A
A
Abstract
At least one narrative review has examined cross-cultural differences in the prevalence rates of problematic pornography use (PPU). However, the data were not synthesised statistically, precluding an identification of the pooled prevalence rate of PPU. The current study aimed to address the limitation by conducting a meta-analysis to statistically synthesise the prevalence rates of PPU among the general population. A comprehensive search was conducted on the databases ProQuest, PsycArticles, and PubMed from inception to 11 October 2024. The data was analysed using Meta-Essentials, and the random effects model was used to obtain the pooled estimate of the effect size. A total of 22 articles were included (total N = 31,566). An overall pooled prevalence rate of 13.00% (95% CI: 8.00–19.00%) was found for PPU across general and subpopulations (e.g. students). However, significant heterogeneity was found across the prevalence rates, and they could be explained by region of the study, sample type (representative sample vs convenience sample), and the type of PPU instrument used. Limitations of the study include the inclusion of studies with Ad hoc scales in the meta-analysis and the modest impact of publication bias on the results. Future research directions include examining the forbidden fruit effect for PPU and examining potential interaction effects between key variables (e.g. region of the study, type of PPU instrument used) in predicting prevalence rates.
Keywords: behavioral addictions, compulsive sexual behavior disorder, meta-analysis, prevalence rates, problematic pornography use.
Introduction
Research on problematic pornography use (PPU) has flourished in recent years, and numerous studies have been conducted to understand the risk factors, negative consequences, and prevalence of the condition. Currently, at least one narrative review has examined cross-cultural differences in the prevalence rates of PPU.1 However, the data were not synthesised statistically, precluding an identification of the pooled prevalence rate of PPU. This study aimed to address the limitation by conducting a meta-analysis to statistically synthesise the prevalence rates of PPU among the general population.
Problematic pornography use
Pornography is defined as any ‘material deemed sexual, given the context, that has the primary intention of sexually arousing the consumer and is produced and distributed with the consent of all persons involved’ (p. 144).2 There is a large and growing number of pornography users. For example, Pornhub.com, the most popular pornography website in the world, has an average of 5.49 billion visits per month.3 In addition, the pornography industry in the United States alone was worth about USD977 million in 2022, and was projected to exceed USD1 billion in 2023.4 A review of pornography usage across the world found that it ranges from 70% among the Swedes to 100% among Australian men.1 However, some of these users consume pornography excessively and uncontrollably, resulting in a range of negative consequences in various life domains (i.e. PPU).5
Currently, PPU is subsumed under compulsive sexual behaviour disorder in the International Classifications of Diseases, 11th edition6 and there are no official diagnostic criteria for PPU as a standalone condition. Furthermore, PPU’s status as a standalone condition is not without controversy. Specifically, it has been argued that self-reported PPU is likely due to moral incongruence rather than actual excessive and problematic use of pornography (see Grubbs et al.7 for a systematic review and meta-analysis). However, despite the controversy, Griffiths’8 six criteria for behavioural addictions is often used to assess PPU: (1) salience (e.g. the activity of using pornography dominating an individual’s thoughts and behaviour); (2) mood modification (e.g. using pornography to get rid of negative feelings); (3) tolerance (e.g. needing to watch more pornography to get the same effects); (4) withdrawal (e.g. experiencing unpleasant feelings when trying to reduce or stop using pornography); (5) conflict (e.g. conflicts with partner due to excessive pornography use); and (6) relapse (e.g. trying to reduce pornography use without success).
The risk factors and negative consequences of PPU have been well documented. Given that more males tend to use pornography than females,9 it is not surprising that they tend to have a higher risk for PPU.10 With regards to personality traits, openness to experience and neuroticism are positively correlated with PPU.11 More recently, a large-scale study consisting of 74 datasets across 16 countries found that the most important predictors of PPU tend to be associated with: (1) characteristics of pornography use (e.g. frequency of pornography use, moral incongruence); and (2) negative emotions (e.g. using pornography to avoid emotions or reduce stress).12 With regards to negative consequences, PPU is positively correlated with negative emotional states such as depression, anxiety, and stress.13 More importantly, cross-sectional and longitudinal studies have shown that PPU is positively correlated with suicidal thoughts.14
Given these negative consequences, research has been conducted to examine the prevalence rates of PPU to understand the scope of the issue. A recent narrative review found prevalence rates that ranged from 0.1% to 32.4%.1 These prevalence rates varied both within and across cultures. Within cultures, prevalence rates varied by gender. For example, among Australians, males had a 4.0% PPU prevalence, whereas females had a 1.0% PPU prevalence. Across cultures, prevalence rates varied due to different ease of access to pornography, and different cultural norms, attitudes, and laws with regards to pornography. For example, Americans had a PPU prevalence of 7.0%, whereas the Japanese had a PPU prevalence of 23.5%. Overall, the variability of prevalence rates could also be due to differences in diagnostic criteria and PPU instruments. Taken together, it appears that the prevalence rates of PPU vary widely due to a range of variables.
Unfortunately, the data from the narrative review were not synthesised statistically.1 By weighing the prevalence rates of PPU of each study by its sample size and combining the information, we could identify the pooled prevalence rate of PPU to better understand the scope of the issue in relation to other forms of behavioural addictions. Specifically, meta-analyses have yielded a pooled prevalence rate of 1.29% for gambling disorder,15 3.30% for gaming disorder,16 and 5.00% for social media addiction.17 It is currently unclear how prevalence rates of PPU would compare to those behavioural addictions. More importantly, moderator analyses could be conducted to examine the contributions of key variables (e.g. gender) in explaining variations in prevalence rates. This information has implications for future evaluations of PPU as an official disorder. Consequently, this study aimed to address the limitations by conducting a meta-analysis to statistically synthesise the prevalence rates of PPU among the general population.
Methods
Search strategy
A comprehensive search was conducted on the databases ProQuest, PsycArticles, and PubMed from inception to 11 October 2024 using the following search terms: (‘porn addiction’ OR ‘pornography addiction’ OR ‘problematic porn use’ OR ‘problematic pornography use’) AND ‘prevalence’. The study was preregistered with PROSPERO (CRD42024589424) and conducted according to the Preferred Reporting Items for Systematic reviews and Meta-Analyses (PRISMA) guidelines.18
Inclusion and exclusion criteria
Articles were included if they: (1) were peer-reviewed original research; (2) reported the prevalence rate of PPU; (3) examined PPU among the general population; and (4) were written in the English language. The reference list of a literature review that examined the prevalence rates of PPU was also screened for relevant articles.1 Articles were excluded if they examined: (1) general pornography use (i.e. non-problematic); (2) other sexual activities on the internet (e.g. sexting); (3) PPU among the clinical population; or (4) compulsive sexual behaviour disorder (i.e. a condition broader than PPU). Two authors (PKHC and YJY) independently screened the articles and assessed them against the criteria for inclusion in the meta-analysis.
Data extraction
The data from the included articles was extracted into a spreadsheet. The following data was extracted: (1) name of authors; (2) year of publication; (3) sample size; (4) nationality of sample; (5) gender (% males);A,19–21 (6) age range, M, and s.d.; (7) sample type (representative sample vs convenience sample); (8) user type (non-users and pornography users vs pornography users only); (9) instrument used to assess PPU; and (10) prevalence rate. Two authors (YJY and CSYT) independently extracted the data from the articles into a spreadsheet and compared them for accuracy.
Risk of bias assessment
The risk of bias of the articles was assessed using a critical appraisal tool.22 The tool consists of 20 items designed to assess an article’s bias level (e.g. Was the sample size justified?). The tool did not provide a scoring system. Consequently, the current study reverse-scored negatively worded items and assigned 0 = No/Do not know, 0.5 = Yes to a certain extent, and 1 = Yes for the items, resulting in a range of 0–20 for each article, with higher scores indicative of higher quality (e.g. see Chew23). Two authors (YJY and CSYT) independently conducted the risk of bias assessment and compared it for accuracy.
Data analysis
The data was analysed using meta-essentials.24 First, since the included articles differ on several variables (e.g. type of instrument used), the random effects model was used to obtain the pooled estimate of the effect size.25 Second, the heterogeneity across articles was assessed using Cochran’s Q and the I2 statistic.26 If significant heterogeneity is found (i.e. a significant Q statistic and I2 >= 75%), the reasons for the heterogeneity will be explored using random effects meta-regressions and subgroup analyses. Finally, publication bias was examined using the funnel plot, Egger’s27 test, and the trim and fill procedure.28,29
Results
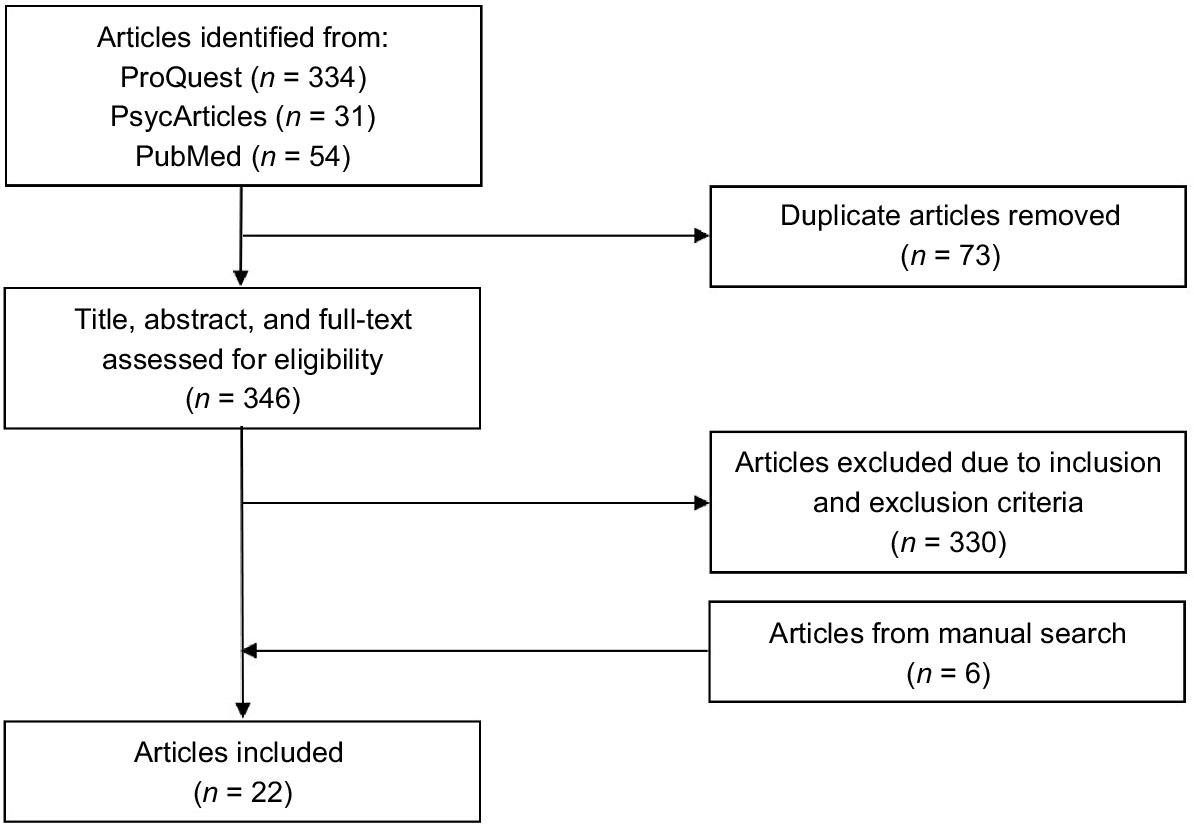
The flow diagram of the screening and selection of articles is in Fig. 1. A total of 419 articles were identified from the databases. After 73 duplicate articles were removed, the remaining 346 articles were screened. Because prevalence rates might not be reported in the title and abstract, the full-text of articles was screened based on the inclusion and exclusion criteria. A total of 330 articles were excluded based on the inclusion and exclusion criteria. An additional six articles were included from a manual search and a literature review.1 This procedure resulted in a total of 22 articles included in the meta-analysis.
The descriptives of included articles are in Table 1. The articles were published from 2017 to 2024, and their sample size ranged from 58 to 6463 (total N = 31566). The participants were from 11 countries from 4 regions: Europe (k = 10); Asia (k = 8); North America (k = 2); and Australia (k = 2). Their age ranged from 18 to 77 years, but an inspection of the means suggests that the sample is mostly in their early adulthood. A total of 5 articles had a representative sample of the general population whereas the remaining 16 articles had a convenience sample. A total of 5 articles reported prevalence rates for both the total sample (i.e. both non-users and pornography users) and pornography users only, 11 articles for the total sample only, and 6 articles for pornography users only. To provide a conservative estimate, we reported and analysed the prevalence rates for the total sample for the five articles. The most commonly used PPU instrument was the Problematic Pornography Consumption Scale (PPCS) (k = 5),10 followed by the Short Version of the Problematic Pornography Consumption Scale (PPCS-6) (k = 3),30 and the Brief Pornography Screen (BPS) (k = 3).31 The remaining articles used other psychometric instruments (k = 7) and Ad hoc scales (i.e. instruments developed for use in the study only and not validated separately in a psychometric study) (k = 4). The studies appear to be relatively high in quality and free from bias (M = 18.00, s.d. = 1.26, range = 16.00–20.00).
| Articles | N | Nationality | Gender (% males) | Age (years) | Sample type | User type | PPU instrument | Prevalence (%) | RoB | ||
|---|---|---|---|---|---|---|---|---|---|---|---|
| Range | M (s.d.) | ||||||||||
| Atroszko et al.32 | 327 | Polish | 40.40 | 18–30 | 20.55 (1.66) | 2 | 1 | CPCS | 6.40 | 19.5 | |
| Baranowski et al.33 | 482 | German | 0.00 | 18–77 | 25.79 (7.27) | 2 | 1 | s-IAT | 3.00 | 18.0 | |
| Christensen et al.34 | 475 | Australian | 45.70 | – | 32.30 (11.80) | 2 | 1 | PPCS | 7.00 | 19.5 | |
| Dwulit and Rzymski35 | 6463 | Polish | 40.74 | 18–26 | 22.10 (1.70) | 2 | 1 | Ad hoc | 12.20 | 16.0 | |
| Goh et al.19 | 319 | Malaysian | 41.69 | – | 23.05 (2.55) | 2 | 1 | PPCS-6 | 26.30 | 19.0 | |
| Grubbs et al.36 | 2075 | American | 48.96 | – | 44.80 (16.70) | 1 | 1 | Ad hoc | 6.75 | 18.5 | |
| Kadavala et al.37 | 1926 | Indian | 72.12 | – | – | 2 | 1 | PPCS | 14.60 | 18.5 | |
| Kumar et al.38 | 753 | Indian | 69.72 | – | 20.81 (1.70) | 2 | 1 | PPCS | 12.50 | 16.0 | |
| Lewczuk et al.39 | 1541 | Polish | 48.80 | 18–69 | 42.99 (14.38) | 1 | 1 | BPS | 22.84 | 18.0 | |
| Lewczuk et al.40 | 1036 | Polish | 49.03 | – | 43.28 (14.21) | 1 | 1 | BPS | 17.80 | 18.0 | |
| Lewczuk et al.41 | 144 | Polish | 72.70 | 16–61 | 27.13 (7.78) | 2 | 1 | BPS | 22.20 | 18.0 | |
| Malaeb et al.42 | 653 | Lebanese | 29.90 | – | 23.92 (5.30) | 2 | 2 | CPUI | 57.40 | 20.0 | |
| Manuel et al.20 | 1539 | German | 72.60 | 18–76 | 31.43 (11.96) | 2 | 2 | OPDQ | 5.90 | 18.0 | |
| Markert et al.43 – Study 1 | 2070 | German | 48.90 | – | – | 2 | 1 | PPCS-6 | 12.37 | 17.5 | |
| Musetti et al.44 | 776 | Italian | – | 19–48 | 28.49 (7.33) | 2 | 1 | CYPAT | 11.30 | 16.0 | |
| Oelker et al.45 | 739 | German | 69.28 | 18–69 | 39.33 (12.52) | 2 | 2 | PPCS | 3.79 | 16.5 | |
| Okabe and Ito46 | 1011 | Japanese | 49.70 | 18–69 | 35.90 (13.80) | 1 | 2 | PPUS | 7.30 | 20.0 | |
| Peng and Zheng47 | 326 | Chinese | 46.32 | 18–25 | – | 2 | 1 | PPCS | 25.15 | 16.0 | |
| Pouralijan et al.48 | 450 | Iranian | 33.11 | – | – | 2 | 1 | PPCS-6 | 9.50 | 18.5 | |
| Rissel et al.49 | 5878 | Australian | – | 16–69 | – | 1 | 2 | Ad hoc | 3.20 | 18.5 | |
| Sharma et al.21 | 2525 | Indian | 49.07 | 18–40 | – | 1 | 1 | Ad hoc | 0.20 | 17.5 | |
| Sklenarik et al.50 | 58 | American | 100.00 | – | 19.50 (2.40) | 2 | 2 | PPUS | 6.90 | 18.5 | |
Sample type: 1, representative sample; 2, convenience sample; user type: 1, non-users and pornography users; 2, pornography users only; PPU, problematic pornography use; RoB, risk of bias; risk of bias was assessed using a critical appraisal tool22 and the scores range from 0 to 20 for each article, with higher scores indicative of higher quality; CPCS, compulsive pornography consumption scale; s-IAT, adapted short internet addiction test; PPCS, problematic pornography consumption scale; Ad hoc, Ad hoc scale; PPCS-6, short version of the problematic pornography consumption scale; BPS, brief pornography screen; CPUI, cyber-pornography use inventory (pornography addictive pattern subscale); OPDQ, online pornography disorder questionnaire; CYPAT, cyber pornography addiction test; PPUS, problematic pornography use scale.
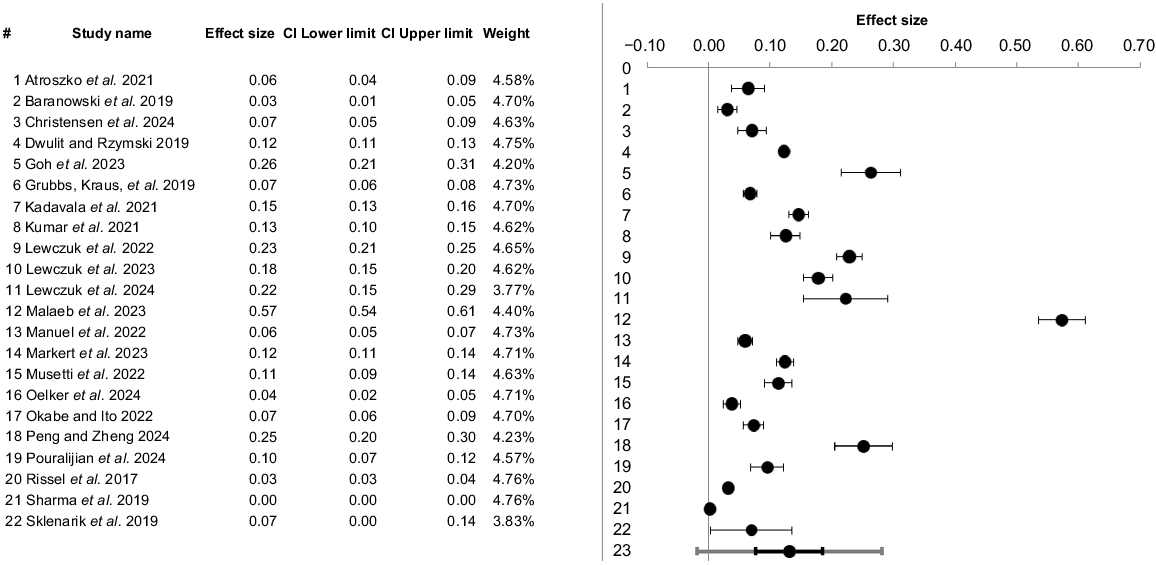
The meta-analysis showed that the prevalence rates ranged from 0.20% to 57.40% and found an overall pooled prevalence rate of 13.00%, with a 95% confidence interval of 0.08–0.19, and a 95% prediction interval of −0.02 to 0.28. The forest plot is in Fig. 2. Significant heterogeneity was found across the prevalence rates, Q = 3483.99, P < 0.001, I2 = 99.40%. The reasons for the heterogeneity were explored using random effects meta-regressions and subgroup analyses.
A series of random effects meta-regressions were conducted with gender, age, and risk of bias as the predictor variables and prevalence rates as the criterion variable. The results are in Table 2. Gender, age, and risk of bias were not significantly associated with prevalence rates.
| Variable | k | Beta | 95% CI [LL, UL] | P-value | |
|---|---|---|---|---|---|
| Gender | 20 | −0.16 | 0.00, 0.00 | 0.290 | |
| Age | 15 | −0.18 | −0.01, 0.00 | 0.068 | |
| Risk of bias | 22 | 0.19 | −0.01, 0.04 | 0.159 |
| Variable | k | Prevalence (%) | 95% CI [LL, UL] | Q | I2 | P-value | |
|---|---|---|---|---|---|---|---|
| Region | 0.003 | ||||||
| Europe | 10 | 11.00% | 0.06, 0.17 | 453.81*** | 98.02% | ||
| Asia | 8 | 19.00% | 0.04, 0.34 | 1601.20*** | 99.56% | ||
| North America | 2 | 7.00% | 0.06, 0.07 | 0.00 | 0.00% | ||
| Australia | 2 | 5.00% | −0.19, 0.29 | 10.15** | 90.14% | ||
| Sample type | 0.066 | ||||||
| 1 | 6 | 10.00% | 0.00, 0.19 | 957.80*** | 99.48% | ||
| 2 | 16 | 15.00% | 0.07, 0.22 | 992.36*** | 98.49% | ||
| User type | 0.813 | ||||||
| 1 | 16 | 13.00% | 0.09, 0.17 | 2530.80*** | 99.41% | ||
| 2 | 6 | 14.00% | −0.08, 0.36 | 797.53*** | 99.37% | ||
| PPU instrument | 0.000 | ||||||
| PPCS | 5 | 12.00% | 0.02, 0.22 | 159.11*** | 97.49% | ||
| PPCS-6 | 3 | 16.00% | −0.06, 0.37 | 36.01*** | 94.45% | ||
| BPS | 3 | 21.00% | 0.13, 0.28 | 10.15** | 80.30% | ||
| Others | 7 | 14.00% | −0.04, 0.32 | 715.99*** | 99.16% | ||
| Ad hoc scales | 4 | 6.00% | −0.03, 0.14 | 1033.24*** | 99.71% |
Sample type: 1, representative sample; 2, convenience sample; user type: 1, non-users and pornography users; 2, pornography users only; PPU, problematic pornography use; PPCS, problematic pornography consumption scale; PPCS-6, short version of the problematic pornography consumption scale; BPS, brief pornography screen; others, other psychometric instruments; subgroup analyses were based on separate estimates of tau and the P-values were based on Qbetween of the ANOVA table.
**P < 0.01; ***P < 0.001.
A series of random effects subgroup analyses were conducted with region, sample type, user type, and PPU instrument as the predictor variables and prevalence rates as the criterion variable. The analyses were based on separate estimates of tau, and the P-values were based on Qbetween of the ANOVA table. The results are in Table 2. First, region was significantly related to prevalence rates, Qbetween = 14.12, d.f. = , P = 0.003. Asia had the highest prevalence rate (19.00%), followed by Europe (11.00%), North America (7.00%), and Australia (5.00%). Second, the relationship between sample type and prevalence rates was close to significance, Qbetween = 3.39, d.f. = 1, P = 0.066. Articles with a representative sample had a lower prevalence rate than articles with a convenience sample (10.00% vs 15.00%). Third, user type was not significantly related to prevalence rates, Qbetween = 0.06, d.f. = 1, P =0.813. Prevalence rates based on the total sample (13.00%) were similar to those based on pornography users only (14.00%). Finally, PPU instrument was significantly related to prevalence rates, Qbetween = 24.80, d.f. = 4, P < 0.001. BPS had the highest prevalence rate (21.00%), followed by PPCS-6 (16.00%), other psychometric instruments (14.00%), PPCS (12.00%), and Ad hoc scales (6.00%). Excluding articles that used Ad hoc scales resulted in an increase in the overall pooled prevalence rate from 13.00% to 15.00%. Except for the North America subgroup for region, all other subgroups showed significant heterogeneity across the prevalence rates.
Publication bias was examined for the meta-analysis. First, the funnel plot appears to be symmetrical. Second, Egger’s27 test was non-significant, P = 0.09. Finally, the trim and fill procedure resulted in five imputed data points on the left of the funnel plot.28,29 The adjusted pooled prevalence rate was 8.00%, with a 95% confidence interval of 0.02–0.15, and a 95% prediction interval of −0.08 to 0.24. Taken together, while the funnel plot and Egger’s test suggested an absence of publication bias, the trim and fill procedure suggested that bias is present and that it has a modest impact on the results, reducing the pooled prevalence rate from 13.00% to 8.00%.
Discussion
This study extended on a narrative review1 by statistically synthesising and identifying the pooled prevalence rate of PPU. The results showed that the prevalence rates ranged from 0.20% to 57.40%, with an overall pooled prevalence rate of 13.00%. This prevalence rate is higher than other forms of behavioural addictions, which ranged from 1.29% for gambling disorder15 to 5.00% for social media addiction,17 suggesting that PPU is an important public health issue that warrants greater clinical and research attention. In addition, government funding and resources could be allocated to inform prevention and intervention efforts. However, significant heterogeneity was found across the prevalence rates. Consequently, the pooled prevalence rate should be interpreted with caution and not assumed to reflect a consistent rate across populations or measurement approaches.B The results showed that the heterogeneity was due to the region of the study, sample type, and the type of PPU instrument used. Gender, age, and user type were not significant moderators of the prevalence rates.
The region of the study significantly moderated the prevalence rates. Specifically, Asia had the highest prevalence rate (19.00%), followed by Europe (11.00%), North America (7.00%), and Australia (5.00%). This was consistent with a review that has found cross-cultural differences in the prevalence rates of PPU.1 The high prevalence rate in Asia could ironically be due to its relatively conservative cultures, where pornography is often considered taboo or even illegal (e.g. Malaysia). Specifically, this might be explained by the forbidden fruit effect, where the frequency of a behaviour increases because it is prohibited.51 This effect is due to a combination of reactance theory and commodity theory.52 For example, the prohibition of pornography threatens individuals’ freedom of choice, so they watch pornography more often to regain that freedom (i.e. reactance theory). Furthermore, the taboo and illegal nature of pornography results in scarcity, which results in greater perceived value (i.e. commodity theory). Taken together, these effects increase the consumption rate of pornography among the population, with a corresponding increase in the prevalence of PPU.
Sample type also significantly moderated the prevalence rates. Specifically, articles with a representative sample had a lower prevalence rate than articles with a convenience sample (10.00% vs 15.00%). This is an unsurprising finding given that articles with representative samples tend to have larger sample sizes than those with convenience samples, enabling them to provide a more accurate estimate of prevalence rates. Furthermore, articles with convenience samples tend to include students only.32,33,35,37,38,48,50 Students tend to be younger and better at technology than the general population. Consequently, they might have greater access to pornography, resulting in an increase in prevalence rates. Unfortunately, only six articles had representative samples in the current study. More prevalence studies employing representative samples are needed in the future to provide a better estimate of prevalence rates.
The type of PPU instrument used also significantly moderated the prevalence rates. Specifically, BPS had the highest prevalence rate (21.00%), followed by PPCS-6 (16.00%), other psychometric instruments (14.00%), PPCS (12.00%), and Ad hoc scales (6.00%). The discrepancy in prevalence rates could be due to the lack of an official diagnostic criteria for PPU as a standalone condition. Indeed, a systematic review of PPU instruments found that different instruments assess different criteria for addictions.53 Consequently, the assessment of different criteria could lead to different prevalence rates. However, the PPCS-6 was developed from the PPCS, and both instruments assess Griffiths’8 six criteria for behavioural addictions.30 Yet, despite assessing the same set of criteria, the use of the PPCS-6 is associated with a higher prevalence rate. This might be explained by the number of items used to assess each criterion. Specifically, the PPCS-6 used only one item (cf. three items on the PPCS) to assess each criterion and that might be insufficient to capture nuances of the criterion, resulting in inflated prevalence rates. Similarly, the brevity of the BPS (six items only) might explain the higher prevalence rates in the current study. Clearly, given the clinical implications, more research is needed to examine the diagnostic validity of the instruments.
Gender, age, and user type were not significant moderators of the prevalence rates. First, the non-significant findings for gender are inconsistent with previous studies that have found males to have a higher risk for PPU.10 Although gender differences with regard to attitudes towards pornography have reduced over time, these differences persist and would not account for the findings of the current study.54 Instead, it is more likely that the gender differences in prevalence rates are obscured by the heterogeneity of the results due to other variables (e.g. region). In addition, only three articles collected data on sex,19–21 whereas the remaining articles collected data on gender. This precluded an examination of the potentially different effects of gender and sex on prevalence rates. Second, the non-significant findings for age might be due to the mean age of the samples. Although the age ranged from 18 to 77 years, an inspection of the means suggests that most of the samples are in their early adulthood (about 20–40 years old). The lack of representation from younger (e.g. less than 18 years old) and older (e.g. more than 45 years old) individuals might have reduced the variance of the age variable, leading to non-significant findings. Finally, the non-significant findings for user type might be explained by the high percentage of pornography users. For example, one study included in the meta-analysis reported that 81.19% of their sample are pornography users.19 Consequently, while the use of the total sample would result in a lower prevalence rate than the use of pornography users only (13.00% vs 14.00%, respectively), the difference is trivial.
Limitations of the study should be noted. First, the current meta-analysis was conceptualised as an extension to a narrative review.1 Consequently, the search terms were similar to those used in that review. Studies that used other terms to describe PPU (e.g. compulsive pornography use) might not be identified in the current study. Second, four studies used ad hoc scales to assess PPU.21,35,36,49 These studies were included in the meta-analysis due to the small number of relevant studies and for the sake of completeness. However, it should be noted that their inclusion had a negligible effect on the results. Specifically, their exclusion from the meta-analysis resulted in an increase in the prevalence rate from 13.00% to 15.00%. Finally, it appears that publication bias had a modest impact on the results, reducing the pooled prevalence rate from 13.00% to 8.00%. In other words, the best estimate of an unbiased pooled prevalence rate of PPU is 8.00%. In the future, these limitations might be controlled by expanding the search terms and including studies using psychometrically valid PPU instruments only and unpublished manuscripts in the meta-analysis.
Future research directions might include examining the forbidden fruit effect for both normal and problematic pornography use.51 There could be implications for the policies of some countries if the results show that the prohibition of pornography increases the consumption rate of pornography among the population. Second, given the significant heterogeneity of prevalence rates across the subgroups (e.g. region of the study, type of PPU instrument used), future research could examine potential interaction effects between the variables in predicting prevalence rates. In summary, the findings of this study are important because it is probably the first meta-analysis of the prevalence rates of PPU. Specifically, an overall pooled prevalence rate of 13.00% was found. Furthermore, the meta-analysis showed that the region of the study and the type of PPU instrument used explained variations in prevalence rates, with potential implications for policies and clinical practice, respectively. Overall, the results extended on a narrative review1 and have implications for future evaluations of PPU as an official disorder.
Data availability
The data that support this study will be shared upon reasonable request to the corresponding author.
References
1 Ahorsu DK, Adjorlolo S, Nurmala I, Ruckwongpatr K, Strong C, Lin C-Y. Problematic porn use and cross-cultural differences: a brief review. Curr Addict Rep 2023; 10(3): 572-580.
| Crossref | Google Scholar |
2 Ashton S, McDonald K, Kirkman M. What does ‘pornography’ mean in the digital age? Revisiting a definition for social science researchers. Porn Stud 2019; 6(2): 144-168.
| Crossref | Google Scholar |
3 Ceci L. Top porn websites by monthly visits 2024. Statista; 2024. Available at https://www.statista.com/statistics/1445661/most-visited-porn-websites-worldwide/
4 Ceci L. Value of the porn websites industry in the U.S. 2023. Statista; 2022. Available at https://www.statista.com/statistics/1371582/value-online-website-porn-market-us/
5 Varod S, Stern A, Bőthe B, Gewirtz-Meydan A. Who finds pornography stressful? A latent profile analysis. Arch Sex Behav 2024; 53(9): 3393-3404.
| Crossref | Google Scholar |
6 World Health Organization. ICD-11. International Classification of Diseases 11th Revision. World Health Organization; 2019. Available at https://icd.who.int/en
7 Grubbs JB, Perry SL, Wilt JA, Reid RC. Pornography problems due to moral incongruence: an integrative model with a systematic review and meta-analysis. Arch Sex Behav 2019; 48(2): 397-415.
| Crossref | Google Scholar | PubMed |
8 Griffiths M. A ‘components’ model of addiction within a biopsychosocial framework. J Subst Use 2005; 10(4): 191-197.
| Crossref | Google Scholar |
9 Miller DJ, Raggatt PTF, McBain K. A literature review of studies into the prevalence and frequency of men’s pornography use. Am J Sex Educ 2020; 15(4): 502-529.
| Crossref | Google Scholar |
10 Bőthe B, Tóth-Király I, Zsila Á, Griffiths MD, Demetrovics Z, Orosz G. The development of the problematic pornography consumption scale (PPCS). J Sex Res 2018; 55(3): 395-406.
| Crossref | Google Scholar | PubMed |
11 Borgogna NC, Aita SL. Problematic pornography viewing from a big-5 personality perspective. Sex Addict Comp 2019; 26(3–4): 293-314.
| Crossref | Google Scholar |
12 Bőthe B, Vaillancourt-Morel M-P, Bergeron S, Hermann Z, Ivaskevics K, Kraus SW, Grubbs JB, Problematic Pornography Use Machine Learning Study Consortium. Uncovering the most robust predictors of problematic pornography use: a large-scale machine learning study across 16 countries. J Psychopathol Clin Sci 2024; 133(6): 489-502.
| Crossref | Google Scholar | PubMed |
13 Borgogna NC, Duncan J, McDermott RC. Is scrupulosity behind the relationship between problematic pornography viewing and depression, anxiety, and stress? Sex Addict Comp 2018; 25(4): 293-318.
| Crossref | Google Scholar |
14 McGraw JS, Grant Weinandy JT, Floyd CG, Hoagland C, Kraus SW, Grubbs JB. Problematic pornography use and suicidal thoughts: results from cross-sectional and longitudinal analyses. Psychol Addict Behav 2024; 38(6): 728-738.
| Crossref | Google Scholar | PubMed |
15 Gabellini E, Lucchini F, Gattoni ME. Prevalence of problem gambling: a meta-analysis of recent empirical research (2016–2022). J Gambl Stud 2023; 39(3): 1027-1057.
| Crossref | Google Scholar | PubMed |
16 Kim HS, Son G, Roh E-B, Ahn W-Y, Kim J, Shin S-H, Chey J, Choi K-H. Prevalence of gaming disorder: a meta-analysis. Addict Behav 2022; 126: 107183.
| Crossref | Google Scholar | PubMed |
17 Cheng C, Lau Y-c, Chan L, Luk JW. Prevalence of social media addiction across 32 nations: meta-analysis with subgroup analysis of classification schemes and cultural values. Addict Behav 2021; 117: 106845.
| Crossref | Google Scholar | PubMed |
18 Page MJ, McKenzie JE, Bossuyt PM, Boutron I, Hoffmann TC, Mulrow CD, Shamseer L, Tetzlaff JM, Akl EA, Brennan SE, Chou R, Glanville J, Grimshaw JM, Hróbjartsson A, Lalu MM, Li T, Loder EW, Mayo-Wilson E, McDonald S, McGuinness LA, Stewart LA, Thomas J, Tricco AC, Welch VA, Whiting P, Moher D. The PRISMA 2020 statement: an updated guideline for reporting systematic reviews. BMJ 2021; 372: n71.
| Crossref | Google Scholar |
19 Goh PH, Phuah LA, Low YH. Pornography consumption and sexual health among emerging adults from Malaysia: an observational study. Sex Health 2023; 20(2): 134-147.
| Crossref | Google Scholar | PubMed |
20 Manuel M, Sophia T, Antonia B. Self-perceived problematic use of online pornography is linked to clinically relevant levels of psychological distress and psychopathological symptoms. Arch Sex Behav 2022; 51(2): 1313-1321.
| Crossref | Google Scholar |
21 Sharma MK, Rao GN, Benegal V, Thennarasu K, Oommen D. Use of pornography in India: need to explore its implications. Natl Med J India 2019; 32(5): 282-284.
| Crossref | Google Scholar | PubMed |
22 Downes MJ, Brennan ML, Williams HC, Dean RS. Development of a critical appraisal tool to assess the quality of cross-sectional studies (AXIS). BMJ Open 2016; 6(12): e011458.
| Crossref | Google Scholar | PubMed |
23 Chew PKH. A meta-analytic review of Internet gaming disorder and the big five personality factors. Addict Behav 2022; 126: 107193.
| Crossref | Google Scholar | PubMed |
24 Suurmond R, van Rhee H, Hak T. Introduction, comparison, and validation of Meta-Essentials: a free and simple tool for meta-analysis. Res Syn Meth 2017; 8(4): 537-553.
| Crossref | Google Scholar | PubMed |
26 Higgins JPT, Thompson SG, Deeks JJ, Altman DG. Measuring inconsistency in meta-analyses. BMJ 2003; 327(7414): 557-560.
| Crossref | Google Scholar | PubMed |
27 Egger M, Smith GD, Schneider M, Minder C. Bias in meta-analysis detected by a simple, graphical test. BMJ 1997; 315(7109): 629-634.
| Crossref | Google Scholar | PubMed |
28 Duval S, Tweedie R. A nonparametric “trim and fill” method of accounting for publication bias in meta-analysis. J Am Stat Assoc 2000; 95(449): 89-98.
| Crossref | Google Scholar |
29 Duval S, Tweedie R. Trim and fill: a simple funnel-plot-based method of testing and adjusting for publication bias in meta-analysis. Biometrics 2000; 56(2): 455-463.
| Crossref | Google Scholar |
30 Bőthe B, Tóth-Király I, Demetrovics Z, Orosz G. The short version of the problematic pornography consumption scale (PPCS-6): a reliable and valid measure in general and treatment-seeking populations. J Sex Res 2021; 58(3): 342-352.
| Crossref | Google Scholar | PubMed |
31 Kraus SW, Gola M, Grubbs JB, Kowalewska E, Hoff RA, Lew-Starowicz M, Martino S, Shirk SD, Potenza MN. Validation of a brief pornography screen across multiple samples. J Behav Addict 2020; 9(2): 259-271.
| Crossref | Google Scholar |
32 Atroszko PA, Atroszko B, Charzyńska E. Subpopulations of addictive behaviors in different sample types and their relationships with gender, personality, and well-being: latent profile vs. latent class analysis. Int J Environ Res Publ Health 2021; 18(16): 8590.
| Crossref | Google Scholar |
33 Baranowski AM, Vogl R, Stark R. Prevalence and determinants of problematic online pornography use in a sample of German women. J Sex Med 2019; 16(8): 1274-1282.
| Crossref | Google Scholar | PubMed |
34 Christensen E, Albertella L, Chamberlain SR, Brydevall M, Suo C, Grant JE, Yücel M, Lee RSC. The neurocognitive correlates of non-substance addictive behaviors. Addict Behav 2024; 150: 107904.
| Crossref | Google Scholar |
35 Dwulit AD, Rzymski P. Prevalence, patterns and self-perceived effects of pornography consumption in Polish university students: a cross-sectional study. Int J Environ Res Public Health 2019; 16(10): 1861.
| Crossref | Google Scholar |
36 Grubbs JB, Kraus SW, Perry SL. Self-reported addiction to pornography in a nationally representative sample: the roles of use habits, religiousness, and moral incongruence. J Behav Addict 2019; 8(1): 88-93.
| Crossref | Google Scholar | PubMed |
37 Kadavala BN, Vasavada DA, Kumar P, Bhatt RB, Patel VK, Tiwari DS. A multicenter study on problematic pornography consumption: prevalence and correlates among undergraduate medical students. Asian J Soc Health Behav 2021; 4(3): 122-127.
| Crossref | Google Scholar |
38 Kumar P, Patel VK, Bhatt RB, Vasavada DA, Sangma RD, Tiwari DS. Prevalence of problematic pornography use and attitude toward pornography among the undergraduate medical students. J Psychosex Health 2021; 3(1): 29-36.
| Crossref | Google Scholar |
39 Lewczuk K, Wizła M, Glica A, Potenza MN, Lew-Starowicz M, Kraus SW. Withdrawal and tolerance as related to compulsive sexual behavior disorder and problematic pornography use – Preregistered study based on a nationally representative sample in Poland. J Behav Addict 2022; 11(4): 979-993.
| Crossref | Google Scholar | PubMed |
40 Lewczuk K, Wizła M, Gola M. The relation of sexual attitudes to hypersexuality and problematic pornography use. Arch Sex Behav 2023; 52(1): 411-430.
| Crossref | Google Scholar | PubMed |
41 Lewczuk K, Wizła M, Glica A, Dwulit AD. Compulsive sexual behavior disorder and problematic pornography use in cisgender sexual minority individuals: the associations with minority stress, social support, and sexualized drug use. J Sex Res 2024; 61(8): 1246-1260.
| Crossref | Google Scholar | PubMed |
42 Malaeb D, Hallit S, Obeid S. Pornography use among Lebanese adults: association with loneliness and fear of commitment. Healthcare 2023; 11: 795.
| Crossref | Google Scholar |
43 Markert C, Storz F, Golder S, Rechmann J, Rubel JA, Lalk C, Vogt R, Glombiewski JA, Braun D, Pané-Farré CA, Michael T, Mattheus HK, Dominick N, Wölfling K, Lutz W, Schaffrath J, Stangier U, Kananian S, Strüwing D, Klingelhöfer D, Valbert F, Neumann A, Walter B, Stark R. On the current psychotherapeutic situation for persons with pornography use disorder in Germany. J Behav Addict 2023; 12(2): 421-434.
| Crossref | Google Scholar | PubMed |
44 Musetti A, Gori A, Alessandra A, Topino E, Terrone G, Plazzi G, Cacioppo M, Franceschini C. The interplay between problematic online pornography use, psychological stress, emotion dysregulation and insomnia symptoms during the COVID-19 pandemic: a mediation analysis. Nat Sci Sleep 2022; 14: 83-92.
| Crossref | Google Scholar | PubMed |
45 Oelker A, Rumpf H-J, Brand M, Müller SM. Validation of the ACSID-11 for consistent screening of specific Internet-use disorders based on ICD-11 criteria for gaming disorder: a multitrait-multimethod approach. Compr Psychiat 2024; 132: 152470.
| Crossref | Google Scholar |
46 Okabe Y, Ito D. Psychometric properties of the problematic pornography use scale in a Japanese sample. Arch Sex Behav 2022; 51(2): 1221-1235.
| Crossref | Google Scholar |
47 Peng Y, Zheng Y. Relation between attitudes towards pornography consumption, peer sexual behaviors and attitudes towards premarital sex among the college students in Guangdong province, China. Humanit Soc Sci Commun 2024; 11: 917.
| Crossref | Google Scholar |
48 Pouralijan Z, Bőthe B, Farnam F. Pornography use, demographic and sexual health characteristics among university students: a gender-based comparative study of non-users, non-problematic users, and problematic users. Reproduct Health 2024; 21: 103.
| Crossref | Google Scholar |
49 Rissel C, Richters J, de Visser RO, McKee A, Yeung A, Caruana T. A profile of pornography users in Australia: findings from the second Australian study of health and relationships. J Sex Res 2017; 54(2): 227-240.
| Crossref | Google Scholar | PubMed |
50 Sklenarik S, Potenza MN, Gola M, Kor A, Kraus SW, Astur RS. Approach bias for erotic stimuli in heterosexual male college students who use pornography. J Behav Addict 2019; 8(2): 234-241.
| Crossref | Google Scholar | PubMed |
51 Filley D. Forbidden fruit: When prohibition increases the harm it is supposed to reduce. Independ Rev 1999; 3(3): 441-451.
| Google Scholar |
52 Bushman BJ, Stack AD. Forbidden fruit versus tainted fruit: effects of warning labels on attraction to television violence. J Exp Psychol: Appl 1996; 2(3): 207-226.
| Crossref | Google Scholar |
53 Fernandez DP, Griffiths MD. Psychometric instruments for problematic pornography use: a systematic review. Eval Health Prof 2021; 44(2): 111-141.
| Crossref | Google Scholar | PubMed |
54 Donevan M, Bladh M, Landberg Å, Jonsson LS, Priebe G, Dennhag I, Svedin CG. Closing the gender gap? A cohort comparison of adolescent responses to and attitudes toward pornography, 2004 vs. 2021. J Sex Res 2024; 1-15.
| Crossref | Google Scholar |