

Slow movement of alkali from surface-applied lime warrants the introduction of strategic tillage for rapid amelioration of subsurface acidity in south-western Australia
G. Azam A B and C. Gazey A
A Department of Primary Industries and Regional Development, 75 York Road, Northam WA 6401 Australia.
B Corresponding author. Email: gaus.azam@dpird.wa.gov.au
Soil Research 59(1) 97-106 https://doi.org/10.1071/SR19329
Submitted: 14 November 2019 Accepted: 30 July 2020 Published: 31 August 2020
Journal compilation © CSIRO 2021 Open Access CC BY-NC-ND
Abstract
Conventional surface-application of agricultural lime takes many years to increase pH deeper in the soil profile, which is a barrier to increased adoption of liming. We conducted a series of experiments to measure the rate of vertical movement of alkali and identify the factors that determine this movement into the subsurface, to evaluate the feasibility of ameliorating acidic subsurface soil using residual (undissolved) lime (CaCO3) at Wongan Hills (30.85°S, 116.74°E) and Merredin (31.48°S, 118.21°E) and to test whether deep tillage and lime incorporation can significantly speed up the amelioration of subsurface soil acidity at Kalannie (30.42°S, 117.29°E). Multiple applications of lime to the surface of the soil at higher rates (total 6–8.5 Mg ha–1) significantly increased subsurface soil pH but only in the 0.10–0.20 m depth by 0.049 pH units per year over 10–24 years. A large proportion of the surface-applied lime was stratified in the top few centimetres of the soil and incorporation of this undissolved lime with a rotary hoe to a depth of 0.25 m significantly increased soil pH (by 0.63 units) within a year in the Wongan Hills field experiment. Deep incorporation of 6 Mg ha–1 lime to a depth of 0.45 m through excavation and spading with a small rotary hoe also increased soil pH by more than a unit and decreased Al concentration to below the toxic level within two months in the Kalannie experiment, allowing wheat (Triticum aestivum L.) plants to produce root systems up to 0.59 m deep compared with 0.26 m for the control. Our soil column leaching experiment indicated that surface incorporation of lime in higher rainfall regions can be useful to treat subsurface soil acidity but that the rate of improvement in subsurface pH was slow. Therefore, deeper incorporation of lime using cost-effective strategic deep tillage is likely to be necessary.
Additional keywords: aluminium toxicity, deep incorporation, liming, residual CaCO3, Western Australia, wheat.
Introduction
Subsurface soil (below 0.1 m) acidity is widespread in Australia (National Land and Water Resources Audit 2001) and many parts of the world (Rengel 2003). In particular, the subsurface soil of the grainbelt of south-western Western Australia (WA) is constrained by severe acidity (soil pH £ 4.8; pH measured in 0.01 M CaCl2, pH hereafter) (Gazey et al. 2013) and to a deeper depth (Whitten 2002) than any other crop-growing regions of Australia (Li et al. 2019), costing AU$0.5–1.6 billion annually (Herbert 2009; Petersen 2016). In WA, agricultural lime (CaCO3) is typically spread on the soil surface to manage acidic soils; this is done without incorporation mainly due to the wide adoption of minimum tillage farming (Edmeades and Ridley 2003). It takes many years to significantly increase subsurface soil pH via surface-applied lime (Sumner et al. 1986; Conyers and Scott 1989). Crop yield increases from liming (compared with unlimed soil) occur in subsequent years, hence the economic benefit is cumulative. However, the upfront cost of applying lime still remains a barrier for many growers (Fisher 2019), warranting further research on more cost-effective methods of ameliorating subsurface soil acidity.
More recent literature suggests that, under both field and controlled environment conditions, the significant increase in soil pH is restricted to the few centimetres below the liming depth (Li et al. 2019; Nunes et al. 2019). Some reports indicate that the rate of the vertical movement of alkalinity from lime is affected by soil characteristics (for example, initial soil pH, soil organic carbon (OC) and soil texture), climate, time, application rate and lime quality parameters (Conyers and Scott 1989; Whitten 2002; Caires et al. 2005). However, it is not clear whether some of these factors are more important than others in enhancing deeper movement of alkalinity (Caires et al. 2005). Given the slow movement of pH change below the depth of lime addition, the most effective tillage operation to incorporate lime for rapid amelioration of subsoil acidity will need to be determined. Additionally, as the requirement for lime has become more widely accepted, many farmers have repeatedly applied agricultural lime to the soil surface. Most of this lime is stratified in the top few centimetres of soil (Azam et al. 2019). It is essential that we understand the amount of undissolved lime in the surface soil in order to test the efficiency of surface liming and identify a potential depth of incorporation for rapid amelioration of subsurface soil.
A large proportion of acidic sandplain soils in the grainbelt of WA are compacted and have developed water-repellency (van Gool 2011). In paddocks where multiple soil constraints such as compaction, water repellence and subsurface soil acidity are present, most crop roots are confined within 0.20–0.30 m of the surface (Reynolds et al. 2018). With such shallow root systems, a large proportion of growing-season rainfall quickly drains away beyond the root zone, resulting in inefficient use of stored soil moisture deeper in the profile. Physical tillage operations to treat compaction and water-repellent soils can opportunistically be used for the incorporation of lime (Davies et al. 2019). Scanlan et al. (2014) suggested that if a tillage operation was used to mix lime to the depths where the soil pH constraint occurs, then theoretically an immediate payback on lime and tillage might be possible. However, re-introduction of deep tillage to a no-till cropping system might have a negative effect on the soil OC, especially in the topsoil (Blanco-Canqui and Lal 2008). Because OC plays an important role in maintaining soil health, it is necessary to evaluate how deep tillage, for incorporation of lime, affects OC.
We conducted a series of laboratory experiments and field experiments to (i) identify the factors that determine the movement of alkalinity into the subsurface, (ii) estimate the amount of undissolved CaCO3 (residual lime) in the topsoil following different liming strategies, (iii) evaluate the feasibility of ameliorating acidic subsurface soil using residual lime and the extent of amelioration that is possible under field conditions and (iv) test whether deep tillage and lime incorporation could significantly speed up the amelioration of subsurface soil acidity and improve the rooting depth of a grain crop in soil without any previous liming history.
Methodology
pH and lime stratification in long-term field experiments
The Department of Primary Industries and Regional Development has conducted several long-term soil acidity management experiments in WA, in which a wide range of lime rates (cumulative total 0–8.5 Mg ha–1) was applied. Two current long-term lime field experiment sites were selected for this study (Table 1). These experiments were selected to represent low to medium rainfall regions in the grainbelt of WA and an arid BSh type climate (Peel et al. 2007). The experiments also varied due to the rate and frequency of lime application. Both sites were situated on level to gentle slope (0–3°). Soil at the experimental sites had predominantly developed on lateritic parent material (McArthur 2004) and were both classified as Yellow-orthic acidic Tenosols in the Australian Soil Classification (Isbell 2002) and as Profundic Lixosols in World Reference Base (IUSS Working Group WRB 2015).

|
Soil samples were collected in bulk (four cores per depth interval per plot and bulked) in autumn 2018 from triplicated unlimed plots and limed plots that had received the highest rate of lime from the two lime experiments (Table 1). These samples were collected from 0–0.10, 0.10–0.20 and 0.20–0.30 m depths, using a stainless steel pipe with 4-cm inner diameter, to measure pH in 0.01 M CaCl2 (Method 4B1, Rayment and Lyons 2011). Another set of samples was also collected from a soil pit face from 0–0.02, 0.02–0.04, 0.04–0.06, 0.06–0.08 and 0.08–0.10 m depths of the control and lime-treated plots. These samples were used to measure pH (Method 4B1, Rayment and Lyons 2011) and the amount of residual carbonate using the pressure calcimeter principle (Horváth et al. 2005). All soil samples were dried at 40°C in a forced-draught oven and passed through a 2-mm sieve before chemical analysis.
Movement of alkali in the soil column leaching experiment
Bulk soil samples were collected from 0–0.10 m (topsoil) and 0.15–0.30 m (subsurface soil) depths from both untreated (Soil A) and lime-treated (Soil B) plots in the Merredin experiment (Table 1). These soils were air-dried and sieved using 4-mm mesh. The two topsoils were treated with three rates (0, 3.0 and 6.0 Mg ha–1) of lime (94.9 g 100 g–1 equivalent weight of laboratory-grade CaCO3 with following particle size distribution: 0–0.125 mm = 21.6 g 100 g–1, 0.125–0.250 mm = 69.1 g 100 g–1, 0.25–0.50 mm = 8.5 g 100 g–1 and 0.50–1.0 mm = 0.8 g 100 g–1). A rigid polyvinyl chloride (PVC) tube (0.50 m height, 0.10 m diameter) was used to prepare the soil column. Untreated subsurface soil was filled at 0.10–0.50 m depth. Lime-treated or unlimed control topsoil was filled at 0–0.10 m depth. Five rhizon soil pore water samplers (MOM; porous tube, mean pore size of 0.15 µm; Rhizosphere Research Products, Wageningen, Netherlands) were installed through a 2.5-mm diameter hole in the PVC at 0.075, 0.125, 0.225, 0.325 and 0.425 m depth from the soil surface. Eighteen soil columns were prepared for each soil source. Half of the columns received the equivalent of 0.40 m annual rainfall via irrigation using distilled water, while the other half received 0.80 m. Each irrigation amount was delivered using 26 equal amounts of fortnightly applications and the soil solution (20 mL per sample) was collected bimonthly using a rhizon sampler to measure pH.
Strategic tillage to incorporate residual lime
The incorporation of residual lime in the field was conducted at the Wongan Hills experiment (Table 1). Five lime (90 g 100 g–1 equivalent weight of laboratory-grade CaCO3 with following particle size distribution: 0–0.125 mm = 2.9 g 100 g–1, 0.125–0.250 mm = 61.1 g 100 g–1, 0.25–0.50 mm = 35.2 g 100 g–1 and 0.50–1.0 mm = 0.8 g 100 g–1) rates (0, 0.5, 1, 2 and 4 Mg ha–1) were surface applied in 1994, in a randomised design with four replications (paired plots of 1.8 m × 30 m). This soil profile was originally acidic to a depth of 0.3 m when the experiment was established in 1994 (initial pH of 0–0.10 m = 5.11 and of 0.10–0.30 m = 4.20). One plot from each pair was re-limed as surface application in 1998 at 1.5 Mg ha–1 using the same lime source mentioned above, hence changing the design to a split-plot design (single plots of 1.8 m × 30 m). In 2014, an additional 3 Mg ha–1 of lime (again using the same lime source mentioned above) was surface applied to half of the area of each plot (plots of 1.8 m × 15 m). In April 2018, the plots were divided into three incorporation treatments of 0, 0.15 or 0.25 m depths (plots of 1.8 m × 5 m). A rotary hoe was used to apply the incorporation treatments. Measurements were not taken from every plot in 2019. The treatments that were evaluated were a 3 × 2 factorial of 0, 2 or 4 Mg ha–1 lime in 1994, each combined with either no additional lime or an additional 1.5 Mg ha–1 of lime in 1998 and an additional 3 Mg ha–1 of lime in 2014 (i.e. total lime rates during 1994–2018 of 0, 2, 4, 4.5, 6.5 and 8.5 Mg ha–1), across 0 and 0.25 m tillage depths. Soil samples (four cores per depth interval per plot and bulked) were collected from 0–0.10, 0.10–0.20 and 0.20–0.30 m depths, using a stainless steel pipe with 40-mm inner diameter, to measure pH in 0.01 M CaCl2 (Method 4B1, Rayment and Lyons 2011) and OC using the Walkley–Black method (Nelson and Sommers 1982).
Deep tillage to incorporate lime for rapid pH improvement
This ongoing field experiment was established in April 2018 in a continuously cropped paddock near Kalannie, WA (30.42°S, 117.29°E), and the site has an arid BSh type climate (Peel et al. 2007). The soil is classified as a Yellow-orthic acidic Tenosol in the Australian Soil Classification (Isbell 2002) and a Profundic Lixosol in World Reference Base (IUSS Working Group WRB 2015). Both surface and subsurface soils were strongly acidic (pH of 0–0.10 m = 4.35 and of 0.10–0.30 m = 3.95). This soil had a loamy-sand texture throughout the sampling depths. The paddock was highly compacted (penetrometer resistance 3.0–4.0 MPa through 0.1–0.6 m depth at field capacity). The soil had low levels of OC: 0.85 g 100 g–1 for 0–0.1 m and 0.32 g 100 g–1 for 0.1–0.3 m.
The experiment consisted of plots of 3 m × 2 m size within a randomised block design, replicated three times. There were five soil amelioration treatments comprising an untreated control (T0) and four treatments involving tillage for the removal of only compaction to a depth of 0–0.45 m (T1) or removal of both compaction (0–0.45 m depth) and acidity at three different depths (T2–T4).
For the four amelioration treatments (i.e. T1–T4), two soil layers (0–0.10 and 0.10–0.30 m depths) were removed separately and then replaced. A third layer (0.30–0.45 m depth) was then spaded in situ using a small rotary hoe to a depth of ~0.45 m. For T4, 1.5 Mg ha–1 lime (94.9 g 100 g–1 equivalent weight of laboratory-grade CaCO3) was spread on top of the third layer before rotary hoeing. The second layer (0.10–0.30 m depth) was then back-filled and 3 Mg ha–1 lime was applied for T3 and T4 before all the plots were rotary hoed. The top layer was then returned and 1.5 Mg ha–1 lime was applied to the T2–T4 plots before all the plots were rotary hoed.
The experiment was sown on 10 May 2018 to wheat (Triticum aestivum L.) cv Mace at 60 kg ha–1 with 0.22-m row spacing and 0.03-m sowing depth. All plots were fertilised with 37 kg ha–1 of mono-ammonium phosphate (21.9 g phosphorus 100 g–1, 10 g nitrogen 100 g–1), 100 kg ha–1 of sulfate of potash (41.5 potassium 100 g–1 and 17 g sulfur 100 g–1) and 57 kg ha–1 of urea (46 g nitrogen 100 g–1) at sowing. Mono-ammonium phosphate was drilled at 0.07 m depth using an offset disc and sulfate of potash and urea were broadcasted using a hand spreader.
Wheat root architecture (for T0, T1 and T4 as shown in Fig. 1) was imaged repeatedly in situ using a 360° scanner (CI-600, CID Bio-Science, Camas, WA, USA) inserted in clear glass tubes (Rhizo tubes, ICT International, Armidale, NSW). Soil profile samples were collected at 0–0.10, 0.10–0.20, 0.20–0.30, 0.30–0.40 and 0.40–0.50 m depths from each plot in July 2018. These samples were used to measure pH (Method 4B1, Rayment and Lyons 2011) and CaCl2-extractable total aluminium (Al) (Bromfield 1987). Soil resistance (SR) was measured in July 2018 when soil moisture was at field capacity using a hand-held electronic cone penetrometer (CP40II, Rimik Pty Ltd, Toowoomba, Qld).

|
Statistical analyses
For the long-term field experiments at Wongan Hills and Merredin, a one-way ANOVA was performed in Genstat (Version 18.1, VSN International, Oxford, UK) at each depth with lime rates as the factor and soil pH, annual changes in soil pH or the amount of residual carbonate as the variate. In order to cater for the random effects of repeated liming programs in the above two experiments, a linear mixed model, using the Genstat restricted maximum likelihood (REML) algorithm directive, was applied. For the soil column leaching experiment, a two-way ANOVA was performed at each depth with irrigation rates and lime rates as the factors and soil solution pH as the variate. For the strategic tillage experiment at Wongan Hills, a three-way ANOVA was performed at each depth with tillage depths, lime rates in 1994 and subsequent lime application in 1998 and 2014 as the factors and soil pH or OC as the variate. For the deep tillage experiment at Kalannie, a one-way ANOVA was performed at each depth with lime incorporation treatment as the factor and SR, soil pH or Al as the variate. In order to cater for the random effects of the farmers’ machinery-based activities (strategic tillage in Wongan Hills and deep tillage in Kalannie), a linear mixed model, using the Genstat REML algorithm directive, was applied. In all ANOVA tests, Fisher’s least significant difference (l.s.d.) was applied at P < 0.05 to compare treatment effects.
Results
pH and lime stratification in long-term field experiments
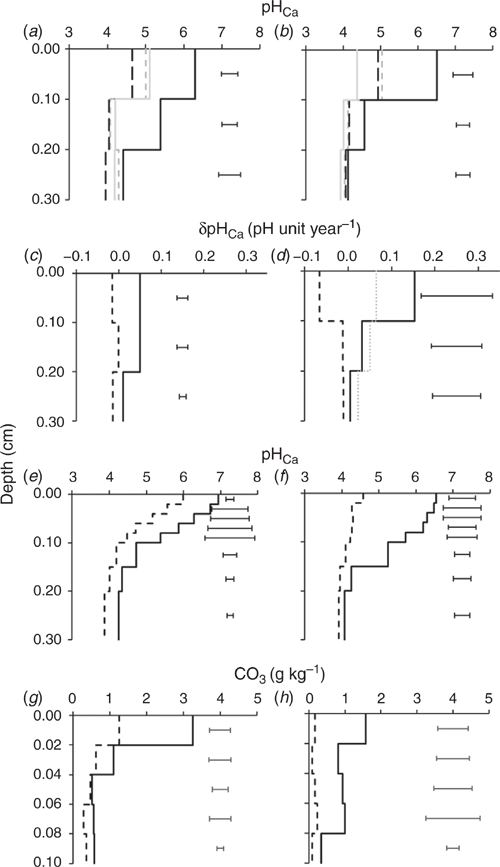
The soil pH of the 0.10-m increment samples significantly increased in the 0–0.10 m depth in the limed plots compared with the initial pH in 1994 for the Wongan Hills experiment and in 2008 for the Merredin experiment (Fig. 2a and b). The three applications of lime totalling 8.5 Mg ha–1 lifted the pH from an initial 5.11 to 6.30 in Wongan Hills (Fig. 2a). Similarly, at Merredin, two applications of lime totalling 6 Mg ha–1 increased pH in the 0–0.10 m depth to 6.61 from an initial pH of 4.93 (Fig. 2b). There was a 1.18 pH unit increase (from 4.21 in 1994 to 5.39 in 2018) in the 0.10–0.20 m depth at Wongan Hills and a 0.40 pH unit increase (from 4.17 in 2008 to 4.57 in 2018) at Merredin. The pH in the 0.20–0.30 m depth did not significantly increase at either site from initial pH values over the duration of 24 or 10 years respectively. The pH in the 0–0.10 m depth of the unlimed control plots decreased by almost 0.50 pH units in both experiments with respect to initial pH at each site. The pH in the 0.10–0.20 and 0.20–0.30 m depths in the untreated control plots did not significantly decrease from their initial values. However, soil pH in 2018 from the 0.10–0.20 and 0.20–0.30 m depths in the control plots was significantly lower than the limed plots.
|
The annual net increase was significant for soil pH in the 0–0.10 and 0.10–0.20 m depths of the limed plots (compared with the original pH measured in 1994) for Wongan Hills, but not for the 0.20–0.30 m depth (Fig. 2c). The rate of increase in pH in the top 0.20 m of soil was also quite uniform at around 0.050 pH unit per year (over 24 years), but only 0.009 pH unit per year in the 0.20–0.30 m depth. The net annual pH change at Merredin was also significant, but only for the 0–0.10 m depth (Fig. 2d). At Merredin the rate of increase in pH in the top 0.10 m soil was 0.154 pH unit per year, compared with only 0.032 and 0.005 pH unit per year in the 0.10–0.20 and 0.20–0.30 m depths respectively. The annual net decrease in soil pH (net acidification rate) in the control plots was not significant for any of the depth intervals at Wongan Hills. However, it was significant only for the 0–0.10 m depth at Merredin. The net acidification rate in the 0–0.10 m depth of the control plots was 0.066 and 0.015 pH unit per year Merredin and Wongan Hills respectively. At both sites the acidification rates in the deeper depths were similar, but much smaller (annual decrease of 0.010 pH unit) compared with the top 0.10 m of soil.
The significant effect of lime to increase soil pH in the traditional 0.10-m depth increment (Fig. 2a and b) represents an underestimation of the change in 0–0.04 m and an overestimation of the change in 0.06–0.10 m compared with the results from soil samples collected from the soil pit face at smaller increments (Fig. 2e and f). Soil pH in both limed and control plots was stratified and more prominent in limed plots. For all limed soils, the highest soil pH was recorded in the 0–0.04 m depths. The magnitude of the differences in subsurface soil pH between limed and unlimed soils, however, varied between experimental sites. The Wongan Hills experiment – being the oldest, with a total of 8.5 Mg ha–1 lime applied (over three applications), having less clay content and receiving medium rainfall – had a consistently larger improvement in subsurface soil pH compared with Merredin (Fig. 2e and f).
Residual carbonate was detected for both unlimed and limed soils (Fig. 2g and h). The residual carbonate in the 0–0.02 m depth in the limed plots was significantly higher than the unlimed plots at Wongan Hills and Merredin (P < 0.05). The residual carbonate in the 0.02–0.04 m depth in the limed plots was also significantly higher than the unlimed plots in both sites, but only at P < 0.10. The residual carbonate in the 0.04–0.10 m depth was not significantly different for the lime rates; however, lime-treated soils tended to have higher residual carbonate. There was 1.96 Mg ha–1 more residual carbonate in the 0–0.10 m depth of the lime-treated than the control plots at Wongan Hills and correspondingly 2.56 Mg ha–1 more at Merredin.
Movement of alkali in the soil column leaching experiment
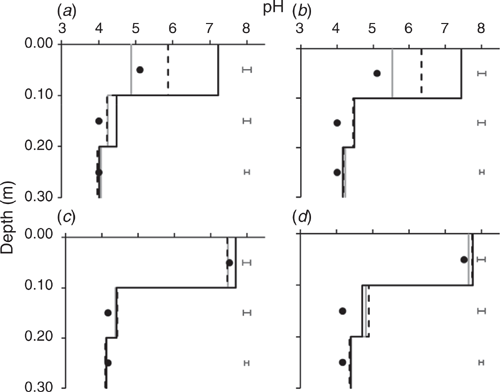
For Soil A (unlimed field soil) there was a significant increase (P < 0.05; l.s.d. 0.22) in the pH of the soil solution of the 0–0.10 m layer for the 3 and 6 Mg ha–1 lime treatments in both irrigation treatments (Fig. 3a and b). Soil solution pH increased to 6.10 and 7.34 for the 3 and 6 Mg ha–1 lime treatments respectively, from an initial pH 5.11. There was also a significant increase in the soil solution pH of the 0–0.10 m layer for ‘Soil B’ (previously limed field soil), but only for the 6 Mg ha–1 lime rate under 0.4-m irrigation treatment (Fig. 3c and d). The irrigation treatment affected soil solution pH collected from the 0–0.10 m layers of both soils. The 0.8-m irrigation treatment had significantly higher pH than the 0.4-m irrigation treatment for all lime treatments, except the 6 Mg ha–1 lime rate in Soil B (Fig. 3c and d). In general, soil solution pH in the 0–0.10 m layer of the untreated controls decreased from the initial pH over one year of leaching. This was more evident for Soil A under 0.4-m irrigation treatment (Fig. 3a).
|
There was some movement of alkali into the 0.10–0.20 m layer in the lime-treated columns (Fig. 3). The 0.8-m irrigation treatment (Fig. 3b and d) had significantly higher pH in this layer than the 0.4-m irrigation treatment (Fig. 3a and c). The higher irrigation treatment was more effective in increasing soil solution pH of Soil B (0.40 pH unit) than that of Soil A (0.15 pH unit). Under the 0.4-m irrigation treatment only the highest lime rate was effective in increasing soil solution pH of the 0.10–0.20 m layer compared with the initial soil solution pH (Fig. 3a). The higher irrigation treatment (Fig. 3b and d) significantly increased pH in the 0.20–0.30 m layer compared with the initial soil solution pH. This was consistent for both soils, but greater change occurred for Soil B than A. In contrast, there was no change in pH in the 0.20–0.30 m layer for the lower irrigation treatment (Fig. 3a and c). Lime rates and liming history of the soil did not affect soil solution pH of the 0.20–0.30 m layer. There was no evidence of increasing soil solution pH below 0.30 m for any treatment (data not presented).
Strategic tillage to incorporate residual lime
Soil pH of the without-tillage treatment did not significantly differ for 0 and 2 Mg ha–1 single lime application in 1994 at all depths, but the 4 Mg ha–1 lime treatment significantly increased pH at the 0.20–0.30 m compared with 0 Mg ha–1 lime rate (Table 2). Plots that received additional applications of lime in 1998 (1.5 Mg ha–1) and 2014 (3.0 Mg ha–1) had significantly higher soil pH at the 0–0.10 m depths compared with the plots that received a single application of 0, 2 or 4 Mg ha–1 lime in 1994. Plots that received 2 or 4 Mg ha–1 lime in 1994 and an additional application of lime in 1998 (1.5 Mg ha–1) and 2014 (3.0 Mg ha–1) also had significantly higher soil pH at the 0.10–0.20 m depths compared with the control. Only the plots that received 4 Mg ha–1 lime in 1994 and an additional application of 1.5 Mg ha–1 lime in 1998 and 3.0 Mg ha–1 in 2014 had significantly higher soil pH at the 0.20–0.30 m depths compared with the control.

|
With deep tillage, soil pH in the 0–0.10 m depth of the unlimed plots significantly decreased (–0.32 pH units, P < 0.10) compared with the unlimed plots in the no tillage treatment, but no significant changes were recorded for any other lime treatments at 0–0.10 m depth. Deep tillage significantly increased soil pH in the 0.10–0.20 m depth for 4 Mg ha–1 single application and other rates that had an additional application of 1.5 Mg ha–1 lime in 1998 and 3.0 Mg ha–1 in 2014 compared with unlimed plots. Deep tillage also significantly increased soil pH in the 0.20–0.30 m depth for the two highest cumulative lime rates compared with unlimed plots.
The highest lime rate (8.5 Mg ha–1), with or without deep tillage, increased pH above the recommended subsurface soil pH of 4.80 (Gazey et al. 2014) down to 0.30 m depth. The second and third highest lime rates (6.5 and 4.5 Mg ha–1), without deep tillage, also increased pH to the recommended level in the 0.10–0.20 but not the 0.20–0.30 m depth. Combining deep tillage with the second highest lime (6.5 Mg ha–1) increased pH to the recommended level in the 0.20–0.30 m depth but not for the third highest lime rate (4.5 Mg ha–1). Treatments with 2 or 4 Mg ha–1 of lime in 1994 (no additional lime afterwards), without deep tillage, did not increase subsurface soil pH above the recommended level. Deep tillage combined with 2 or 4 Mg ha–1 of lime in 1994 increased pH above the recommended level for the 0.10–0.20 but not the 0.20–0.30 m depth. The pH at 0–0.10 m depth was above the recommended surface soil pH of 5.5 for all plots except for the unlimed tilled plots.
There was no significant increase in OC corresponding to improved soil pH profiles in the lime-treated plots (Table 3). Tillage significantly decreased OC in the 0–0.10 m depth of the unlimed plots. No significant effect of deep tillage on OC was observed in the 0.10–0.20 and 0.20–0.30 m depths.

|
Deep tillage to incorporate lime for rapid pH improvement
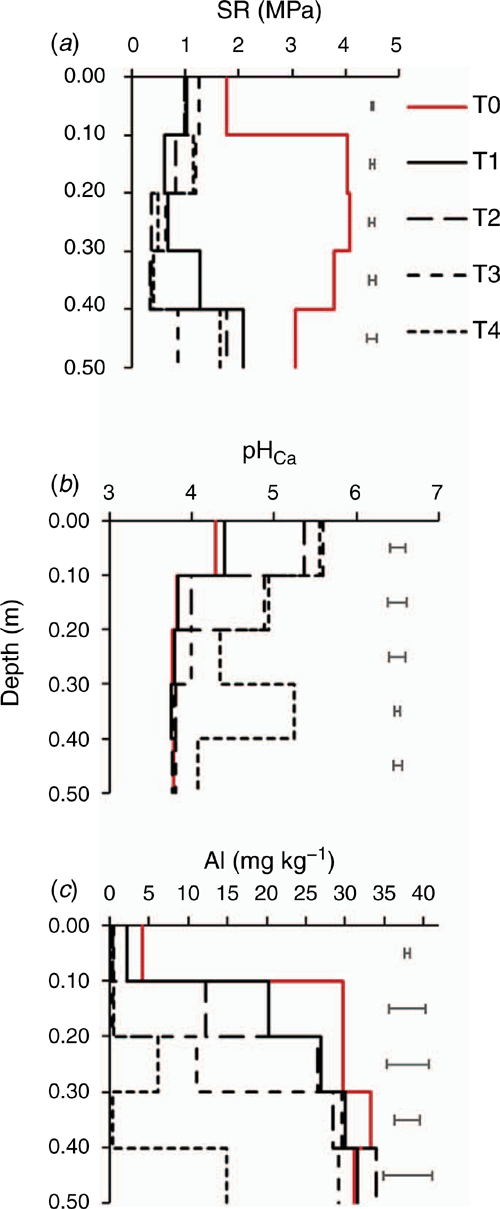
Deep tillage significantly decreased SR from 3–4 MPa in the control plots to 0.5–1.5 MPa in the tilled plots by removing soil compaction and there was no significant difference among the four amelioration treatments (Fig. 4a). All lime incorporation treatments increased soil pH to the minimum recommended pH of 5.5 in the 0–0.10 m depths and 4.8 in most lime-incorporated subsurface soil layers within two months (Fig. 4b). Within the same duration, liming also decreased total Al from a toxic range to below the critical level for major grain crops. The tillage-only treatment (T1) also decreased Al concentration, especially at 0.10–0.20 m depth (Fig. 4c).
|
There was a significant visual improvement in root growth (e.g. maximum rooting depth, thickness of root and production of root hairs) in treatments T1 (Fig. 1d–f) and T4 (Fig. 1g–i) compared with T0 (Fig. 1a–c). However, all the images showed that the appearance of roots on the surface of the rhizotron tubes was not uniform due to variation in the distance between one wheat plant and another. Maximum rooting depth for the unameliorated control (T0) was restricted to 0.26 ± 0.01 m depth compared with 0.51 ± 0.04 m in T1 and 0.59 ± 0.01 m in T4. There was no significant visual difference between the treatments in abundance and thickness of roots at 0–0.10 and 0–0.20 m depths. Treatment T0 had fewer and thicker roots in 0.20–0.30 m depth compared with more and finer roots for T1 and T4. Treatment T4 had had more roots below 0.30 m compared with T1. There were also more fine roots and roots hairs in the deeper layers where lime was incorporated (T4 compared with T1).
Discussion
Restricted vertical movement of alkali in long-term lime experiments
Our results from two long-term lime experiments using traditional 0.10-m increment soil sampling showed that repeated surface applications of lime (totalling 6.0 or 8.5 Mg ha–1) over a duration of 10–24 years maintained pH above 5.50 in the 0–0.10 m depth. We also found subsurface soil pH increased from the initial pH measured at the onset of the experiments (Fig. 2a and b), but it was restricted to the top 0.20 m. The improvement in surface soil pH resulted in movement of alkali, which increased subsurface soil pH and decreased net acidification due to continuous cropping, consistent with results of Conyers et al. (2003a). Li et al. (2019) reported a significant increase in soil pH to 0.30 m from a long-term experiment with a vigorous lime regime (18 years old, cumulative lime rate 8.6 Mg ha–1) in southern New South Wales, Australia. Differences between our study and that of Li et al. (2019) that may explain greater movement include finer (£250 µm) and higher neutralising value (98 g 100 g–1 equivalent weight of laboratory-grade CaCO3) lime at a site with higher annual rainfall (0.63 m). With more-precise sampling from the soil pit face, the increase in soil pH in our study was restricted to the top 0.15 m depth (Fig. 2e and f), similar to that measured by Nunes et al. (2019). Unlimed control plots were acidified at all sampling depths at 0.010 pH units per year. This is mainly due to leaching of nitrate nitrogen (from an organic or ammonium based nitrogen source) into deeper soil horizons, a process that generates more H+ in the soil profile and acidifies soil (a decrease in pH from the initial pH) as suggested by Helyar (1976). Although the difference in pH in the 0.20–0.30 m depth between the control and limed plots was significant, it was mainly due to net acidification in the control plots (Fig. 2c and d).
The net increase in soil pH was restricted to the 0.10–0.20 m depth and only at the Wongan Hills site. Although the Merredin site had a greater rate of increase in soil pH in the 0–0.10 m depth compared with Wongan Hills, there was higher variability at Merredin and the net annual increase was significant in the 0–0.10 m depth only (Fig. 2c and d). The difference between the two sites could be due to the differences in experiment duration and crop productivity. Similar to the findings of Scott et al. (1999), the Wongan Hills experiment (24 years old and highly productive site) is likely to have re-acidified after liming to a greater extent than the Merredin site (10 years old, low productive site). The Wongan Hills soil also has higher organic matter content and, therefore, would have had higher pH buffering capacity than the Merredin soil (Li et al. 2019).
Our results show that liming lifted soil pH close to the maximum where lime dissolution slows down (Nelson and Su 2010), hence a large proportion of the lime applied was stratified in the top few centimetres of surface soil (Fig. 2g and h). However, soil pH in the 0.04–0.10 m depths was also around 5.5 or higher, which probably allowed some movement of alkali into the subsurface soil (Li et al. 2019). Data from both long-term experiments confirm that the vertical movement of alkali is slow, restricted to 0.15–0.20 m. This led us into further studies to identify whether soil with higher initial pH along with higher rainfall has potential to speed up the movement of alkali.
Factors affecting vertical movement of alkali in soil columns
Our results demonstrated lime incorporation rapidly and significantly increases soil solution pH of acidic topsoil (Soil A) but not for the soil that was previously limed (Soil B). This is because the lime dissolution rate is higher in acidic conditions; the rate decreases with increasing pH and dissolution stops in neutral or alkaline conditions (Nelson and Su 2010). However, we found an increase in the surface 0.10 m soil solution pH for Soil B with the 6 Mg ha–1 lime rate (Fig. 3c and d), which could be due to an increased cation exchange capacity after liming (Aitken et al. 1990). Our results agree with those of Whitten (2002), finding that leaching decreases surface soil solution pH. This is because leaching enhances the nitrification rate (due to changes in soil biological activity) and downward movement of nitrate that generates release of H+ and acidifies soil (Helyar 1976). A decrease in surface pH can also can be due to downward movement of soluble alkali contained in organic matter of the surface soil (Butterly et al. 2013).
Both 3 and 6 Mg ha–1 lime rates increased the soil solution pH in the 0–0.10 m layer to above 5.5, which is the recommended minimum pH for acidic soil in the WA grainbelt (Gazey et al. 2014) and has been shown to enhance the movement of alkali from the surface soil to the more acidic subsurface soil (Li et al. 2019). However, only the highest rate of lime (6 Mg ha–1) was effective at increasing soil solution pH in the 0.10–0.20 m depth of the previously untreated control soil under the 0.4-m irrigation treatment (Fig. 3a). Movement of alkali into the 0.10–0.20 m layer was more effective in previously limed soil, but only in the higher irrigation treatment. The higher irrigation treatment probably generated a greater rate of movement of soluble alkali resulting from increased water content and hydraulic conductivity (van Genuchten and Wierenga 1976). There was no evidence of increasing soil solution pH below 0.20 m depth, contrary to the evidence reported by Whitten (2002) in which a much higher watering regime was applied compared with our experiment. Our experiment suggests that the potential to treat subsurface soil acidity by surface incorporation of high rates (3–6 Mg ha–1) of lime is limited and likely only to be effective in less-acidic topsoil (pH > 5) in higher rainfall regions, but the rate of improvement in pH is slow as measured by Nunes et al. (2019), and slower than that measured by Whitten (2002). This prompted us to test whether strategic deep tillage is a better solution for deep incorporation of lime for rapid amelioration of subsurface soil acidity.
Strategic deep tillage for faster improvement in soil pH profile
Results from two long-term experiments at Wongan Hills and Merredin suggest that soil pH was stratified at the centimetre-scale where the top 0.04 m of soil had pH around 7.0 (Fig. 2e and f) and hence, a large fraction of applied lime remained undissolved (Fig. 2g and h). To overcome lime and pH stratification, a once-off deep tillage could opportunistically be used for the incorporation of lime (Davies et al. 2019). From a laboratory experiment, Azam et al. (2019) showed that residual lime could manage subsurface soil acidity to a depth of 0.80 m if it can be incorporated and adequately mixed. The application of deep tillage treatments to incorporate residual lime significantly increased subsurface soil pH to the recommended pH of 4.8 to the depth of incorporation in the plots that received a cumulative lime rate of 6.5 or 8.5 Mg ha–1 at Wongan Hills (Table 2). Deep tillage in the limed plots resulted in an increase of 0.63 pH unit at 0.10–0.20 m depth within a growing season, which is 12 times the annual net increase in pH without tillage (Fig. 2c). With deep tillage, however, soil pH and OC in the 0–0.10 m depths of the unlimed plots significantly decreased (P < 0.10), supporting the findings of Conyers et al. (2003b) as well as of Blanco-Canqui and Lal (2008), demonstrating the negative effect of tillage in absence of lime. This is mainly due to dilution of topsoil containing higher pH and OC with subsurface soil that had lower pH and OC. Deep tillage to all plots that were previously limed did not decrease OC at any depth.
Our results from the Kalannie experiment demonstrate that deep lime incorporation with tillage increased soil pH by more than a pH unit to the depth of lime incorporation within two months, which decreased Al concentration below the critical level toxic for major crops grown in the WA broadacre farming system. Tillage decreased SR by removing compaction as reported by Davies et al. (2019). Removal of compaction together with lime incorporation produced deep root systems (with root hairs), which allowed plants to extract soil water and nutrients from deeper soil horizons (Azam and Gazey 2019). Mace wheat has a medium level of tolerance to Al toxicity (Amjad et al. 2014), which is why the roots (mainly seminal roots) grew down to 0.59 m depth. In lime-incorporated soil layers, there were more fine roots and roots hairs due to an increase in soil pH which reduced toxic Al below the critical level (Menzies et al. 1994).
Conclusions
Surface liming with 5–8.5 Mg ha–1 rate could allow some movement of alkali into the subsurface soil, but the rate of movement is very slow. We found only ~0.5 unit change in soil pH and only in the 0.10–0.20 m depths over a period of 10–24 years, noting that the sites have been subjected to ongoing acidification from continuous cropping. Sampling from the pit face in small increments better defined soil pH stratification than the traditional 0.10-m increment. A large proportion of the surface-applied lime remained undissolved and stratified due to high pH in the top 0.04 m of soil. This residual lime, which we showed could raise pH above 4.8 to the equivalent of 0.80 m soil depth under laboratory conditions (incorporated and adequately mixed) was also able to rapidly raise pH above 4.8 to the depth of incorporation by deep tillage under field conditions at Kalannie and Wongan Hills. Therefore, we conclude that under current conditions of low subsurface soil pH (<4.5) in many parts of the agricultural region of south-western WA, incorporation of lime using cost-effective strategic tillage is likely to be necessary. The opportunity to address multiple soil constraints (for example compaction and hydrophobicity) in the same operation will help to make soil amelioration more cost-effective.
Conflicts of interest
The authors declare no conflicts of interest.
Acknowledgements
We are thankful to the Government of Western Australia and the Grains Research and Development Corporation (GRDC DAW00252) for investing in this work. We thank Daron Malinowski, Richard Bowles and Ross Gazey for assisting in technical aspects of the experiments. We also thank Dr Andrew van Burgel for helping with the statistical analyses. We specially thank Dr Stephen Davies and Dr Craig Scanlan for assistance in the technical aspects of the work as well as conducting internal review of the manuscript. We are also grateful to the anonymous reviewers for the constructive comments.
References
Aitken RL, Moody PW, McKinley PG (1990) Lime requirement of acidic Queensland soils. I. Relationship between soil properties and pH buffer capacity. Australian Journal of Soil Research 28, 695–701.| Lime requirement of acidic Queensland soils. I. Relationship between soil properties and pH buffer capacity.Crossref | GoogleScholarGoogle Scholar |
Amjad M, Scanlan C, Brennan R, French B (2014) Tolerance of wheat varieties to soil acidity and soil aluminium. Grain Industry Association of Western Australia. 2019 Perth Crop Updates. Available at https://grdc.com.au/resources-and-publications/grdc-update-papers/tab-content/grdc-update-papers/2014/05/tolerance-of-wheat-varieties-to-soil-acidity-and-soil-aluminium [verified 6 November 2019].
Azam G, Gazey C (2019) Re-engineering soil pH profiles to boost water use efficiency by wheat. In ‘Proceedings of the Agronomy Conference 2019’, Wagga Wagga, NSW. Available at http://agronomyaustraliaproceedings.org/images/sampledata/2019/2019ASA_Azam_Gaus_351.pdf [verified 15 October 2019].
Azam G, Gazey C, Bowles R, D’Antuono M (2019) Recurring lime applications to fix acidity in the whole soil profile. Grain Industry Association of Western Australia. 2019 Perth Crop Updates. Available at http://www.giwa.org.au/2019researchupdates [verified 9 May 2019].
Blanco-Canqui H, Lal R (2008) No-tillage and soil-profile carbon sequestration: an on-farm assessment. Soil Science Society of America Journal 72, 693–701.
| No-tillage and soil-profile carbon sequestration: an on-farm assessment.Crossref | GoogleScholarGoogle Scholar |
Bromfield S (1987) Simple tests for the assessment of aluminium and manganese levels in acid soils. Australian Journal of Experimental Agriculture 27, 399–404.
| Simple tests for the assessment of aluminium and manganese levels in acid soils.Crossref | GoogleScholarGoogle Scholar |
Butterly CR, Baldock JA, Tang C (2013) The contribution of crop residues to changes in soil pH under field conditions. Plant and Soil 366, 185–198.
| The contribution of crop residues to changes in soil pH under field conditions.Crossref | GoogleScholarGoogle Scholar |
Caires EF, Alleoni LRF, Cambri MA, Barth G (2005) Surface application of lime for crop grain production under a No-Till system research supported by CNPq (Conselho Nacional de Desenvolvimento Científico e Tecnológico), a Brazilian agency related to scientific development. Agronomy Journal 97, 791–798.
| Surface application of lime for crop grain production under a No-Till system research supported by CNPq (Conselho Nacional de Desenvolvimento Científico e Tecnológico), a Brazilian agency related to scientific development.Crossref | GoogleScholarGoogle Scholar |
Conyers MK, Scott BJ (1989) The influence of surface incorporated lime on subsurface soil acidity. Australian Journal of Experimental Agriculture 29, 201–207.
| The influence of surface incorporated lime on subsurface soil acidity.Crossref | GoogleScholarGoogle Scholar |
Conyers MK, Mullen CL, Scott BJ, Poile GJ, Braysher BD (2003a) Long-term benefits of limestone applications to soil properties and to cereal crop yields in southern and central New South Wales. Australian Journal of Experimental Agriculture 43, 71–78.
| Long-term benefits of limestone applications to soil properties and to cereal crop yields in southern and central New South Wales.Crossref | GoogleScholarGoogle Scholar |
Conyers MK, Heenan DP, McGhie WJ, Poile GP (2003b) Amelioration of acidity with time by limestone under contrasting tillage. Soil & Tillage Research 72, 85–94.
| Amelioration of acidity with time by limestone under contrasting tillage.Crossref | GoogleScholarGoogle Scholar |
Davies SL, Armstrong R, Macdonald L, Condon J, Petersen E (2019) Soil constraints: a role for strategic deep tillage. In ‘Australian agriculture in 2020: from conservation to automation’ (Eds J Pratley, J Kirkegaard) pp. 117–135 (Agronomy Australia and Charles Sturt University: Wagga Wagga, NSW). Available at https://www.agronomyaustraliaproceedings.org/index.php/special-publications [verified 6 November 2019].
Edmeades DC, Ridley AM (2003) Using lime to ameliorate topsoil and subsoil acidity. In ‘Handbook of soil acidity’ (Ed Z Rengel) pp. 297–336. (Marcel Dekker Inc: New York)
Fisher J (2019) Soil acidity and liming focus group workshops 3–5 August 2009. Report 2009–01. Desiree Futures, York, WA.
Gazey C, Andrew J, Griffin E (2013) Soil acidity. In ‘Report card on sustainable natural resource use in agriculture,’ Department of Agriculture and Food, Western Australia. Available at https://www.agric.wa.gov.au [verified on 15 October 2019].
Gazey C, Davies S, Master R (2014) Soil acidity: A guide for farmers and consultants, second edition. Bulletin 4858, Department of Agriculture and Food, Western Australia.
Helyar KR (1976) Nitrogen cycling and soil acidification. Journal of the Australian Institute of Agricultural Science 42, 217–221.
Herbert A (2009) Opportunity costs of land degradation hazards in the South-West Agriculture Region. Resource Management Technical Report 349. The Department of Agriculture and Food, Western Australia. Available at https://researchlibrary.agric.wa.gov.au/rmtr/331/ [verified 6 November 2019].
Horváth B, Opara-Nadi O, Beese F (2005) A simple method for measuring the carbonate content of soils. Soil Science Society of America Journal 69, 1066–1068.
| A simple method for measuring the carbonate content of soils.Crossref | GoogleScholarGoogle Scholar |
Isbell RF (2002) ‘Australian soil classification.’ (CSIRO Publishing: Melbourne)
IUSS Working Group WRB (2015) ‘World reference base for soil resources 2014, update 2015. International soil classification system for naming soils and creating legends for soil maps.’ (FAO: Rome, Italy)
Li GD, Conyers MK, Heylar KR, Lisle CJ, Poile GJ, Cullis BR (2019) Long-term surface application of lime ameliorates subsurface soil acidity in the mixed farming zone of south-eastern Australia. Geoderma 338, 236–246.
| Long-term surface application of lime ameliorates subsurface soil acidity in the mixed farming zone of south-eastern Australia.Crossref | GoogleScholarGoogle Scholar |
McArthur WM (2004) ‘Reference soils of south-western Australia,’ (Department of Agriculture, Western Australia: Perth)
Menzies NW, Edwards DG, Bell LC (1994) Effects of calcium and aluminium in the soil solution of acid, surface soils on root elongation of mungbean. Australian Journal of Soil Research 32, 721–737.
| Effects of calcium and aluminium in the soil solution of acid, surface soils on root elongation of mungbean.Crossref | GoogleScholarGoogle Scholar |
National Land and Water Resources Audit (2001) Australian agriculture assessment 2001. Volume 2. (National Land and Water Resources Audit, Land and Water Australia)
Nelson DW, Sommers LE (1982) Total carbon, organic carbon, and organic matter. In ‘Methods of soil analysis, Part 2. Chemical and microbiological properties’. 2nd edn (Eds AL Page, RH Miller, DR Keeney) pp. 539–579. (American Society of Agronomy: Madison, WI, USA)
Nelson PN, Su N (2010) Soil pH buffering capacity: a descriptive function and its application to some acidic tropical soils. Australian Journal of Soil Research 48, 201–207.
| Soil pH buffering capacity: a descriptive function and its application to some acidic tropical soils.Crossref | GoogleScholarGoogle Scholar |
Nunes MR, Denardin JE, Vaz CMP, Karlen DL, Cambardella CA (2019) Lime movement through highly weathered soil profiles. Environmental Research Communications 1, 115002
| Lime movement through highly weathered soil profiles.Crossref | GoogleScholarGoogle Scholar |
Peel MC, Finlayson BL, McMahon TA (2007) Updated world map of the Koppen-Geiger climate classification. Hydrology and Earth System Sciences 11, 1633–1644.
| Updated world map of the Koppen-Geiger climate classification.Crossref | GoogleScholarGoogle Scholar |
Petersen E (2016) Economic analysis of the impact and management of subsoil constraints. Grain Industry Association of Western Australia. 2016 Perth Crop Updates. Available at http://www.giwa.org.au/_literature_209544/Petersen,_Liz_-_Economic_analysis_of_the_impacts_and_management_of_subsoil_constraints [verified 6 November 2019].
Rayment G, Lyons D (2011) ‘Soil chemical methods: Australasia.’ (CSIRO Publishing: Melbourne)
Rengel Z (2003) ‘Handbook of soil acidity.’ (Marcel Dekker Inc: New York)
Reynolds CD, Betti G, Davies SL (2018) Testing options for the management of soil water repellence and subsoil compaction in dry environment. In ‘Proceedings of National Soils Conference’, 18–23 November 2018, Canberra, ACT (Eds. N Hulugalle, T Biswas, R Greene, P Bacon) (Soil Science Australia). Available at https://www.soilscienceaustralia.org.au/wp-content/uploads/2019/10/Proceedings-Natl.-Soil-Sci-Conf-Canberra-18-23-Nov-2018-FINAL_reduced-size-1.pdf [verified 6 November 2019].
Scanlan C, Brennan R, Sarre G (2014) Shifting investment from nutrients to lime and cultivation on acid soils: is an immediate payback possible? GRDC Updates Papers. Available at https://grdc.com.au [verified 15 October 2019].
Scott BJ, Conyers MK, Poile GJ, Cullis BR (1999) Reacidification and reliming effects on soil properties and wheat yield. Australian Journal of Experimental Agriculture 39, 849–856.
| Reacidification and reliming effects on soil properties and wheat yield.Crossref | GoogleScholarGoogle Scholar |
Sumner ME, Shahandeh H, Bouton J, Hammel J (1986) Amelioration of an acid soil profile through deep liming and surface application of gypsum. Soil Science Society of America Journal 50, 1254–1258.
| Amelioration of an acid soil profile through deep liming and surface application of gypsum.Crossref | GoogleScholarGoogle Scholar |
van Genuchten MT, Wierenga PJ (1976) Mass transfer studies in sorbing porous media I. Analytical solutions. Soil Science Society of America Journal 40, 473–480.
| Mass transfer studies in sorbing porous media I. Analytical solutions.Crossref | GoogleScholarGoogle Scholar |
van Gool D (2011) Wheat yield potential and land management constraints in the south west of Western Australia. Available at https://www.agric.wa.gov.au [verified 15 October 2019].
Whitten M (2002) Amelioration and prevention of agriculturally generated subsurface acidity in sandy soils in Western Australia, PhD Thesis, University of Western Australia, Crawley, Australia.