

Comparison of soil analytical methods for estimating plant-available potassium in highly weathered soils
Miaomiao Cheng A B * , Richard Bell A B , Jordan Brown C , Qifu Ma A B and Craig Scanlan A B D
A Centre for Sustainable Farming System, Food Futures Institute, Murdoch University, Perth, WA, Australia.
B SoilsWest, Murdoch University, Perth, WA, Australia.
C Curtin Biometry and Agriculture Data Analytics, School of Molecular and Life Sciences, Curtin University, Perth, WA, Australia.
D Department of Primary Industries and Regional Development, Northam, WA, Australia.
Soil Research 61(7) 717-733 https://doi.org/10.1071/SR22270
Submitted: 4 January 2023 Accepted: 7 June 2023 Published: 10 July 2023
© 2023 The Author(s) (or their employer(s)). Published by CSIRO Publishing. This is an open access article distributed under the Creative Commons Attribution-NonCommercial-NoDerivatives 4.0 International License (CC BY-NC-ND)
Abstract
Context: The NaHCO3-extractable soil K test (Colwell K) is the most frequently used method for soil K across Australia, but there is still uncertainty about the suitability of K testing guidelines for heavy-textured soils.
Aims: To determine whether Colwell K is suitable for predicting plant-available K on loam- and clay-textured soil types developed from highly weathered soil parent materials in Western Australia (WA).
Methods: Nine soil K testing methods were used to determine plant-available K on 21 soil types with a wide range of properties collected from three depths on the northern, central and southern farmlands in WA.
Key results: Quartz and K-feldspars were the dominant minerals in all soils, while limited white mica (1–2%) was identified in less than 10% of samples. The amount of K extracted by silver thiourea was only about 70% of the amounts extracted by NaHCO3 (Colwell K) and NH4OAc. Soil non-exchangeable K extracted by nitric acid and sodium tetraphenyl borate were from similar K pools, while aqua regia K was 1–6 times higher than these values.
Conclusion: There was no systemic difference or proportional bias between NH4OAc K and Colwell K, and both had good model performance (R2 > 0.86) for total K uptake by wheat in a single growing season in a wide range of soils.
Implication: In this diverse range of soils formed from weathered parent materials, the reliance on exchangeable K for plant K uptake suggests that plant-available K will be vulnerable to rundown due to negative K balances.
Keywords: Colwell K, NH4OAc K, nutrient uptake, potassium, soil analysis, soil fertility, soil–plant interaction.
Introduction
Large areas of the world’s agricultural land are deficient in soil potassium (K) supply (Zhang et al. 2021). Soils with low levels of plant-available K tend to be either sands with low K reserves, or clays with high K-fixation capacity (Murrell et al. 2021). In both cases, negative K balances at the farm gate continue to exacerbate K deficiencies. In the region used for grain production in Western Australia (WA), due to continued removal of K in harvested grain and historically low fertiliser K application rates (Harries et al. 2021), negative K balances threaten crop productivity due to declining soil K levels including on loam- and clay-textured soils that have not yet been assessed for K supply to crops (Ma et al. 2022).
Soil tests are routinely used to provide guidance for whether application of K fertiliser would be beneficial in a typical growing season (Brennan and Bell 2013). Soil solution K is the form directly taken up by plants, and is generally extracted using 0.01 M CaCl2 (Sparks 1987; Hinsinger 2020). Surface-adsorbed K is the K associated with negatively charged sites in soil, and is readily available for release into the soil solution in response to depletion by root uptake (Barber 1995). The tests most commonly associated with the measurement of surface-adsorbed K are referred to as exchangeable K, which is the most commonly used indicator of soil K supply for crops and pastures. Several soil test extractions have been developed for assessing soil exchangeable K, including NH4Cl, NH4OAc, NH4HCO3, NaHCO3 and BaCl2 (Colwell and Esdaile 1968; Spencer and Govaars 1982; Rayment and Lyons 2011). The ammonium ion (NH4+) has been widely used to exchange with K+, while the NaHCO3-extractable soil K test (Colwell K) has been extensively used by soil testing laboratories for soil exchangeable K in Australia (Colwell and Esdaile 1968; Brennan and Bell 2013). Colwell K has been referred as the standard test for K deficiency prediction in WA and is the most frequently used method reported in the available database (e.g. The Best Fertiliser Decision for Crops National Database) across Australia (Rayment and Lyons 2011; Brennan and Bell 2013). In soils containing significant amounts of phyllosilicate minerals with hydrated interlayers, variable amounts of interlayer K can be replaced by extractants containing NH4+, given the similar size, charge and hydration energy to those of K (Bell et al. 2021a). Thus, the amount of K extracted by different methods in the same soil varies due to the different extracting solution and conditions, especially in soils where 2:1-layer silicates are present and interlayer K is likely to occur.
Exchangeable K tests are not always highly correlated with plant response, because K from other pools can also make an important contribution to the K nutrition of plants, supplying up to 100 kg K/ha·year in some agricultural systems (Hinsinger 2006). Interlayer K is bound between layers of phyllosilicate minerals, the availability of which depends on the types of phyllosilicate minerals and the interlayer adsorption sites (Hinsinger 2006; Bell et al. 2021b). Structural K (90–98%) is normally the most abundant form of soil K, mostly associated with feldspars and feldspathoids, but the quantities in soil are determined by the intensity of weathering and also erosional and depositional factors (Sparks 1987). The contributions of interlayer K and structural K to crop uptake vary with soil type and mineralogy. For example, micas are generally more prevalent in younger and less weathered soils, therefore near-edge, interlayer K can make a significant contribution to plant uptake from less weathered soils in temperate regions. It has also been reported that even in tropical kaolinitic soil with limited exchangeable K, non-exchangeable K could contribute more than 80% of the K taken up by crops (Volf et al. 2021). Non-exchangeable K has been commonly estimated by the difference between the 1 M nitric acid (HNO3)-extractable K (Nitric K) and exchangeable K, as the strong acid could amplify the intensity of the hydrolysis reaction to dissolve K-bearing silicates (Mclean and Watson 1985). The sodium tetraphenyl borate (NaTPB) extraction method was developed by Cox et al. (1999) to characterise the rate of release of K into solution from the interlayer K and structural K. This method has flexibility as a soil test because the extraction time can be varied to alter the amount of K released, i.e. short reaction time correlates with release of K from vermiculite interlayers, and longer reaction time correlates with extraction of more K from primary minerals.
The K extracted by different methods differs in the accessibility to plant roots and therefore to plant acquisition. It is challenging to extrapolate the K bioavailability to plants across soil types with differing mineralogy. Although different critical levels for Colwell K have been identified for different soils in Australia (Brennan and Bell 2013), there is no evidence that Colwell K is actually the best approach to measure plant-available K in these soils. Pal et al. (2001a) found that exchangeable K was a good indicator of K supply to plants in most of soils in south-western WA, but in some soils non-exchangeable K accounted for about 25% of plant K uptake, which might have been released from the K-containing minerals, illite, vermiculite or feldspar. Similarly, Moody and Bell (2006) showed that cumulative K uptake by plants was 35% higher than the change in exchangeable K in 30 of 37 agricultural soils from south-east Queensland, and the amounts of K extracted by NaTPB were highly correlated with K uptake across all soils, indicating that NaTPB methods could quantitatively estimate the available K. These differences may reflect the highly weathered landscapes of WA and the predominance of weathered minerals in soils (McArthur 2004) used in the study by Pal, but higher K reserves in clay-rich soils from south-east Queensland. However, past research on K–crop response experiments has heavily focused on lighter textured soils in WA, like Tenosols, Chromosols and Kandosols, which occupy about 50% of agricultural soils in WA (Brennan and Bell 2013; van Gool et al. 2018). Monitoring of soil K reserves is increasingly important in all soil types to ensure that soil K supply is not constraining grain yield (Ma et al. 2022). Therefore, further study is needed to determine if there is a better soil test to measure plant-available K over a wider range of soil types that occur in WA, especially on the loam- and clay-textured soils which may contain K-bearing clay minerals and feldspar (McArthur 2004).
The aims of this study were to (1) determine the relationship between the different pools of extracted soil K across WA soils with contrasting properties and (2) compare the predictive performance of different soil K extraction methods for plant-available K in those soils. It was hypothesised that the presence of mica, illite or feldspar in loam- and clay-textured soils could play a significant role in K supply for plant uptake, and hence influence which K test method should be recommended for K management in these soils.
Methods
Soil collection
Twenty-one soil types with a wide range of properties (pH, organic carbon, clay content and mineralogy) were collected at 0–10, 10–20 and 20–30 cm depths from soils used for grain production in WA. Many of the sites were adjacent to Reference soil sites (McArthur 2004) studied by Pal et al. (1999), but on soil that has been used for grain or pasture production, rather than native vegetation. After being air-dried, the soils were sieved through a 2-mm sieve for soil analyses and the glasshouse experiment. Basic soil properties were measured according to the methods of Rayment and Lyons (2011): pH was measured using 0.01 M CaCl2 solution with a soil:solution of 1:5 (4B4); electrical conductivity (EC) was measured using 1:5 soil:water extract (3A1); organic carbon (OC) was measured using the Walkley–Black method (6A1); exchangeable cations (Ca, Mg, Na and K) were extracted using a mixture of 0.1 M ammonium chloride and barium chloride at a ratio of 1:10 (15E1). Soil particle size was measured using mid infra-red method at the CSBP Soil and Plant Analysis Laboratory. Soil classification and some basic soil properties are presented in Table 1.
| Num. | Ref soil or WASG equivalent | Australian soil classification | Depth (cm) | Texture | Clay (g/kg) | Organic carbon (g/kg) | pH (CaCl2) | ECEC (cmolc/kg) | EC (1:5) (dS/m) |
|---|---|---|---|---|---|---|---|---|---|
| 1 | TUT 7 P2 | Red Dermosol | 0–10 | Sandy Clay Loam | 209 | 37.4 | 5.1 | 11.6 | 0.25 |
| 10–20 | Sandy Clay Loam | 282 | 20.9 | 5.3 | 12.4 | 0.17 | |||
| 20–30 | Sandy Clay Loam | 334 | 20.3 | 5.4 | 13.1 | 0.08 | |||
| 2 | TUT 7 P1 | Red Dermosol | 0–10 | Sandy Clay Loam | 201 | 24.9 | 5.0 | 8.3 | 0.07 |
| 10–20 | Sandy Loam | 184 | 15.0 | 4.8 | 7.3 | 0.03 | |||
| 20–30 | Sandy Loam | 156 | 5.3 | 5.5 | 4.7 | 0.02 | |||
| 3 | 542 P2 | Red Dermosol | 0–10 | Clay Loam | 386 | 24.4 | 5.4 | 30.9 | 0.05 |
| 10–20 | Clay Loam | 391 | 12.3 | 5.9 | 37.2 | 0.03 | |||
| 20–30 | Clay | 450 | 10.6 | 6.2 | 39.1 | 0.03 | |||
| 4 | 402 P1 | Yellow Sodosol | 0–10 | Sandy Loam | 135 | 11.7 | 5.0 | 2.4 | 0.05 |
| 10–20 | Loamy Sand | 108 | 3.1 | 4.5 | 0.8 | 0.06 | |||
| 20–30 | Sandy Clay | 348 | 3.2 | 6.1 | 5.7 | 0.12 | |||
| 5 | KON 5 | Calcarosol | 0–10 | Sandy Clay | 346 | 12.7 | 6.9 | 36.3 | 0.10 |
| 10–20 | Sandy Clay Loam | 303 | 9.3 | 7.7 | 40.5 | 0.18 | |||
| 20–30 | Sandy Clay Loam | 301 | 10.0 | 7.7 | 42.9 | 0.22 | |||
| 6 | 505 | Brown Sodosol | 0–10 | Sandy Clay Loam | 278 | 8.8 | 5.0 | 7.4 | 0.11 |
| 10–20 | Sandy Clay | 425 | 2.6 | 6.5 | 15.1 | 0.11 | |||
| 20–30 | Sandy Clay | 369 | 2.0 | 7.5 | 16.5 | 0.12 | |||
| 7 | MER 2 | Red sodosol | 0–10 | Sandy Clay Loam | 285 | 5.5 | 4.8 | 3.4 | 0.06 |
| 10–20 | Sandy Clay Loam | 333 | 3.3 | 5.9 | 6.5 | 0.03 | |||
| 20–30 | Sandy Clay Loam | 299 | 1.6 | 6.6 | 9.7 | 0.04 | |||
| 8 | 444 | Grey Arenosol | 0–10 | Sand | 90 | 15.4 | 5.8 | 4.0 | 0.04 |
| 10–20 | Sand | 95 | 8.5 | 5.4 | 2.7 | 0.05 | |||
| 20–30 | Sand | 19 | 4.2 | 5.4 | 1.2 | 0.03 | |||
| 9 | 622 P2 | Brown Dermosol | 0–10 | Sandy Clay Loam | 284 | 12.4 | 5.6 | 10.5 | 0.07 |
| 10–20 | Sandy Clay Loam | 304 | 6.1 | 5.5 | 11.5 | 0.03 | |||
| 20–30 | Sandy Clay | 355 | 5.4 | 5.5 | 14.3 | 0.04 | |||
| 10 | GTN 9 | Brown Sodosol | 0–10 | Sandy Loam | 139 | 9.7 | 5.6 | 6.5 | 0.17 |
| 10–20 | Sandy Clay Loam | 238 | 7.9 | 5.0 | 5.5 | 0.14 | |||
| 20–30 | Sandy Clay Loam | 224 | 4.8 | 5.1 | 5.4 | 0.09 | |||
| 11 | GTN 4 | Red Kandosol | 0–10 | Sandy Loam | 159 | 6.9 | 5.6 | 4.0 | 0.14 |
| 10–20 | Sandy Loam | 193 | 3.8 | 4.4 | 2.3 | 0.04 | |||
| 20–30 | Sandy Clay Loam | 248 | 2.2 | 4.9 | 3.5 | 0.04 | |||
| 12 | GTN 6 | Red Kandosol | 0–10 | Sandy Clay Loam | 338 | 11.3 | 4.9 | 6.2 | 0.23 |
| 10–20 | Sandy Clay Loam | 348 | 8.4 | 4.2 | 3.6 | 0.08 | |||
| 20–30 | Sandy Clay | 389 | 4.2 | 4.1 | 2.2 | 0.05 | |||
| 13 | 303 | Brown Kandosol | 0–10 | Sandy Loam | 189 | 6.5 | 6.0 | 5.9 | 0.07 |
| 10–20 | Sandy Loam | 192 | 6.0 | 5.3 | 2.3 | 0.06 | |||
| 20–30 | Sandy Clay Loam | 195 | 2.6 | 4.2 | 1.0 | 0.05 | |||
| 14 | BEA 2 | Red Kandosol | 0–10 | Sandy Clay Loam | 311 | 8.0 | 5.9 | 10.9 | 0.07 |
| 10–20 | Sandy Clay Loam | 297 | 5.0 | 6.3 | 12.8 | 0.05 | |||
| 20–30 | Sandy Clay Loam | 308 | 4.6 | 7.3 | 20.6 | 0.25 | |||
| 15 | 402 P2 | Grey Sodosol | 0–10 | Loamy Sand | 127 | 9.8 | 4.7 | 3.7 | 0.08 |
| 10–20 | Sandy Clay | 356 | 4.2 | 6.4 | 10.6 | 0.14 | |||
| 20–30 | Sandy Clay | 433 | 2.4 | 7.9 | 22.9 | 0.39 | |||
| 16 | – | Yellow Kandosol | 0–10 | Sandy Loam | 157 | 5.3 | 6.0 | 3.3 | 0.05 |
| 10–20 | Sandy Loam | 191 | 2.6 | 4.5 | 1.3 | 0.02 | |||
| 20–30 | Sandy Clay Loam | 235 | 1.4 | 4.8 | 1.3 | 0.02 | |||
| 17 | – | Red Kandosol | 0–10 | Sandy Loam | 161 | 4.2 | 4.2 | 2.0 | 0.06 |
| 10–20 | Sandy Clay Loam | 209 | 4.0 | 4.7 | 3.8 | 0.06 | |||
| 20–30 | Sandy Clay Loam | 231 | 2.4 | 5.4 | 4.2 | 0.06 | |||
| 18 | – | Red Kandosol | 0–10 | Loamy Sand | 100 | 12.7 | 5.1 | 5.6 | 0.04 |
| 10–20 | Loamy Sand | 98 | 4.8 | 4.5 | 3.1 | 0.02 | |||
| 20–30 | Sandy Loam | 129 | 2.4 | 5.4 | 3.4 | 0.02 | |||
| 19 | – | Red Arenosol | 0–10 | Sand | 69 | 7.9 | 6.5 | 4.9 | 0.04 |
| 10–20 | Loamy Sand | 70 | 3.5 | 5.7 | 2.5 | 0.03 | |||
| 20–30 | Loamy Sand | 99 | 2.5 | 5.1 | 2.2 | 0.03 | |||
| 20 | – | Red Kandosol | 0–10 | Sand | 60 | 9.5 | 6.1 | 5.4 | 0.08 |
| 10–20 | 10–20 | 89 | 4.0 | 4.9 | 2.9 | 0.03 | |||
| 20–30 | 20–30 | 131 | 4.1 | 4.7 | 3.3 | 0.03 | |||
| 21 | – | Red Kandosol | 0–10 | Loamy Sand | 101 | 17.4 | 5.6 | 4.7 | 0.04 |
| 10–20 | Loamy Sand | 118 | 10.6 | 4.9 | 2.5 | 0.03 | |||
| 20–30 | Sandy Loam | 128 | 5.0 | 5.5 | 2.8 | 0.03 |
Ref soil, reference soils south-western Australia (McArthur 2004); WASG, Western Australia Soil Groups (Schoknecht and Pathan 2013).
Soil K analysis
Methods used to measure the various soil K pools are presented in Table 2. Specifically, (1) water-soluble K was extracted by deionised water with soil:solution of 1:5 for 1 h (Pal et al. 2002); (2) CaCl2 K was extracted using 0.01 M CaCl2 with soil:solution of 1:10 for 2 h (Salomon 1998); (3) silver thiourea K was extracted using 0.01 M silver thiourea (AgTU+) with soil:solution of 1:50 for 16 h (Searle 1986; Rayment and Higginson 1992); (4) Colwell K was extracted using 0.5 M NaHCO3 (pH 8.5) with soil:solution of 1:100 for 16 h (Colwell and Esdaile 1968); (5) ammonium acetate (NH4OAc) K was extracted using 1 M NH4OAc buffered at pH 7 with soil:solution of 1:10 for 30 min (Rayment and Higginson 1992); (6 and 7) NaTPB extractable K (TBK) was determined following the procedure of Rayment and Lyons (2011) using extraction times of 1 or 4 h; (8) Nitric K was determined by boiling soil with 1 M HNO3 (Wood and DeTurk 1941); and (9) aqua regia K was determined by digesting soil in aqua regia solution (3.75 mL of HCl and 1.25 mL of HNO3) (Nieuwenhuize et al. 1991). Potassium buffering capacity (KBC) was measured according to Das et al. (2019). The K in the eluents from the above tests was analysed by inductively coupled plasma optical emission spectroscopy (Agilent Technologies; Santa Clara, CA, USA).
| Soil K pool | Extraction | Measured K |
|---|---|---|
| Soil solution K | (1) Water extractable K | Water-extractable K |
| (2) 0.01 M CaCl2 extractable K | CaCl2-extractable K | |
| Soil exchangeable K | (3) 0.01 M AgTU+ | AgTU+ K – CaCl2 K |
| (4) 0.5 M NaHCO3 (pH 8.5) | Colwell K – CaCl2 K | |
| (5) 1 M NH4OAc (pH 7) | NH4OAc K – CaCl2 K | |
| Soil non-exchangeable K | (6 and 7) Sodium tetraphenylborate 1- and 4-h | TBK1h K – exchangeable K; TBK4h K – exchangeable K |
| (8) 1 M HNO3 | Nitric K – exchangeable K | |
| (9) Aqua regia K | Aqua regia K – exchangeable K |
To investigate the effect of clay mineral composition on K availability, the mineralogy of each soil sample from 0–10 to 20–30 cm depth was determined using powder X-ray diffraction (XRD) (Empyrean; Malvern Panalytical Ltd, Netherlands) and Fourier-transform infra-red spectroscopy (FTIR) (HyLogger 2) at ALS Metallurgy Services (commercial laboratory services). For random powder XRD analysis, a small representative portion of every sample was collected using a micro-riffler and subsequently pulverised to approximately 45 μm. Each pulverised sample was pressed into a back-packed sample holder to minimise preferred orientation of the particles. The powder XRD was used to analyse each sample and a combination of matrix flushing and reference intensity ratio derived constants was used in the quantification of the minerals identified in each sample. Samples were scanned in continuous mode from 5 to 77° 2θ angle with 0.013° step size and a 120 s counting time per step using a PIXcel detector in linear mode with Co-Kα radiation operated at 40 kV and 30 mA. In all cases, the divergence slit and anti-scatter slit on the incident beam side were fixed (1°) and a 15-mm mask and a beam knife were used. On the diffracted beam side, a Fe-beta filter and 7.5 mm anti-scatter slit were used. Soller slits with 0.02 radian opening were used in both incident and diffracted beam. For FTIR analysis, the dried, but unpulverised, portion of the sample was packed into a black chip-tray and measured in the HyLogger-2 (a hyperspectral profiler system), which used both shortwave infra-red and infrared detectors and the spectral features covered 380–2500 nm. Three individual analysis spots were chosen and measured in each compartment, about 5 mm apart, and the scans were additively combined to minimise noise and maximise the signal. The spectral data were QA/QC checked for suitability for the upload to the cloud-based AI interpretation software (aiSIRIS) and results from the interpretation were vetted before being reported.
Pot experiment
From the 0–10 and 20–30 cm depths of each soil type, 2 kg of soil was weighed into plastic pots (height 17 cm, diameter 14 cm) with three replicates. Basal nutrients minus K were applied at the following rates (mg/kg): 237 Ca(NO3)2·4H2O, 150 NH4H2PO4, 80 MgSO4·7H2O, 18 FeSO4·7H2O, 14 MnSO4·H2O, 8.3 CuSO4·5H2O, 9 ZnSO4·7H2O, 0.37 H3BO3, 0.3 CoSO4·7H2O and 0.37 NaMoO4·2H2O (Ma and Bell 2016). Twelve pre-germinated seeds of wheat (Triticum aestivum) were sown into each pot and thinned to six plants after 5 days. From the third week, 80 mg of NH4NO3 per kg soil was added to all pots every 2 weeks. All pots were watered to 100% field capacity by weighing every day, and the lowest water content between watering events was 75–80% field capacity. The experiment was conducted in a naturally-lit glasshouse with minimum and maximum temperatures of 18 and 25°C, respectively. A completely randomised design was employed and pot positions were changed randomly twice a week to minimise any effects due to spatial variations in growing conditions within the glasshouse. Plants were harvested at anthesis, 56 days after sowing. Plant shoots were cut at the soil surface and rinsed in distilled water, then oven-dried at 70°C for 72 h for dry weight. About 1 g of ground material of shoots was digested in 0.5 M HNO3 in a Milestone Mars-5 microwave (CEM Corp., Matthews, NC, USA) after the method of Huang et al. (2004). Plant samples were digested by hydrogen peroxide and HNO3 mixture and then the concentrations of K, Na and other nutrients were determined by inductively coupled plasma atomic emission spectroscopy (ICP-AES) (Vista Simultaneous ICP-AES; Varian, Palo Alto, CA, USA). Soil samples from each pot were collected after harvesting plants and Colwell K was measured as mentioned above.
Statistical analyses
Statistical analysis was performed mainly using R, with SPSS ver. 24.0 software package (IBM Corp 2016) used for the Pearson correlation calculations and their significance. The weighted Deming regression was performed in R using the package SimplyAgree and using the weights described by Linnet (1990). Points were removed as needed according to the optimised residuals and the Shapiro–Wilk and Breusch–Pagan tests. The log fit was determined to be the best relationship for the different K test methods and the plant properties, based on comparison with the linear and quadratic models given the overall fit for all values and assumptions of the model (diminishing returns as the K level increases in the soil). The final linear regression was performed between NH4OAC K and the total K uptake to determine if the linear approximation would be a better model for the linear component of the log model. This required the removal of four points that were deemed to be high leverage points using Cook’s distance (Di > 1). The stepwise regression was performed using the package leaps with forward selection, using the model selection criteria of the Bayesian Information Criterion (BIC). The linear model assumptions were checked for each model and the model comparisons were performed using ΔBIC = BICi – BICj, with ΔBIC < 2 indicating weak evidence for selecting the lower BIC model and ΔBIC > 10 indicating strong support (Burnham and Anderson 2004).
Results
Soil properties
The 63 soil samples from 21 sites represented a wide range of soil types with different properties (Table 1). Of all soils, 43% were Kandosols (nine sites), 24% were Sodosols (five sites), 19% were Dermosols (four sites), 10% were Arenosols (two sites) and 5% were Calcarosols (one site). Soil texture ranged from sand to clay, with 70% of soils being sandy loam and sandy clay loam because clay-rich soils were targeted in this study. The samples had clay contents of range 19–450 g/kg (median 160 g/kg) and silt content range 10–210 g/kg (median 69 g/kg). The OC range was 1.4–37.4 g/kg (median 6.0 g/kg), pH (CaCl2) was 4.1–7.9 (median 5.4), cation exchange capacity (CEC) was 0.8–42.9 cmolc/kg (median 5.4 cmolc/kg) and EC (1:5) was 0.02–0.39 dS/m (median 0.05 dS/m).
Clay minerals
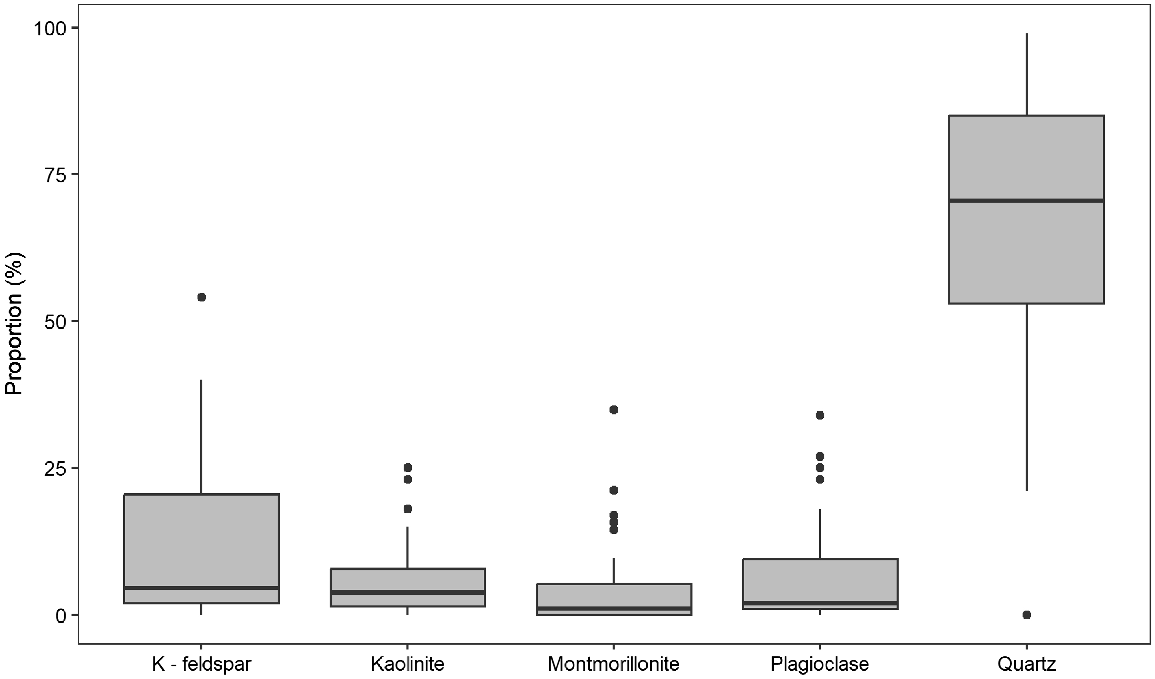
Random powder XRD and subsequent FTIR analysis revealed that quartz was the dominant mineral in all soils, comprising 21–99% (median 72%) (Supplementary Table S1, Fig. 1). The exception was the subsoil sample of soil 15, where no quartz was identified. Out of 42 samples, 35 samples contained K-feldspars (1–54%, median 7%), and plagioclase was identified in 32 samples (1–34%, median 4%). About 95% of samples contained kaolinite and the proportion range was 0.3–25% with median 4%. Montmorillonite was identified in 50% of samples and range was 0.5–35% (median 4.7%). Nontronite and white mica were identified in less than 10% samples and contributed only minor amounts (up to 2%).
Soil solution K
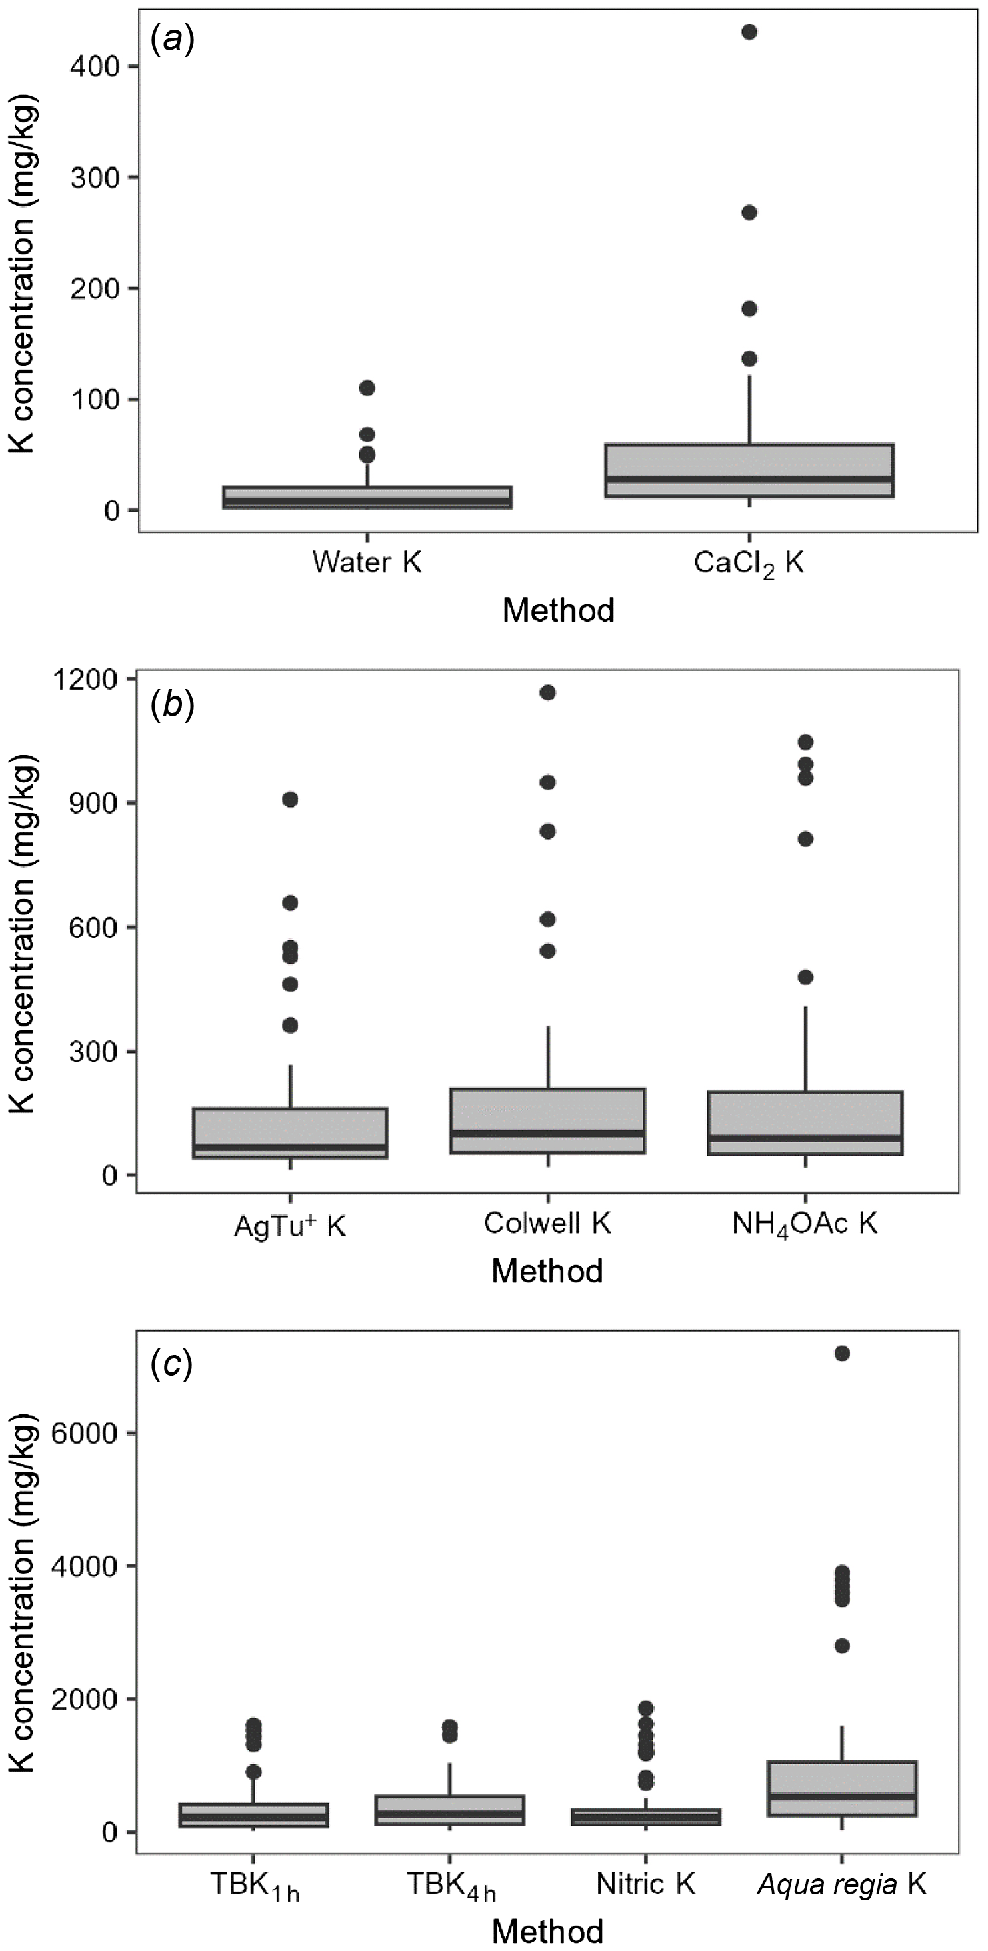
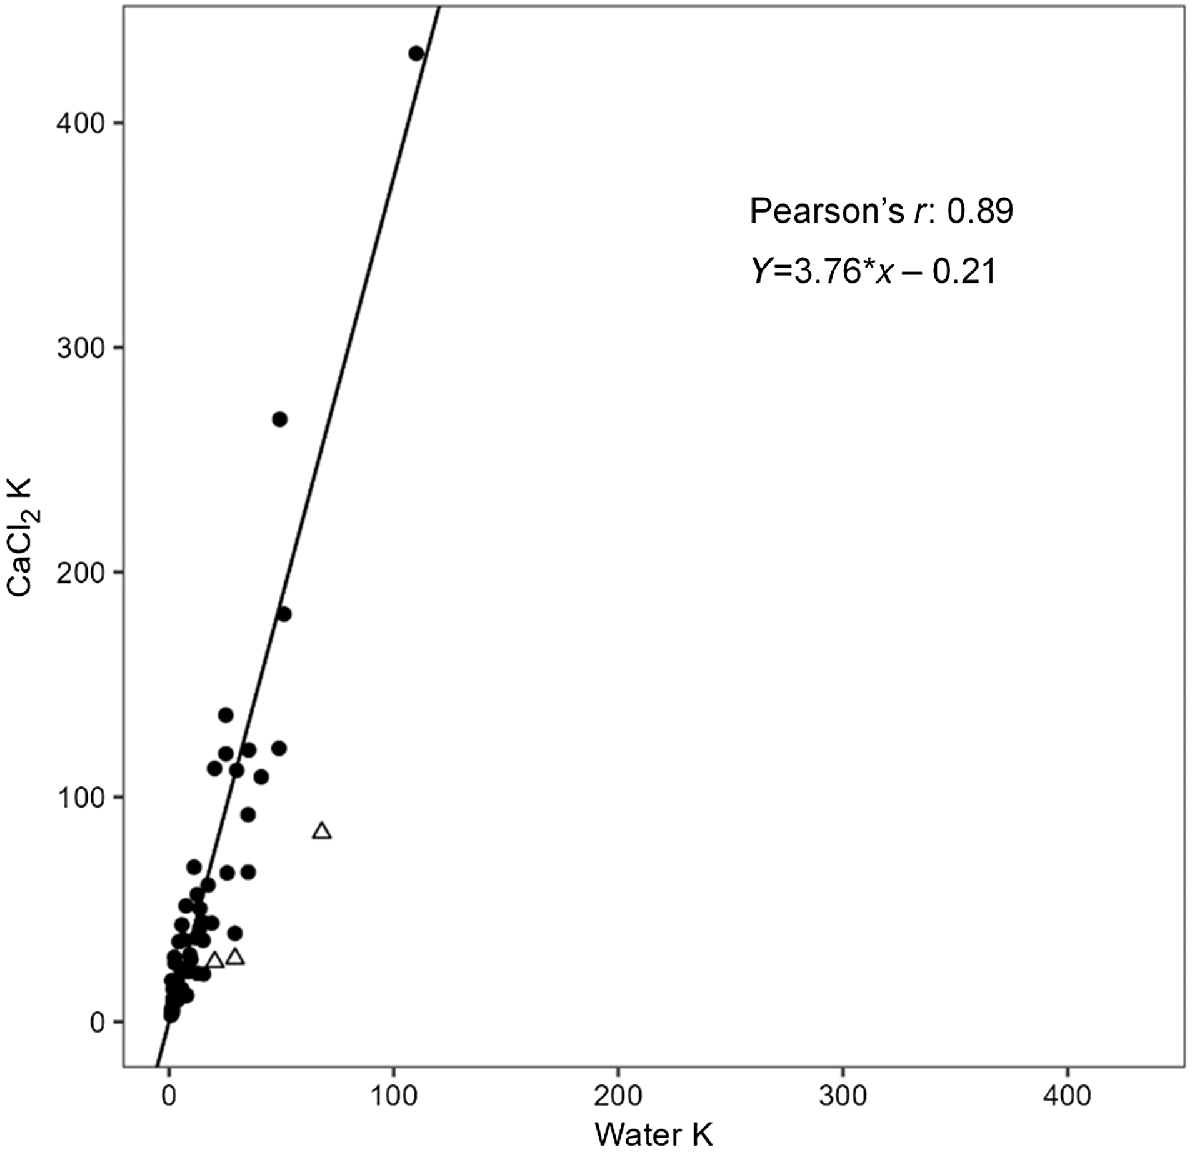
Water-soluble K ranged widely within 1–110 mg/kg and median of 8 mg/kg (Table S2, Fig. 2a). The CaCl2-extractable K range was 3–431 mg/kg, with median of 28 mg/kg. Although water-soluble K concentration was highly correlated with CaCl2-extractable K (r = 0.885, P < 0.01), CaCl2-extractable K was consistently more highly correlated with other soil K measurements (Table S3). The amount of CaCl2-extractable K was about 3–4 times higher than water-soluble K, and the weighted Deming regression also showed strong proportional bias, as CaCl2-extractable K = 3.758 water-soluble K – 0.215 (r = 0.89) (Fig. 3). Overall, soil solution K had a weak but significant relationship with soil EC (r = 0.268 and 0.322, P < 0.05), and consistently decreased with soil depth with the exception of two duplex soils (soils 4 and 15), where solution K increased with soil depth (Tables 3 and S2).
Amounts of K extracted by different extractants for soil samples: (a) soil solution K, including water-extractable K and CaCl2-extractable K, (b) soil exchangeable K, including AgTU+ K, Colwell K and NH4OAc K and (c) soil non-exchangeable K, including TBK1h, TBK4h, Nitric K and aqua regia K.
Weighted Deming regression of water-extractable K with CaCl2-extractable K. Soil samples in triangles were removed based on being extreme outliers from observing the optimised residuals.
| Water K | CaCl2 K | AgTU+ K | Colwell K | NH4OAc K | TBK1h | TBK4h | Nitric K | Aqua regia K | |
|---|---|---|---|---|---|---|---|---|---|
| OC | 0.136 | 0.125 | 0.133 | 0.09 | 0.052 | 0.066 | 0.072 | 0.069 | −0.076 |
| EC (1:5) | 0.322* | 0.268* | 0.393** | 0.440** | 0.519** | 0.535** | 0.537** | 0.638** | 0.657** |
| pH | 0.161 | 0.192 | 0.379** | 0.364** | 0.467** | 0.463** | 0.438** | 0.618** | 0.652** |
| ECEC | 0.015 | 0.166 | 0.407** | 0.344** | 0.410** | 0.459** | 0.456** | 0.605** | 0.575** |
| Clay content | 0.141 | 0.247 | 0.388** | 0.383** | 0.408** | 0.457** | 0.455** | 0.454** | 0.479** |
| Silt content | −0.095 | 0.050 | 0.138 | 0.086 | 0.081 | 0.172 | 0.199 | 0.193 | 0.104 |
| Sand content | −0.066 | −0.208 | −0.353** | −0.327** | −0.344** | −0.421** | −0.432** | −0.429** | −0.411** |
| KBC | −0.023 | 0.132 | 0.376* | 0.314* | 0.401** | 0.459** | 0.462** | 0.621** | 0.628** |
| Plagioclase | −0.203 | −0.106 | 0.017 | −0.065 | −0.111 | −0.057 | −0.023 | 0.002 | −0.066 |
| K-feldspar | −0.022 | 0.044 | 0.098 | 0.135 | 0.175 | 0.204 | 0.266 | 0.258 | 0.310* |
| Quartz | 0.194 | 0.027 | −0.169 | −0.144 | −0.187 | −0.265 | −0.330* | −0.372* | −0.412** |
| Kaolinite | −0.132 | −0.154 | −0.215 | −0.163 | −0.173 | −0.162 | −0.161 | −0.226 | −0.215 |
| Montmorillonite | −0.094 | 0.080 | 0.324* | 0.290 | 0.389* | 0.442** | 0.466** | 0.570** | 0.672** |
| Nontronite | −0.096 | 0.042 | 0.243 | 0.147 | 0.133 | 0.187 | 0.186 | 0.253 | 0.187 |
| White mica | 0.030 | 0.062 | 0.032 | 0.066 | 0.063 | 0.041 | 0.034 | 0.024 | −0.022 |
OC, organic carbon; EC, electrical conductivity; ECEC, effective cation exchangeable capacity; AgTU+, silver thiourea; TBK1h and TBK4h, K extracted by tetraphenyl borate for 1 and 4 h; KBC, K buffering capacity.
**Significant at P < 0.01 (two-tailed).
*Significant at P < 0.05 (two-tailed).
Soil exchangeable K
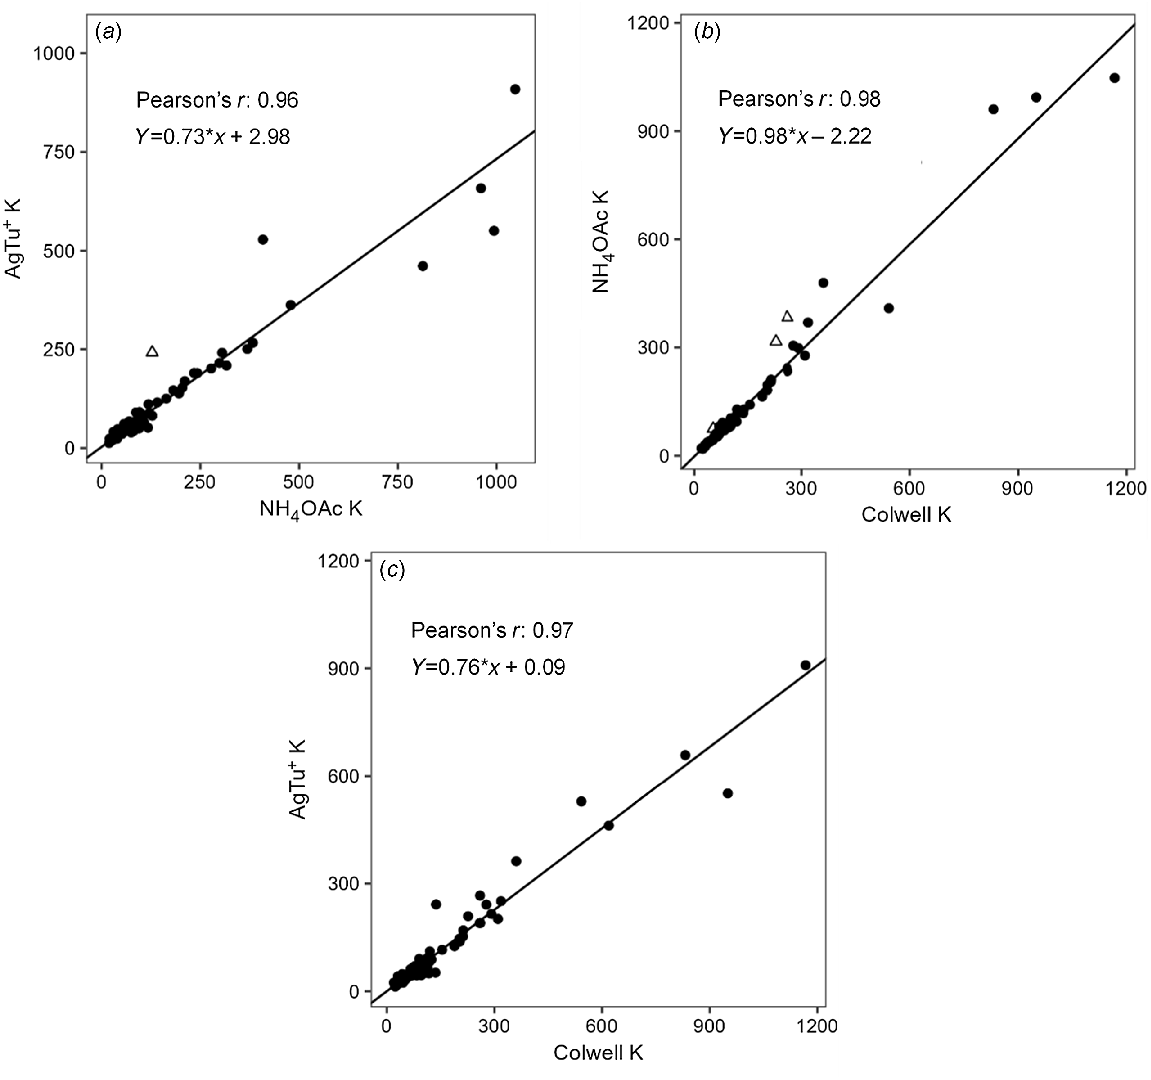
Soil exchangeable K for AgTU+ K, Colwell K and NH4OAc K had ranges of 13–909, 20–1167 and 19–1047 mg/kg, with median values of 67, 100 and 89 mg/kg, respectively (Fig. 2b). Overall, soil exchangeable K was significantly correlated with soil EC, pH, CEC and clay content (P < 0.01); weakly correlated with KBC and montmorillonite content (P < 0.05); and negatively correlated with sand content (P < 0.01) (Table 3). There were strong positive correlations (r > 0.96) among AgTU+ K, Colwell K and NH4OAc K (Table S3, Fig. 4). However, as the magnitude of soil exchangeable K increased, the disparity between the amount of K extracted by AgTU+ compared to Colwell K and NH4OAc K increased due to the proportional bias evident in their respective weighted Deming regressions, where AgTU+ K = 0.76Colwell K + 0.09 (r = 0.97), and AgTU+ K = 0.73NH4OAc K + 2.98 (r = 0.96) (Table 4, Fig. 4). In contrast, there was no proportional or systematic bias between NH4OAc K and Colwell K where NH4OAc K = 0.98Colwell K – 2.22 (r = 0.98), except several extreme outliers that showed 25–35% higher K extracted by NH4OAc than Colwell K in soils 5, 6 (only 20–30 cm) and 15.
Weighted Deming regressions for methods of extracting soil exchangeable K, (a) AgTU+ K and NH4OAc K, (b) Colwell K and NH4OAc K, (c) AgTU+ K and Colwell K. Soil samples in triangles were removed based on being extreme outliers from observing the optimised residuals.
| Method 1 | Method 2 | Coefficient | Value | Lower CI | Upper CI |
|---|---|---|---|---|---|
| Water K | CaCl2 K | Intercept | −0.215 | −1.426 | 0.997 |
| Slope | 3.758 | 3.137 | 4.378 | ||
| Colwell K | AgTU+ K | Intercept | 0.087 | −5.087 | 5.260 |
| Slope | 0.757 | 0.676 | 0.838 | ||
| NH4OAc K | AgTU+ K | Intercept | 2.980 | −1.011 | 6.972 |
| Slope | 0.730 | 0.665 | 0.794 | ||
| Colwell K | NH4OAc K | Intercept | −2.223 | −5.083 | 0.637 |
| Slope | 0.980 | 0.924 | 1.035 | ||
| TBK1h | TBK4h | Intercept | −1.500 | −4.057 | 1.056 |
| Slope | 1.236 | 1.175 | 1.297 | ||
| Nitric K | TBK4h | Intercept | −4.689 | −12.412 | 3.033 |
| Slope | 1.216 | 1.074 | 1.358 | ||
| TBK1h | Nitric K | Intercept | 2.253 | −2.703 | 7.208 |
| Slope | 1.001 | 0.905 | 1.098 |
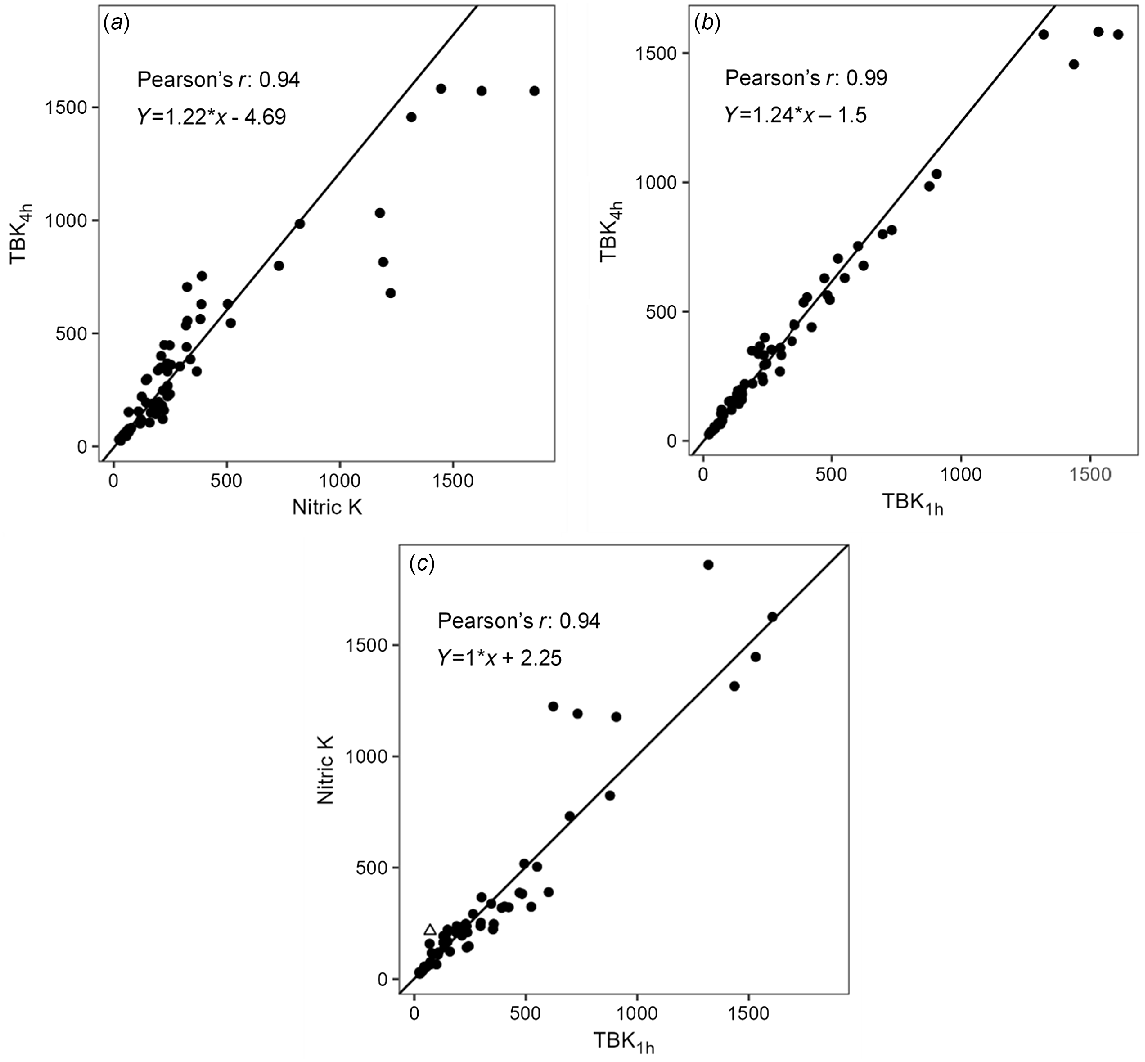
Soil non-exchangeable K
The ranges for amounts of TBK1h, TBK4h and Nitric K were 22–1606, 25–1582 and 23–1860 mg/kg, with median values of 219, 268 and 216 mg/kg, respectively (Fig. 2c). Aqua regia K had significant correlations with TBK1h, TBK4h and Nitric K, but aqua regia K values were 1–6 times higher than TBK1h, TBK4h and Nitric K values (Table S3, Fig. 2c). Similarly to soil exchangeable K, non-exchangeable K was significantly correlated with soil EC, pH, CEC, clay content, KBC and montmorillonite content (P < 0.01), weakly correlated with the amount of quartz (P < 0.05) and negatively correlated with sand content (P < 0.01) (Table 3). Similarly to exchangeable K, there were strong positive correlations (r > 0.94) among TBK1h, TBK4h and Nitric K (Table S3). The amount of TBK4h was on average ~20% higher than TBK1h and Nitric K, and showed proportional bias based on the weighted Deming regression where TBK4h = 1.24TBK1h – 1.5 (r = 0.99) and TBK4h = 1.22 Nitric K – 4.69 (r = 0.94) (Table 4, Fig. 5). There was no systematic difference or proportional bias between Nitric K and TBK1h where Nitric K = 1.0TBK1h + 2.25 (r = 0.94), except the extreme outliers (soils 5 and 20) in which Nitric K extracted 23–67% more K than TBK1h.
Relationship between plant and soil parameters
Although adequate levels of all basal nutrients minus K were added to all pots, and soil water supply was maintained at 75–100% of field capacity, wheat shoot dry weight showed large variations among soil types, with range 2.2–13.3 g per pot (Table S4). Shoot weight had significant positive correlations with EC, CEC, pH and OC, clay and silt contents, but negative correlation with sand content (Table 5). Regarding clay minerals, shoot weight was weakly positively correlated with contents of montmorillonite, nontronite and white mica (r = 0.24–0.29, P < 0.05), but negatively correlated with kaolinite content (r = −0.19, P < 0.05) (Table 5). Shoot weight was significantly related to all measured soil K pools (Table 6). The change in exchangeable K (initial level of Colwell K minus level of Colwell K after harvest) showed the best relationship (R2 = 0.74) with shoot weight, followed by CaCl2-extractable K, NH4OAc K, AgTU+ K and Colwell K (R2 = 0.60–0.65).
| Shoot dry weight | Shoot K concentration | Total K uptake | |
|---|---|---|---|
| OC | 0.337** | 0.255** | 0.345** |
| EC (1:5) | 0.495** | 0.621** | 0.692** |
| pH | 0.397** | 0.140 | 0.258** |
| ECEC | 0.475** | 0.369** | 0.458** |
| Clay content | 0.286** | 0.577** | 0.482** |
| Silt content | 0.285** | 0.328** | 0.337** |
| Sand content | −0.335** | −0.584** | −0.511** |
| KBC | 0.412** | 0.410** | 0.456** |
| Plagioclase | 0.022 | −0.176 | −0.104 |
| K-feldspar | 0.076 | 0.160 | 0.188* |
| Quartz | −0.133 | −0.209* | −0.230* |
| Kaolinite | −0.193* | 0.159 | 0.039 |
| Montmorillonite | 0.294** | 0.291** | 0.322** |
| Nontronite | 0.250** | 0.085 | 0.155 |
| White mica | 0.243* | 0.193* | 0.239* |
OC, organic carbon; EC, electrical conductivity; ECEC, effective cation exchangeable capacity; KBC, K buffering capacity.
**Significant at P < 0.01 (two-tailed).
*Significant at P < 0.05 (two-tailed).
| Variable | Shoot dry weight | Shoot K concentration | Total K uptake | |||
|---|---|---|---|---|---|---|
| Adjusted R2 | BIC | Adjusted R2 | BIC | Adjusted R2 | BIC | |
| Water K | 0.516 | 148.695 | 0.379 | 88.266 | 0.505 | 377.496 |
| CaCl2 K | 0.647 | 137.036 | 0.610 | 71.042 | 0.734 | 354.512 |
| AgTU+ K | 0.606 | 141.063 | 0.764 | 52.419 | 0.860 | 330.632 |
| Colwell K | 0.603 | 141.297 | 0.790 | 48.196 | 0.869 | 328.289 |
| NH4OAc K | 0.615 | 140.150 | 0.815 | 43.467 | 0.895 | 320.256 |
| TBK1h | 0.417 | 155.562 | 0.749 | 54.751 | 0.736 | 354.197 |
| TBK4h | 0.334 | 160.468 | 0.666 | 65.307 | 0.644 | 365.329 |
| Nitric K | 0.424 | 155.083 | 0.665 | 65.385 | 0.706 | 358.182 |
| Aqua regia K | 0.268 | 163.951 | 0.593 | 72.630 | 0.543 | 374.523 |
| Postharvest Colwell K | 0.425 | 155.029 | 0.802 | 46.027 | 0.794 | 345.050 |
| ΔExchangeable K | 0.744 | 125.128 | 0.574 | 74.368 | 0.709 | 357.799 |
Note: change of Bayesian Information Criterion (ΔBIC) < 2 indicates weak evidence for selecting the lower BIC model, while ΔBIC > 10 indicates strong support for selecting the lower BIC model.
AgTU+, silver thiourea; TBK1h and TBK4h, K extracted by tetraphenyl borate for 1 and 4 h; ΔExchangeable K, change in exchangeable K (initial level minus level after harvest).
Shoot K concentrations had range of 5–35 g/kg, while the total K uptake range was 10–168 mg/kg soil (Table S4). All plants were healthy and showed no nutrient deficiency symptoms during the experiment period, with the exception of wheat grown in soils with low initial NH4OAc K (<70 mg/kg), which showed symptoms of K deficiency and contained shoot K concentration below 10 g/kg. Shoot K concentration and total K uptake had stronger correlations with EC, CEC and clay and sand contents (r > 0.56), and weaker correlations with OC and silt contents (Table 5). In addition, both were weakly positively correlated with montmorillonite and white mica contents (r = 0.19–0.32, P < 0.05), but negatively correlated with quartz content (r ~−0.21, P < 0.05) (Table 5). As with shoot weight, there were significant correlations between all measured soil K pools and shoot K concentration and total K uptake, but a logarithmic equation fitted the data better than linear and quadratic models (Table 6). Among all methods, NH4OAc K was the best to predict shoot K concentration (R2 = 0.815) and total K uptake (R2 = 0.895) (Fig. 6), with Colwell K the next best predictor for both responses and showing similar model quality (5 < ΔBIC < 10). Stepwise multiple regression was conducted after log transformation, and the equations and R2 for the most predictive combinations of independent variables are shown in Table S5. The results showed that the addition of KBC improved the prediction of wheat biomass using log CaCl2 K (ΔBIC > 2), increasing R2 from 0.647 to 0.670. For the prediction of shoot K concentration, the added terms of pH, sand content and EC produced a better model, increasing adjusted R2 from 0.815 to 0.891, with the most important property added being soil pH. Finally, the prediction of total K uptake improved by including OC and EC, increasing adjusted R2 from 0.895 to 0.924.
Best relationship between measured K in initial soils and (a) wheat shoot biomass, (b) shoot K concentration and (c) total shoot K uptake.
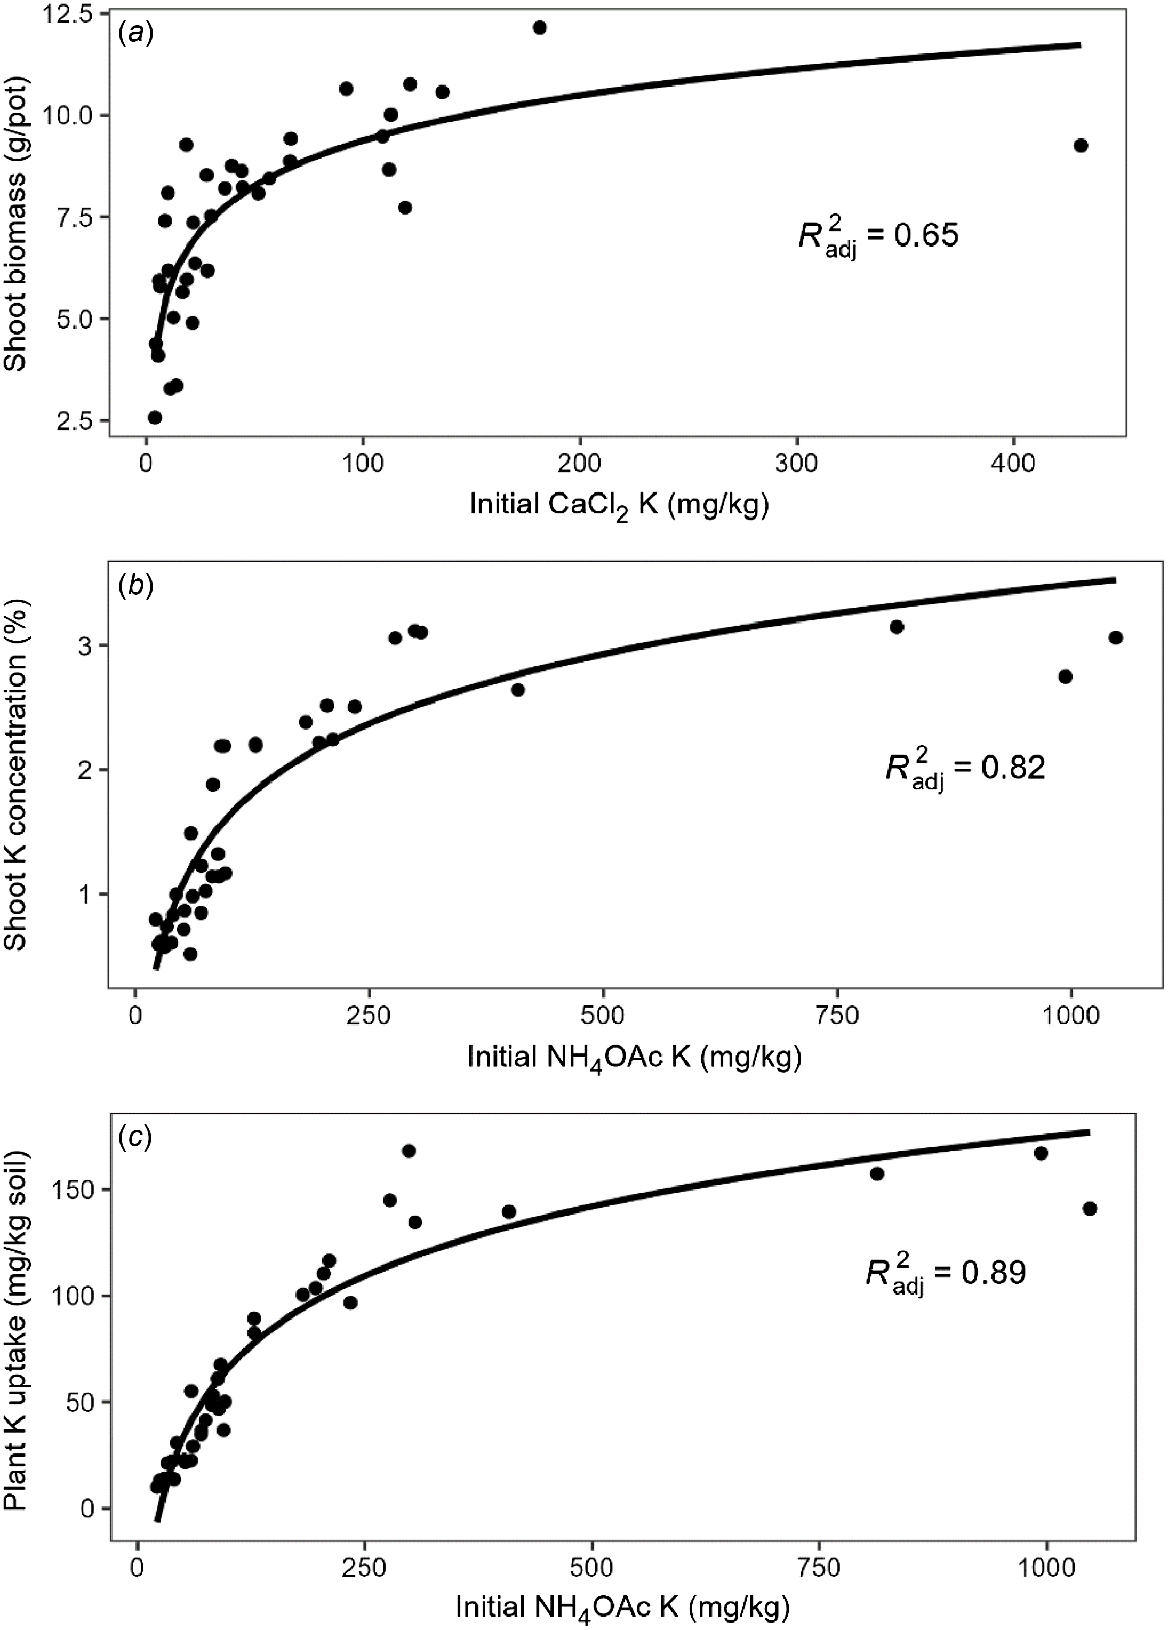
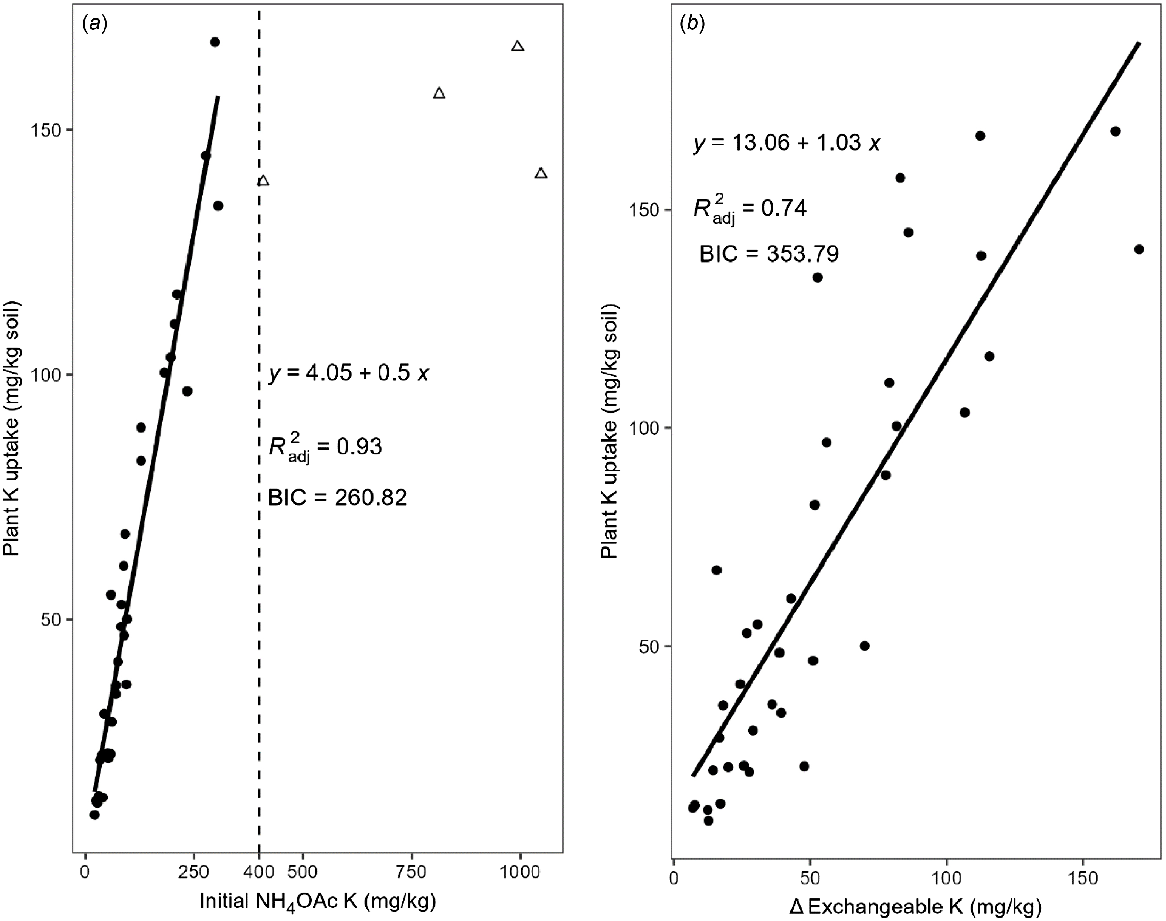
Notably, when NH4OAc K exceeded 400 mg/kg, both shoot K concentration and total K uptake plateaued and did not change much with further increases in soil NH4OAc K (Fig. 6). This then drove the selection of the linear model. After removing four points deemed to be high leverage points using Cook’s distance (Di > 1), it had a significant positive linear relationship with total K uptake (R2 = 0.93) and a much smaller BIC, indicating that the linear model was better for prediction for NH4OAc K below approximately 400 mg/kg (Fig. 7a). The slope of the regression line between NH4OAc K and total K uptake was only 0.50, indicating that on average only 50% of NH4OAc K was taken up from soil by wheat shoots. The amount of shoot K uptake was close to the change in exchangeable K (initial level of Colwell K minus level of Colwell K after harvest) in all soils (Fig. 7b). Since the linear relationship between soil K and plant parameters only appeared when the four high leverage points (>400 mg/kg exchangeable K) were removed, stepwise multiple regression was conducted for soils with <400 mg/kg exchangeable K where no log transformation was needed (Table 7). Similar results showed that the combination of CaCl2 K and pH predicted 63% of the variation in shoot biomass. However, NH4OAc K was the best indicator of shoot K concentration and the addition of clay content only increased R2 from 0.84 to 0.90. Furthermore, NH4OAc K explained about 93% of the variation of total K uptake, while addition of EC and KBC increased the R2 to 0.95.
Linear relationship of total shoot K uptake with NH4OAc K in (a) initial soils and (b) with the change in exchangeable K. Triangles in (a) show the points deemed to be high leverage points that were removed to fit a linear model for soils with <400 mg/kg initial NH4OAc K.
| Soils | Model formula | Adjusted R2 | BIC |
|---|---|---|---|
| Biomass | Y = 0.040CaCl2 K + 5.54 | 0.510 | 133.736 |
| Y = 0.043CaCl2 K + 1.161pH – 0.860 | 0.633 | 126.301 | |
| Shoot K concentration | Y = 0.00765NH4OAc K + 0.658 | 0.840 | 29.326 |
| Y = 0.0085NH4OAc K + 0.0195%clay + 0.191 | 0.901 | 15.973 | |
| Total K uptake | Y = 0.501NH4OAc K + 4.05 | 0.933 | 260.821 |
| Y = 0.450NH4OAC K + 111EC + 1.56 | 0.944 | 257.644 | |
| Y = 0.441NH4OAC K + 115EC + 0.184KBC – 3.25 | 0.953 | 253.807 |
Note: since the linear relationship between soil K and plant parameters only appeared when the four identified high leverage points (>400 mg/kg exchangeable K) were removed, stepwise multiple regression was conducted for soils with <400 mg/kg exchangeable K. Change of Bayesian Information Criterion (ΔBIC) < 2 indicates weak evidence for selecting the lower BIC model while ΔBIC > 10 indicates strong support for selecting the lower BIC model.
Discussion
In farming systems where negative K balances are common, soil testing is important to identify the rate of rundown in plant-available K levels across a range of soils. In contrast with substantial research on slowly or potentially available K in clay soils with high non-exchangeable K to predict K deficiency in crops (Carey et al. 2011), the loam- and clay-textured soils in highly weathered landscapes such as WA have not been properly examined for either the rate of K rundown or appropriate soil K tests. In the following discussion, we first examined the efficacy of soil tests for assessing different soil K pools and then examined the performance of soil tests for predicting plant K uptake.
Soil tests for assessing different soil K pools
Overall, the concentrations of soil solution K and exchangeable K were reasonably high, especially in surface soil (11–431 and 38–1047 mg/kg, respectively). This may be attributed to the fertiliser application or cycling of K to the surface via plant residues since the soils have been used for crop and pasture production for several decades. Normally, soil solution K concentration ranges within 1–10 mg/kg soil (Power and Prasad 1997). However, in this study 80% of surface soil and 30% of subsoil had solution K concentration above 10 mg/kg. The median and maximum values of Colwell K were 5- and 2-fold higher than for the soils collected in south-western Australia under native vegetation by Pal et al. (1999). For the sub-surface soil, the median values of Colwell K were 2–3 times higher than those in native vegetation soils, although the maximum values were similar. If we consider 45 mg/kg Colwell K as the critical value for wheat growth as suggested by Brennan and Bell (2013), only 2 of 21 surface soils were K deficient.
As expected, very low or undetectable levels of non-exchangeable K occurred in the light-textured soils. Interestingly, the median values of non-exchangeable K were 2–3 times those in native vegetation soils, while the maximum value was only 20–30% of those in native vegetation soils (Pal et al. 1999). The high non-exchangeable K in the loam- and clay-textured soils could be attributed to the high amount of feldspars, since little mica and/or illite was identified. The mineralogy analysis showed that quartz was the dominant mineral in all the collected soils, followed by K-feldspars, plagioclase and kaolinite, with small amounts of montmorillonite, nontronite and white mica. This is not unexpected as soils in south-west WA are highly weathered. Similar results were reported by Pal et al. (2002) who found that sand and silt fractions were dominated by quartz but contained significant amounts of K-feldspars, while kaolinite was the dominant mineral in the clay fraction. Although illte/mica were detected previously in some WA soils, the peak of illite/mica was small and no percentage data were provided (Pal et al. 2001a, 2001b, 2002). The mineralogical analysis of the clay fraction from Reference soils of south-western WA showed 6–20% of illite in the subsurface (15–30 or 45 cm) of soils TUT 7, GTN 6, GTN 9, BEA 2 and MER 2 (McArthur 2004). However, in this study the absence of illite/mica in the soils paired with those Reference soils (soils 1, 2, 7, 10, 12 and 14) might be for several reasons. Firstly, in this study those soils were not collected from the Reference soil sites under native vegetation, but from nearby farms adjacent to the sites, which had been used for grain or pasture production. The variation in illite content between this study and the Reference soil could potentially be attributed to the subtle differences between the soils under native vegetation and agricultural cultivation. Secondly, in this study, whole soil samples were used for mineralogy determination, rather than the clay fraction only, thus the small proportions (1–5%) of illite/mica in the whole sample might not be detectable. The reason for using bulk soil rather than the clay fraction in this study was that the soil non-exchangeable K could be present in various K-bearing minerals that exist in the whole range of particle sizes. Previous studies showed that feldspar was a significant source of K in some WA soils and extractable K was positively correlated with soil silt content, not clay content (Pal et al. 2001a, 2002). Therefore, the contribution of different minerals to soil K pools and plant uptake was evaluated by the bulk soil samples in this study.
With regard to the soil test methods for soil exchangeable K, the high correlations among AgTU+ K, Colwell K and NH4OAc K confirmed that these three methods extracted K from similar K pools. However, the amount of K extracted by AgTU+ was consistently ~25% lower than that extracted by NH4OAc and Colwell in all soils. Unbuffered AgTU+ was commonly used for rapid determination of effective CEC and exchangeable cations in soils dominated by low-activity clays with variable surface charges (Pleysier and Juo 1980). However, Searle (1986) found that the performances of AgTU+ and NH4OAc were not consistent even for soils with similar mineralogy, resulting in poor correlation between AgTU+ K and NH4OAc K. This discrepancy could be attributed to the absence of pH buffering in AgTU+, which extracts cations under variable soil solution pH conditions across different soils. In contrast, the pH of NH4OAc and Colwell solutions were buffered at 7 and 8.5, respectively, potentially enhancing the extractability of cations. Notably, there was no significant difference between NH4OAc K and Colwell K for most soils, consistent with the report by Zhang et al. (2017).
In this study, the amounts of K released after 1 or 4 h of incubation time for the NaTPB method were compared. Previously, the 4-h incubation time was recommended by Rayment and Lyons (2011) and Carey et al. (2011) for the routine use of the NaTPB method since it provided a better fit with operational requirements of commercial laboratories and gave slightly better repeatability and precision and correlation with the NaTPB salt precipitant method developed by Jackson (1985) than the 1-h extraction time. Our results showed that the amount of TBK4h was ~24% higher than that of TBK1h in all soils. It has been reported that the short reaction time is correlated with release of K from vermiculite interlayers while the longer reaction time extracted more K from primary minerals (Cox et al. 1996; Bell et al. 2021a). Thus, the amount of K extracted by NaTPB would be expected to increase with incubation time when reserves of K are mostly in fixed and/or structural forms (Moody and Bell 2006).
The strong correlation between Nitric K and TBK1h or TBK4h indicated that K was extracted from similar K pools. The amount of Nitric K was similar to that of TBK1h, similar to findings for all the selected agricultural soils from south-east Queensland, Australia (Moody and Bell 2006). Compared to HNO3 and NaTPB methods, aqua regia had much stronger extractability, evidenced by the 1–6 times higher concentrations of extractable K than TBK and Nitric K. Andrist-Rangel et al. (2010) found that aqua-regia-extractable K could be best explained by the sum of phyllosilicate K, but not K in feldspars. In this study, aqua regia K was significantly correlated with soil properties, including pH, EC, CEC and clay content. However, previous studies showed an inconsistent effect of soil texture on the extractability, since the extractability of K by aqua regia was highest for clays and lowest for sands (Andrist-Rangel et al. 2006), but no clear relationships were found in the study by Andrist-Rangel et al. (2010).
Performance of soil test to predict plant K uptake
Overall, there were significant relationships between all measured soil K parameters and shoot biomass, K concentration or total K uptake. Since plant growth may be strongly influenced by soil physical and chemical properties in addition to K level, shoot K concentration and total K uptake by plants will be discussed as a more reliable index of the efficacy of soil K tests than shoot biomass.
The correlations between K extracted by different methods and wheat K concentration and the step-wise multiple regression suggested that exchangeable K, particularly NH4OAc K, was a satisfactory diagnostic indicator of K status for the soils in this study. The present study did not support our hypothesis that loam- and clay-textured soils would require different K test methods for K management on different soils, although the total K uptake was weakly correlated with the contents of clay, montmorillonite and white mica. This could be attributed to the relatively high initial exchangeable K in most soils but limited plant uptake in this short-term study since plants were harvested after only 56 days of growth – more time may be needed for wheat root systems to access non-exchangeable K pools. This was supported by the slope of the linear regression between NH4OAc K and total K uptake, indicating only 50% of soil NH4Oac K was taken up by wheat shoots within 56 days (Fig. 7a). For longer-season crops and multiple crop seasons, the release or replenishment of slowly available K from interlayer and structural pools is likely to be more important for plant uptake because of the higher and more prolonged K demand. Previous glasshouse K exhaustion experiments showed that plant-available K was well related to NH4OAc K in soils with low non-exchangeable K contribution, and well related to TBK in a wide range of Canadian soils with high amount of non-exchangeable K (Cox et al. 1999). However, under exhaustive cut-and-removal pot trials, the slope of the regression line between soil readily available K (water-soluble K + exchangeable K) and cumulative K uptake by ryegrass increased progressively from less than 0.5 (Pal et al. 2001a) or 0.59 (Darunsontaya et al. 2012) after the first harvest to about 1 after the sixth harvest, indicating that soil water-soluble K and exchangeable K were almost the only forms of K taken by grass in the highly weathered soils from both WA and Thailand (Pal et al. 2001a; Darunsontaya et al. 2012). The reliance of plant K uptake on exchangeable K when there is a low contribution of non-exchangeable K suggests that soils formed from weathered parent materials will be vulnerable to K rundown due to negative K balances (Ma et al. 2022). Further experiments should compare the performance of NH4OAc and TBK on the prediction of plant-available K and assess the contribution of non-exchangeable K to plant K uptake after multiple crop seasons, or exhaustive pot experiments, using soils with variable K reserves and mineralogy.
Conclusions
Nine soil K testing methods for plant-available K were assessed for three depths of 21 agricultural soils representing mostly loam and clay textures from highly weathered parent materials with a range of properties. Among the soil exchangeable K tests, AgTU+ extracted about 70% as much as Colwell K and NH4OAc K, which had similar capacities for K extraction in most soils. Among the tests for non-exchangeable K, there was no significant difference between Nitric K and TBK1h, while TBK4h was ~20% higher than Nitric K and TBK1h. The results showed NH4OAc K was the best indicator of K availability for wheat K uptake. Since there were no systematic or proportional differences between Colwell K and NH4OAc K, and Colwell K had similar model performance for total K uptake (ΔBIC = 8), we conclude that Colwell K is adequate to predict soil K status for a single growing season in a wide range of soils as well. This study validated the use of Colwell K as the standard K test for a wide range of soils, including heavy-textured soils. Among a diverse range of soils from a region with weathered parent materials, the reliance on exchangeable K for plant K uptake suggests that soils will be vulnerable to K rundown under negative K balances. While the availabilities of non-exchangeable K for plant uptake varied among soils, their contribution to short-term plant K uptake could not be adequately quantified due to the limited K removal by plants in this study.
Declaration of funding
This research was supported by the Australian Centre for International Agricultural Research project ‘Nutrient management for diversified cropping in Bangladesh (LWR/2016/136)’ and the Grains Research and Development Corporation project ‘Increasing profit from N, P and K fertiliser inputs into the evolving cropping sequences in the Western Region (UWA1801–002RTX, UMU1801–006RTX)’.
Acknowledgements
We thank Angela Stuart-Street for pairing field sites from nearby farms adjacent to the Reference soil sites, and Noel Schoknecht for the soil classification of all sites.
References
Andrist-Rangel Y, Simonsson M, Andersson S, Öborn I, Hillier S (2006) Mineralogical budgeting of potassium in soil: a basis for understanding standard measures of reserve potassium. Journal of Plant Nutrition and Soil Science 169(5), 605-615.
| Crossref | Google Scholar |
Andrist-Rangel Y, Hillier S, Öborn I, Lilly A, Towers W, Edwards AC, Paterson E (2010) Assessing potassium reserves in northern temperate grassland soils: a perspective based on quantitative mineralogical analysis and aqua-regia extractable potassium. Geoderma 158(3-4), 303-314.
| Crossref | Google Scholar |
Bell MJ, Ransom MD, Thompson ML, Hinsinger P, Florence AM, Moody PW, Guppy CN (2021b) Considering soil potassium pools with dissimilar plant availability. In ‘Improving potassium recommendations for agricultural crops’. (Eds TS Murrell, RL Mikkelsen, G Sulewski, R Norton, ML Thompson) pp. 163–190. (Springer Nature: Switzerland)
Brennan RF, Bell MJ (2013) Soil potassium-crop response calibration relationships and criteria for field crops grown in Australia. Crop & Pasture Science 64(5), 514-522.
| Crossref | Google Scholar |
Burnham KP, Anderson DR (2004) Multimodel inference: understanding AIC and BIC in model selection. Sociological Methods & Research 33(2), 261-304.
| Crossref | Google Scholar |
Carey PL, Curtin D, Scott CL (2011) An improved procedure for routine determination of reserve-K in pastoral soils. Plant and Soil 341(1–2), 461-472.
| Crossref | Google Scholar |
Colwell JD, Esdaile RJ (1968) The calibration, interpretation, and evaluation of tests for the phosphorus fertilizer requirements of wheat in northern New South Wales. Australian Journal of Soil Research 6(1), 105-120.
| Crossref | Google Scholar |
Cox AE, Joern BC, Roth CB (1996) Nonexchangeable ammonium and potassium determination in soils with a modified sodium tetraphenylboron method. Soil Science Society of America Journal 60(1), 114-120.
| Crossref | Google Scholar |
Cox AE, Joern BC, Brouder SM, Gao D (1999) Plant-available potassium assessment with a modified sodium tetraphenylboron method. Soil Science Society of America Journal 63(4), 902-911.
| Crossref | Google Scholar |
Darunsontaya T, Suddhiprakarn A, Kheoruenromne I, Prakongkep N, Gilkes RJ (2012) The forms and availability to plants of soil potassium as related to mineralogy for upland Oxisols and Ultisols from Thailand. Geoderma 170, 11-24.
| Crossref | Google Scholar |
Das D, Dwivedi BS, Datta SP, Datta SC, Meena MC, Agarwal BK, Shahi DK, Singh M, Chakraborty D, Jaggi S (2019) Potassium supplying capacity of a red soil from eastern India after forty-two years of continuous cropping and fertilization. Geoderma 341, 76-92.
| Crossref | Google Scholar |
Harries M, Flower KC, Scanlan CA (2021) Sustainability of nutrient management in grain production systems of south-west Australia. Crop & Pasture Science 72(3), 197-212.
| Crossref | Google Scholar |
Huang L, Bell RW, Dell B, Woodward J (2004) Rapid nitric acid digestion of plant material with an open-vessel microwave system. Communications in Soil Science and Plant Analysis 35(3-4), 427-440.
| Crossref | Google Scholar |
Jackson BLJ (1985) A modified sodium tetraphenylboron method for the routine determination of reserve-potassium status of soil. New Zealand Journal of Experimental Agriculture 13(3), 253-262.
| Crossref | Google Scholar |
Linnet K (1990) Estimation of the linear relationship between the measurements of two methods with proportional errors. Statistics in Medicine 9(12), 1463-1473.
| Crossref | Google Scholar |
Ma Q, Bell R (2016) Canola, narrow-leafed lupin and wheat differ in growth response to low–moderate sodium on a potassium-deficient sandy soil. Crop & Pasture Science 67(11), 1168-1178.
| Crossref | Google Scholar |
Ma Q, Bell R, Scanlan C, Neuhaus A (2022) Long-term rundown of plant-available potassium in Western Australia requires a re-evaluation of potassium management for grain production: a review. Crop & Pasture Science 73, 981-996.
| Crossref | Google Scholar |
Moody PW, Bell MJ (2006) Availability of soil potassium and diagnostic soil tests. Australian Journal of Soil Research 44(3), 265-275.
| Crossref | Google Scholar |
Nieuwenhuize J, Poley-vos CH, van den Akker AH, van delft W (1991) Comparison of microwave and conventional extraction techniques for the determination of metals in soil, sediment and sludge samples by atomic spectrometry. Analyst 116(4), 347-351.
| Crossref | Google Scholar |
Pal Y, Gilkes RJ, Wong MTF (1999) The forms of potassium and potassium adsorption in some virgin soils from south-western Australia. Australian Journal of Soil Research 37(4), 695-709.
| Crossref | Google Scholar |
Pal Y, Gilkes RJ, Wong MTF (2001a) Soil factors affecting the availability of potassium to plants for Western Australian soils: a glasshouse study. Australian Journal of Soil Research 39(3), 611-625.
| Crossref | Google Scholar |
Pal Y, Gilkes RJ, Wong MTF (2001b) Mineralogy and potassium release from some Western Australian soils and their size fractions. Australian Journal of Soil Research 39(4), 813-822.
| Crossref | Google Scholar |
Pal Y, Gilkes RJ, Wong MTF (2002) Mineral sources of potassium to plants for seven soils from south-western Australia. Soil Research 40(8), 1357-1369.
| Crossref | Google Scholar |
Pleysier JL, Juo ASR (1980) A single-extraction method using silver-thiourea for measuring exchangeable cations and effective CEC in soils with variable charges. Soil Science 129(4), 205-211.
| Crossref | Google Scholar |
Salomon E (1998) Extraction of soil potassium with 0.01M calcium chloride compared to official Swedish methods. Communications in Soil Science and Plant Analysis 29(19-20), 2841-2854.
| Crossref | Google Scholar |
Searle PL (1986) The measurement of soil cation exchange properties using the single extraction, silver thiourea method – an evaluation using a range of New Zealand soils. Australian Journal of Soil Research 24(2), 193-200.
| Crossref | Google Scholar |
Volf MR, Crusciol CAC, de Azevedo AC, Thompson ML, Kovar JL, Rosolem CA (2021) Potassium bioavailability in a tropical kaolinitic soil. Agronomy 11(10), 2016.
| Crossref | Google Scholar |
Wood LK, DeTurk EE (1941) The absorption of potassium in soils in non-replaceable forms. Soil Science Society of America Journal 5(C), 152-161.
| Crossref | Google Scholar |
Zhang Y, Nachimuthu G, Mason S, McLaughlin MJ, McNeill A, Bell MJ (2017) Comparison of soil analytical methods for estimating wheat potassium fertilizer requirements in response to contrasting plant K demand in the glasshouse. Scientific Reports 7, 11391.
| Crossref | Google Scholar |
Zhang Z, Liu D, Wu M, Xia Y, Zhang F, Fan X (2021) Long-term straw returning improve soil K balance and potassium supplying ability under rice and wheat cultivation. Scientific Reports 11(1), 22260.
| Crossref | Google Scholar |