

Revised emission factors for estimating direct nitrous oxide emissions from nitrogen inputs in Australia’s agricultural production systems: a meta-analysis
Peter Grace A * , Daniele De Rosa A B , Iurii Shcherbak A , Alice Strazzabosco A , David Rowlings A , Clemens Scheer A , Louise Barton C , Weijin Wang D , Graeme Schwenke E , Roger Armstrong F , Ian Porter G and Michael Bell H
A
B
C
D
E
F
G
H
Abstract
Agricultural soils are a major source of emissions of the greenhouse gas nitrous oxide (N2O).
Quantify direct N2O emissions from Australian agricultural production systems receiving nitrogen (N) inputs from synthetic and organic fertilisers, crop residues, urine and dung.
A meta-analysis of N2O emissions from Australian agriculture (2003–2021) identified 394 valid emission factors (EFs), including 102 EFs with enhanced efficiency fertilisers (EEFs).
The average EF from all N sources (excluding EEFs) was 0.57%. Industry-based EFs for synthetic N fertiliser (excluding EEFs) ranged from 0.17% (non-irrigated pasture) to 1.77% (sugar cane), with an average Australia-wide EF of 0.70%. Emission factors were independent of topsoil organic carbon content, bulk density and pH. The revised EF for the non-irrigated cropping (grains) industry is now 0.41%; however, geographically-defined EFs are recommended. Urea was the most common N source with an average EF of 0.72% compared to urine (0.20%), dung (0.06%) and organo-mineral mixtures (0.26%). The EF for synthetic N fertilisers in rainfed environments increased by 0.16% for every 100 mm over 300 mm mean annual rainfall. For each additional 50 kg N ha−1 of synthetic fertiliser, EFs increased by 0.13%, 0.31% and 0.38% for the horticulture, irrigated and high rainfall non-irrigated cropping industries, respectively. The use of 3,4 dimethylpyrazole-phosphate (DMPP) produced significant reductions in EFs of 55%, 80% and 84% for the horticulture, non-irrigated and irrigated cropping industries, respectively.
Incorporation of the revised EFs into the 2020 National Greenhouse Accounts (NGA) produced a 12% increase in direct N2O emissions from the application of synthetic N fertilisers. The lack of country-specific crop residue decomposition data is a major deficiency in the NGA.
Keywords: DMPP, emission factors, inventory, meta-analysis, nitrification inhibitors, nitrogen fertiliser, nitrous oxide.
Introduction
Agriculture constitutes 15% of Australia’s annual greenhouse gas emissions (Department of Industry, Science, Energy and Resources 2022). Australia is a semi-arid continent of over 750 Mha with an arid heartland (300 Mha) unsuitable for agriculture. Agricultural production is restricted to rainfed farmland (97 Mha) including permanent and perennial pastures, continuous dryland cropping (wheat and sorghum) and phased crop–pasture systems; intensive agriculture (4 Mha) including dairy production, irrigated horticulture and field crops such as cotton; and pastoral rangeland (355 Mha) in semi-arid and northern tropical regions (Angus and Grace 2017).
Nitrous oxide (N2O) represents 15% of Australia’s agricultural emissions. Soils are the primary source of N2O emissions from Australia agriculture at 12.3 Mt carbon dioxide equivalents (CO2e) per annum which includes both direct emissions (9.2 Mt CO2e) from the application of inorganic (26%) and organic nitrogen (5%) fertilisers, crop residue decomposition (36%) and dung and urine from grazing animals (30%), and indirect emissions (3.1 Mt CO2e). The default aggregated emission factor (EF1) for N2O emissions from N input currently recommended by the Intergovernmental Panel on Climate Change (IPCC 2019) is 1% after correction for background (0N) emissions, i.e. for every 100 kg of N input, 1.0 kg of N in the form of N2O is estimated to be emitted directly from soil. The 1% EF1 assumes a linear relationship between the mass of N input and N2O emissions and is indifferent to any biological thresholds that might occur; for example, when the availability of soil inorganic N exceeds crop N demands (Shcherbak et al. 2014).
Globally, a growing number of field experiments with multiple N fertiliser rates demonstrate non-linear responses in N2O emissions to increasing N inputs across a range of fertiliser formulations, climates and soil types (e.g. McSwiney and Robertson 2005; Ma et al. 2010; Hoben et al. 2011; Kim et al. 2013; Signor et al. 2013; Shcherbak et al. 2014; Scheer et al. 2016; Millar et al. 2018; Takeda et al. 2021), suggesting that EFs are not constant but increase with N additions. Grace et al. (2016) evaluated eight separate field campaigns from the Australian cotton industry with respect to N2O emissions and the development of linear and/or non-linear models describing EFs in response to exogenous N inputs. Where variable N rate information was explicitly available (i.e. farm or regional methodology or regional inventory data), a two-component (linear + exponential) model was recommended, with EFs capped at a maximum of 1.83% (until additional observational data is available for rates in excess of 300 kg N ha−1). Where only average N application rate information is available, a linear EF of 0.55% was recommended.
The meta-analysis examined the impact of management, soil and climate interactions on N2O emissions from crop and pasture production systems in Australia receiving externally sourced N inputs, including the use of enhanced efficiency fertilisers (EEFs). The study represents an update of the EFs currently in use in Australia (Shcherbak and Grace 2014) (Table 1) to estimate fertiliser-induced N2O emissions for inclusion in the National Greenhouse Accounts (NGA) of Australia including EEFs. The analysis also includes a re-assessment of the EFs associated with urine and dung (manure) inputs from grazing animals (specifically EF3 as designated by the IPCC) and organo-mineral N fertiliser applications.
| Production system | Treatments | Mean N Rate and range (kg ha−1) | Revised EF (%) | s.e. | Current EF (%) | |
|---|---|---|---|---|---|---|
| Non-irrigated crop | 111 | 88 (20–240) | 0.56A | 0.06 | ||
| Low-rainfall crop (≤ 600 mm) | (51) | 78 (20–160) | 0.29 | 0.08 | 0.05 | |
| High-rainfall crop (>600 mm) | (60) | 96 (30–240) | 0.80 | 0.09 | 0.84 | |
| Non-irrigated crop (climatic)B | 111 | 88 (20–240) | 0.41 | 0.2C | ||
| Non irrigated crop – only WAD | (15) | 76 (20–100) | 0.04 | 0.01 | ||
| Non irrigated crop – excl. WA | (96) | 90 (30–240) | 0.65 | 0.07 | ||
| Non-irrigated crop (geographic) | 111 | 88 (20–240) | 0.41 | |||
| Irrigated crop | 17 | 132 (20–300) | 0.62 | 0.17 | 0.85 | |
| Irrigated pasture | 11 | 271 (48–485) | 0.59 | 0.18 | 0.39 | |
| Non-irrigated pasture | 10 | 363 (100–939) | 0.17 | 0.05 | 0.21 | |
| Cotton | 22 | 182 (90–320) | 0.53 | 0.16 | 0.55 | |
| Sugar cane (excluding acid sulphate soils) | 26 | 142 (75–250) | 1.77 | 0.24 | 1.99 | |
| Horticulture | 24 | 210 (35–592) | 0.63 | 0.19 | 0.85 | |
| Non-irrigated pasture (urine) | 32 | 793 (140–2000) | 0.20 | 0.03 | 0.4 | |
| Non-irrigated pasture (dung) | 16 | 372 (152–448) | 0.06 | 0.01 | 0.4 | |
| Organo-mineral N fertiliser | 23 | 248 (96–907) | 0.26 | 0.06 |
Materials and methods
Estimates of N2O emissions from mineral and organic N fertilisers (and combined additions), crop residues, and urine and dung by grazing animals were obtained directly from peer-reviewed publications and federal government reports. The majority of the data was sourced from published field-based experimental studies within four major research networks funded by the Australia federal government since 2009, i.e. the Nitrous Oxide Research Program (NORP) (2009–2012), the National Agricultural Nitrous Oxide Research Program (NANORP) (2012–2016), the National Adaptation and Mitigation Initiative (NAMI) (2009–2012); and outputs from multiple projects funded through the Action on the Ground Program (2012–2016). The purpose of these programs was to baseline N2O emissions from common practices and develop N2O mitigation strategies which supported the environmentally sustainable productivity and profitability of Australia agriculture.
Studies were grouped by industry-based categories (i.e. production systems) which aligned with the NGA, i.e. non-irrigated (grain) crop, irrigated (grain) crop, non-irrigated pasture, irrigated pasture, sugar cane, cotton and horticulture. Additional data in the analysis included climate (e.g. mean annual rainfall (MAR)), agronomic management (e.g. irrigation, tillage, fertiliser product), soil properties (e.g. soil organic carbon, bulk density, soil type, cation exchange capacity) and experimental design. In the case of pastures, the EFs associated with the addition of urine and dung by grazing animals were also calculated as these are also included in the Agricultural Soils category (3.D) of the NGA.
With respect to the non-irrigated cropping category (which is dominated by rainfed grain production), we also examined two contrasting approaches to determine EFs, i.e. climatic versus geographic delineation of observations. With respect to climate, after a preliminary scan of N2O emissions and a variety of climatic variables and indices (e.g. precipitation/evaporation ratio) we chose to disaggregate the Australian grain production regions (West, South and North) on the basis of what is nominally considered to be high and low annual rainfall areas, with 600 mm MAR the chosen point of differentiation. These areas were accurately quantified in ARC GIS by overlaying a map of the Grains Research and Development Corporation (GRDC) agro-ecological zones with a Bureau of Meteorology contour map of average annual rainfall (1991–2020). For the geographic delineation, climatic conditions were irrelevant, and we calculated a separate EF for the Western Region (which is dominated by coarse textured soils) from the rest of the non-irrigated grains industry (South and North) of Australia. The three regions are geographically contained within state boundaries, i.e. the Western Region is solely within the state of Western Australia, the Southern Region encompasses south-eastern Australia and includes the states of South Australia, Victoria and Tasmania, and the Northern Region is within the states of Queensland and Victoria.
Emission factors were calculated by subtracting seasonal N2O background emissions (ERsite,0) from each seasonal N2O emission at a non-zero N application rate (ERsite,N) for each respective site, then dividing the calculated net emission by the fertiliser application rate (N):
The background N2O emissions were estimated from measurements for the same year, crop, management and field as the N2O emissions induced by the external N inputs. On the single occasion where this background data was not explicitly available, i.e. the high temporal frequency N2O data of Scheer et al. (2013) measured using the fully automated chambers described in Grace et al. (2020), we assumed that the daily background N2O emissions were equivalent to the lowest emissions consistently recorded at least 2 months after the addition of the N source. We based this assumption on Bouwman (1996) who reported that most of the N2O from fertiliser is emitted within a month after N application, after which N2O emissions decline to a background level.
Statistical analyses were performed in the R environment (R Core Team 2021). Analysis of groups of site-years was performed to determine mean and standard error of EFs associated with fertiliser-induced N2O emissions for each production system.
The efficacy of specific EEFs within a production system was tested using pairwide comparisons of N rate for the same site-year and a one-tailed t-test.
Both simple linear and linear mixed-modelling approaches were applied to test the response of EF to MAR in non-irrigated agricultural systems, and the response of mineral fertiliser nitrogen applications in horticultural cropping systems, as well as in both irrigated and non-irrigated cropping sectors. The linear mixed-modelling approach included the year of experimentation, location and duration of the measurement periods as random effects. These variables were treated as random effects to account for potential variability across different experiments. If no significant difference was observed between the simple linear regression and the linear mixed-model approach, the simpler model (i.e. simple linear regression) was used. The linear mixed models were evaluated with the marginal R2 (R2LMM(m)), which represents the proportion of variance explained by the fixed effects of the model, ignoring the contribution of any random effects (Nakagawa and Schielzeth 2013), using the R package MuMIn (Bartoń 2023).
Results and discussion
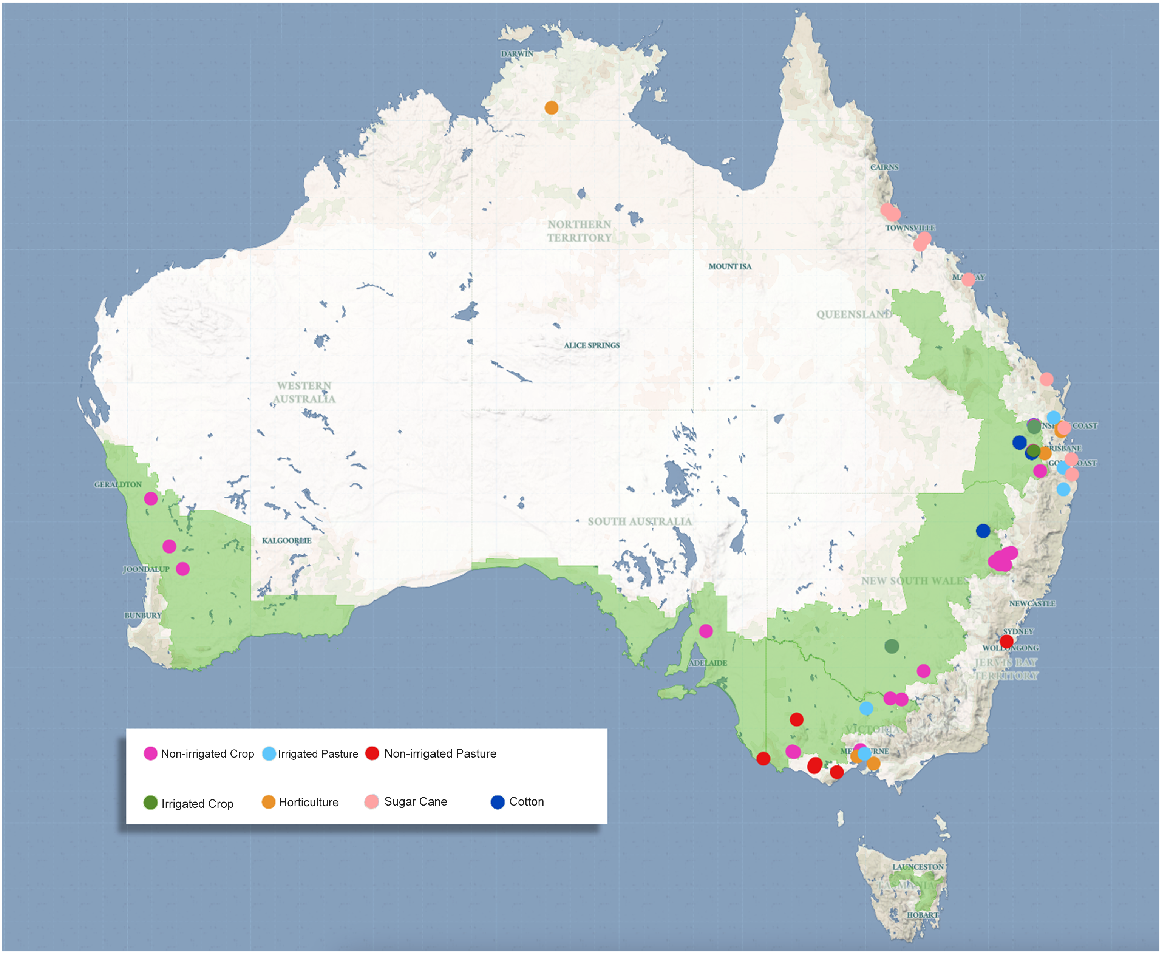
A total of 419 individual EFs were identified with one-third being in irrigated crop and pasture systems, as well as 108 EFs for treatments where EEFs had been applied. Negative EFs were included in our analysis. The majority of studies utilised fully automated greenhouse gas monitoring systems as described by Grace et al. (2020) with eight discrete measurement periods per day and in situ measurement of N2O using in line gas chromatograph. Data was collected from 50 separate trial sites across Australia covering the seven major production systems outlined in the NGA (Fig. 1). The average measurement period was 222 days (30–900 days) with two-thirds of the experiments (n = 283) exceeding 150 days. The shorter measurement periods (<100 days) were only utilised in the intensively managed horticulture and pasture systems where multiple N applications or multiple crops within a single year are the norm. In contrast, the longest measurement periods (average 314 days) were found in the sugar cane industry (n = 36). Over one-third of the EF dataset (n = 148) was collected from 20 locations with non-irrigated grain experiments (average 254 days) with the majority of the non-irrigated grain experiments on the heavier textured soils of eastern Australia. For non-irrigated pastures (n = 99), six locations were utilised with an average measurement period of 172 days. The non-irrigated pasture sites were mainly under dairy production with the majority of these measurements at Terang (n = 56) in the higher rainfall region of southern Australia.
Location of historical nitrous oxide measurement trials in Australia and their relationship to the production systems listed in the National Greenhouse Accounts. Green shading indicates the extent of grain cropping systems as determined by the Grains Research and Development Corporation (GRDC).
Consistently high EFs in the sugarcane data (Denmead et al. 2010; Wang et al. 2016; Westermann 2017; Salazar Cajas 2019) (n = 8) on acid sulfate soils (ASS) were excluded. Anomalies in the non-irrigated crop data for Hamilton in 2012 (Harris et al. 2016) and Hart in 2015 (Poole 2017) (n = 4) were excluded after identification of potential sampling and analysis errors. Studies by Jamali et al. (2016), Schwenke et al. (2015) and Muller et al. (2023) (n = 13) were also excluded as no background emissions data was available or reasonably estimated.
Nitrogen fertilisers
Of the 394 valid EFs included in the final analysis, there were 292 non-EEF treatments which included synthetic fertiliser, urine, dung and organo-mineral mixtures returning an Australian average EF of 0.57%. Synthetic N fertilisers were exclusively applied in 221 cases returning an average EF of 0.70%. This EF is significantly lower than the aggregated EF1 value of 1% for synthetic N fertilisers (and N inputs generally) recommended by the IPCC (IPCC 2019). The IPCC also provide disaggregated EFs by differentiating wet and dry climates. By excluding the individual EFs from the Australian ‘wet climate’ sugar cane industry, the average ‘dry climate’ EF for Australia of 0.56% (n = 195) is higher than the IPCC’s disaggregated EF1 recommendation of 0.50% for N fertiliser application in dry climates. The Australian ‘wet climate’ EF of 1.77% (i.e. the sugar cane industry) is also higher than the 1.6% recommended by the IPCC but it does fall within the confidence limits reported by the IPCC for wet climates. It should be noted that the IPCC EF1 does not distinguish between irrigated and non-irrigated systems; however, by excluding N2O date for irrigated systems from the ‘dry climate’ returns an EF of 0.53% (n = 121).
Urea was the most commonly used N fertiliser in the dataset with 213 observations, with an average EF of 0.72%, well above the average EF of urine (0.20%), dung (0.06%) and organo-mineral mixtures (0.26%) (Table 1). Whilst the revised EF for urine is consistent with the IPCC EF3 recommendation for ‘dry climates’ (0.2%) (IPCC 2019), the revised EF for dung is significantly lower. The revised EFs for both urine and dung are also significantly lower compared to the current EF used for both N inputs in the NGA, i.e. 0.4%, which is based on the aggregated EF3 value recommended by the IPCC. Separate EFs for urine and dung is consistent with approaches taken by New Zealand (van der Weerden et al. 2011) and the United Kingdom (Chadwick et al. 2018) where animal based N inputs and N2O emissions have been extensively researched.
The revised EF for organo-mineral mixtures (0.26%) is significantly lower than the recommended IPCC EF1 value (0.5%) for dry climates and well below the average EF of 1.5% reported in the meta-analysis by Charles et al. (2017); however, the majority of Australian studies were in irrigated horticulture (e.g. De Rosa et al. 2016, 2018) with a precision budgetting approach to N management which limits N2O emissions. Also, there are no definitive EFs for above and belowground crop residue decomposition in Australia except for the observations of Schwenke et al. (2015) which range from 0.12% to 0.62% (average 0.32%) but are not corrected for background emissions and therefore overestimate N2O emissions from crop residues. The EF for crop residues used in the 2020 NGA is 1.0% based on the aggregated EF1 value recommended by the IPCC in 2006 (IPCC 2006); however, the IPCC (2019) ‘dry climate’ EF1 is 0.5% which still exceeds the uncorrected EF values reported by Schwenke et al. (2015). The global meta-analysis of Charles et al. (2017) reported an average EF of 0.19% across eight crop residue studies. A recent global meta-analysis of N2O emissions from crop residues by Abalos et al. (2022) reported a large range in residue-based N2O emissions but no useable data on surface residue decomposition in dry climates which is the norm for Australian no-till non-irrigated grain cropping systems.
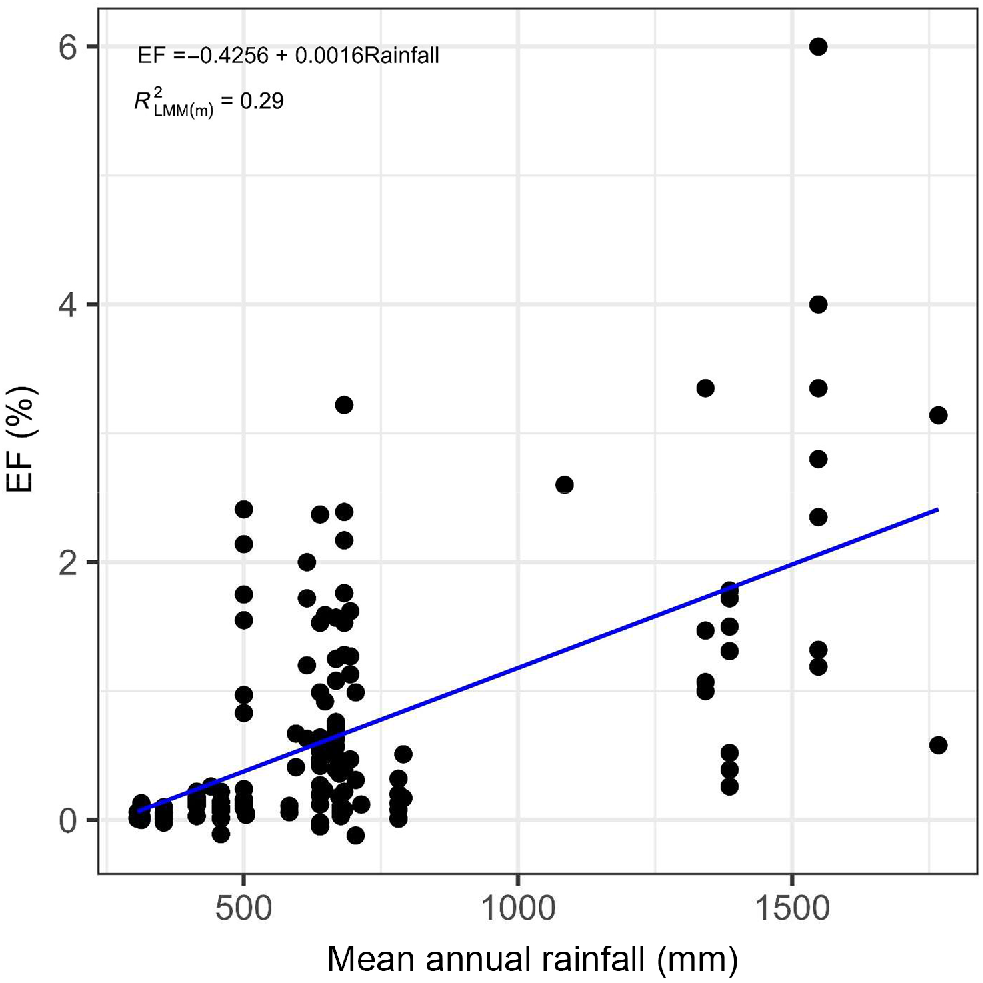
The average EF for irrigated (crop and pasture) systems receiving synthetic N fertilisers (excluding EEFs) was 0.67% (n = 79) with 201 kg N ha−1 applied on average during the growing season. The EF for rainfed (crop and pasture) systems receiving synthetic N fertiliser (excluding EEFs) was 0.75% (n = 142) with an average N application of 113 kg ha−1. A highly significant linear relationship was found in rainfed systems between the EF associated with the application of urea and MAR (Fig. 2) with the EF increasing by 0.16% for each 100 mm over 300 mm MAR.
Nitrous oxide emission factors (%) in response to N fertiliser addition in non-irrigated agricultural systems and their relationship to mean annual rainfall in Australia. Excluding enhanced efficiency fertilisers. Year, location and duration of measurement were included as random effects in the linear mixed-modelling approach.
The industry-based EFs in response to applying synthetic N fertilisers (excluding EEFs) ranged from 0.17% (non-irrigated pasture) to 1.77% (sugar cane) (Table 1), with an average EF value of 0.71% across all observations. The irrigated and rainfed crop categories exclude cotton, horticulture and sugar cane, as they represent separate categories in the NGA. In all categories except cotton (revised EF = 0.53%), there were significant changes in the EF compared to those used in the NGA for 2020 (Department of Industry, Science, Energy and Resources 2022). This is due to the inclusion of 72 additional non-EEF fertiliser observations to complement the previous EF meta-analysis (of 148 studies) of Shcherbak and Grace (2014). In addition, some of the previous inclusions were either recalculated or reclassified. The majority of the additional data were in low rainfall (≤600 mm MAR) non-irrigated crop (n = 27), horticulture (n = 18) and sugar cane (n = 14) categories.
The revised EF for irrigated pasture (0.59%) is triple the revised EF value for non-irrigated pasture (0.17%). The latter EF is similar to the current EF value of 0.21% for non-irrigated pastures in the NGA for 2020 whilst the revised EF for irrigated pastures is double the current EF value in the NGA. The revised EFs for irrigated crops and horticulture are 0.62% and 0.63%, respectively, which are significantly lower than their current EF value (0.85%) in the NGA. The revised EFs for irrigated crops and horticulture are now similar to the EF of the cotton industry which has collected N2O emissions data for irrigated systems only.
Differentiating the non-irrigated cropping area of Australia into low (≤600 mm MAR) and high rainfall (>600 mm) MAR regions (the latter representing 23% of the non-irrigated cropping area of Australia) returned revised EFs of 0.29% and 0.80%, respectively, with a weighted climatic average EF of 0.41%, double the current EF in the NGA for non-irrigated crops using a similar climate-centric calculation. This change was mainly due to a significant increase in the EF for the low rainfall region, from 0.05% to 0.29%, based on a significant number of additional observations. The geographic differentiation of the non-irrigated crop category returned a revised EF of 0.04% for the Western Region compared to an average revised EF of 0.65% for the Northern and Southern Regions of grain production in Australia. With 39% of Australia’s non-irrigated grain crop grown in the Western Region (Australian Bureau of Statistics), the weighted geographic average EF was 0.41%, the same as the revised EF based on a weighted climatic average. The use of a weighted average climatic EF in the current NGA is problematic considering changes in both annual and seasonal rainfall linked to global warming. Nitrous oxide studies in the Western non-irrigated cropping region (dominated by the coarse-textured sands of Western Australia) have consistently returned low EFs (Barton et al. 2008, 2010, 2013, 2016). Considering regional N fertiliser usage data is readily available and embedded in the NGA calculation, we recommend that the weighted average climatic approach to the EF for non-irrigated cropping in the NGA be discontinued and be replaced by geographically-distinct EFs of 0.04% and 0.65% for the Western and North/South Regions of grain production, respectively.
Sugar cane production systems (excluding those on ASS) returned the highest revised EF (1.77%) of all production systems. Whilst this EF is slightly lower than the current EF value (1.99%) in the 2020 NGA for sugar cane, the revised EF calculation includes five new observations in irrigated cane (average EF = 0.81%). The EF in irrigated sugar cane is significantly lower than the current EF for sugar cane which is based solely on rainfed systems and there may be justification for separate EFs for irrigated and rainfed sugar cane similar to crop and pasture systems in the NGA. There is also growing evidence that the very high EFs in sugar cane that we excluded from this and previous analyses (Shcherbak and Grace 2014) are consistent with the reducing conditions in the sub-layers of ASS inducing N2O production through abiotic chemo-denitrification (Chalk and Smith 1983; Wang et al. 2008). A preliminary estimate by the Department of Environment and Science in the State of Queensland (the major region of sugar production in Australia) indicates that approximately 5% of cane is grown on ASS. A separate (relatively high) EF exceeding 10% may be required for estimating N2O emissions from sugar cane production on ASS.
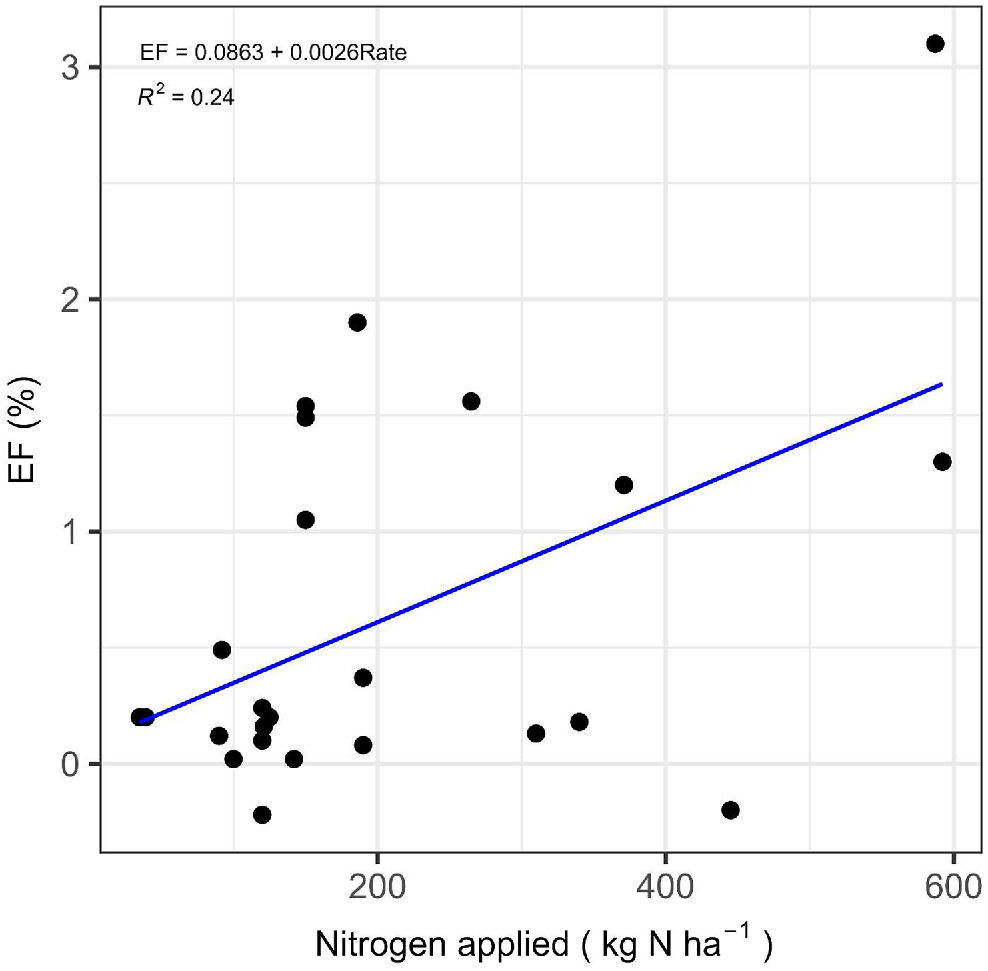
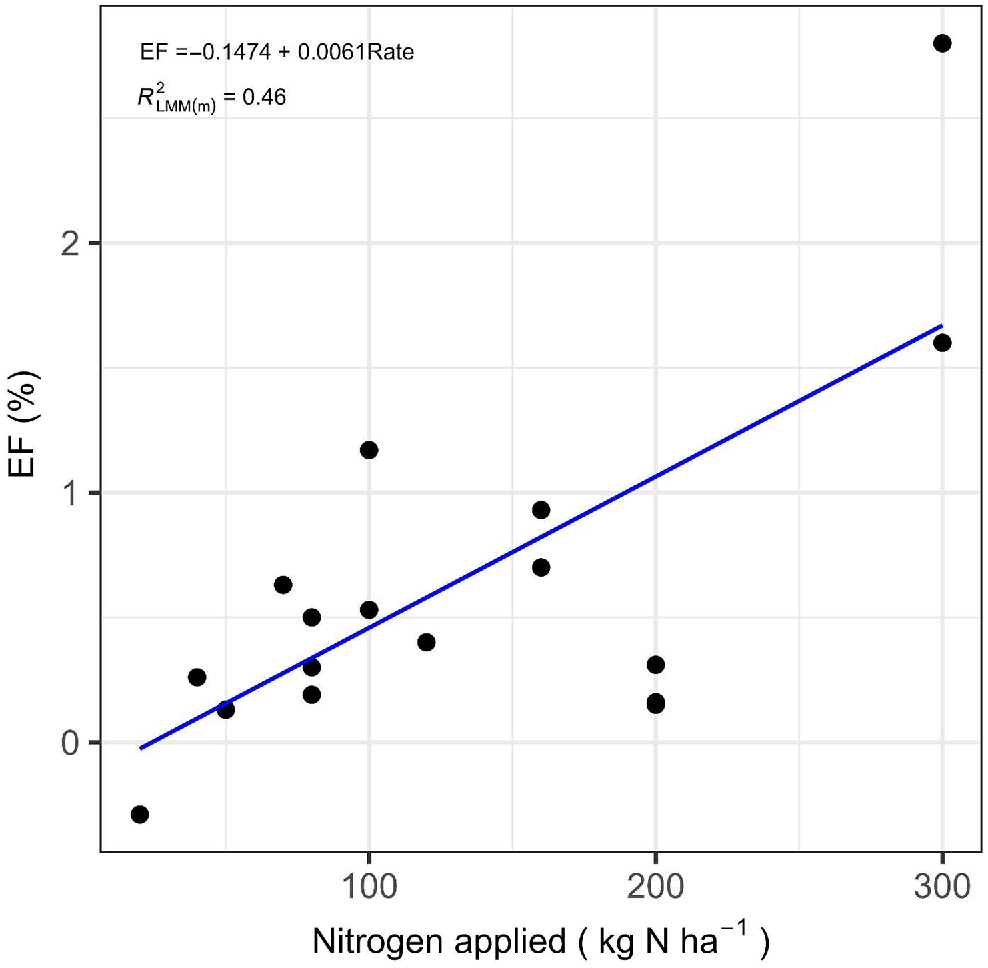
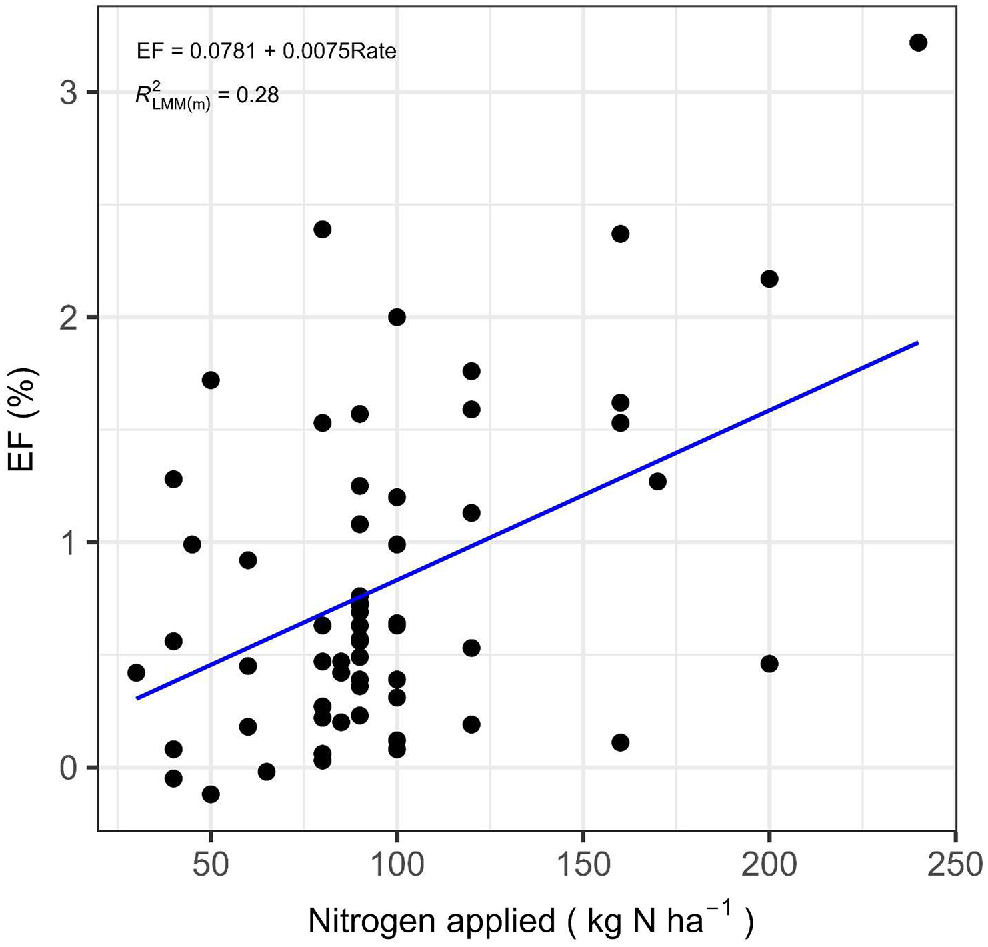
We analysed each of the industry-based datasets to determine if linear or non-linear (i.e. exponential) models for EFs could be developed to relate N2O emissions to N fertiliser application rate (as per Shcherbak et al. 2014). Emission factors with a significant linear response to N rate were identified in the horticulture industry (Fig. 3), irrigated cropping (Fig. 4) and the high rainfall (>600 mm MAR) non-irrigated cropping systems (Fig. 5). The latter is geographically analogous to the grains region of eastern Australia. For each additional 50 kg N ha−1 of N fertiliser, EFs increased by 0.13%, 0.31% and 0.38% for horticulture, irrigated cropping and high rainfall non-irrigated cropping categories, respectively. The industries with the highest degree of statistical confidence for an exponential response in EF to N rate were cotton and to a lesser extent irrigated cropping. A two-component EF model (with both linear and exponential components) has been developed and published for cotton (Grace et al. 2016).
Nitrous oxide emission factors (EF; %) in response to mineral fertiliser nitrogen applications in the horticulture sector of Australian agriculture. Excluding enhanced efficiency fertilisers. Year, location and duration of measurements were included as random effects in the linear mixed-modelling approach.
Nitrous oxide emission factors (EF; %) in response to mineral fertiliser nitrogen applications in the irrigated cropping sector of Australian agriculture. Excluding enhanced efficiency fertilisers. Year, location and duration of measurements were included as random effects in the linear mixed-modelling approach.
Nitrous oxide emission factors (EF; %) in response to mineral fertiliser nitrogen applications in the non-irrigated cropping sector of Australian agriculture. Excluding enhanced efficiency fertilisers. Year, location and duration of measurements were included as random effects in the linear mixed modelling approach.
Enhanced efficiency fertilisers
A total of 108 EEF observations were identified, with six discarded as anomalies (Table 2). The average EF across all production systems, N sources and EEFs was 0.20% (n = 102) with 60 observations returning an EF < 0.15% (Table 3). Nearly one-half of all EEF studies (n = 46) applied 3,4 dimethylpyrazole-phosphate (DMPP) (EF = 0.20%), with the non-irrigated cropping (n = 20) and horticulture (n = 13) categories both returning an average EF of 0.15%. Pairwise comparisons of DMPP and urea applications returned significant reductions in the EF of non-irrigated cropping systems (n = 17) of 80% (P < 0.01), 55% (P < 0.05) in horticulture (n = 9) and 84% (P < 0.05) in irrigated cropping (n = 4). The efficacy of DMPP to reduce N2O emissions in Australian croplands and horticulture is far higher than the EF reported by Gilsanz et al. (2016) who only had a total of 22 observations globally, with a high proportion in grasslands. Fan et al. (2022) reported the ‘exceptional’ performance of DMPP at lowering both N2O and EF in their meta-analysis which included 82 DMPP observations. They attributed the efficacy of DMPP to its reduced mobility, lower water solubility, higher resistance to biodegradation and longer residence time in soil compared with other products.
| Production system | EEFA | |||||||
|---|---|---|---|---|---|---|---|---|
| DMPP | NBPT | 3MP + TZ | Nitrapyrin | DCD | PCU | Alzon | ||
| Non-irrigated crop | 20 (95) | 4 (85) | – | 1 (170) | – | 2 (130) | – | |
| Irrigated crop | 4 (130) | – | – | – | – | – | – | |
| Irrigated pasture | 2 (323) | 1 (485) | – | – | 2 (1000)B | – | ||
| Non-irrigated pasture (fert.) | 5 (188) | 6 (197) | – | – | 3 (180) | 1 (250) | – | |
| Cotton | – | – | – | – | – | – | – | |
| Sugar cane | 2 (115) | – | – | – | – | 1 (80) | – | |
| Horticulture | 13 (276) | – | 3 (490) | – | 2 (123) | – | 1 (125) | |
| Non-irrigated pasture (urine) | – | – | – | 9 (844) | 11 (963) | – | ||
| Non-irrigated pasture (dung) | – | – | – | 9 (360) | – | – | ||
| Total | 46 (174) | 11 (182) | 3 (490) | 19 (589) | 18 (739) | 4 (148) | 1 (125) | |
| Production system | EEFA | |||||||
|---|---|---|---|---|---|---|---|---|
| DMPP | NBPT | 3MP + TZ | Nitrapyrin | DCD | PCU | Alzon | ||
| Non-irrigated crop | 0.15 (0.05) | 0.15 (0.04) | – | 0.83 (–) | – | 0.34 (0.03) | – | |
| Irrigated crop | 0.11 (0.05) | – | – | – | – | – | – | |
| Irrigated pasture | 0.41 (0.29) | 0.7 (–) | – | – | 0.32 (0.02)B | – | ||
| Non-irrigated pasture (fert.) | 0.12 (0.05) | 0.15 (0.11) | – | – | 0.12 (0.07) | 0.07 (–) | – | |
| Cotton | – | – | – | – | – | – | – | |
| Sugar cane | 1.2 (0.01) | – | – | – | – | 2.8 (–) | – | |
| Horticulture | 0.15 (0.08) | – | 0.18 (0.06) | – | 0.16 (0.01) | – | 0.16 (–) | |
| Non-irrigated pasture (urine) | – | – | – | 0.09 (0.04) | 0.18 (0.04) | – | – | |
| Non-irrigated pasture (dung) | – | – | – | 0.03 (0.01) | – | – | – | |
| Average (s.e.) | 0.20 (0.05) | 0.15 (0.06) | 0.15 (0.05) | 0.10 (0.04) | 0.18 (0.03) | 0.89 (0.64) | 0.16 (–) | |
The use of dicycandiamide (DCD) (n = 14) and 2-chloro-6 (trichloromethyl) pyridine (Nitrapyrin) (n = 18) was prolific in non-irrigated pastures returning EFs of 0.17% and 0.06%, respectively. Pairwise comparisons (n = 9) found no significant reduction in the N2O EF when Nitrapyrin was applied with either urine or dung but a 58% reduction in the EF (P < 0.01) when DCD was applied with urine (n = 11). The latter is consistent with observations by Soares et al. (2023). The use of the urease inhibitor N-(n-Butyl) thiophosphoric triamide (NBPT) was reported in 11 studies with an average EF of 0.20%. Pairwise comparisons (n = 7) found no significant reduction in EF through the use of NBPT.
National inventory
On average, between 2014 and 2020 there was 1.4 Mt of N fertiliser applied to Australian agricultural production systems per annum (Australian Government Emissions Information System 2023). This was mainly in the form of urea which is the primary N fertiliser used in the development of EFs for determining total N2O emissions from Australian agriculture. The most recent NGA (Department of Industry, Science, Energy and Resources 2022) includes the use of 1514 kt N fertiliser in agriculture in 2020, with 50% being applied in non-irrigated pasture and 34% in non-irrigated cropping systems (Table 4). Using the EFs provided in the 2020 NGA, a total of 5165 t N2O-N was estimated to be directly emitted from N synthetic fertilisers in that year. This is equivalent to 2419 kt CO2e using a Global Warming Potential of 298 for N2O as stated in the 2020 NGA. Invoking the revised EFs and using 2020 N fertiliser data would result in 2716 kt CO2e being emitted, a 12% higher estimate in national N2O emissions from N fertilisers applied in the agricultural sector. The main contributor to this increase in N2O emissions using revised EFs was non-irrigated cropping systems with an additional 513 kt CO2e. Effectively, a doubling of N2O emissions from synthetic fertilisers compared to the EFs used in the official 2020 NGA. Nitrous oxide emissions from irrigated pastures would also increase by 51% or 47 kt CO2e. Significant reductions in N2O emissions were evident in the non-irrigated pasture category (107 kt CO2e), sugar cane (78 kt CO2e), horticulture (60 kt CO2e) and irrigated cropping (26 kt CO2e). Hypothetically, complete adoption of DMPP across the entire non-irrigated cropping (grains) sector of Australia, would potentially result in a saving of 802 kt CO2e based on an 80% reduction in the revised EF of the non-irrigated cropping EF using the total N fertiliser applied as outlined in the NGA for 2020.
| Production system | N fertiliserA (kt) | NGA EF (%)B | N2O emitted (t N) | N2O emitted (kt CO2e)C | Revised EF (%) | N2O emitted (t N) | N2O emitted (kt CO2e)C | |
|---|---|---|---|---|---|---|---|---|
| Non-irrigated crop | 522 | 0.20 | 1044 | 489 | 0.41 | 2140 | 1002 | |
| Irrigated crop | 24 | 0.85 | 207 | 97 | 0.7 | 171 | 80 | |
| Irrigated pasture | 50 | 0.39 | 196 | 92 | 0.59 | 300 | 139 | |
| Non-irrigated pasture | 764 | 0.21 | 1604 | 751 | 0.18 | 1375 | 644 | |
| Cotton | 17 | 0.55 | 95 | 45 | 0.53 | 92 | 43 | |
| Sugar cane | 76 | 1.99 | 1503 | 704 | 1.77 | 1337 | 626 | |
| Horticulture | 61 | 0.85 | 517 | 242 | 0.64 | 389 | 182 | |
| Total | 1514 | 5165 | 2419 | 5799 | 2706 |
Conclusions
The majority of the revised EFs are not consistent with the 2019 IPCC Refinement for N2O Emissions from Managed Soils, the current NGA and global meta-analyses, which is further evidence that in developing national greenhouse gas inventories, country-specific data must be paramount. The derivation of a single weighted average EF for non-irrigated cropping should potentially be discontinued and replaced by geographically-defined EFs. Reductions in EFs have been identified in irrigated cropping and horticulture, but these changes do not offset the national increase in N2O emissions primarily from non-irrigated cropping and irrigated pastures. Separate EFs for irrigated and rainfed sugar cane, as well as cane on ASS should be considered, but may require additional observations for validation. There is no useable data for estimating N2O emissions from crop residue decomposition in Australia and there is every indication that the recommended IPCC default (aggregated and disaggregated) EFs are too high for Australia and overestimating N2O emissions from that source. Overcoming this specific deficiency in N2O emissions data from agriculture should be a research priority considering that crop residues are 36% of the official national account of direct N2O emissions from Australia’s agricultural soils. Enhanced efficiency fertilisers such as DMPP and DCD provide significant opportunities for reducing N2O emissions from cropping and horticultural systems and confirm international observations of their efficacy. Using EEFs does come at an increased cost to agricultural producers both financially, and in some cases, the health of the broader community if you consider application of DCD in New Zealand (Ray et al. 2023). Rose et al. (2018) argue that the agronomic efficiency of inhibitors is underestimated and reductions in the application rates (and therefore cost) as well as N2O emissions can be realised without negatively impacting agricultural production. To increase the adoption of EEFs in the agricultural market place at scale, fertiliser companies could be incentivised through the carbon credit market to produce EEFs at a reduced cost.
Conflicts of interest
Peter Grace is an Associate Editor of Soil Research but was blinded from the peer review process for this paper.
Declaration of funding
The project was supported by the Australian Government and Department of Economic Development Jobs Transport and Resources Victoria, with in-kind support from Fertiliser Australia and the wider fertiliser industry of Australia.
Acknowledgements
This paper was developed as part of the Fertcare Carbon Farming Extension Project. We thank Jeff Kraak (Fertiliser Australia) and Graeme Anderson (Victorian Government) for their insight and useful discussions.
References
Abalos D, Recous S, Butterbach-Bahl K, De Notaris C, Rittl TF, Topp CFE, Petersen SO, Hansen S, Bleken MA, Rees RM, Olesen JE (2022) A review and meta-analysis of mitigation measures for nitrous oxide emissions from crop residues. Science of The Total Environment 828, 154388.
| Crossref | Google Scholar |
Angus JF, Grace PR (2017) Nitrogen balance in Australia and nitrogen use efficiency on Australian farms. Soil Research 55, 435-450.
| Crossref | Google Scholar |
Australian Government Emissions Information System (2023) AGEIS activity table-1990-2020-agriculture-fertiliser. Available at ageis.climatechange.gov.au
Barton L, Kiese R, Gatter D, Butterbach-Bahl K, Buck R, Hinz C, Murphy DV (2008) Nitrous oxide emissions from a cropped soil in a semi-arid climate. Global Change Biology 14, 177-192.
| Crossref | Google Scholar |
Barton L, Murphy DV, Kiese R, Butterbach-Bahl K (2010) Soil nitrous oxide and methane fluxes are low from a bioenergy crop (canola) grown in a semi-arid climate. GCB Bioenergy 2, 1-15.
| Crossref | Google Scholar |
Barton L, Murphy DV, Butterbach-Bahl K (2013) Influence of crop rotation and liming on greenhouse gas emissions from a semi-arid soil. Agriculture, Ecosystems & Environment 167, 23-32.
| Crossref | Google Scholar |
Barton L, Hoyle FC, Stefanova KT, Murphy DV (2016) Incorporating organic matter alters soil greenhouse gas emissions and increases grain yield in a semi-arid climate. Agriculture, Ecosystems & Environment 231, 320-330.
| Crossref | Google Scholar |
Bartoń K (2023) MuMIn: multi-model inference. R package version 1.47.5. Available at https://CRAN.R-project.org/package=MuMIn
Bouwman AF (1996) Direct emission of nitrous oxide from agricultural soils. Nutrient Cycling in Agroecosystems 46, 53-70.
| Crossref | Google Scholar |
Chadwick DR, Cardenas LM, Dhanoa MS, Donovan N, Misselbrook T, Williams JR, Thorman RE, McGeough KL, Watson CJ, Bell M, Anthony SG, Rees RM (2018) The contribution of cattle urine and dung to nitrous oxide emissions: quantification of country specific emission factors and implications for national inventories. Science of The Total Environment 635, 607-617.
| Crossref | Google Scholar | PubMed |
Charles A, Rochette P, Whalen JK, Angers DA, Chantigny MH, Bertrand N (2017) Global nitrous oxide emission factors from agricultural soils after addition of organic amendments: a meta-analysis. Agriculture, Ecosystems & Environment 236, 88-98.
| Crossref | Google Scholar |
Denmead OT, Macdonald BCT, Bryant G, Naylor T, Wilson S, Griffith DWT, Wang WJ, Salter B, White I, Moody PW (2010) Emissions of methane and nitrous oxide from Australian sugarcane soils. Agricultural and Forest Meteorology 150, 748-756.
| Crossref | Google Scholar |
De Rosa D, Rowlings DW, Biala J, Scheer C, Basso B, McGree J, Grace PR (2016) Effect of organic and mineral N fertilizers on N2O emissions from an intensive vegetable rotation. Biology and Fertility of Soils 52, 895-908.
| Crossref | Google Scholar |
De Rosa D, Rowlings DW, Biala J, Scheer C, Basso B, Grace PR (2018) N2O and CO2 emissions following repeated application of organic and mineral N fertiliser from a vegetable crop rotation. Science of The Total Environment 637–638, 813-824.
| Crossref | Google Scholar | PubMed |
Fan D, He W, Smith WN, Drury CF, Jiang R, Grant BB, Shi Y, Song D, Chen Y, Wang X, He P, Zou G (2022) Global evaluation of inhibitor impacts on ammonia and nitrous oxide emissions from agricultural soils: a meta-analysis. Global Change Biology 28, 5121-5141.
| Crossref | Google Scholar | PubMed |
Gilsanz C, Báez D, Misselbrook TH, Dhanoa MS, Cárdenas LM (2016) Development of emission factors and efficiency of two nitrification inhibitors, DCD and DMPP. Agriculture, Ecosystems & Environment 216, 1-8.
| Crossref | Google Scholar |
Grace P, Shcherbak I, Macdonald B, Scheer C, Rowlings D (2016) Emission factors for estimating fertiliser-induced nitrous oxide emissions from clay soils in Australia’s irrigated cotton industry. Soil Research 54, 598-603.
| Crossref | Google Scholar |
Grace PR, van der Weerden TJ, Rowlings DW, Scheer C, Brunk C, Kiese R, Butterbach-Bahl K, Rees RM, Robertson GP, Skiba UM (2020) Global research alliance N2O chamber methodology guidelines: considerations for automated flux measurement. Journal of Environmental Quality 49, 1126-1140.
| Crossref | Google Scholar | PubMed |
Harris RH, Armstrong RD, Wallace AJ, Belyaeva ON (2016) Effect of nitrogen fertiliser management on soil mineral nitrogen, nitrous oxide losses, yield and nitrogen uptake of wheat growing in waterlogging-prone soils of south-eastern Australia. Soil Research 54, 619-633.
| Crossref | Google Scholar |
Hoben JP, Gehl RJ, Millar N, Grace PR, Robertson GP (2011) Nonlinear nitrous oxide (N2O) response to nitrogen fertilizer in on-farm corn crops of the US Midwest. Global Change Biology 17, 1140-1152.
| Crossref | Google Scholar |
IPCC (2019) N2O emissions from managed soils, and CO2 emissions from lime and urea application. In ‘2019 refinement to the 2006 IPCC guidelines for national greenhouse gas inventories’. (Eds E Buendia, K Tanabe, A Kranjc, J Baasansuren, M Fukuda, S Ngarize, A Osako, Y Pyrozhenko, P Shermanau, S Federici) pp. 11.1–11.48 (IPCC: Switzerland)
Jamali H, Quayle W, Scheer C, Baldock J (2016) Mitigation of N2O emissions from surface-irrigated cropping systems using water management and the nitrification inhibitor DMPP. Soil Research 54, 481-493.
| Crossref | Google Scholar |
Kim D-G, Hernandez-Ramirez G, Giltrap D (2013) Linear and nonlinear dependency of direct nitrous oxide emissions on fertilizer nitrogen input: a meta-analysis. Agriculture, Ecosystems & Environment 168, 53-65.
| Crossref | Google Scholar |
Ma BL, Wu TY, Tremblay N, Deen W, Morrison MJ, McLaughlin NB, Gregorich EG, Stewart G (2010) Nitrous oxide fluxes from corn fields: on-farm assessment of the amount and timing of nitrogen fertiliser. Global Change Biology 16, 156-170.
| Crossref | Google Scholar |
McSwiney CP, Robertson GP (2005) Nonlinear response of N2O flux to incremental fertilizer addition in a continuous maize (Zea mays L.) cropping system. Global Change Biology 11, 1712-1719.
| Crossref | Google Scholar |
Millar N, Urrea A, Kahmark K, Shcherbak I, Robertson GP, Ortiz-Monasterio I (2018) Nitrous oxide (N2O) flux responds exponentially to nitrogen fertilizer in irrigated wheat in the Yaqui Valley, Mexico. Agriculture, Ecosystems & Environment 261, 125-132.
| Crossref | Google Scholar |
Muller J, De Rosa D, Friedl J, De Antoni Migliorati M, Rowlings D, Grace P, Scheer C (2023) Combining nitrification inhibitors with a reduced N rate maintains yield and reduces N2O emissions in sweet corn. Nutrient Cycling in Agroecosystems 125, 107-121.
| Crossref | Google Scholar |
Nakagawa S, Schielzeth H (2013) A general and simple method for obtaining R2 from generalized linear mixed-effects models. Methods in Ecology and Evolution 4, 133-142.
| Crossref | Google Scholar |
Ray A, Forrestal P, Nkwonta C, Rahman N, Byrne P, Danaher M, Richards K, Hogan S, Cummins E (2023) Modelling potential human exposure to the nitrification inhibitor dicyandiamide through the environment-food pathway. Environmental Impact Assessment Review 101, 107082.
| Crossref | Google Scholar |
R Core Team (2021) R: A language and environment for statistical computing. R Foundation for Statistical Computing, Vienna, Australia. Available at https://www.R-project.org/
Rose TJ, Wood RH, Rose MT, Van Zwieten L (2018) A re-evaluation of the agronomic effectiveness of the nitrification inhibitors DCD and DMPP and the urease inhibitor NBPT. Agriculture, Ecosystems & Environment 252, 69-73.
| Crossref | Google Scholar |
Scheer C, Grace PR, Rowlings DW, Payero J (2013) Soil N2O and CO2 emissions from cotton in Australia under varying irrigation management. Nutrient Cycling in Agroecosystems 95, 43-56.
| Crossref | Google Scholar |
Scheer C, Rowlings DW, Grace PR (2016) Non-linear response of soil N2O emissions to nitrogen fertiliser in a cotton-fallow rotation in sub-tropical Australia. Soil Research 54, 494-499.
| Crossref | Google Scholar |
Schwenke GD, Herridge DF, Scheer C, Rowlings DW, Haigh BM, McMullen KG (2015) Soil N2O emissions under N2-fixing legumes and N-fertilised canola: a reappraisal of emissions factor calculations. Agriculture, Ecosystems & Environment 202, 232-242.
| Crossref | Google Scholar |
Shcherbak I, Millar N, Robertson GP (2014) Global metaanalysis of the nonlinear response of soil nitrous oxide (N2O) emissions to fertilizer nitrogen. Proceedings of the National Academy of Sciences 111, 9199-9204.
| Crossref | Google Scholar |
Signor D, Cerri CEP, Conant R (2013) N2O emissions due to nitrogen fertilizer applications in two regions of sugarcane cultivation in Brazil. Environmental Research Letters 8, 015013.
| Crossref | Google Scholar |
Soares JR, Souza BR, Mazzetto AM, Galdos MV, Chadwick DR, Campbell EE, Jaiswal D, Oliveira JC, Monteiro LA, Vianna MS, Lamparelli RAC, Figueiredo GKDA, Sheehan JJ, Lynd LR (2023) Mitigation of nitrous oxide emissions in grazing systems through nitrification inhibitors: a meta-analysis. Nutrient Cycling in Agroecosystems 125, 359-377.
| Crossref | Google Scholar |
Takeda N, Friedl J, Rowlings D, De Rosa D, Scheer C, Grace P (2021) Exponential response of nitrous oxide (N2O) emissions to increasing nitrogen fertiliser rates in a tropical sugarcane cropping system. Agriculture, Ecosystems & Environment 313, 107376.
| Crossref | Google Scholar |
van der Weerden TJ, Luo J, de Klein CAM, Hoogendoorn CJ, Littlejohn RP, Rys GJ (2011) Disaggregating nitrous oxide emission factors for ruminant urine and dung deposited onto pastoral soils. Agriculture, Ecosystems & Environment 141, 426-436.
| Crossref | Google Scholar |
Wang WJ, Reeves SH, Salter B, Moody PW, Dalal RC (2016) Effects of urea formulations, application rates and crop residue retention on N2O emissions from sugarcane fields in Australia. Agriculture, Ecosystems & Environment 216, 137-146.
| Crossref | Google Scholar |