

WEPP interrill erodibility for clay soils in the crop lands of Northern NSW and Southern Queensland, Australia
Silburn D. Mark A B * and Bronwyn Bosomworth C D
A
B
C
D
Abstract
Water Erosion Prediction Project (WEPP) soil erosion model parameters are rare for cultivated cropping soils in Australia.
Measure WEPP interrill erodibility (Ki) for cropping soils.
Plots were 50% side-slopes of row-crop furrows. Rainfall was applied for 30 min at 107 mm h−1 under a rainfall simulator, then at higher and lower rainfall intensities for 10 or 6 min. Several of these rainfall sequences were performed with drying between (events). Runoff, sediment concentrations and sediment sizes in runoff and the soil surface after rain and sediment settling velocities were measured. Soils were well-aggregated Vertosols and a Dermosol: clay 31–69%, silt ~20%. Settling velocities and undispersed particle size distributions for rainfall wet soil are provided for a range of soils in Supplemental Data, for use by WEPP users.
Runoff during 30 min and 54 mm of rain was 28–44 mm or 50–86% rainfall. Soil losses were 26–61 t ha−1 and sediment concentrations 67–127 g L−1. Infiltration, runoff, sediment concentration and soil losses were sometimes different for soils and events. Gatton and Emerald soils had lower soil losses and Cecilvale, Mywybilla and Narrabri soils had higher soil losses.
Mean Ki for Emerald and Gatton soils were significantly lower, 2 960 000 and 3 209 600 kg.s m−4, respectively. Ki values were not significantly different for the Cecilvale, Narrabri and Mywybilla soils, 3 900 000 kg.s m−4.
WEPP Ki values were like values found for USA cropping on clay soils. Sizes in the soil surface and sediment, and settling velocity distributions, were similar between soils but sediment sizes were finer.
Keywords: cotton furrows, Dermosols, furrow sideslopes, sediment sizes, settling velocities, soil erosion, Vertosols, WEPP.
Introduction
Soil erosion rates are strongly affected by the hill-furrow geometry in furrow irrigated or row-crop fields, particularly by erosion on the furrow side-slopes (Meyer and Harmon 1989). Irrigated cotton (Gossypium hirsutum) in Australia is grown on ~1.1 m wide rows, separated by furrows (or mounds) used for irrigation and wheel traffic. Surface cover other than the crop canopy is rarely retained. Early in the summer growing season, when there is little cover and rainfall erosion is likely, hills are ~0.25 m high, with linear side-slopes (see pre-irrigation furrows in fig. 4 in Carroll et al. 1991). Side-slopes are ~50% slope and 0.45 m long. Planting creates a flat top ~0.1 m wide on the top of the hill, referred to as a ridge in the USA. Slope gradients along the furrows are low (generally <0.1%, or <2% in the Emerald irrigation area, Queensland). Under rainfall, hills are subject to net soil loss and are the source of all sediment, while net deposition occurs in furrows (Silburn and Glanville 2002). Furrow side-slopes produce all sediment eroded by rainfall in furrowed fields on low sloping land (Silburn and Glanville 2002).
Silburn and Glanville (2002) found that large soil losses occurred from the bare side-slopes of the hills (50% slope, e.g. 16 t ha−1), with deposition in the furrows (1% slope, 12–14 t ha−1 deposition) with only 12–24% (2–4 t ha s−1) of eroded sediment transported from the furrows (for a 65 mm storm, Silburn and Glanville 2002). During 6 years of monitoring soil erosion in furrow irrigated fields at Emerald, Queensland, annual average soil losses from furrows were 4–8 t ha−1 on land slopes of 1–1.5%, and 5–10 times less on 0.5% slope (Silburn et al. 1998). Soil losses from tail-drain outlets were like those from furrows. In the Macquarie Valley NSW, soil losses from furrows were 10–12 t ha−1 in a season (measured in two fields), on 0.07% slope (Silburn et al. 1998). Soil losses were greater than for steeper slopes at Emerald because more runoff occurred from the hard-setting Macquarie Valley soils. Thus, erosion rates are high, even though the land slopes are low on the steep side-slopes of the hills. This may eventually reduce on-site productivity by loss the soil organic carbon, and will export sediment (Silburn and Glanville 2002), nutrients (Silburn and Hunter 2009) and pesticides (Müller et al. 2000) to off-site receiving waters.
Silburn and Bosomworth (in press) measured effects of rainfall intensity, slope, cover, slope shape and event sequences on runoff, soil losses and sediment sizes using a rainfall simulator on a fine sandy clay loam (Black Dermosol) from Gatton. This resulted in a method for calculating WEPP Ki. Here, that method was applied for a further four soils from inland Queensland and Northern NSW irrigated cropping areas (from Emerald to Narrabri). That paper showed that the process-based Water Erosion Prediction Project (WEPP) (Nearing et al. 1989; Laflen et al. 1991, 1997), and its slope factor equation, can model erosion on steep side-slopes. WEPP is a cropping systems simulation model and calculates the water balance, crop growth and crop cover, and gives outputs of hydrology and soil erosion. Other models (e.g. RUSLE (Renard et al. 1991, 1997)) would struggle to estimate erosion for such steep slopes.
The WEPP is useful for modelling row-crop fields because it can represent the regular hydraulic geometry of furrow side-slopes, furrows and tail drains in irrigated field1 (Carroll et al. 1995; Connolly et al. 1999, 2001). The WEPP considers interrill areas and rills separately. Only the interrill component needs to be parameterised for furrows with low slopes as no rilling occurs on the short slope length of the hills or in the furrows. Interrill detachment rate D (kg (s.m2)−1) was calculated for each event in the WEPP (Nearing et al. 1989) using:
where Ki is interrill erodibility (106 kg.s m−4), I rainfall intensity (m s−1), R runoff rate (m s−1), Sf slope factor (Eqn 2) and Cf is the interrill cover factor (Eqn 3) (Equation 7.10.5 in Alberts et al. (1995), where:
The ability to model soil losses for the unique case of row-cropped fields would be helpful for planning erosion control practices. However, few data are available for WEPP interrill erodibility (Ki) for cultivated cropping soils in Australia. Yu et al. (2000) tested the WEPP for a pineapple (Ananas comosus) field in subtropical Australia on a coarse sandy soil. The model predicted runoff and soil loss well using calibrated parameters but performed poorly using parameters from WEPP-recommended equations that calculate model parameters from soil properties. Parameters based on soil properties greatly under-estimated runoff and soil loss. Yu et al. (2000) concluded that use of the WEPP outside its USA soil domain requires calibration with local data. Yu and Rosewell (2001) tested WEPP on a clay soil at Gunnedah, Australia, for grain cropping. Effective saturated hydraulic conductivity and soil erodibility were estimated from soil properties and the model worked well without calibration. The WEPP worked well for bare fallow plots with good prediction efficiency (0.97) for event runoff and soil loss. However, it overpredicted runoff and soil loss for annual wheat (Triticum) and for long slopes. Sediment concentration predictions were reasonable, indicating that overprediction of soil loss was caused by overprediction of runoff.
Glanville et al. (1997) used the WEPP to model soil losses for design storm events for furrows between cane rows for five canegrowing soils in coastal Queensland. This demonstrated the importance of differences in soil erodibility on soil conservation specifications. Red Dermosols and Grey Kandosols had high interrill erosion and significant soil losses even on short row lengths, whereas Red Ferrosols and Black Vertosols were stable up to 200 m furrow lengths for moderate channel gradients (2%). Steeper furrow gradients had a large effect on soil loss for all soils for cultivated bare soil, with unacceptable soil loss for furrow gradients of 2% and greater. Retaining cover markedly reduced soil loss. Titmarsh et al. (1994, 1995) measured infiltration, sediment loads and flow hydraulics data for four compaction treatments and one wheat stubble treatment for five soils in coastal Queensland sugarcane (Saccharum officinarum) lands and for two grain cropping soils, and derived the WEPP parameters that were used by Glanville et al. (1997). The WEPP parameter values are provided in Supplemental Material as they have not been published.
Other Australian WEPP applications (reviewed in Silburn and Bosomworth in press), mainly involve modelling mine spoils and soils from coal mines (e.g. Sheridan et al. 2000a, 2000b) and are of limited value for modelling agricultural soils. Most soils used for dryland and irrigated cropping in inland northern New South Wales (NSW) and southern Queensland (Qld) (the area of interest here), are Vertosols and Sodosols, with >50% clay (Biggs AJW, Queensland Department of Resources, pers. comm.). The United States Department of Agriculture (USDA) has WEPP parameters for 33 USA cropping soils (Elliot et al. 1989). Three soils had >50% clay. Pierre soil series with a Ki of 3.33 (106 kg.s m−4) (Huffman et al. 2013), Heiden with 2.0 (53.1% clay) and Frederick with 2.43 (58.3% clay) (Elliot and Flanagan 2023). Flanagan and Livingston (1995) give a mean Ki for clay soils in the USA of 2.15 (106 kg.s m−4). However, USA soils are different to the soils in the area of interest, as they usually contain high silt, whereas soils in the area of interest have low or moderate silt. Therefore, more WEPP parameters are needed for Australian cultivated soils to assist with soil conservation planning for row-crop situations.
A method was developed for measuring the WEPP interrill erodibility (Ki) value on one soil (Gatton silt loam) in a previous paper (Silburn and Bosomworth in press) and applied here to a further four soils. The aim was to measure WEPP interrill erodibility (Ki) for five cropping soils, a fine sandy clay loam Dermosol and four Vertosols with clay contents ranging 31–69%. Using a laboratory rainfall simulator and a section of row-crop furrow with steep furrow side-slopes, a sequence of rainfall intensities was applied generating a range of runoff and sediment detachment rates. Runoff rates, sediment concentrations and soil losses, and undispersed particle sizes in runoff and in the soil surface after rainfall and their settling velocities, were measured. WEPP interrill erodibility (Ki) values were calculated. Settling velocities and particle sizes in rainfall wet soils were measured for the five soils and a wide range of other soils (see Supplemental Material).
Methods
Experimental design
The soils were taken from cultivated cotton fields at Emerald, in the central Highlands (Fitzroy Basin), the floodplain of the Condamine (Cecilvale and Mywybilla), Gatton in the Lockyer Valley and Narrabri in inland northern NSW. All soils were on low sloping alluvial flood plains; however, at Emerald the soil was formed on Basalt. Emerald has a humid subtropical climate with warm to hot summers and mild, dry winters. Dalby has a humid subtropical climate and is hotter and less humid in summer and colder and drier in winter than locations east of the Great Dividing Range. Gatton has a sub-humid and subtropical with long hot summers, and short, mild to cold winters. Narrabri has a semi-arid climate and is warm and temperate. The soils are Vertosols except at Gatton where the soil is a Dermosol, as described in Table 1. A 30-min storm of 105 mm h−1 has a 1:20 year average exceedance probability (AEP) at Emerald in central Queensland, while a 10-min storm at 105 mm h−1 has a 1:2 year AEP. Large storms were applied because they cause most soil loss in the region. For example, Wockner and Freebairn (1991) found 70% of soil loss over 14 years resulted from only six of the 81 erosion events that occurred.
| Soil | Coarse sand (%) | Fine sand (%) | Silt (%) | Clay (%) | Organic carbon (%) | CEC (cmol(+) kg−1) (CEC/clay ratio) | Moisture content ~air dry (g g−1) | Texture | Australian soil classification (ASC) A | |
|---|---|---|---|---|---|---|---|---|---|---|
| Cecilvale | 2 | 29 | 23 | 47 | 1.3 | 31 (0.66) | 5.5 | Clay | Grey vertosol | |
| Emerald | 2.4 | 24 | 17.5 | 58 | 1.4 | 55 (0.95) | 9.7 | Clay | Black vertosol | |
| Gatton UQ | 2 | 45 | 20 | 31 | 1.9 | 39 (1.26) | 2.7 | Fine sandy clay loam | Black dermosol | |
| Mywybilla | 2 | 12 | 18 | 69 | 1.3 | 60 (0.87) | 5.5 | Clay | Black vertosol | |
| Narrabri Auscott | 4 | 18 | 19 | 60 | 0.8 | 43 (0.72) | 7.8 | Clay | Black or brown vertosol |
Runoff, soil losses and sediment sizes in runoff from furrow side-slopes were measured under a rainfall simulator. All plots were bare and had a 50% linear slope like the side-slopes of newly made irrigated cotton furrows (Carroll et al. 1991; Silburn and Glanville 2002). Rainfall events with drying in between were studied. Within events, a sequence of rainfall intensities (107, 50, 75, 121, 107 mm h−1) were applied to generate a range of runoff and sediment detachment rates. The first intensity was applied for 30 min and the others for 6 or 10 min. Hereafter, these are referred to as multi-intensity plots.
Laboratory furrow plot
To sample runoff and sediment from furrow side-slopes, soil was placed in trays 0.7 m wide (along the furrow), 0.15 m deep and 0.55 m long (slope length) with a linear 50% slope (see the photograph in Silburn and Bosomworth in press). The two side-slopes faced each other so they shared rain splash as occurs in the field. Runoff and sediment samples were taken from a metal gutter inserted between the slopes. The gutter left 0.1 m of soil on each end, up the slope, to further enhance splash sharing. Walls bounded the runoff source area (0.275 m2).
Soils
Soils were taken from the loose, tilled layer (~0.1 m) to obtain a representative sample. Soil properties are given in Table 1. Clods >25 mm were removed, and the soil air-dried. Soils had moisture contents before rainfall of 7.8, 12.4, 7.3, 8.7 and 14 g g−1 for Cecilvale, Emerald, Gatton, Mywybilla and Narrabri soils, respectively. Cecilvale is a Grey Vertosol (Isbell 2002), with a crusty surface, formed on alluvium. Emerald soil is a Black Vertosol formed on Basalt (McDonald and Baker 1986), a dark cracking clay, from 4 km west of Emerald, at the rainfall simulation site of Silburn and Glanville (2002). Gatton soil is an alluvial clay loam from the levee of Lockyer Creek, University of Queensland, Gatton College farm, a Lockyer soil profile class (Powell 1982), a Black Dermosol, with a crusty surface. Mywybilla is a Black Vertosol formed on alluvium. Narrabri soil is a Black or Brown Vertosol formed on alluvium (David McKenzie, pers. comm.) sampled from Field 21, ‘Auscott’ Narrabri. Cecilvale and Mywybilla soils were sampled on the Condamine Plain between Oakey and Dalby. Apart from the Gatton soil, all soils are strongly self-mulching and strongly cracking, as indicated by their lower CEC to clay ratio (Table 1). All of the Vertosols are Vertisols and the Dermosol is a Haplic Phaeozem (Pantoclayic, Humic) (IUSS Working Group WRB 2022).
Rainfall simulator
Simulated rainfall was applied at intensities of 105–110 mm h−1 using rainwater which had low electrical conductivity (~30 μS cm−1). Water of low electrical conductivity was found by Smith et al. (1992) to have little impact on aggregate stability. The rainfall simulator used two in-line oscillating flat fan Veejet 80100 nozzles and is described by Loch et al. (2001). Rainfall kinetic energy was ~29.5 J (m−2 mm−1) (Duncan 1972), consistent with average energy of natural rain in Eastern Australia at intensities >40 mm h−1 (Rosewell 1986; Kinnell 1987). To ensure accurate average rainfall intensity, rainfall intensity was calibrated for each intensity used.
Runoff and sediment measurements
Runoff rate and sediment concentration were measured every 1–2 min, from the two side-slopes separately. Runoff rate was measure by weighing the sample and subtracting the sediment mass. Sediment concentrations were measured by drying the sample at 105°C and weighing the dry sediment and dividing the sediment mass by the total runoff mass less the sediment mass.
Sediment size and settling velocity measurements
Undispersed silt, clay and larger sediment in runoff were measured for four to six samples taken during the steady state period of runoff, as shown in Fig. 1 in Silburn and Bosomworth (in press). Larger sediments were measured using wet sieving (Loch and Donnollan 1983) and silt and clay were measured using pipette sampling (Coventry and Fett 1979). These methods are described by Silburn and Bosomworth (in press). Sizes larger than silt were measured for the wet soil surface after rainfall for 85% of plots and for sediment for 60% plots. Silt, clay, wet sieving and settling velocity distribution of particles in the rainfall wet soil surface (~0–4 mm depth) of ‘flat plots’ was also measured (details described by Loch 1994), by rainfall wetting soil for 20 min at 100 mm h−1 and taking eight samples. These plots were slightly mounded to facilitate surface drainage but had low surface slopes. Flat plots were not used to estimate Ki values. Settling velocities were measured using a top entry settling column (Loch and Rosewell 1992). Surface soil and undispersed sediment sizes classes were grouped as coarse (>5–0.25 mm), medium (0.25–0.02 mm) and fine (suspended) (<0.02 mm) to represent the rolling and saltating bedload, and suspended loads, respectively (Loch and Donnollan 1983). Undispersed silt and clay in surface soil and sediment are reported as Silt and clay.
Equation tested and erodibility calculation
Erodibility was determined by two methods. Firstly, Ki was calculated by solving Eqn 1 for Ki (Nearing et al. 1989) where all other inputs were measured. Then, the WEPP was set up for the plot conditions and infiltration values (Ke) were adjusted until the result was <±2% of the measured infiltration volume. Then, Ki was adjusted to fit measured soil losses for each event, to within ±5% difference. Silburn and Bosomworth (in press) found Ki by the two methods were the same for 22 out of 24 events. Thus, values calculated using Eqn 1 were used here.
Statistical analysis
Two-way ANOVA was used to test for effects of treatment (soil) and event number for each observed and calculated variable (total infiltration amount, infiltration rate, runoff rate, total runoff amount, soil loss, sediment detachment rate, sediment concentration and WEPP Ki). Genstat ver. 22.1.0.167 was used to perform the ANOVA with a post hoc Bonferroni test at a significance level of 0.05% to determine significant difference between means. Given the unbalanced number of events and replicates across each soil type, and some missing values, the main effects of soil and event were tested on low degrees of freedom. Simple linear regression with a confidence interval of 95% was applied to regression equations.
Results and discussion
Runoff and erosion
Depth of wetting never reached the bottom of the soil and was typically 0.065–0.075 m; wetting reaching the bottom of the soil would change the hydrology. Runoff and infiltration rates are given for the period of steady runoff rate after the rise in runoff rate. Data for a typical rainfall event were shown in Silburn and Bosomworth (in press). Runoff started 4–7 min after rain started and increased rapidly. Sediment concentrations peaked early and declined steadily while sediment detachment rate declined more slowly. Erosion was interrill erosion except where small rills occurred for some Mywybilla plots. Runoff was 25.8 mm (Emerald), 25.2 mm (Gatton), 31.0 mm (Mywybilla), 37.5 mm (Cecilvale) and 44.5 mm (Narrabri) or 44–87% of rainfall during first events (Table 2). Runoff amounts were statistically significantly different between soils (P < 0.001) and between event number (P < 0.001). Somewhat higher runoff was expected for the second event due to a surface sealing formed by the previous event. This occurred for three of the soils (Emerald, Gatton, Mywybilla), that is the soils with lower runoff. However, for the higher runoff soils (Cecilvale and Narrabri), runoff was greater for the first event. This could be because the high runoff rates, high slope and high rainfall intensity caused high soil loss and eroded the surface seal. Soil loss could also decrease due to a reduction in readily detachable material sometimes called ‘armouring’, where more stable clods or aggregates are left on eroding surfaces. Visual indications were that the eroded soil surface was sealed solid and smooth and was eroding at a lower rate.
| Soil | Event no. | Runoff (mm) | Runoff rate (mm h−1) | Final infiltration rate (mm h−1) | Soil loss (t ha−1) | Sediment concentration (g L−1) | No. of plots A | |
|---|---|---|---|---|---|---|---|---|
| Cecilvale | 1 | 37.5 (±0.58) n.s. B | 90.1 (±2.03)b | 16.9 (±2.03)a | 45.8 (±0.59)c | 106.2 (±0.79)b | 4 | |
| 2 | 36.0 (±0.50) n.s. | 84.0 (±2.79)a | 23.0 (±2.79)a | 42.9 (±0.78)c | 108.0 ± (0.91)b | 4 | ||
| Emerald | 1 | 25.8 (±0.57)a | 74.0 (±2.50)a | 33.0 (±2.50)b | 17.4 (±1.16)a | 66.9 (±2.02) n.s. | 4 | |
| 2 | 28.1 (±2.25) n.s. | 70.8 (±4.92) n.s. | 28.6 (±6.12)b | 34.5 (±5.86)b | 90.0 (±10.6)a | 5 | ||
| 3 | 34.8 (n.a. C) n.s. | 85.7 (n.a.)b | 22.3 (n.a.)a | 53.5 D(n.a.)c | 65.1 (n.a.) n.s. | 1 | ||
| Gatton UQ | 1 | 25.2 (±0.51)a | 72.5 (±0.11)a | 34.1 ± (0.22)b | 17.9 (±1.45)a | 71.9 (±1.98) n.s. | 3 | |
| 2 | 29.9 (n.a.) n.s. | 74.2 (n.a.)a | 31.8 (n.a.)a | 29.3 (n.a.) n.s. | 97.2 (n.a.)a | 1 | ||
| Mywybilla | 1 | 31.0 (±1.33) n.s. | 85.5 (±3.24)a | 22.3 (±3.10)a | 33.1 (±3.41)b | 83.8 ± (4.30) n.s. | 8 | |
| 2 | 33.7 (±1.88) n.s. | 81.1 (±3.99)a | 26.3 (±3.25)a | 42.2 (±2.47)c | 110.8 (±8.67) n.s. | 6 | ||
| 3 | 43.4 (±0.26)b | 101.9 (±1.10)c | 8.9 (±1.03)a | 36.0 (±1.65) n.s. | 77.8 (±3.18) n.s. | 2 | ||
| Narrabri | 1 | 44.5 (±1.71) n.s. | 110.9 (±4.86) n.s. | 5.6 (±5.48)c | 59.5 (±4.75) n.s. | 106.0 (±1.39)b | 4 | |
| 2 | 42.2 (±5.86)b | 101.0 (±14.7)c | 10.0 (±14.71)a | 51.8 (±7.35)c | 104.5 (±0.12)a | 2 |
Rainfall intensity was 105–110 mm h−1, rainfall 52–56 mm, slope 50%, bare, linear 0.5 m slopes. Within columns, means followed by the same letter are not significantly different at P = 0.05 by ANOVA post hoc tests and are representative of interaction between soil and event number.
Runoff rates were statistically significant between soils (P < 0.001) and between event number (P = 0.006). Runoff rates were somewhat greater for the first events compared to second events for all soils except Gatton which had low soil loss (Table 2), again indicating erosion of the surface seal. When a third event was applied for the Mywybilla and Emerald soil, runoff rate was higher, infiltration rates lower and in the case of the Mywybilla soil, soil loss was less than for the second event, indicating surface sealing became more severe.
Total infiltration amounts and final infiltration rates were statistically significant between soils (P < 0.001) but not between event number (P = 0.07) (Table 2). Final infiltration rates were lowest for Cecilvale and Mywybilla and higher for Gatton and Emerald soils for all events. The Narrabri soil had runoff rates greater than the rainfall rate (105 mm h−1) for the first event indicating an error; however, it is true that this soil had a high runoff rate and the lowest final infiltration rate of the soils studied.
Soil losses were significantly different between soils (P < 0.001) and between event number (P = 0.02) (Table 2). Soil loss was highest for Narrabri soil (59.5 t ha−1), followed by Cecilvale (45.8 t ha−1) and Mywybilla (42.2 t ha−1), and lowest for Emerald (34.5 t ha−1) and Gatton (29.3 t ha−1) (Table 2), which corresponded with the order of runoff amounts. Sediment concentrations were statistically significant between soils (P < 0.001) but not for event number (Table 2). Sediment concentrations were highest for the Cecilvale, Mywybilla and Narrabri and lower for Gatton and Emerald, except for the second event at Emerald which had a higher sediment concentration. This resulted from a smaller soil loss in a moderate amount of runoff. Sediment detachment rates were statistically significant between soils and event number (data not shown).
Sediment detachment rate and WEPP interrill erodibility (Ki)
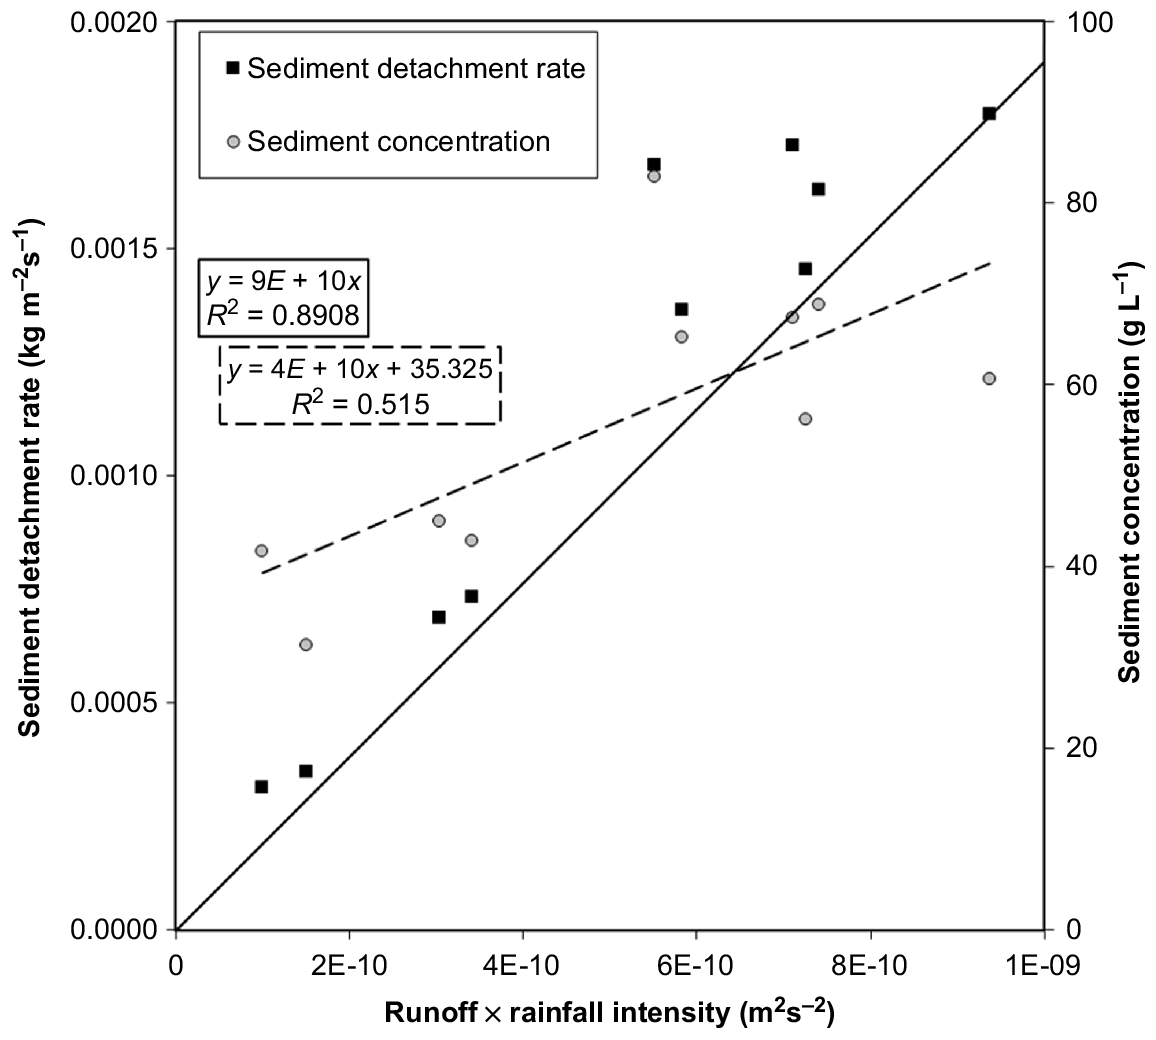
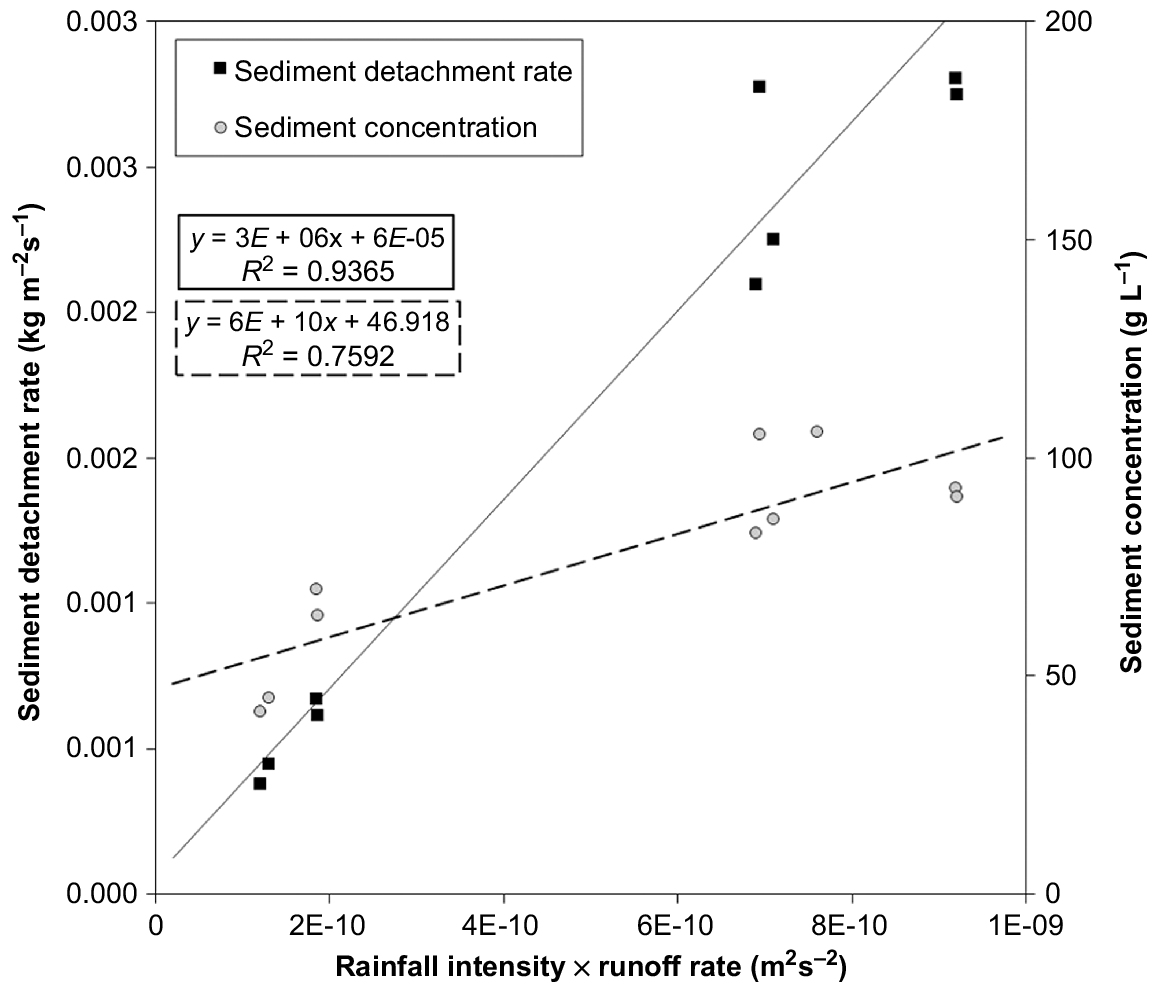
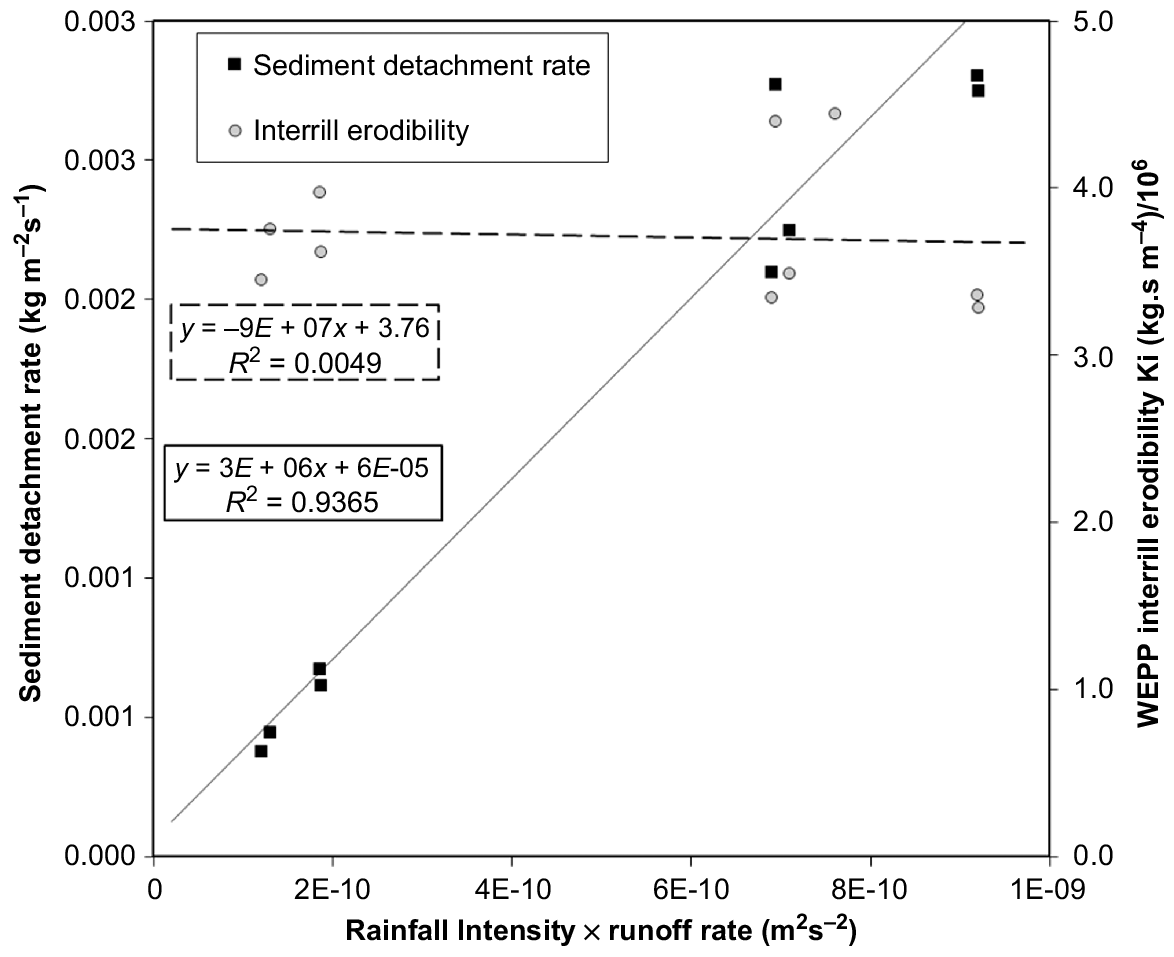
Typical data for Cecilvale, Mywybilla (high soil losses) and Emerald (low soil loss) soils are presented (data for Gatton soil are given in Silburn and Bosomworth (in press)). Sediment detachment rates and sediment concentrations have good relationships with the product of rainfall intensity and runoff rate (Figs 1, 2, and 3). The initial 30-min event often had a slightly higher sediment detachment rate than the other intensities. Table 2 shows both increasing and decreasing soil losses for later events. A reduction in soil loss for later events is probably caused by surface sealing and consolidation, as occurs within the first event itself; see Fig. 2 in Silburn and Bosomworth (in press). An increase in soil loss for later events is probably caused by more severe surface sealing with repeated rainfall events and possibly the plots becoming slightly steeper as they erode.
Sediment detachment rates and sediment concentrations Cecilvale soil. P = 0.02 for sediment concentration and P < 0.001 for sediment detachment rate.
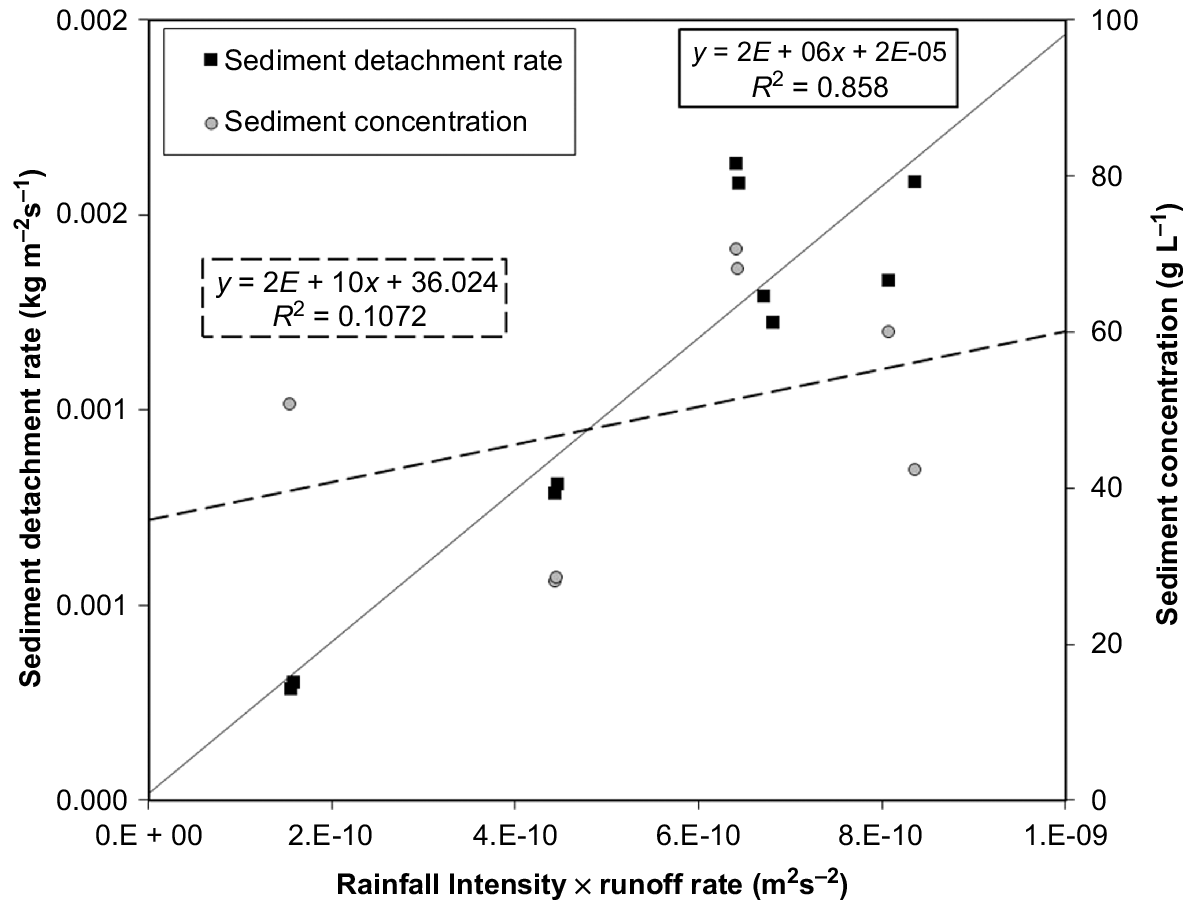
Sediment detachment rate and sediment concentration for Emerald soil. P = 0.027 for sediment concentration and P < 0.001 for sediment detachment rate.
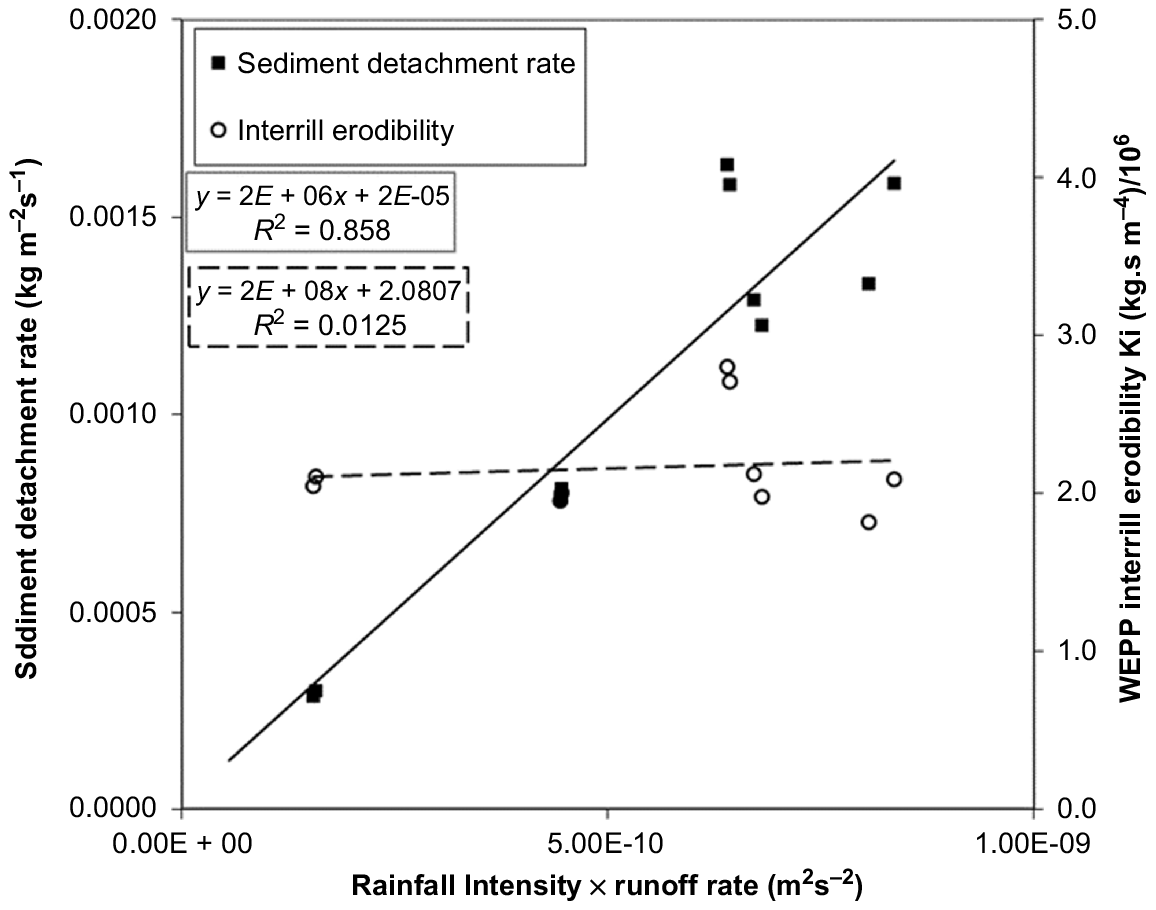
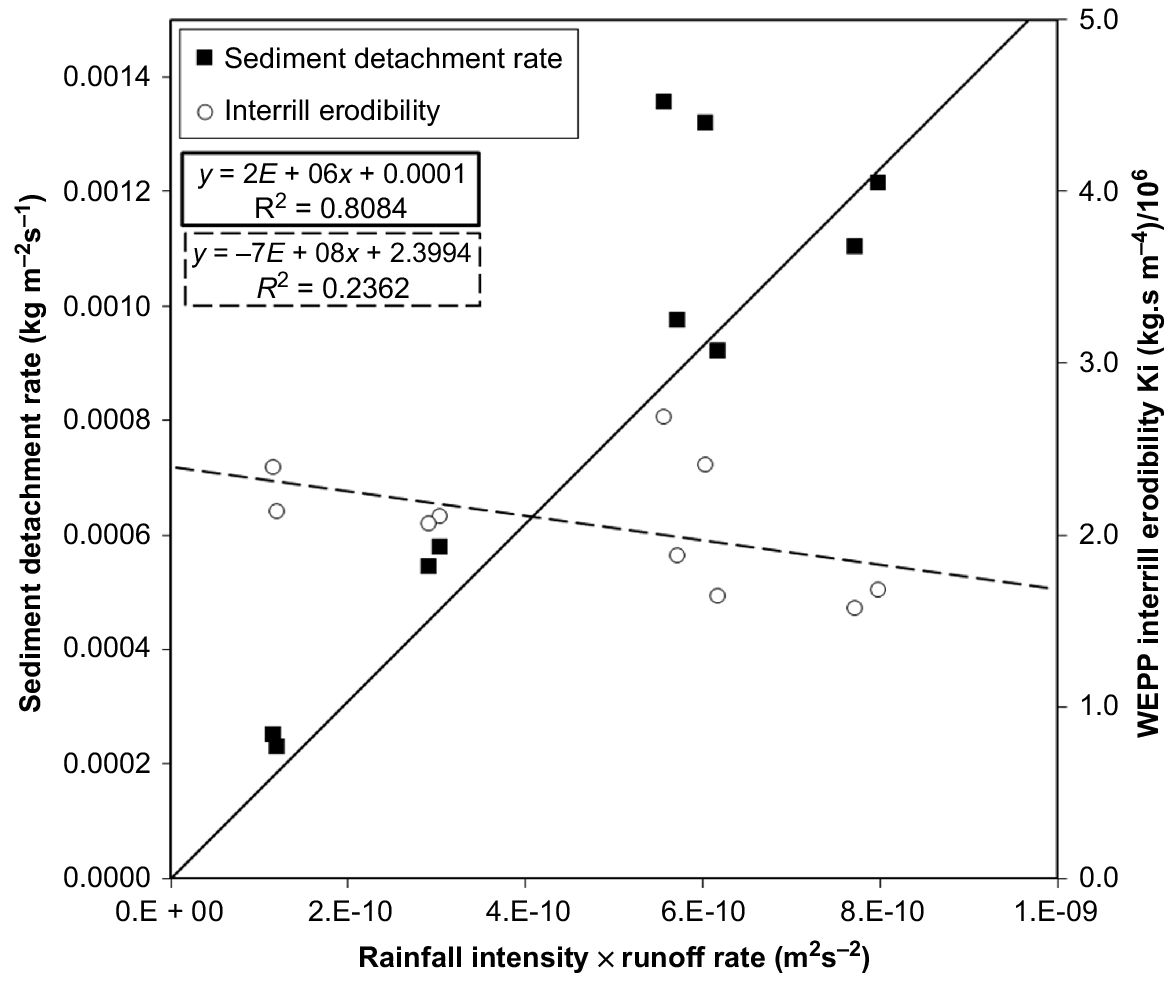
Typically, WEPP Ki does not vary with the product of rainfall intensity and runoff rate (Figs 4 and 5). However, data in Fig. 6 indicates that sometimes it did. When Ki was regressed against time for these data, Ki declined by 30% over 60 min of rainfall and had a strong relationship with time (Ki = −0.0276 time + 3.375; R2 = 0.815).
Sediment detachment rate for the Emerald soil during a sequence of five rainfall intensities and WEPP interrill erodibility (Ki). Higher detachment rates and Ki values were for the first 30-min rain. P = 0.758 for Ki and P < 0.001 for sediment detachment rate.
Sediment detachment rate for the Cecilvale soil during a sequence of five rainfall intensities and WEPP interrill erodibility (Ki). Higher sediment detachment rates and Ki values were for the first 30-min rain. P = 0.848 for Ki and P < 0.001 for sediment detachment rate.
Sediment detachment rate and WEPP interrill erodibility for Emerald soil for a first 30-min rainfall event and then various intensities for 10- or 6-min periods. These data have the highest variability and a possible effect of rainfall intensity × runoff rate on Ki; this did not happen for other Emerald plots; see Fig. 4. P = 0.184 for Ki and P < 0.001 for sediment detachment rate.
WEPP Ki values were lower for multi-intensity data then for the 30-min events, except for two Mywybilla plots (Table 3), because sediment detachment rates were typically higher for the 30-min data. Ki values were lower for Emerald and Gatton soil than for the other soils for first events (Table 4). The Narrabri soil had the highest Ki for first events, followed by Cecilvale and then Mywybilla. Ki values were typically higher for the second events than for first events, except for Narrabri. Event number was significantly different (P < 0.001). For second events, Ki values were similar for all soils with a mean of 4 200 000 kg.s m−4 and a low coefficient of variation of 6.7% (Table 4). For the third event on Mywybilla soil, Ki was lower than for previous events (Table 4), possibly because soil loss from three large events reduced the plots’ slopes and because the surface seal was more eroded. Variance for the initial 30-min plots was low and was higher for multi-intensity plots, typically 10–20%.
| Soil | Plot and event no. | WEPP Ki single 30-min event (kg.s m−4) | Coefficient of variation (%) | WEPP Ki multi-intensity (kg.s m−4) | Coefficient of variation (%) | Silt and clay (%) | |
|---|---|---|---|---|---|---|---|
| Cecilvale | 1 1 | 4 421 800 n.s. A | 1.0 | 3 712 000 | 11.5 | 20 n.s. | |
| 1 2 | 4 472 900d | 2.0 | 3 767 000 | 14.0 | 21e | ||
| 2 1 | 4 343 800 n.s. | 0.5 | 3 778 600 | 9.7 | 18d | ||
| 2 2 | 4 535 700d | 1.0 | 3 647 000 | 14.0 | 18d | ||
| Emerald | 1 1 | 2 349 000 n.s. | n.a. B | Not run | 7a | ||
| 1 2 | 3 934 000 n.s. | n.a. B | Not run | 8a | |||
| 1 3 | 4 622 000 n.s. | n.a. B | Not run | 11b | |||
| 2 1 | 2 551 000 n.s. | 7.7 | 2 060 000 | 17.9 | 14c | ||
| 2 2 | 3 596 000b | 4.7 | 3 005 600 | 23.5 | 11 n.s. | ||
| 3 1 | 2 756 000 n.s. | 2.6 | 2 163 000 | 15.0 | 12b | ||
| 3 2 | 4 667 000 n.s. | 1.8 | 3 500 000 | 19.3 | 13 n.s. | ||
| Gatton | 1 1 | 2 321 500 n.s. | 2.2 | Not run | 22f | ||
| 1 2 | 3 700 000 n.s. | 6.7 | Not run | 18d | |||
| 2 1 | 3 018 000a | n.a. B | 2 677 000 | 8.5 | 21 n.s. | ||
| 2 2 | 4 006 000 n.s. | n.a. B | 3 442 000 | 10.3 | 20 n.s. | ||
| 3 1 | 2 811 000 n.s. | 3.8 | 2 301 000 | 14.1 | 15 n.s. | ||
| Mywybilla | 1 1 | 3 551 000b | 0.6 | Not run | 14c | ||
| 1 2 | 3 298 000 n.s. | 0.4 | Not run | 18d | |||
| 1 3 | 3 058 600a | 6.2 | Not run | 23 n.s. | |||
| 2 1 | 3 955 000c | 11.5 | Not run | Deep rills C | 17 n.s. | ||
| 2 2 | 3 012 000a | 16.0 | 4 637 000 | 0.9 | 20e | ||
| 3 1 | 5 247 000 n.s. | 5.2 | 4 214 000 | 16.1 | 16 n.s. | ||
| 4 1 | 3 029 000a | 17.7 | 2 776 000 | 14.1 | 21 n.s. | ||
| 4 2 | 5 522 000 n.s. | 2.9 | 4 076 000 | 19.7 | 15 n.s. | ||
| Narrabri | 1 1 | 4 620 000d | 8.8 | 4 301 600 | 10.0 | 22f | |
| 1 2 | 3 889 000 n.s. | 8.5 | 3 346 457 | 9.8 | Lost | ||
| 2 1 | 4 897 450 n.s. | 3.9 | Not run D | ||||
| 2 2 | 3 983 200c | 3.9 | Not run |
Within columns, means followed by the same letter are not significantly different at P = 0.05 by ANOVA and represents the interaction between soil and event number for WEPP Ki and Silt and clay.
| Soil | Plot and event no. | Clay (%) | Silt (%) | Silt and clay (%) | Fines (%) | Medium (%) | Coarse (%) | |
|---|---|---|---|---|---|---|---|---|
| Cecilvale | 1 | 1.9ab | 10.4 n.s. A | 12.3a | 32.4b | 35.1a | 32.4a | |
| 2 | 2.1ab | 9.7a | 11.8a | 30.6b | 35.2b | 34.2a | ||
| Emerald | 1 | 1.4a | 3.9 n.s. | 5.4a | 20.8 n.s. | 41.0c | 40.9a | |
| 2 | 1.7a | 4.6 n.s. | 6.3a | 24.3b | 46.9 n.s. | 33.4a | ||
| 3 | 1.8ab | 2.3 n.s. | 4.1a | 20.8a | 43.6c | 45.3a | ||
| Gatton UQ | 1 | 1.4a | 8.4a | 9.8a | 34.8 n.s. | 26.9 n.s. | 49.2a | |
| 2 | 2.9ab | 8.1a | 11.0a | 31.1b | 32.0a | 45.3a | ||
| Mywybilla | 1 | 4.2ab | 6.0a | 10.2a | 24.2b | 37.6c | 38.2a | |
| 2 | 2.1ab | 7.9a | 10.1a | 26.2b | 37.3b | 36.6a | ||
| 3 | 7.6b | 4.2 n.s. | 11.8a | 22.6b | 38.6b | 38.7a | ||
| Narrabri | 1 | 4.7ab | 7.6a | 12.3a | 22.9b | 31.4a | 45.7a | |
| 2 | n.d. | n.d. | n.d. | 20.5a | 29.7a | 49.8a |
Recommended Ki values
Ki values from the multi-intensity plots are preferred because they were based on more data. However, there are fewer of these values than for 30-min events. Also, 30-min Ki values are slightly higher and using them is conservative. Recommended values are therefore based on Ki values from multi-intensity plots; however, a user can choose which value they prefer. The mean Ki for Emerald and Gatton were significantly lower at 2 960 000 and 3 209 600 kg.s m−4, respectively (Table 3). Ki values were not significantly different for the Cecilvale, Narrabri and Mywybilla soils, with a Ki mean of 3 900 000 kg.s m−4.
Particle sizes in the soil surface and sediment
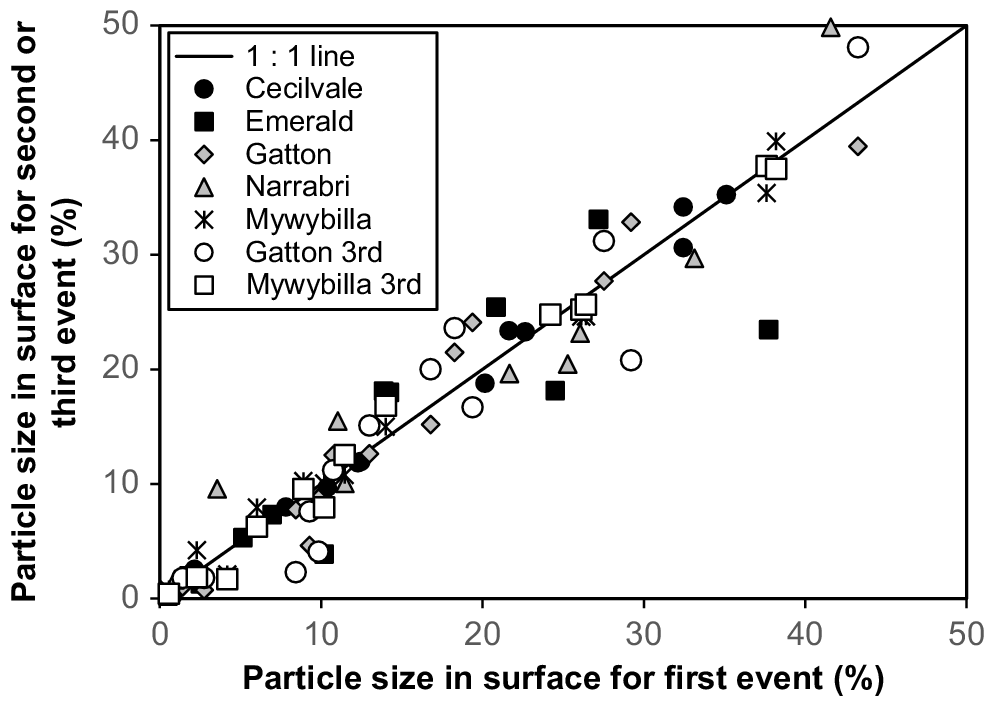
The soil surface after rain had similar particle sizes for the first, second and third events (Fig. 7). Particle size data for one Emerald plot were different to other Emerald plots for both the sediment and soil surface. These were the first plots run and were run by less experienced operators and were excluded. The soil surface after rain was similar for all soils except Emerald. Emerald soil had 7% (±41%) silt and clay, 23 (±14%) fines, 46% (±15%) medium and 31% (±33%) coarse-sized sediment. The other soils had 11% (±12%) silt and clay, 28% (±22%) fines, 33% (±15%) medium and 41% (±14%) coarse-sized sediment. Thus, the other soils were somewhat finer. Particle sizes in the soil surface after rain for the first, second and third rainfall events averaged for each soil are given in Table 4. Particle sizes are almost all not significant between soils and event numbers. The only exceptions are that the Emerald soil has more medium sized sediment and Mywybilla soil had more clay sized sediment. That is, Emerald soil was slightly coarser than other soils, with total medium and coarse-sized particles of 74.5% compared to 72% for the other soils. So, the five soils had remarkably similar particle sizes in the soil surface.
Particle sizes in the soil surface after rain for first compared to second and third rainfall events. Gatton 3rd and Mywybilla 3rd refer to the third rainfall event applied to these soils.
On ‘flat plots’ after 20 min of rain, the soil surface (~0–4 mm) contained ~10% silt and clay, 18% fines, 25% medium and 45% coarse particles, compared with 10%, 20%, 30% and 42% for the soil surface after rain on steep side slopes, respectively. This is remarkably similar considering that almost no erosion occurs on ‘flat plots’ while 17–60 t ha−1 of soil loss occurred on the steep furrow side-slopes.
The percentage of silt and clay-sized sediment in runoff were not significantly different for all soils, at around 10% (Table 4). Silt and clay-sized sediment was comprised on average of 3% (±36%) clay and 6.6% (±33%) silt. Thus, there is little free clay-sized sediment. Given the soils had 31% (Gatton) and 47–69% dispersed clay (Vertosols) (Table 1), this indicates these soils are highly aggregated and erode as aggregates.
Total fines averaged 26% (±22%), medium-sized sediment 36% (±16%) and coarse sediment 41% (±65%). Sediment sizes were similar for all soils except Emerald, which had 22% (±14%) fines, 44% (±12%) medium and 40% (±81%) coarse-sized sediment. Emerald sediment sizes were also more variable than the other soils. When Emerald is excluded, the other soils had 11.2% (±11%) silt and clay, 27.3% (±8%) fines, 33.8% (±8%) medium and 41% (±28%) coarse-sized sediment with low variability.
Eroded sediment had more silt and clay (24%), fines (53%) and medium sized-particles (47%), compared to the soil surface (10%, 26% and 36%), and much less coarse-sized particles (11% compared to 41%). Thus, sediment was much finer than the soil surface after rain and larger particles were left behind.
Settling velocities measured on ‘flat’ plots’
Settling velocity distributions for the soil surface after 20 min of rainfall on the ‘flat plots’ are given in Table 5. Settling velocities were not different between the soils (P < 0.01) except for the 0.25 cm s−1 size class. Cecilvale had more than sediment other soils in the 0.25 cm s−1 class. Emerald had coarser wet aggregates than the other soils and this is reflected in the settling velocities, with the highest in the 3.43 and 7.58 cm s−1 classes and the least in the 0.25 cm s−1 class. Gatton soil had the least sediment in the 3.43 and 7.58 cm s−1 classes. Gatton, Mywybilla and Narrabri have similar settling velocity distributions. Overall, the settling velocities are similar for all soils.
| Cumulative settling velocity (cm s−1) % slower than | |||||||
|---|---|---|---|---|---|---|---|
| Soil | 0.25 | 0.94 | 3.43 | 7.58 | 15.17 | 26 | |
| Cecilvale | 23.2 (±0.62)b | 35.0 (±0.60) n.s. A | 60.2 (±0.70) n.s. | 88.2 (±1.36)a | 99.2 (±0.28)a | 100. (±0.05)a | |
| Emerald | 15.7 (±1.13)a | 28.0 (±1.60)a | 63.4 (±1.79) n.s. | 95.3 (±1.49) n.s. | 99.8 (±0.19)a | 100. (±0.00)a | |
| Gatton | 20.4 (±1.93)c | 32.4 (±2.52) n.s. | 53.6 (±3.10)a | 73.3 (±3.55) n.s. | 95.6 (±1.44)a | 99.9 (±0.10)a | |
| Mywybilla | 19.3 (±0.71)c | 27.7 (±0.72) n.s. | 52.3 (±0.92)a | 85.2 (±1.85)a | 99.6 (±0.25)a | 99.7 (±0.27)a | |
| Narrabri Auscott event 1 | 18.9 (±1.97)c | 31.0 (±1.56)a | 55.1 (±0.91) n.s. | 85.5 (±1.56)a | 99.0 (±0.70)a | 99.6 (±0.39)a | |
| Narrabri Auscott event 2 | 15.8 (±1.17)a | 24.8 (±1.52) n.s. | 48.8 (±2.05) n.s. | 79.4 (±2.90) n.s. | 97.4 (±1.37)a | 99.1 (±0.85)a | |
The WEPP Ki values were derived from first and second rainfall events with the soil dried in between, with five rainfall intensities applied in a sequence within each event. Ki values were not significantly different for Cecilvale, Gatton, Narrabri and Mywybilla soils and a Ki value of 3 900 000 (kg.s m−4) can be used. The mean Ki for Emerald and Gatton were significantly lower at 2 960 000 and 3 209 600 kg.s m−4, respectively (Table 3). Ki values for 33 USA soils (Elliot et al. 1989) varied from just below 1 000 000 to around 4 000 000 (kg.s m−4). Thus, the Australian soils have medium or high interrill erodibility. Ki values for USA clay soils (Huffman et al. 2013; Elliot and Flanagan 2023) were similar to those found here.
The soils had similar particle sizes in the soil surface after rain for the first, second and third events, and for the five soils, except the Emerald soil which was coarser. Even then it was not greatly different. Particle sizes in the surface of the ‘flat plots’ after 20 min of rain were also remarkably like those in the soil surface after rain. Sediment sizes in runoff were similar for all soils except Emerald. Sediment was finer than the soil surface after rain and larger particles were left on the soil surface. Sediment settling velocities are not greatly different between the soils. Thus, there was a large amount of consistency in particle sizes in the soil surface after rain and in the sediment in runoff between soils.
Meyer et al. (1980) found the sediment size distribution changed relatively little with major changes in rain intensity, continued erosion, and presence or absence of a crop canopy for each soil, like the small effects found by Silburn and Bosomworth (in press). Bosomworth et al. (2018) found that differences in sediment sizes distributions between soils with >20% clay were marginal under simulated rainfall conditions on grazing bare scaled hillslopes, when a very sandy Sodosol was excluded. Meyer et al. (1980) stated that the size distribution of sediment from row-side slopes was a distinct characteristic of a given soil. Results here and in Silburn and Bosomworth (in press) support this hypothesis. Results here indicate this carries over into results for sediment settling velocities in runoff.
Conclusions
The aim of this work was to measure WEPP interrill erodibility (Ki) for five cropping soils. A method for measuring WEPP erodibility Ki values developed on one soil in a previous study was applied here to a further four soils. The soils were well-aggregated Vertosols and a Dermosol, with clay contents ranging 31–69% and silt of ~20%. Ki values were not significantly different for Cecilvale, Narrabri and Mywybilla soils and a Ki value of 3 900 000 (kg.s m−4) can be used. The mean Ki for Emerald and Gatton were significantly lower at 2 960 000 and 3 209 600 kg.s m−4, respectively. Emerald soil had slightly coarser particle sizes in the soil surface. The soils had similar particle sizes in the soil surface after rain for the first, second or third event applied and on ‘flat plots’ after 20 min of rainfall, for the five soils. One exception was that the Emerald soil was coarser. Sediment sizes in runoff were also similar for all soils except Emerald. Sediments were finer than the soil surface after rain and larger particles were left on the soil surface. Sediment settling velocities were not greatly different between the soils. Thus, there was a large amount of consistency in particle sizes in the soil surface after rain and in the sediment in runoff between soils, consistent with data in the literature. Ki values presented here are some of the few WEPP interrill erodibility values measured for Australian cultivated cropping soils; only two values were available previously. This will be useful in using the WEPP to model improved soil conservation outcomes for row-cropping farming systems in the croplands of Australia.
Declaration of funding
This work was supported by the Queensland Department of Environment and Science, the then Land and Water Resources Research and Development Corporation, the Cotton Research and Development Corporation and the then Murray Darling Basin Commission, who were not involved other than reviewing the initial design and results of the study.
Acknowledgements
Thanks to Irene Jacobson, Kerry Meyers, Jeff Mitchell, Richard Shannon, Adam Anderson, Keith Goodings and Jim Bourke for running the plots and doing the measurements. Assistance of Auscott Ltd. staff at Warren and Narrabri is gratefully acknowledged. David McKenzie (Soil Management Designs, Orange) helpfully provided soils information for Auscott Ltd.’s Warren and Narrabri soils. Statistical analysis was performed by Bronwyn Bosomworth and Craig Thornton (Department of Environment and Science). We thank Dr Bill Elliot (USDA) and Dr Bofu Yu (Griffith University) for reviewing the paper, and two referees for helping improve the manuscript.
References
Alberts EE, Nearing MA, Weltz MA, Risse LM, Pierson BF, Zhang XC, Laflen JR, Simanton JR (1995) Chapter 7: Soil component. In ‘USDA water erosion prediction project. Hillslope watershed model documentation. NSERL Report No. 10’. (Eds DC Flanagan, MA Nearing) pp. 1–47. (USDA-ARS National Soil Erosion Research Laboratory: West Lafayette, Indiana)
Bosomworth B, Silburn DM, Eyles M, Shrestha K (2018) K-factor soil erodibility study on grazing lands: paddock to reef program: rainfall simulation program 2014 to 2018. Report to the Australian and Queensland Government paddock to reef program. Department of Natural Resources Mines, and Energy, Rockhampton.
Carroll C, Halpin M, Bell K, Mollison J (1995) The effect of furrow length on rain and irrigation- induced erosion on a vertisol in Australia. Australian Journal of Soil Research 33, 833-850.
| Crossref | Google Scholar |
Connolly RD, Carroll C, Francis J, Silburn DM, Simpson B, Freebairn DM (1999) A simulation study of erosion in the Emerald Irrigation Area. Australian Journal of Soil Research 37, 479-494.
| Crossref | Google Scholar |
Connolly RD, Kennedy IR, Silburn DM, Simpson BW, Freebairn DM (2001) Simulating endosulfan transport in runoff from cotton fields in Australia with the GLEAMS model. Journal of Environmental Quality 30, 702-713.
| Crossref | Google Scholar | PubMed |
Elliot WJ, Flanagan DC (2023) Estimating WEPP cropland erodibility values from soil properties. Journal of the ASABE 66, 329-351.
| Crossref | Google Scholar |
Huffman RL, Fangmeier DD, Elliot WJ, Workman SR (2013) Soil erosion by water. In ‘Soil sater conservation engineering’. pp. 145–170. (American Society of Agricultural and Biological Engineers: St Josepth, Michigan) doi:10.13031/swce.2013.7
Kinnell PIA (1987) Rainfall energy in eastern Australia – intensity kinetic energy relationships for Canberra, ACT. Australian Journal of Soil Research 25, 547-553.
| Crossref | Google Scholar |
Laflen JM, Lane LJ, Foster GR (1991) WEPP: a new generation of erosion prediction technology. Journal of Soil and Water Conservation 46, 34-38.
| Google Scholar |
Laflen JM, Elliot WJ, Flanagan DC, Meyer CR, Nearing MA (1997) WEPP-Predicting water erosion using a process-based model. Journal of Soil and Water Conservation 52, 96-102.
| Google Scholar |
Loch RJ (1994) A method for measuring aggregate water stability of dryland soils with relevance to surface seal development. Australian Journal of Soil Research 32, 687-700.
| Crossref | Google Scholar |
Loch RJ, Donnollan TE (1983) Field rainfall simulator studies on two clay soils of the Darling Downs, Queensland. II. Aggregate breakdown, sediment properties and soil erodibility. Australian Journal of Soil Research 21, 47-58.
| Crossref | Google Scholar |
Loch RJ, Rosewell CJ (1992) Laboratory methods for measurement of soil erodibilities (K-factors) for the universal soil loss equation. Australian Journal of Soil Research 30, 233-248.
| Crossref | Google Scholar |
Loch RJ, Robotham BG, Zeller L, Masterman N, Orange DN, Bridge BJ, Sheridan G, Bourke JJ (2001) A multi-purpose rainfall simulator for field infiltration and erosion studies. Australian Journal of Soil Research 39, 599-610.
| Crossref | Google Scholar |
Meyer LD, Harmon WC (1989) How row-sideslope length and steepness affect sideslope erosion. Transaction American Society of Agricultural Engineers 32, 639-644.
| Crossref | Google Scholar |
Meyer LD, Harmon WC, McDowell LL (1980) Sediment sizes eroded from crop row sideslopes. Transaction American Society of Agricultural Engineers 23, 891-898.
| Crossref | Google Scholar |
Müller JF, Duquesne S, Ng J, Shaw GR, Krrishnamohan K, Manonmanii K, Hodge M, Eaglesham GK (2000) Pesticides in sediments from Queensland irrigation channels and drains. Marine Pollution Bulletin 41, 294-301.
| Crossref | Google Scholar |
Nearing MA, Foster GR, Lane LJ, Finkner SC (1989) A process-based soil erosion model for USDA-water erosion prediction project technology. Transaction American Society of Agricultural Engineers 32, 1587-1593.
| Crossref | Google Scholar |
Renard KG, Foster GR, Weesies GA, Porter JPI (1991) RUSLE: revised universal soil loss equation. Journal of Soil and Water Conservation 46, 30-33.
| Crossref | Google Scholar |
Rosewell CJ (1986) Rainfall kinetic energy in eastern Australia. Journal of Climate and Applied Meteorology 25, 1695-1701.
| Crossref | Google Scholar |
Sheridan GJ, So HB, Loch RJ, Pocknee C, Walker CM (2000a) Use of laboratory-scale rill and interill erodibility measurements for the prediction of hillslope-scale erosion on rehabilitated coal mine soils and overburdens. Australian Journal of Soil Research 38, 285-298.
| Crossref | Google Scholar |
Sheridan GJ, So HB, Loch RJ, Walker CM (2000b) Estimation of erosion model erodibility parameters from media properties. Australian Journal of Soil Research 38, 265-284.
| Crossref | Google Scholar |
Silburn D, Bosomworth B Soil loss and sediment sizes from steep furrow side-slopes 1. Effects of rainfall intensity, slope steepness, shape, and length, cover and storm sequences. Soil Research in press.
| Google Scholar |
Silburn DM, Glanville SF (2002) Management practices for control of runoff losses from cotton furrows under storm rainfall. I. Runoff and sediment on a black Vertosol. Australian Journal of Soil Research 40, 1-20.
| Crossref | Google Scholar |
Silburn DM, Hunter HM (2009) Management practices for control of runoff losses from cotton furrows under storm rainfall. III. Cover and wheel traffic effects on nutrients (N and P) in runoff from a black Vertosol. Soil Research 47, 221.
| Crossref | Google Scholar |
Silburn DM, Waters DK, Connolly RD, Simpson BW, Kennedy IR (1998) Techniques for stabilising soil erosion on cotton farms. In ‘Occasional Paper 23/98. Minimising the impact of pesticides on the riverine environment: key findings from research with cotton industry, Canberra, Australia’. (Eds NJ Schofield, VE Edge) pp. 23–24. (Land and Water Resources Research and Development Corporation, Cotton Research and Development Corporation, Murray-Darling Basin Commision: Canberra, Australia)
Smith GG, Foley JL, Loch RJ (1992) Effects of electrical conductivity of water used in wetting and in wet sieving on measured aggregate water stability. Soil Technology 5, 177-184.
| Crossref | Google Scholar |
Titmarsh GW, Sallaway MM, Jukes P (1994) Farming systems and design specifications of interrow furrows. In ‘1994 International Conference on Hydraulics in Civil Engineering: “Hydraulics working with the environment”: University of Queensland, Brisbane, 15–17 Feburary 1994’. pp. 205–210. (University of Queensland)
Wockner G, Freebairn DM (1991) Water balance and erosion study on the Eastern Darling Downs - an update. Australian Journal of Soil and Water Conservation 4, 41-47.
| Google Scholar |
Yu B, Rosewell CJ (2001) Evaluation of WEPP for runoff and soil loss prediction at Gunnedah, NSW, Australia. Australian Journal of Soil Research 39, 1131-1145.
| Crossref | Google Scholar |
Yu B, Ciesiolka CAA, Rose CW, Coughlan KJ (2000) A validation test of WEPP to predict runoff and soil loss from a pineapple farm on a sandy soil in subtropical Queensland, Australia. Australian Journal of Soil Research 38, 537-554.
| Crossref | Google Scholar |