

Are fans required for closed chamber N2O measurements in grazed pastures?
Donna L. Giltrap A * , Surinder Saggar A , Peter Berben A and Thilak Palmada A
A
Abstract
Static chambers are the most common method for measuring nitrous oxide (N2O) and other greenhouse gas fluxes from soils in field conditions. However, there are no definitive guidelines on the use of fans to improve the mixing of air within chambers during sampling. In this study, we compared N2O fluxes following the application of a range of urine and nitrification inhibitor treatments to pasture soils using large (0.5 m2 footprint) static chambers both with and without the use of fans. Measurements were taken with and without fans from two experiments, each using a total of 56 chambers. In one of these experiments, the measurements were made at a time of low N2O fluxes, while in the other experiment, measurements were made at a time of high N2O fluxes. Overall, both regression models and non-parametric methods found negligible effect of fan use on N2O measurements, although there could be a slight under-estimation of fluxes measured without fans under low emitting conditions. However, these results might not hold for systems with taller chambers containing more plant biomass or shorter measurement intervals.
Keywords: closed static chamber, fans, flux measurement, greenhouse gas, headspace mixing, nitrous oxide, urine patch.
Introduction
Nitrous oxide (N2O) is a potent, long-lived greenhouse gas. Globally, agriculture is responsible for over half the anthropogenic N2O emissions (Tian et al. 2020). In New Zealand, where grazed pasture is the major agricultural land use, direct emissions from animal excreta account for about 64% of agricultural N2O emissions (Ministry for the Environment 2024).
There are many methods for measuring N2O fluxes from soils including static and dynamic chambers, automated chambers, and eddy covariance methods. Of these, static chambers, a low-cost and simple-to-operate method, has been used in the measurements of trace gas fluxes between the land surface and atmosphere for a century (Lundegårdh 1927). This method involves placing an open-ended chamber onto the soil (sometimes using a pre-installed collar to ensure a good seal between the base of the chamber and the soil surface), then sealing the chamber and collecting gas samples from within the chamber at different points in time.
The low cost of individual chambers means that a larger number of chambers can be deployed enabling a greater spatial coverage and/or larger number of treatments to be investigated. There is a wide range of design options for chambers as described by Clough et al. (2020). Chamber requirements will depend upon the type of system being measured.
Urine patches are a major source of N2O emissions in New Zealand’s grazed pasture systems. In New Zealand, chambers of 250 mm diameter (area = 0.05 m2) have been used to determine country-specific N2O emission factors (de Klein et al. 2003). However, naturally deposited cattle urine patch areas can be highly variable in shape and size with mean values in the range of 0.2–0.3 m2, 0.3–0.5 m2, and 0.3–0.8 m2 for 1, 2 and 3 L patches (Jolly et al. 2021). Therefore, when investigating the effectiveness of management practices at field scale it may be desirable to use larger chambers that allow for the natural expansion of a urine patch (O’Neill et al. 2021).
However, accurate flux measurements require the headspace within a chamber to be well-mixed. Using a fan within the chamber is potentially one method to achieve this although there is also a risk that excessive fan speeds could affect the rate of diffusion of gases from the soil. In addition, the use of fans would increase the cost of each chamber and therefore reduce the number of chambers that could be deployed for a given cost. Currently, there are no definitive guidelines on fan use for a given chamber design although mixing is more likely to be an issue as chamber height increases (Clough et al. 2020).
This study aimed to determine whether the presence or absence of a fan affects the N2O flux measurements from urine applied to pasture using large static chambers (800 mm diameter).
Materials and methods
Field measurements
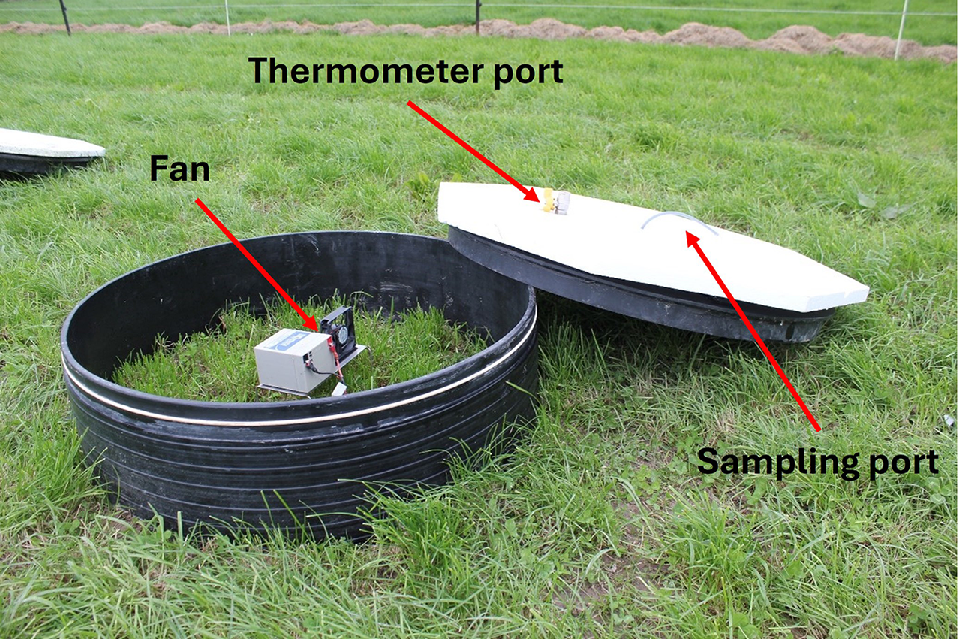
We analysed results from two experiments using large (800 mm diameter and 250 mm height with a base inserted ~20–40 mm into the soil resulting in a volume of 105–115 L and ground coverage of 0.50 m2) static chambers to measure N2O emissions. The chamber was not vented and a rubber seal between the top of the chamber and the base was used to seal the chamber head-space. The top was insulated with 20-mm thick polystyrene, with a port for taking gas samples and a port for inserting a thermometer in order to monitor internal temperature. further details reported in (Hoogendoorn et al. 2018). In both experiments, a battery-operated fan was used (Multicomp MC36325 12 V, 80 mm diameter). The air speed was not measured but should be 0.934 m3 per min according to the manufacturers specifications. Fig. 1 shows a picture of the chamber with the lid open.
Both experiments were carried out at two locations in Massey University dairy farms in the Manawatū region of New Zealand. Farm 1 and Farm 4 are situated in temperate climatic region, with mean annual air temperature and mean annual rainfall ranges of 13°C and 903 mm. One was on well-drained soil (Manawatu silt loam, weathered Fluvial Recent) and the other on poorly drained soil (Tokomaru silt loam, an argillic-fragic Perch-gley Pallic) in the New Zealand soil classification system (Hewitt 1992).
The selected areas for the experiments were fenced off for at least 10–12 weeks before the start of the experiments to avoid interference from uneven deposition of fresh dung and urine inputs and N fertiliser application and to reduce spatial variability. The trial layouts for the poorly drained (Adhikari et al. 2024) and well-drained sites consisted of a randomised block design with included 56 plots each split into seven or 14 treatments (a control, urine only, and urine plus five and 12 different nitrification inhibitor treatments, respectively). For each treatment, there were four replicate chambers for the well-drained site (4 × 14 = 56) and eight replicates (8 × 7 = 56) for the poorly drained site. N2O chamber technology and gas sampling schedules are consistent with the Global Research Alliance N2O chamber methodology guidelines (Charteris et al. 2020; De Klein et al. 2003). The flux measurements were made between 10:00 hours and 13:00 hours (local time) in both trials with 50 mL gas withdrawn from three time points: 0 (t0); 30 (t30); and 60 (t60) min after the chamber closure with and without the use of battery-operated fans.
On each sampling day, two background air samples were taken. We used these measurements to determine the effect of fan use on mixing the gas within about 105–115 L chamber headspace (assuming an average height of 210–230 mm above the soil surface).
Gas analysis
Samples were analysed using a gas chromatograph following the methodology of Mosier and Mack (Mosier and Mack 1980). The hourly fluxes were calculated using the rate of change of concentration (ΔC/Δt) and the ideal gas law, according to Eqn 1:
where ΔC is the increase in N2O concentration in the headspace volume (ppmv), Δt is the enclosure time period (minutes), MW is the molar mass of N2O-N (28 g mol−1), P is the atmospheric pressure at the time of sampling (Pa), R is the gas constant (8.314 J mol−1 K−1), T is the air temperature at the time of sampling (K), V is the headspace volume within the chamber (m3), and A is the area covered by the base (m2). (ΔC/Δt) was calculated using linear regression in most cases. When there was strong evidence of the slope decreasing over time (i.e. (ΔC from 0 to 30 min)/(ΔC from 30 to 60 min) > 2.5) we used the non-linear calculation of Hutchinson and Mosier (1981).
On the poorly drained site, the N2O fluxes were measured during the later stages of the treatment applications when the emissions were similar between the treatment and control plots. Thus, in this case, the fluxes were small for all treatments, and we refer to this as the low emissions experiment.
To test whether these results held under high N2O flux conditions, a second experiment was conducted on the well-drained site. The treatments applied were a control, urine only, and urine plus nitrification inhibitor for two different inhibitor types, and two different inhibitor quantities dissolved in three different volumes of water. For each treatment, there were four replicate chambers with a fan and four without. The N2O fluxes from Day 21 (following 42 mm of continuous rainfall) after treatment were used. In this case, the N2O fluxes were expected to be higher with significant treatment differences (high emissions experiment).
Statistical analysis
For both experiments, the N2O emissions from chambers with and without a fan were compared using a Kolmogorov–Smirnov test and linear regression modelling.
The Kolmogorov–Smirnov test is a non-parametric test that assesses the probability that two samples were drawn from the same underlying distribution. It does not rely on any assumptions about the underlying distribution (such as normality) but tends to have less power than other parametric tests.
The N2O data were also tested using a linear regression model on the difference between the emissions with and without the fan with a treatment factor. The residuals were assessed for normality using the Shapiro–Wilkes test and when the residuals indicated non-normality an appropriate transformation was applied. The Tukey Honest Significant Difference test was subsequently applied to account for the considerable number of treatment comparisons.
Finally, a regression model of N2O measured using a fan against the corresponding measurements without a fan was fitted. The statistical analyses were performed using R ver. 4.4.0 (R Foundation 2024). Microsoft Excel was used for some figures.
Results
Fig. 2 shows the distribution of N2O flux measured for the two different experiments using chambers with and without a fan. In both cases, the medians are similar with and without the fans although the emissions are much smaller in the low emission experiment.
Distribution of measured N2O fluxes across all chambers for (a) low emissions and (b) high emissions experiments.

The Kolmogorov–Smirnov test detected no significant differences in the N2O distributions with and without a fan in the two experiments (P = 0.62 and 0.906 for the low and high emissions experiments, respectively).
Fig. 3 shows the measured fluxes with and without a fan for the two experiments. In the low emission experiment the N2O fluxes needed to be log transformed to produce normal residuals. As there were some negative fluxes, a small positive constant was added prior to the log transformation and then the differences were calculated. The differences were not significantly different from zero for all but one of the treatments. This difference became non-significant when the Tukey test was applied to correct for multiple comparisons.
Measured N2O emission with and without a fan in chamber for the different treatments in the (a) low emissions and (b) high emissions experiments. Error bar, one s.e.

The high emission experiment did not require transformation and only showed a significant difference from zero for one of the treatments. This treatment also became non-significant under the Tukey test.
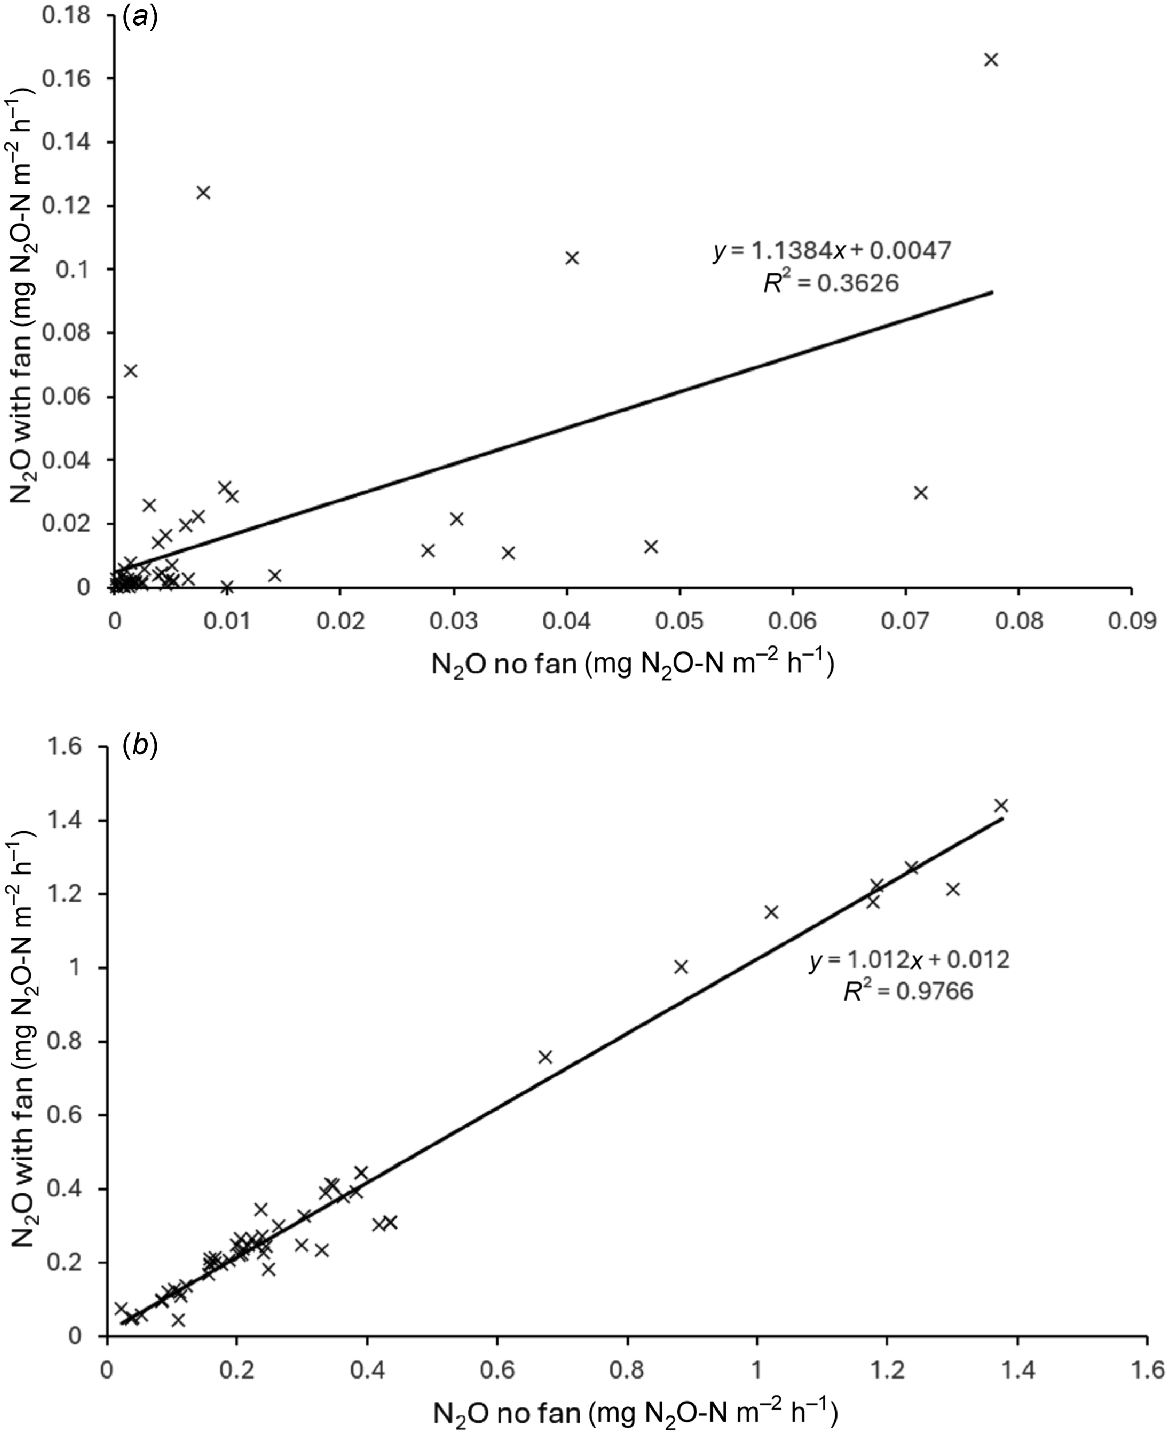
Fig. 4 shows the N2O measurements from each chamber with a fan plotted against the corresponding measurement without a fan for the two experiments. The points lay close to the 1:1 line although there was a lot more scatter in the low emissions experiment. This is expected as under low flux conditions the flux measurement errors will be larger as a proportion of the measured fluxes. There was potentially some underestimation of fluxes without a fan under low flux conditions.
Discussion and conclusions
While there could be a slight under-estimation of fluxes measured without fans under low emitting conditions, our results showed negligible effect of fans on the measured N2O emissions. In contrast, in a laboratory experiment, Christiansen et al. (2011) found that manual sampling with no headspace mixing resulted in an underprediction of CH4 fluxes. However, these chambers were taller (0.41–1.82 m) with a smaller base area (0.196 m2) than our studies. The rate of manual sampling was also much faster (every 5 or 10 min) compared to this study where samples were only taken at 30-min intervals. The shorter time interval may have meant there was not enough time for the headspace gas to recover between sampling events without forced mixing.
This suggests the effect of using fans depends on many factors such as the chamber dimensions, flux rates, and the rate of gas sampling. Other authors have suggested that the use of fans should aim to emulate ambient wind conditions (e.g. Rochette 2011; Pavelka et al. 2018). Our results indicate that fans may not be necessary for N2O flux measurements from pasture soils over the range of flux rates considered, even with quite a large chamber headspace. However, these results might not hold for systems with taller chambers containing more plant biomass.
Data availability
The data that support this study will be shared upon reasonable request to the corresponding author.
Declaration of funding
This work was funded by the Manaaki Whenua – Landcare Research MBIE Strategic Science Investment Fund (SSIF).
Acknowledgements
We are grateful to Massey University for providing access to dairy grazed pasture sites in Palmerston North. We also thank Dr Liyin Liang for feedback on an early draft of this work and to Pastoral Robotics for the use of equipment for treatment applications.
References
Adhikari K, Saggar S, Luo J, Giltrap D, Lindsey S, Berben P, Palmada T, Bates G (2024) Significance of inhibitor volume in on-farm mitigation of nitrous oxide emission from dairy cattle urine patches. In ‘Opportunities for improved farm and catchment outcomes,’ Palmerston North, New Zealand. Occasional Report No. 36. (Eds CL Christensen, DJ Horne, R Singh) (Farmed Landscapes Research Centre, Massey University) Available at http://flrc.massey.ac.nz/publications.html
Charteris AF, Chadwick DR, Thorman RE, Vallejo A, De Klein CAM, Rochette P, Cárdenas LM (2020) Global Research Alliance N2O chamber methodology guidelines: recommendations for deployment and accounting for sources of variability. Journal of Environmental Quality 49(5), 1092-1109.
| Crossref | Google Scholar | PubMed |
Christiansen JR, Korhonen JFJ, Juszczak R, Giebels M, Pihlatie M (2011) Assessing the effects of chamber placement, manual sampling and headspace mixing on CH4 fluxes in a laboratory experiment. Plant and Soil 343, 171-185.
| Crossref | Google Scholar |
Clough TJ, Rochette P, Thomas SM, Pihlatie M, Christiansen JR, Thorman RE (2020) Global Research Alliance N2O chamber methodology guidelines: design considerations. Journal of Environmental Quality 49(5), 1081-1091.
| Crossref | Google Scholar |
De Klein CAM, Barton L, Sherlock RR, Li Z, Littlejohn RP (2003) Estimating a nitrous oxide emission factor for animal urine from some New Zealand pastoral soils. Australian Journal of Soil Research 41(3), 381-399.
| Crossref | Google Scholar |
Hoogendoorn C, Saggar S, Palmada T, Berben P (2018) Do nitrous oxide emissions from urine deposited naturally differ from evenly applied urine? In ‘Farm environmental planning – Science, policy and practice’. February 2018, Palmerston North, New Zealand. Occasional Report No. 31. (Eds LD Currie, CL Christensen) (Fertilizer and Lime Research Centre, Massey University: New Zealand) Available at http://flrc.massey.ac.nz/publications.html
Hutchinson GL, Mosier AR (1981) Improved soil cover method for field measurement of nitrous oxide fluxes. Soil Science Society of America Journal 45(2), 311-316.
| Crossref | Google Scholar |
Jolly B, Luo J, Mehra P, Forrestal P, O’Neill M, Richards KG, Singh BP, Bates G, Saggar S (2021) Evaluation of proximal sensing technologies for mapping bovine urine patches under grazing pastures. Computers and Electronics in Agriculture 188, 106309.
| Crossref | Google Scholar |
Lundegårdh H (1927) Carbon dioxide evolution of soil and crop growth. Soil Science 23(6), 417-453.
| Crossref | Google Scholar |
Ministry for the Environment (2024) New Zealand’s greenhouse gas inventory 1990–2022. Ministry for the Environment, Wellington, New Zealand. Available at https://environment.govt.nz/assets/publications/GhG-Inventory/2024-GHG-inventory-2024/GHG-Inventory-2024-Vol-1.pdf
Mosier AR, Mack L (1980) Gas chromatographic system for precise, rapid analysis of nitrous oxide. Soil Science Society of America Journal 44(5), 1121-1123.
| Crossref | Google Scholar |
O’Neill M, Saggar S, Richards KG, Luo J, Singh BP, Mehra P, Forrestal PJ (2021) Nitrous oxide emission factors in conventionally and naturally simulated cattle urine patches. Nutrient Cycling in Agroecosystems 121, 129-147.
| Crossref | Google Scholar |
Pavelka M, Acosta M, Kiese R, Altimir N, Brummer C, Crill P, Darenova E, Fuß R, Gielen B, Graf A, Klemmedtsson L, Lohila A, Longdoz B, Lindroth A, Nilsson M, Jiménez SM, Merbold L, Montagnani L, Peichl M, Pihlatie M, Pumpanen J, Ortiz PS, Silvannionnen H, Skiba U, Vestin P, Weslien P, Janous D, Kutsch W (2018) Standardisation of chamber technique for CO2, N2O and CH4 fluxes measurements from terrestrial ecosystems. International Agrophysics 32, 569-587.
| Crossref | Google Scholar |
R Foundation (2024) R version 4.4.0. Available at https://cran.r-project.org/
Rochette P (2011) Towards a standard non-steady-state chamber methodology for measuring soil N2O emissions. Animal Feed Science and Technology 166–167, 141-146.
| Crossref | Google Scholar |
Tian H, Xu R, Canadell JG, Thompson RL, Winiwarter W, Suntharalingam P, Davidson EA, Ciais P, Jackson RB, Janssens-Maenhout G, Prather MJ, Regnier P, Pan N, Pan S, Peters GP, Shi H, Tubiello FN, Zaehle S, Zhou F, Arneth A, Battaglia G, Berthet S, Bopp L, Bouwman AF, Buitenhuis ET, Chang J, Chipperfield MP, Dangal SRS, Dlugokencky E, Elkins JW, Eyre BD, Fu B, Hall B, Ito A, Joos F, Krummel PB, Landolfi A, Laruelle GG, Lauerwald R, Li W, Lienert S, Maavara T, MacLeod M, Millet DB, Olin S, Patra PK, Prinn RG, Raymond PA, Ruiz DJ, van der Werf GR, Vuichard N, Wang J, Weiss RF, Wells KC, Wilson C, Yang J, Yao Y (2020) A comprehensive quantification of global nitrous oxide sources and sinks. Nature 586, 248-256.
| Crossref | Google Scholar | PubMed |