

Modelling and constructing engineered soil for post-mining landforms to create optimal ecological outcomes: application of a computer based Landscape Evolution Model (SSSPAM)
W. D. D. P. Welivitiya A , G. R. Hancock A * and I. P. Senanayake A
A
Abstract
Designing a landscape without considering the evolution of surface materials and pedogenesis assumes that any materials are in an equilibrium state.
This is not the case for new landscapes such as post-mining landforms. Computer-based Landscape Evolution Models including the State Space Soil Production and Assessment Model (SSSPAM) have the capability to predict both surface and subsurface landscape evolution.
Here, the effect of depth-dependent pedogenesis functions (DDWF) and particle breakage geometry on erosion rates and landform evolution are examined using SSSPAM for a site in the Bowen Basin, Queensland, Australia.
Landforms generated by either the Exponential or Humped Exponential DDWFs showed unique erosion rates.
Analysis of weathering mechanism geometry demonstrated that the size distribution of daughter particles significantly influences erosion rates and landform evolution.
With knowledge of weathering and pedogenesis, an optimised landscape can be engineered that would reduce the cost of post-mining landform design and construction.
Keywords: armouring, landform evolution modelling, mine rehabilitation, mine restoration, pedogenesis function, soil erosion, soil production, SSSPAM, weathering.
Introduction
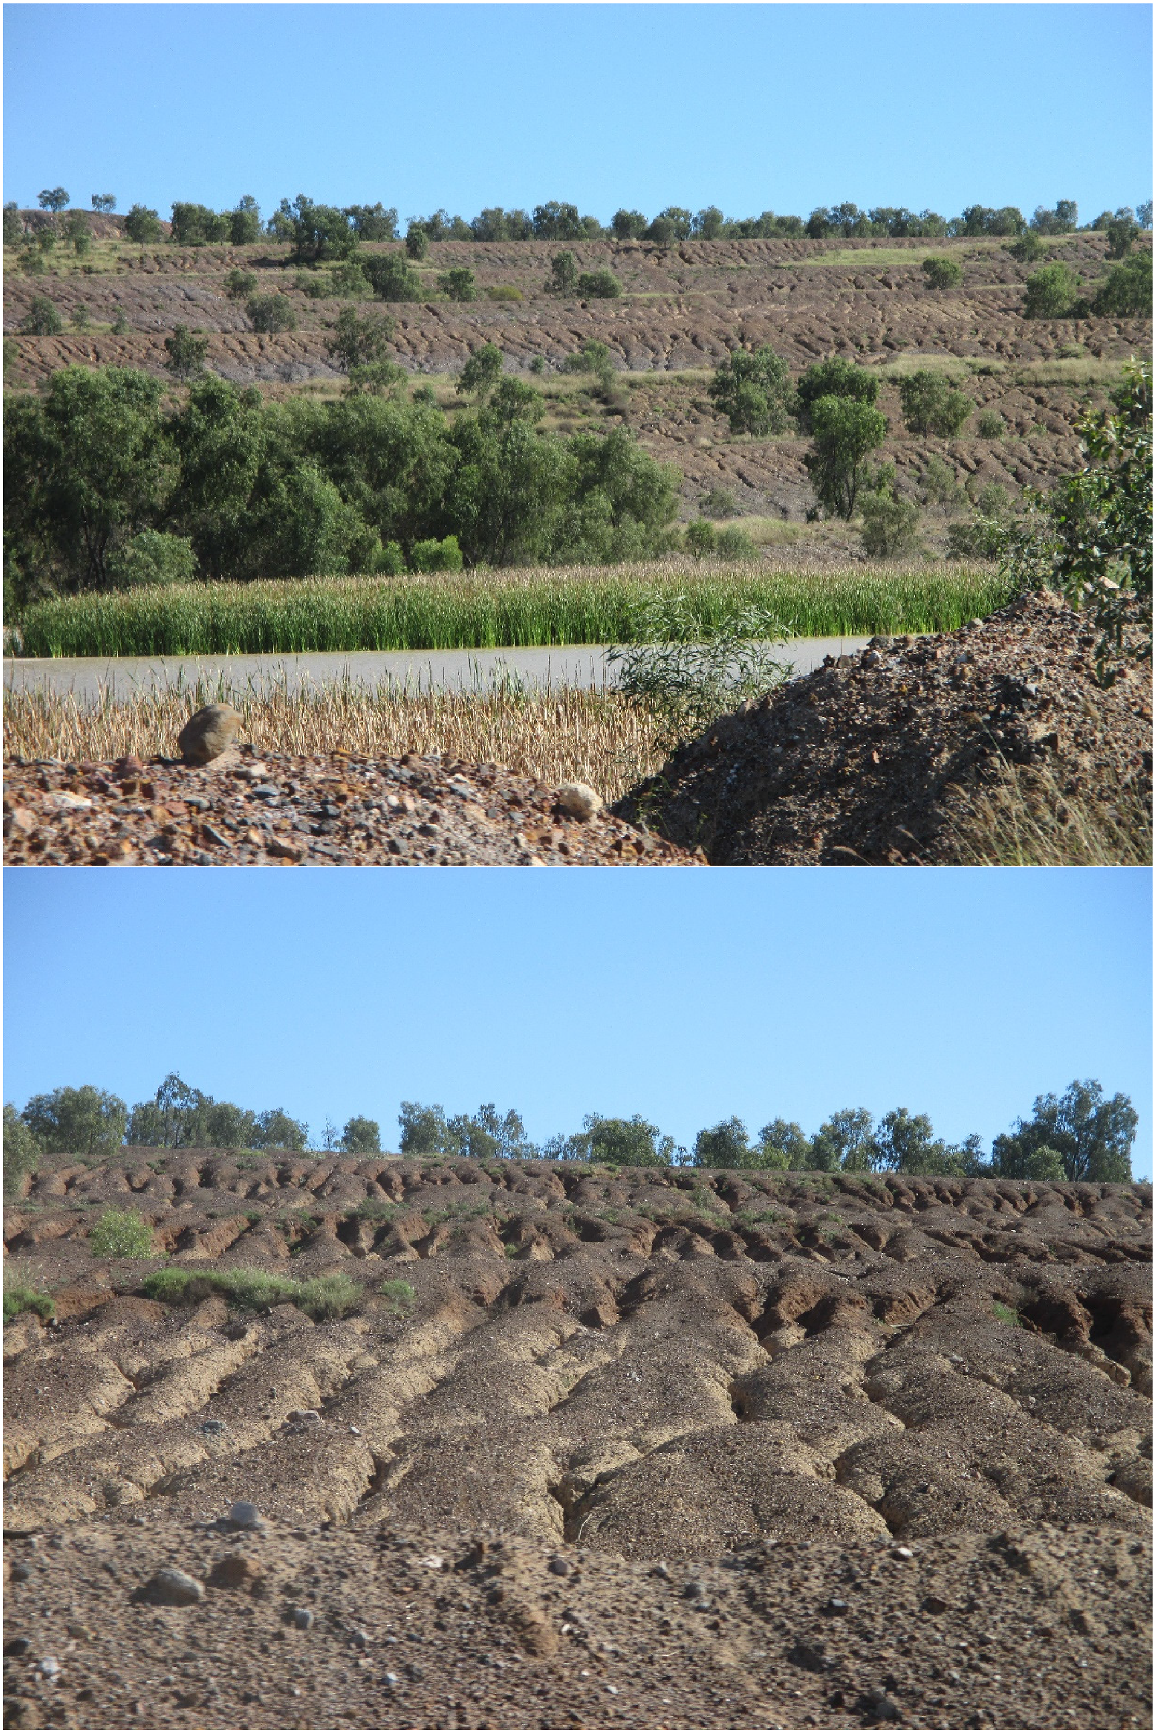
Designing and engineering a landscape without consideration of the evolution of surface materials assumes that surface materials are in an equilibrium state and remain constant if all other forcings are constant (Evans 2000; Willgoose 2018; McKenna et al. 2024). This is not the case for new landscapes such as post-mining landforms. A post-mining landscape (the focus of this study is open cut mines and the materials removed from the pit) is constructed of vast quantities of material that have been removed to expose the target mineral. This removed material, referred to as ‘waste rock’, is a natural material that has been broken by explosives and removed from the site by earth-moving equipment. In Australia, this dumped material then requires reshaping to ensure that it is ‘safe, stable, and non-polluting’ (an industry expression used to describe a successfully reconstructed post-mining landform). While natural, this material has had its geological state completely restructured and has an increase in volume as a result of the inclusion of pore spaces between the components. The restoration of a mine landscape occurs both during mine operation and also post-closure. For coal and metallic mines, this creates a landscape that has an increased volume and steeper slope (if constrained to the same disturbance footprint) than the pre-mine landscape. This new landform is free to evolve in response to climate and vegetation development (Fig. 1).
Post-mining landform that is approximately 20 years old, constructed in a series of linear hillslopes with benches (top image), and close up view of the eroded surface (bottom). The landscape is constructed of erodible material and, while initially covered in topsoil and seeded (revegetated), the revegation has been unsuccessful.
Designing a post-mining landform for an optimal ecological outcome is non-trivial (Evans 2000; Sheridan et al. 2000; Zhang et al. 2016; Willgoose 2018; Hancock et al. 2020). Vegetation establishment and succession is at most sites an integral component of landscape restoration. An assessment of soil erosion, deposition, and their cumulative impacts across different spatial and temporal scales is made possible through Landscape Evolution Models (LEMs). These models are commonly employed to analyse physical landscape processes including the role of vegetation in erosion reduction, enhance geomorphological understanding, and address practical applications, such as in post-mining environments (Coulthard et al. 2002, 2013; Willgoose 2018).
The models have a range of functionality, from simple erosion assessments through to whole landscape modelling, with different landscape surface parameters and underlying geology (Schoorl et al. 2000, 2002; Hancock et al. 2008, 2016; Tucker and Hancock 2010; Coulthard et al. 2013; Vanwalleghem et al. 2013; Zhang et al. 2016; Hobley et al. 2017; Barnhart et al. 2020). An issue with many models is how the surface material properties are parameterised (i.e. hydrology and sediment transport parameters) using different methods including field plots and lab-based methods such as flumes and rainfall simulators. These methods provide a set of parameters for the current surface and do not take into account any change in both the surface and subsurface material due to weathering, armouring, and the long-term influence of vegetation and biological activity.
An important aspect of the surface evolution is surface weathering, armouring, and resultant pedogenesis (Walker and Coventry 1976; Stockmann et al. 2014; Hazelton and Murphy 2016; van der Meij et al. 2018; Ritschel and Totsche 2019; Proto and Courtney 2023). Predicting both the surface and subsurface evolution is of critical importance, as employing a set of static parameters could be grossly in error as the surface and subsurface evolve (Zhang et al. 2016; Hancock et al. 2017; Ritschel and Totsche 2019; Slukovskaya et al. 2019; Yang et al. 2023). Field data and improved models are needed to improve the predictive capacity of LEMs for applications such as post-mining landforms. A further consideration is that many post-mining landforms have undesirable materials encapsulated within them (i.e. radioactive waste from uranium mining together with process tailings) (Hancock 2021; McKenna et al. 2024). Understanding how surfaces evolve over time is of vital importance for long-term containment of such waste. This will result in greatly improved landscape design and more cost-effective landscape outcomes (Willgoose 2018; Slukovskaya et al. 2019; Proto and Courtney 2023). A limited number of researchers have examined armouring, weathering, and pedogenesis on post-mining landscapes and other sites (Taylor and Spears 1970; Taylor 1988; Biddle et al. 1998). Van der Meij et al. (2018) provided a review of such model approaches. These studies, all with different focuses and outcomes, have a paucity of data that can be used for model input (Emmerton et al. 2018; Emmerton 2019; Cox et al. 2021). There have been several attempts to predict the effect of armouring, weathering, and pedogenesis together with erosion and deposition (Moliere et al. 2002). The SIBERIA LEM (Willgoose 2018) employs an armouring module, which when calibrated from field data collected at the ERA Ranger Mine of Northern Australia produced sediment loads very similar to that of field plots. When the parameterised SIBERIA LEM was employed at the large catchment scale the inclusion of weathering and armouring greatly reduced erosion rates and incision depths of gullies for a post-mine catchment (Moliere et al. 2002; Hancock et al. 2017).
The CAESAR-Lisflood model employs a site-specific particle size distribution that allows for up to five different user-defined distributions across the landscape (Coulthard et al. 2013). The material then rearranges and self-organises based on the site rainfall and runoff. However, there is ‘no weathering’ or pedogenesis function. The Lorica model (Temme and Vanwalleghem 2016) has a coupled soil and landscape evolution model; however, it focuses soil evolution on soil chemistry and texture. Other models such as Landlab (Hobley et al. 2017; Barnhart et al. 2020) have the capability to employ weathering, armouring and pedogenesis functions through its modular framework. However, this is yet to be implemented and tested.
A LEM called mARM developed by Cohen et al. (2009) included surface weathering and armouring and the model highlighted the importance of surface weathering and armouring on landscape evolution. mARM had the capacity to model soil development both at the surface and along the soil profile using recognised depth-dependent weathering functions. This model demonstrated the impact of weathering, armouring, and pedogenesis on landscape evolution, but was constrained by computational limitations.
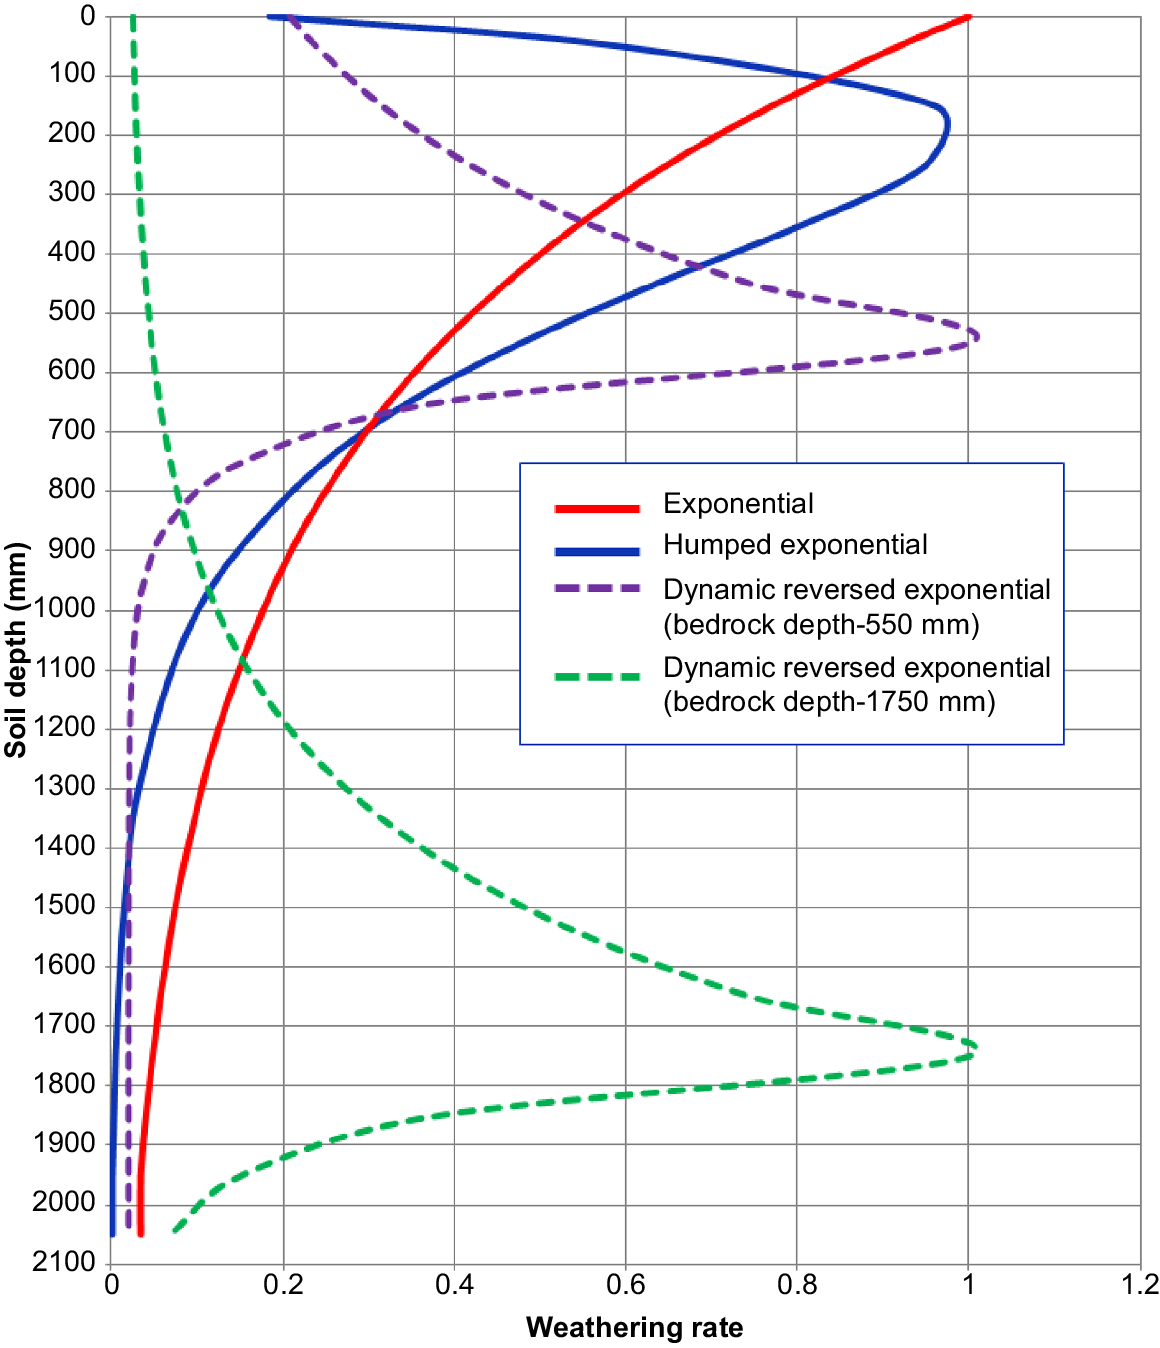
From this work, a new and more computationally efficient LEM that includes weathering, armouring, and pedogenesis, was developed. This model, the State Space Soil Production and Assessment Model (SSSPAM) (Welivitiya et al. 2019) has the functionality of a LEM but incorporates weathering, armouring, and pedogenesis and can be employed at the large hillslope and catchment scale (Welivitiya et al. 2019, Welivitiya and Hancock 2023). The pedogenesis process is represented using several depth-dependent models based on current understanding of how soil profiles develop. These include: (1) an exponential decrease in weathering rates with depth (labelled as ‘Exponential’ in Fig. 2) (Humphreys and Wilkinson 2007); and (2) a humped exponential decline (labelled as ‘Humped Exponential’ in Fig. 2, Ahnert 1977; Minasny and McBratney 2006). In the Exponential model, the highest weathering rate occurs at the surface and decreases exponentially along the depth. This is based on the concept that the surface layer, often called the surface armour, experiences greater weathering due to more intense exposure to environmental factors such as moisture variation and fluctuations in temperature. In contrast, the humped model suggests the highest weathering rate occurs at a certain depth below the surface, after which the rate decreases exponentially. This model reflects observations in some areas where weathering rates peak at the water table, resulting in a humped function.
The goal for the restoration of any disturbed landscape system (here, mining) should be to have the restored landform ecologically and economically integrate with its surrounds. The first step in this process is to provide an erosionally stable landform. Erosional stability is a function of both the surface and subsurface. Models such as SSSPAM enable us to understand the evolution of both the soil surface and subsurface with the goal to engineer an optimised landscape outcome.
Here, the influence of different soil production functions on hillslope erosion, deposition and landscape evolution is assessed using the SSSPAM model and field-based model input data for a site in the Bowen Basin, Queensland, Australia. A range of weathering, armouring and pedogenesis functions are examined, determined from both field and laboratory data (Welivitiya and Hancock 2022, 2024). The study uses a typical post-mining landform at a representative size and scale to evaluate both surface and subsurface landscape evolution using the pedogenesis functions (Fig. 2). The findings highlight the field data and modelling needs for the advanced prediction of surface and subsurface landscape evolution and the potential to engineer an optimal ecological outcome if weathering is better understood.
The state space soil production and assessment model (SSSPAM)
SSSPAM is an integrated model of soilscape and landform evolution, developed by integrating a pedogenesis model with a landform evolution model (Welivitiya et al. 2019, 2021). It simulates processes such as fluvial erosion, diffusive erosion, sediment deposition, surface armouring, and weathering of the soil profile. The model includes a pedogenesis module designed to simulate the formation of soil material both at the surface and throughout the soil profile.
SSSPAM weathering module theoretical framework
The weathering module of SSSPAM is comprised of two main components: (1) the weathering geometry, which governs the grading of daughter particles; and (2) the rate of weathering for various soil layers, which controls the rate of weathering of the parent material. The weathering rate of each soil layer generally (but not necessarily) varies with subsurface depth. SSSPAM focuses solely on physical weathering to degrade both the surface armour layer and the subsurface soil layers, ensuring mass conservation as a weathering assessment demonstrated this to be the key mechanism (Welivitiya and Hancock 2022, 2024). Processes like chemical dissolution are not currently accounted for, although the model’s design allows for the inclusion of chemical weathering if necessary.
In SSSPAM, the soil grading at a given time and depth is described by the state vector, . Each entry, gi, in this vector represents the proportion of material within the grading size range, i. Transformations in soil grading resulting from various geomorphological processes, including weathering, are modelled using transition matrices.
SSSPAM’s weathering mechanism model was employed to calculate the weathering rates and processes for different spoil materials collected from the field. This was achieved by calibrating the module parameters to align them with experimental observations (Welivitiya and Hancock 2022, 2024). The weathering process of SSSPAM is described by using a mathematical framework known as the weathering transition matrix. The matrix entries, B, reflect changes in soil grading size classes, based on the fracture mechanism that is associated with the weathering process. This approach enables SSSPAM to simulate a range of particle fracture behaviours, representing different weathering mechanisms.
Throughout the weathering process, larger parent particles break down into smaller daughter particles, causing each grading size class to lose some of its mass to smaller classes. The daughter products may be distributed into one or more smaller grading classes, based on the particle size range produced when parent particles break down. The quantity of material transferred to each smaller class is determined by the size distribution of the grading classes, the fracture mechanism, and the size properties of the daughter particles.
In SSSPAM’s weathering module, soil grading transformations due to weathering are represented by a matrix equation:
where is the soil grading vector before the weathering process, , is the soil grading vector after the weathering process, and I and are the identity matrix and the weathering rate vector, respectively. The weathering rate vector indicates that different sized particles may undergo varying degrees of weathering, with each element of and Wi corresponding to the weathering rate for a particular grading size class. is to SSSPAM’s time step duration when weathering takes place, and B is the weathering transition matrix.
To generalise the fracture behaviours, consider a parent particle with a diameter of d that breaks into one larger daughter particle with a diameter of d1 and n − 1 smaller daughter particles with diameters of d2, where the total number of daughter particles is n (see Fig. 3). Within the weathering mechanism framework, the largest daughter particle can be viewed as the remaining portion of the original parent particle, whereas the other particles are fragments that were separated from the parent particle during the weathering process.
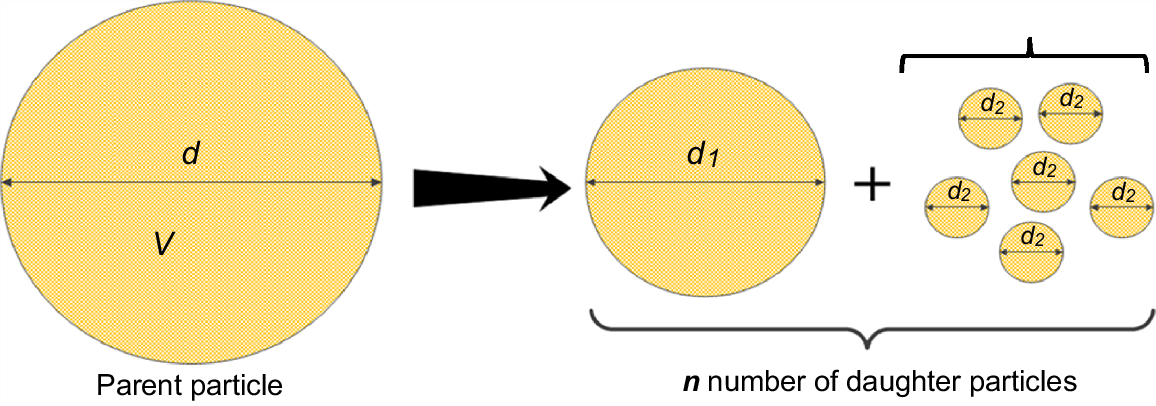
For simplicity, it is assumed that all particles are spherical. The principle of mass conservation indicates:
If the larger daughter particle with a diameter of d1 represents an α fraction of the parent particle, then:
Changing the α fraction value and the number of daughter particles, n, enables the simulation of different fracture behaviours, including symmetric fragmentation, asymmetric fragmentation, and granular disintegration (Wells et al. 2008):
For example, when α = 0.5 and n = 2, it represents two daughter particles with symmetric fragmentation. When α = 0.99 and n = 11, it models a fracture mechanism similar to granular disintegration, where the largest daughter particle retains 99% of the original volume, and the remaining 10 smaller daughter particles together account for 1% of the original volume. In theory, the weathering module in SSSPAM can simulate any combination of α and n. However, the distribution of the daughter particles resulting from the weathering process is also influenced by the discretisation of the particle size distribution.
The range of particles resulting from the weathering of a single soil grading size class is computed by using Eqns 3 and 4. Let d(i) represent the upper bound and d(i−1) represent the lower bound of the ith soil grading class. The diameter range of larger particle can be determined as using Eqn 3. Similarly, Eqn 4 can be used to calculate the diameter range for the smaller particles, as . The fragmentation process and the distribution of the resulting daughter particles are in Fig. 4.
Distribution of daughter particles resulting from the weathering of larger size classes. (Left) Transition from the parent to daughter grading classes, where Mi denotes the fraction of material undergoing weathering. (Right) Distribution of the larger daughter particles across different size classes (Source: Welivitiya and Hancock (2024) after Cohen et al. (2009)).

Within the context of modelling, it is useful to express the mass of each size class as mass fractions. The mass fractions remaining in the parent material grading size class and those transferred to smaller grading size classes are determined through an interpolation technique. Fig. 5 shows the process of distributing mass fractions to the smaller grading classes.
Interpolation of the contributing grading fractions of daughter products into smaller grading classes (Source: Welivitiya and Hancock 2024).

Depth dependent weathering functions
SSSPAM uses two primary pedogenesis functions: (1) the exponential decline, referred to as ‘Exponential’ (Humphreys and Wilkinson 2007); and (2) the humped exponential decline, referred to as ‘Humped Exponential’ (see Fig. 2) (Ahnert 1977; Minasny and McBratney 2006). Additionally, the SSSPAM modelling framework has been enhanced by the inclusion of a theoretical weathering function called the Dynamic Reversed Exponential function. In this function, the weathering rate peaks at the soil-bedrock interface and decreases exponentially in both upward towards the surface and downward towards the bedrock. In contrast to the Exponential and Humped functions, the Dynamic Reversed Exponential function allows the peak weathering rate to vary with changes in the depth of the soil-bedrock interface. The rationale for this function is that the transformation from bedrock to soil at the soil-bedrock interface may happen more rapidly than in other layers.
In the Exponential function, the weathering rate at a depth of h (m) below the soil surface, denoted as wh, is expressed as:
where β is a constant that defines the maximum weathering rate, and δ1 is the depth scaling factor.
For the Humped Exponential function, the weathering rate at a depth of h (m) below the soil surface, denoted as wh, is expressed as:
where P0 and Pa is the maximum and steady-state weathering rates, respectively, δ2 and δ3 are constants that define the function’s shape, and Wmax is the maximum weathering rate at the hump’s peak, which is employed for normalising the function.
In the Dynamic Reversed Exponential function, the weathering rate of a layer h (m) beneath the soil surface, denoted as wh, is expressed as:
where H (m) is the depth from the surface to the soil-bedrock interface, calculated based on the soil grading distribution at each iteration throughout the simulation.
Model inputs
The study focuses on mining landforms and climate for the Bowen Basin in Queensland, Australia (Emmerton et al. 2018; Welivitiya and Hancock 2022; McKenna et al. 2024). The Bowen Basin spans an area of approximately 60,000–75,000 km2 and is rich in coal and natural gas deposits. This area receives an average annual rainfall of 600–700 mm. This region is home to numerous coal mines that require restoration following mining activities.
The model input requirements are: (1) a digital elevation model (DEM) of the landscape; (2) parameters of the erosion model,; and (3) daily rainfall and material particle size data.
Landscape and digital elevation model
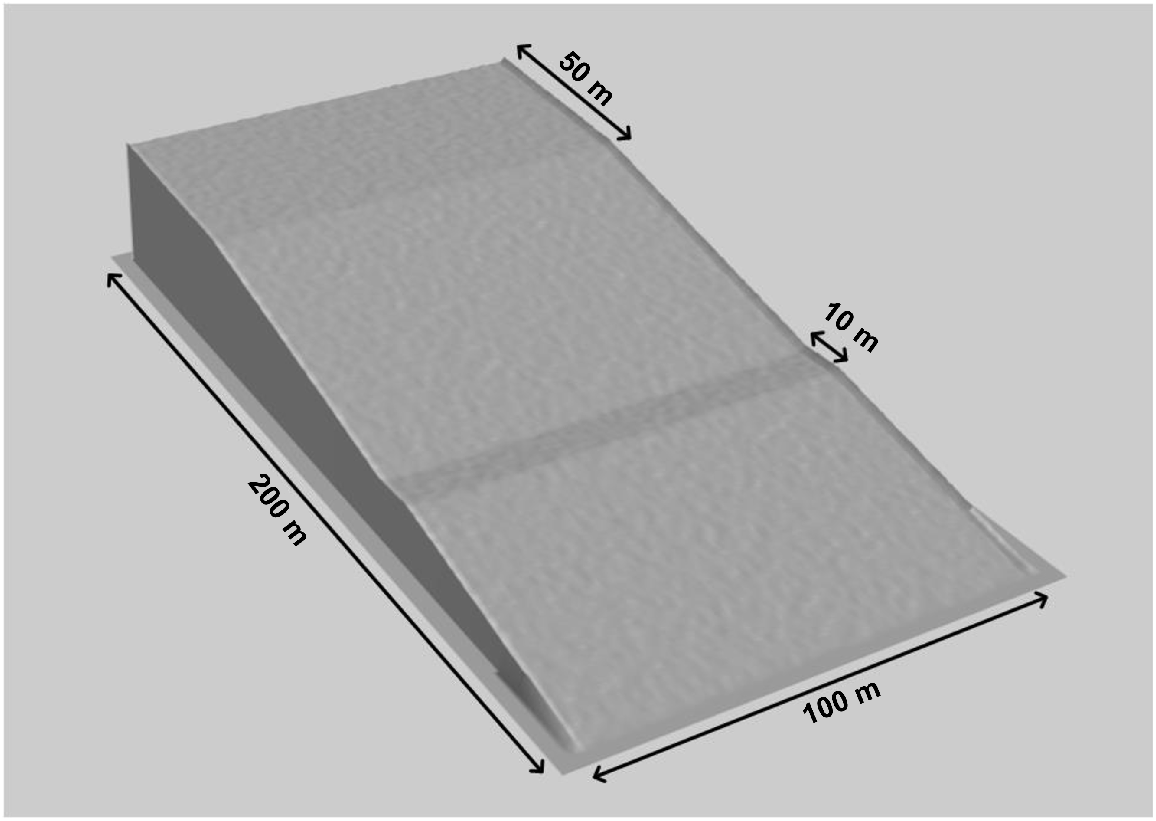
A typical post-mining landform was used that was representative of many constructed landforms and provides an ideal test case for examining erosion, pedogenesis, and landform evolution (Fig. 1). The landform was 200 m long and 100 m wide (Fig. 6). At the top of the landform, a flat area of 50 m long gives way to a gentle slope of 20%. Halfway to the bottom of the hillslope, a back-sloping area (5% slope) of 10 m represents a break in slope, which is commonly constructed on post-mining landforms. High elevation areas bounded the landform on the right and left sides, acted as a catchment boundary for the modelling. A digital elevation model (DEM) with 1 m grid resolution (Fig. 6) was created to represent this landform. This size and grid dimension was sufficiently large to examine field scale processes.
Digital elevation model of the landform (1 m grid). This landform is used for all simulations to evaluate erosion, pedogenesis and landform evolution.
Post-construction, the site had been seeded with a mix of pasture, shrub, and tree species with the goal for the landscape to sustain cattle grazing. However, vegetation establishment was not successful, with the surface devoid of vegetation for approximately 20 years (Fig. 1). Hence the site is an ideal test site to examine pedogenesis without including the increased complexity of vegetation on soil production and function.
SSSPAM parameters
SSSPAM parameters were developed for mine material in the Bowen Basin, Queensland. The fluvial erosion rate in SSSPAM is calculated based on discharge per unit width and slope where e is the erodibility factor and α1 and α2 are exponents on discharge and slope, respectively. The sediment transport equation is described and parameter set developed (named 1SLV) using runoff and erosion data gathered using a laboratory flume, following the procedure described by Welivitiya and Hancock (2022) (Table 1).
Soil particle size distribution and rainfall data
Daily rainfall data obtained from the Bureau of Meteorology (BOM) weather station at Iffley, QLD (station no: 034100), the closest to the study site, was used here. The available daily rainfall record was repeated end-to-end, in order to generate a complete daily rainfall time-series of 3000 years. A 3000-year period was considered sufficient time for an equilibrium or steady state erosion output to be achieved.
Particle size distribution data of the material is needed as an input to the SSSPAM model. The particle size distribution of the mine material was determined by sieve analysis of the 1SLV material (Table 2, Welivitiya and Hancock 2022).
Model setup
All model runs used the landform described in Section ‘Landscape and digital elevation model’ together with the daily rainfall time-series data and the particle size distribution. Four sets of pedogenesis and weathering model runs were carried out.
First, the simulation was without any weathering to serve as a control for comparing all other results.
Second, the SSSPAM weathering module was activated using symmetric fragmentation with two daughter particles (i.e. n = 2, α = 0.5) and the same base weathering rate throughout all the particle size grading classes. Using symmetric fragmentation, SSSPAM was run using: (1) the Exponential DDWF; and (2) the Humped Exponential DDWF. The purpose here was to analyse how the DDWF influences the landform evolution, erosion rate, and the particle size distribution.
Third, the influence of the weathering mechanism geometry (particle fragmentation geometry) on erosion and landform evolution was explored. In SSSPAM, weathering geometries can be simulated by changing two parameters; i.e. the α fraction of the volume of the largest daughter particle, and n, the total number of daughter particles.
Four different fracture mechanisms were evaluated:
Symmetric Fragmentation: where a spherical particle of volume (V) breaks down into two identical daughter particles, each having a 0.5 V volume. i.e. α = 0.5, n = 2
Even Breakage: where a single particle breaks into 10 identical particles. i.e. α = 0.1, n = 10.
Spalling-like mechanism: where a single particle breaks into 10 particles, with a larger daughter particle holding 90% of the parent material while the balance of 10% is evenly shared among the nine smaller daughters. i.e. α = 0.9, n = 10.
Granular Disintegration-like mechanism: where a parent particle breaks down into 100 small particles with identical volumes. i.e. α = 0.01, n = 100.
Finally, the effect of weathering by spalling was explored to examine how the largest daughter particle’s size influences the erosion rate and landform evolution. The weathering mechanism’s n parameter (total number of daughter particles) was kept constant throughout these simulations at 10. The α parameter (the fraction of volume retained by the larger daughter particle) was changed from 0.9 to 0.4. In this way, the largest daughter particle’s size and the sizes of the rest of the daughter particles can be changed (i.e. the largest daughter particle’s size decreases while the sizes of the other daughter particles increase).
Each model run commenced with the landform consisting of 1SLV material (Table 2). All other model parameters were kept constant in these simulations while changing the weathering mechanism. The SSSPAM simulations were performed over a period of 3000 years, which was sufficient for erosion to reach a steady state for each landform.
Results and discussion
Influence of depth dependent weathering function
The three soil production functions all produce different temporal erosion patterns and rates (Fig. 7). Therefore, the choice of DDWF influences surface evolution (Temme and Vanwalleghem 2016; van der Meij et al. 2018), In the case of ‘no weathering’, initially (approximately within the first 600 years), the erosion rate reduces and then increases afterwards (Fig. 7). The erosion rate variation of the ‘no weathering’ simulation behaves somewhat differently compared to the Exponential and Humped Exponential pedogenesis function landscapes.
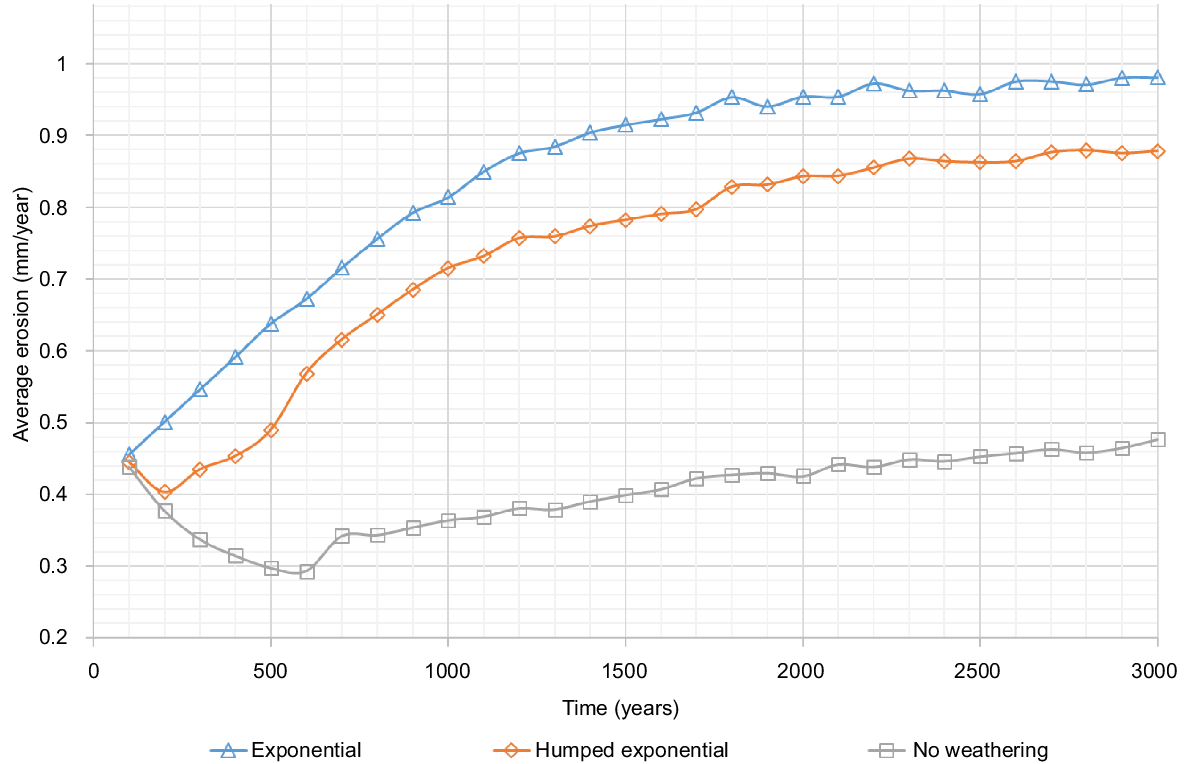
The rates of erosion for the Exponential and Humped Exponential DDWFs (Fig. 7) have different characteristics. Unlike the ‘no weathering’ scenario, the erosion rate of the Exponential DDWF does not have an initial region where the erosion rate is reduced. It starts from a non-zero value, continues to increase for some time, and stabilises near 2000 years. However, the erosion rate using the Humped Exponential DDWF shows a slight reduction in erosion rate in the initial stage, similar to the ‘no weathering’ simulation results, and then an increase, similar to the Exponential DDWF results. Interestingly after the initial stage, the erosion rate curve of Humped Exponential DDWF is almost parallel to the erosion rate curve of the Exponential DDWF.
Fig. 8 shows the final landforms after 3000 years of evolution without weathering, and the landform develops numerous gullies. Interestingly, the number of gullies observed above the mid-bench area is much higher than those below the mid-bench area. This observation suggests that the mid bench has acted as an obstacle to the gully propagation process.
Geomorphology of the landform after 3000 years of evolution without weathering and surface coarseness (represented by d50).
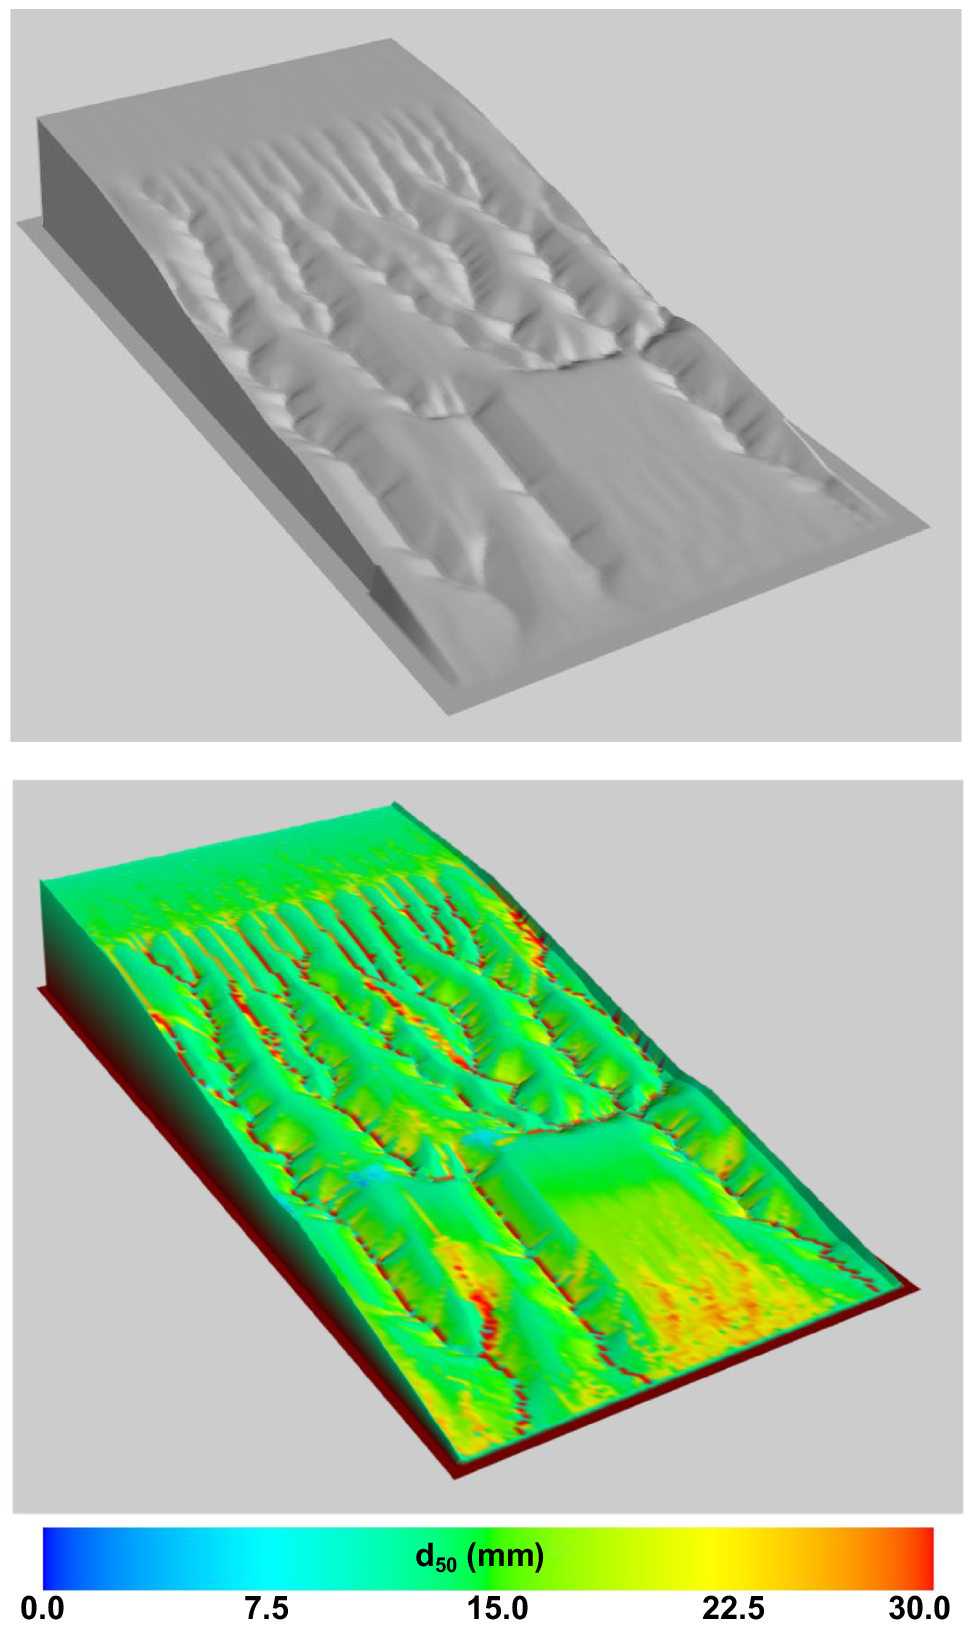
Fig. 9 shows the final landforms after 3000 years of evolution with Exponential DDWF and Humped Exponential DDWF. At first glance, both landforms seem similar, yet subtle differences exist. The most notable difference is that the area below the mid-bench has more gullies at closer spacing using the Humped Exponential weathering function. In contrast, more severe erosion can be seen in the same area using the Exponential DDWF function. Both Exponential and Humped Exponential DDWF functions display higher erosion compared with the results of ‘no weathering’ simulations (Fig. 8).
Top: geomorphology of the landform after 3000 years of evolution with (a) Exponential DDWF, (b) Humped Exponential DDWF. Bottom: surface coarseness (represented by d50) of the landform employing the (a) Exponential DDWF after 200 years, (b) Humped Exponential DDWF after 200 years, (c) Exponential DDWF after 3000 years, and (d) Humped Exponential DDWF after 3000 years.

Armouring is well understood to influence erosion (Sharmeen and Willgoose 2006, 2007; Yang et al. 2023). Hancock et al. (2017) found a reduction in both field-measured erosion and that predicted by the SIBERIA LEM at several mine-site erosion plots.
With ‘no weathering’, the initial reduction of the erosion rate can be associated with surface armouring. The armouring process predominantly removes fine material, retaining the coarser material. With time, the surface loses fine material and becomes enriched with coarse material. This is demonstrated in Fig. 9 where the surface coarseness of the resultant landform simulated without weathering is shown. The d50 value of the initial soil grading (i.e. at the beginning of the simulation) is 12.5 mm. Since there is no weathering, deposition is the only process where an area of the landform can develop finer material. All other areas will have surface d50 values greater than the initial value. This occurs as the armouring process removes fines and hence enriches the surface with coarse material. It is noteworthy to mention that the scale of the colour bar in Fig. 8 has a range of 0–30 mm, while the colour bar scale of Fig. 9 showing the surface coarseness of Exponential and Humped Exponential DDWS is 0–15 mm. For the Exponential and Humped Exponential DDWF in Fig. 9, the process of armouring coarsens the surface, while weathering breaks down soil particles, leading to low surface coarseness. Hence, the relative balance of armouring and weathering processes dictates the surface coarseness of any point in the landform.
Models such as CAESAR-Lisflood have the capability of preferentially eroding and depositing both coarse and fine sediment (Coulthard et al. 2013). Since the fine material available for erosion reduces, so does the erosion rate. Also, at the start of hillslope evolution, the landform does not have a developed drainage network. Hence, the drainage network evolves by eroding some landform regions and depositing the material in other areas. During this time, concurrently with armouring, most eroded material is deposited within the landform because the drainage system is not connected with the downstream landform outlets. Once the drainage system matures and connects, sediment eroded upstream can be routed to the hillslope outlet at the base of the slope, leading to increased erosion. This highlights the need for an integrated hillslope and/or catchment approach to predict both surface and subsurface evolution (Walker and Coventry 1976; van der Meij et al. 2018; Willgoose 2018).
The erosion rate difference between the Exponential and the Humped Exponential DDWF simulations can be explained by considering how the two DDWFs influence the weathering process. In the case of Exponential DDWF, the highest weathering rate occurs at the soil surface and, then exponentially reduces with soil depth. Consequently, the surface material weathers more vigorously, producing large amounts of fine particles. The breakdown of the coarse soil particles at the surface prevents armouring while keeping the flow transport limited (the surface retains enough fine particles, but the flow transport capacity is saturated, preventing the erosion of all the fine particles). As described earlier, as the drainage system matures, the flow’s transport capacity also increases, leading to the flow becoming weathering limited (the flow is able to entrain all the fine particles formed during the weathering process), stabilising the erosion rate in the long term. This demonstrates the role of hillslope connectivity in surface evolution (van der Meij et al. 2018; Willgoose 2018).
The surface layer coarseness of the early landform (around 200 years) is relatively high in the Humped Exponential DDWF (Fig. 9b) simulation compared with the Exponential DDWF simulation (Fig. 9a)). The highest weathering rate in the Humped Exponential DDWF is a finite depth below the surface (Humphreys and Wilkinson 2007; Stockmann et al. 2014). Therefore, in the simulation’s initial stage, the surface material’s weathering rate remains low, leading to a relatively strong armouring process. Similar to the erosion rate curve produced by the non-weathering scenario, the strong armouring of the surface at the initial stage reduces erosion. After some time, the surface material is weathered sufficiently, and the drainage system has matured, leading to the observed increase in the erosion rate in the Humped Exponential DDWF weathering rate curve. Following this stage, the erosion rate curve of the Humped Exponential DDWF landscape follows the same pattern as the Exponential DDWF landscape.
Influence of particle breakage geometry
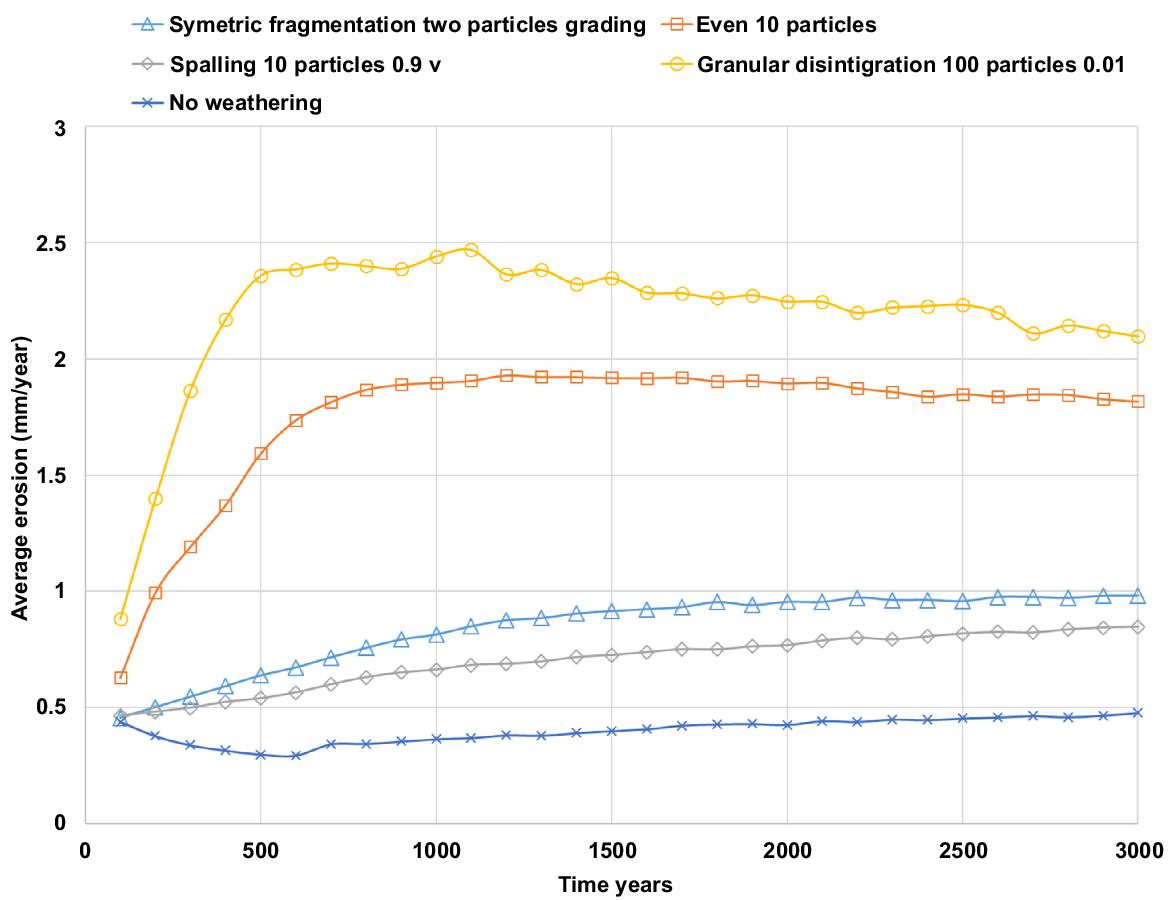
Breakage pattern and geometry have a large influence on erosion and deposition processes, and landscape evolution (Wells et al. 2008; Willgoose 2018). Erosion commences with a non-zero erosion rate, then increases with time and stabilises (Fig. 10). The Granular Disintegration mechanism has the highest overall erosion, followed by Even Breakage, Symmetric Fragmentation, with the Spalling mechanism exhibiting the lowest total erosion.
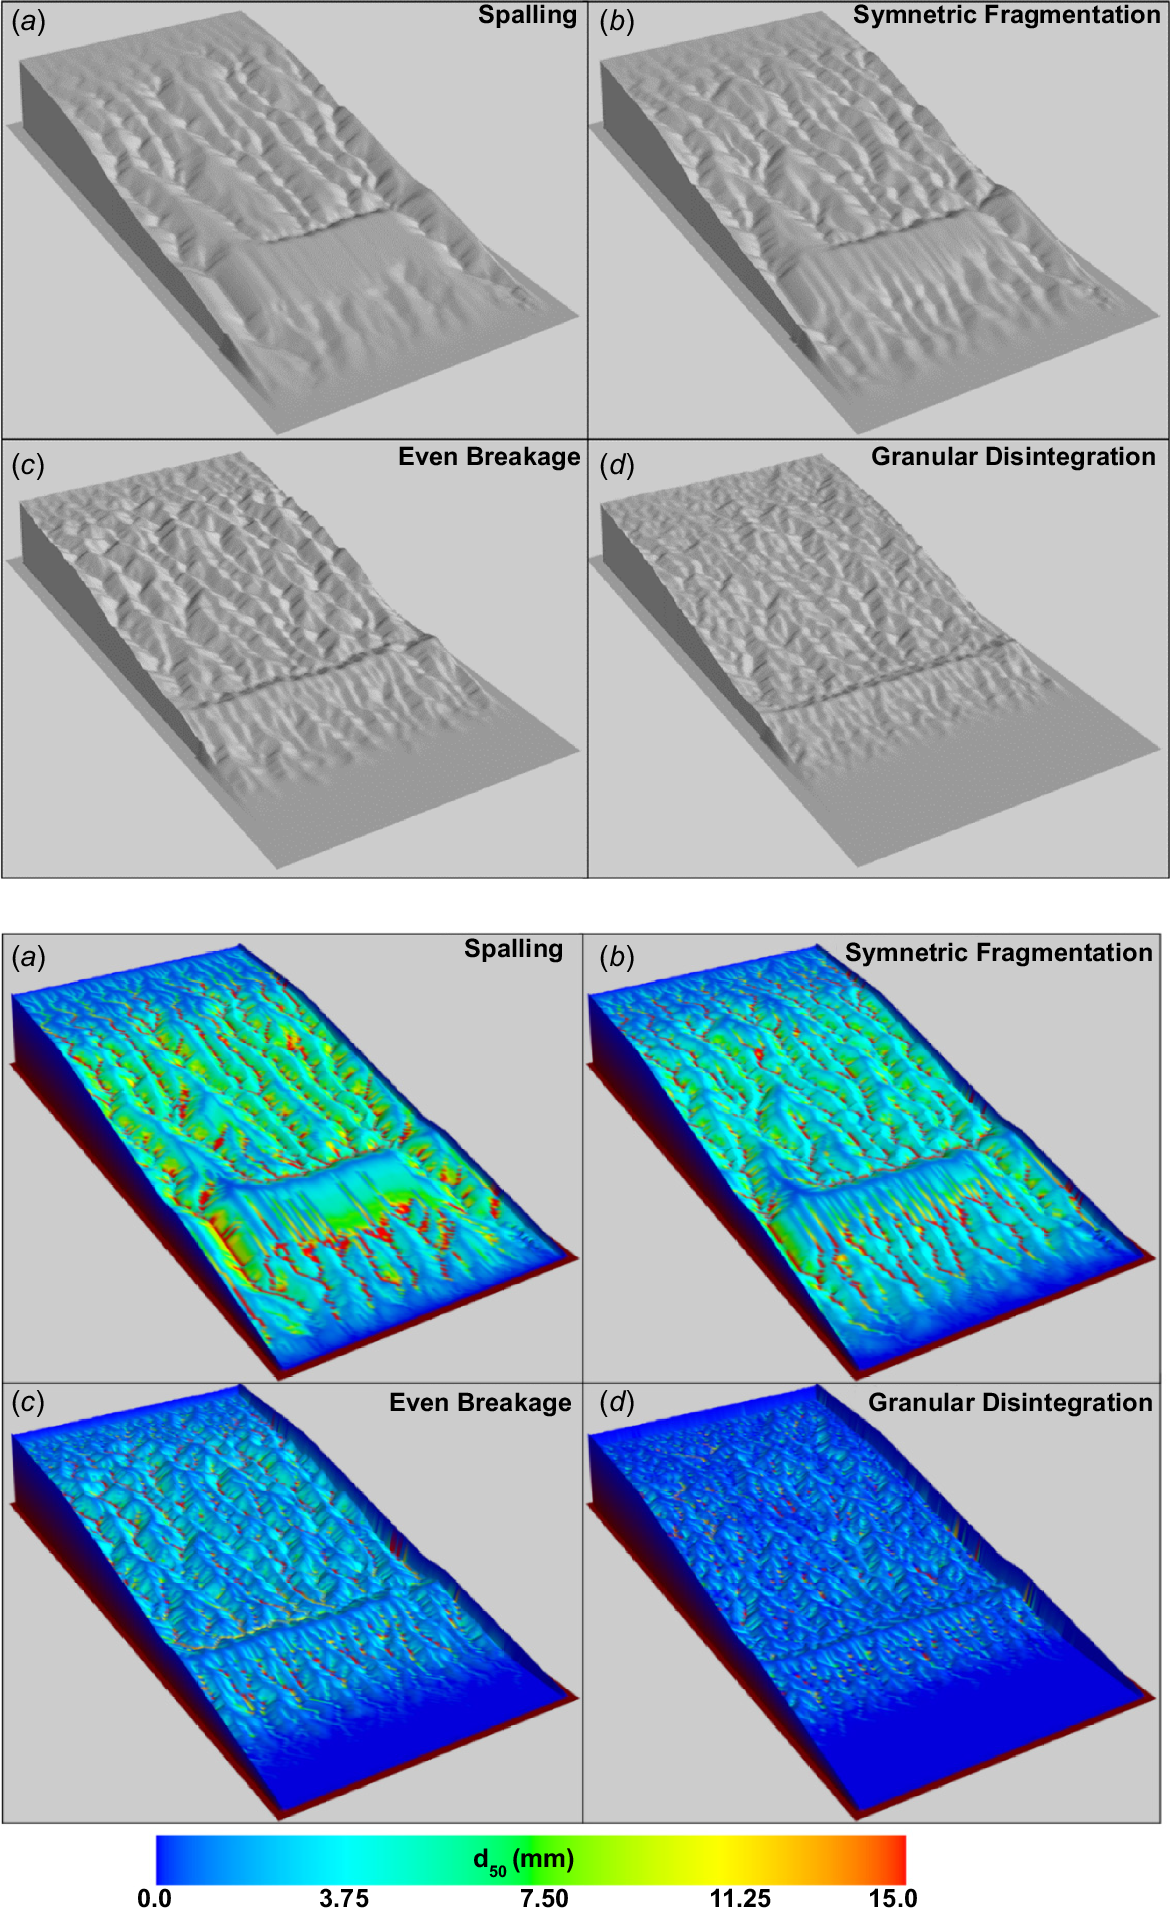
Comparing Fig. 9 with Fig. 11, it is evident that the weathering mechanism influences landform geomorphology. Qualitatively, it can be observed that when a weathering mechanism produces relatively large daughter particles compared with the parent particle, the resultant landform develops fewer deep gullies and leads to lower erosion rates. Conversely, when a weathering mechanism produces smaller daughter particles, the landform develops a large number of shallow gullies and higher erosion rates (Yang et al. 2023).
Top: the landform’s geomorphology after 3000 years of evolution with (a) Spalling, (b) Symmetric Fragmentation, (c) Even Breakage, and (d) Granular Disintegration. Bottom: surface coarseness of the landform (represented by d50) after 3000 years of evolution with (a) Spalling, (b) Symmetric Fragmentation, (c) Even Breakage, and (d) Granular Disintegration.
In all landscapes with weathering, the process of armouring is weakened by the breakdown of the coarse material, and the erosion rate continues to increase without any initial reduction throughout all the weathering simulations (Wells et al. 2008; Willgoose 2018; Yang et al. 2023). The relative size of the daughter particles (at least the largest) compared to the parent particle can explain the different magnitudes of erosion rates observed for each weathering mechanism simulation. From all the weathering functions, spalling-like weathering (where the larger daughter particle retains 90% of the parent particle) has the lowest erosion rate. Although fine particles are produced in the Spalling mechanism, most of the parent particle volume is retained in the large daughter particle. Although the weathering process interferes with the armouring process, the retention of coarse particles lessens the severity of this interference, leading to some armouring and a low erosion rate.
Granular Disintegration weathering, where the entire parent particle disintegrates into 100 daughter particles with 1% of the parent particle volume, exhibits the highest erosion rate. In this case, no coarse material is retained through the process of weathering, whereas the armouring process is severely hindered, leading to the highest erosion rate.
The erosion rate variation employing Symmetric Fragmentation and Even Breakage mechanisms can also be understood by taking the size of the daughter particles into account. In Symmetric Fragmentation, the parent particle breaks into two identical daughter particles, each keeping 50% of the parent volume. Therefore, the resultant daughter particles are relatively coarse, leading to strong armouring and relatively low erosion rates. The Even Breakage mechanism has features from both Symmetric Fragmentation and Granular Disintegration mechanisms. It produces a relatively large number of identical daughter particles, similar to the process of Granular Disintegration. However, the daughter particles’ sizes are larger than those of Symmetric Fragmentation. Therefore, the armouring process is weaker compared to the Symmetric Fragmentation simulation and stronger than the Granular Disintegration simulation. Consequently, Even Breakage exhibits a higher erosion rate than the Symmetric Fragmentation while showing a lower erosion rate than Granular Disintegration.
As discussed earlier, the erosion rate variation of the different weathering mechanisms depends on the competing processes of armouring and weathering (Sharmeen and Willgoose 2006, 2007). Armouring tends to coarsen the surface by preferential removal of fine particles, while weathering produces fine particles through material breakdown. Fig. 11 (bottom) displays the surface coarseness of the final landform after 3000 years under different weathering mechanisms. Spalling produces the landform with the highest surface coarseness, followed by Symmetric Fragmentation and Even Breakage mechanisms. Granular Disintegration produces the landform with the finest soil surface. By comparing the erosion rate (Fig. 10) and the final surface d50, it is clear that a strong correlation exists between the landform’s surface coarseness and rate of erosion. The higher the surface coarseness, the lower the erosion rate of the landform.
It can be observed that Symmetric Fragmentation and Spalling weathering mechanisms produce relatively coarse surface material brought forward by strong armouring. Armouring mainly occurs in the gully bottoms and the gully banks. On the sidewall, the d50 increases toward the gully’s bottom and reaches a maximum at the bottom. This armouring effect is much more substantial for Spalling as this process produces coarser daughter particles than the Symmetric Fragmentation process. Due to armouring, the erosion rate of Symmetric Fragmentation and Spalling weathering mechanism landscapes are lower compared to the other two simulations.
Employing Even Breakage and Granular Disintegration, the armouring effect is weak, leading to high erosion. For these two landscapes, armouring mostly occurs within the gully bottoms. Interestingly, the d50 of gully bottoms of Granular Disintegration landscape appears higher than that of Even Breakage. This observation is somewhat counterintuitive as Granular Disintegration produces daughter products smaller than the Even Breakage mechanism.
However, with Even Breakage, some daughter products remain on the surface of the gully bottoms as armour since they are larger than the daughter products produced by Granular Disintegration. Since the daughter products of the Granular Disintegration mechanism are smaller, all the daughter products are readily eroded from the surface of gully bottoms. This process exposes the unweathered parent particles, which leads to a higher apparent d50 in the gully bottoms.
The simulation results suggest that a fragmentation mechanism producing a mixture of particles of different sizes (or at least some large particles in the case of Symmetric Fragmentation) will lead to armouring and reduced erosion over time (Parker and Klingeman 1982; Sharmeen and Willgoose 2006, 2007). Also, if the breakage mechanism is known, then the likelihood of gullying (as opposed to erosion processes such as sheetwash) can be better predicted (Kirkby 1971).
Influence of the largest daughter particle in the weathering mechanism
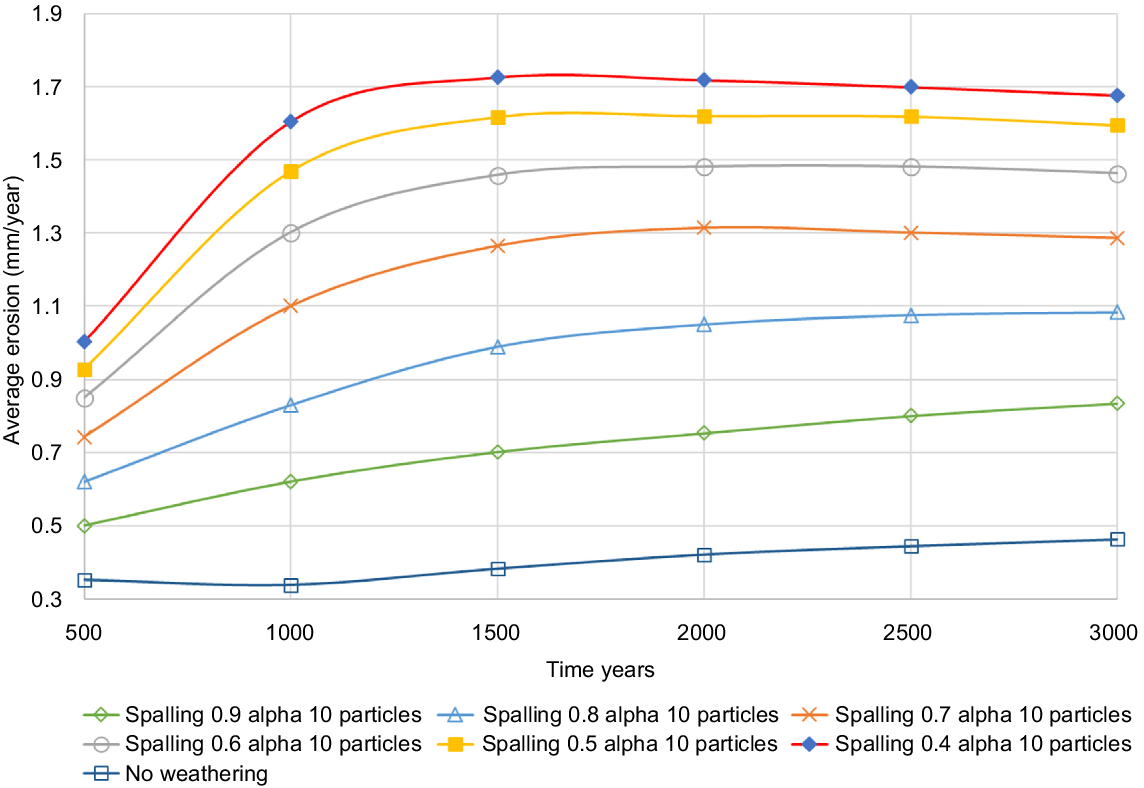
The findings here demonstrate that the size of the weathered particle has a direct influence on erosion (Sharmeen and Willgoose 2006, 2007; van der Meij et al. 2018; Willgoose 2018). Fig. 12 demonstrates that the erosion rate increases as the α parameter of the Spalling weathering mechanism decreases. Interestingly, the difference between each erosion rate curve reduces as the α parameter is reduced. The two reasons for this are: (1) as the size of the largest daughter particle decreases, the armouring process is weakened, leading to increased erosion; and (2) although the size of the largest daughter particle is reduced when the α parameter is reduced, the sizes of other daughter particles increase. This size increase positively enhances the influence of armouring. Hence, although the erosion rate increases with a decreasing α parameter, the difference between the Spalling parameters visually reduces (Fig. 12).
Temporal variation in erosion rate using different Spalling weathering mechanism parameters.
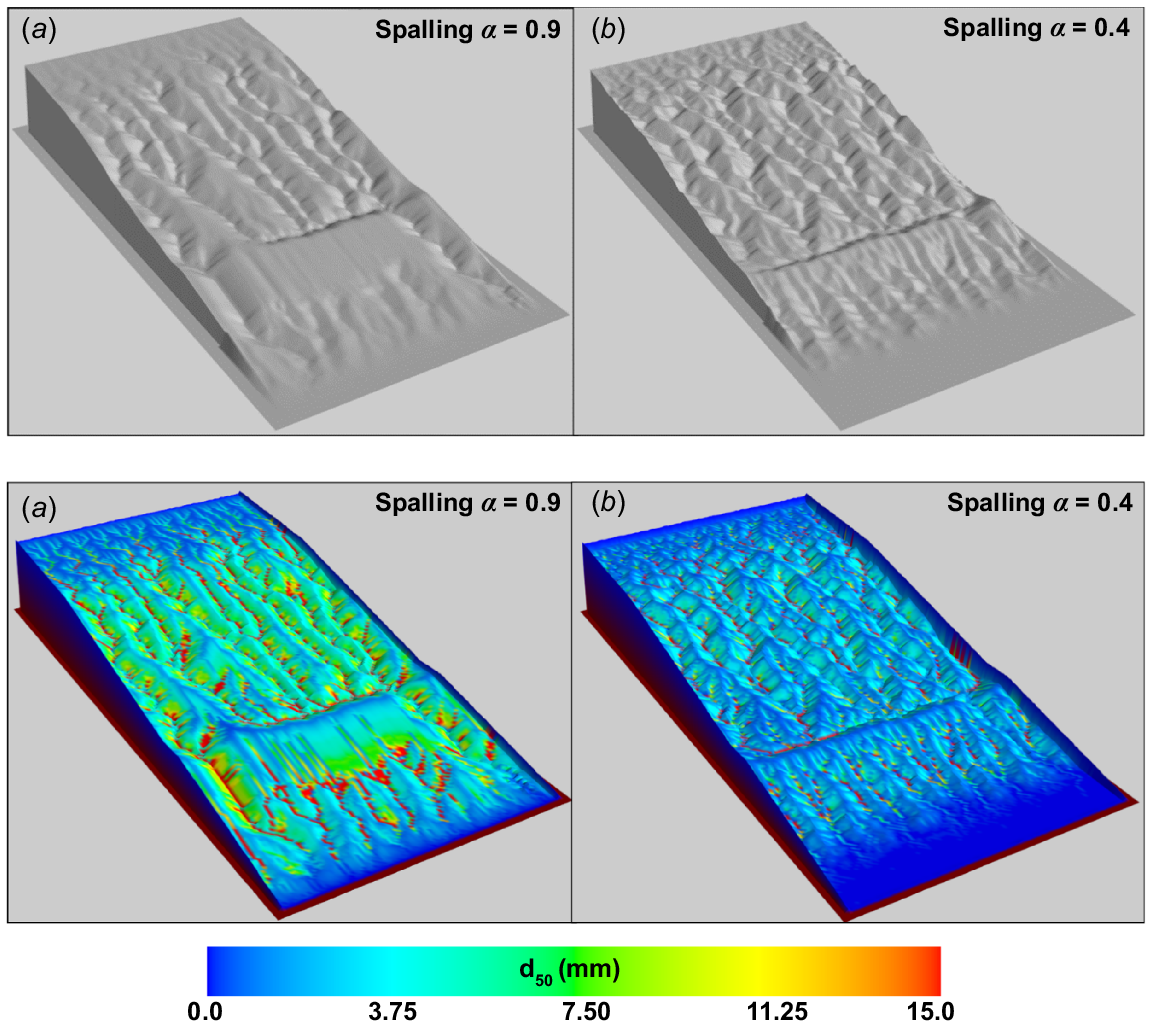
The change in particle size has long-term consequences on landform evolution and the surface coarseness of the resultant landform. Fig. 13 displays the difference in surface morphology for the landforms employing different α values in the Spalling weathering mechanism. Comparing the morphology of the two landforms, it is evident that the landform developed through a lower α parameter has a higher number of gullies than the simulation employing a high α parameter. Also, the surface material is coarser in the high α parameter simulation compared to the low α parameter simulation. As described earlier, the different rates of armouring occurring in the landform due to different size daughter products produced by different weathering mechanisms are the reason behind this geomorphological difference. Hancock et al. (2017), when using the SIBERIA LEM and different armouring model inputs, found that geological timescale landscapes varied.
Modelling outcomes and future work
Using a LEM with a pedogenesis capability highlights the importance of quantitatively understanding both surface and subsurface landform evolution (Evans 2000; Sheridan et al. 2000; van der Meij et al. 2018). The findings demonstrate that different weathering and pedogenesis functions produce different erosion rates and that at centennial to millennial time scales different landforms can result. The results here at the hillslope scale supports the previous findings by Humphreys and Wilkinson (2007). The model can be easily employed to provide possible landscape outcome not just at the hillslope scale, but also at the catchment scale (Willgoose 2018).
A strength of this work is that the surface erosion parameters have been determined for the material, with a reasonable level of confidence in their reliability over a 10–20-year period, as demonstrated by Welivitiya and Hancock (2022). However, it remains uncertain which weathering and pedogenesis model is the most accurate. Field and laboratory data from both the surface and subsurface, combined with modelling efforts, are necessary to constrain model predictions (Legros and Pedro 1985; Wells et al. 2008; Sanchidrián et al. 2014). Ongoing fieldwork aims to determine weathering and armouring pathways on post-mining landforms.
The landscape employed here is a representative post-mining landform. The materials and parameters derived are sourced from a Queensland coal mine (Welivitiya and Hancock 2022). However, other landforms with different materials, hillslopes, slopes and climate are likely to perform differently (Simmons and Fityus 2016; Yang et al. 2023). The SSSPAM model provides the ability to assess potential landform influences and optimise designs. Other processes such as chemical weathering (and dissolution) (Willgoose 2018) can be examined in the SSSPAM modelling framework. Alternatively, if the weathering process is dominated by a chemical process, a model such as Lorica may be appropriate (Temme and Vanwalleghem 2016). However, assessment of the material here found that chemical weathering or dissolution was not a major process of material breakdown (Hazelton and Murphy 2016; Welivitiya and Hancock 2022).
The study site was ideal as it became a ‘badland’ with no vegetation. The material is highly erodible. Hence, the lack of vegetation and its influence over pedogenesis in the short-term can be neglected. However, the role of vegetation, and its influence on pedogenesis, cannot be ignored (Barzegar et al. 2002; Peterman et al. 2014; Ritschel and Totsche 2019). There are no LEMs at present that have a coupled erosion, deposition and vegetation growth model that actively evolves a landform. Some models such as CAESAR-Lisflood (Coulthard et al. 2013) have a model that evolves vegetation to climax cover but it does not respond to changes in rainfall once fully evolved, nor does it have a subsurface-vegetation component. The SIBERIA LEM integrates vegetation by assuming a set of representative erosion and hydrology parameters determined for the surface. It does not dynamically respond to vegetation growth or decay. Nor does it have a model for below ground biomass. However, the modelling here was for an approximately 20-year-old landform with an absence of vegetation (Fig. 1). A complete vegetation and decadal to centennial time scales is unlikely without human intervention. Hence, the modelling here assuming no vegetation provides somewhat series of plausible landscape outcomes.
An issue not highlighted here is the differences in erosion rates. Employing ‘No Weathering’ parameters produces the lowest erosion rate of <0.5 mm per year. This corresponds to an erosion rate of 6.5 t ha−1 per year, assuming a bulk density of 1.3 tonnes m−3 for the soil. An erosion rate of <5 t ha−1 per year approximates that of agricultural erosion rates for many Australian landscapes (see Bui et al. (2011) for a review of tolerable soil erosion rates in Australia). However, for all other parameter sets, the rate of erosion is much higher. Therefore, using the ‘no weathering’ parameters may underestimate erosion and highlights the need to better constrain pedogenesis and weathering processes.
In particular for coal mines, waste rock has been shown to rapidly weather with topsoil and vegetation and or competent rock needed to reduce erosion (Welivitiya and Hancock 2022). Field and model data from other sites, have also found that erosion rates are reduced by the armouring as well as the inclusion of surface roughness by ripping (Saynor et al. 2019). Other models such as SIBERIA (Willgoose 2018) and CAESAR Lisflood (Coulthard et al. 2013) can model the effect of armouring.
As described above, for simplicity, the modelling has assumed no vegetation. Vegetation is an essential component of successful, long-term mine reconstruction. However, the establishment of a consistent long-term vegetation cover (in this case, grazing pasture) is yet to be achieved for this site. It should be recognised that an absence of vegetation is not an acceptable post-mining outcome. It also should be noted that for many mine sites vegetation will disturbed by both grazing and fire (McKenna et al. 2024). Further, the pedogenesis functions assumed to be applicable here (Fig. 2) have been developed from natural (non-disturbed) landscapes, assuming vegetation is a component in pedogenesis. Hence, correctly or otherwise, vegetation is incorporated into the model framework for the subsurface used here.
Post-mining landforms will exist for geological time once they are constructed. The pedogenic trajectory for post-mining landforms is unknown (Emmerton 2019; Cox et al. 2021). If the pedogenic potential of mine overburden (or waste rock) as it is being removed is known, then there is potential to optimise material placement (Slukovskaya et al. 2019) such that the best soil development material can be placed at the surface with the least amenable material placed at depth. The model and process presented here demonstrate that we possess the technology to forecast landscape evolution. With knowledge and planning there is the potential to reconstruct a landform that has at least equal and potentially greater ecological function than that of the pre-mine landscape.
Conclusion
This study investigated the influence of a range of possible depth-dependent weathering functions (DDWF) and particle breakage geometry on erosion rates and landform evolution. Landforms produced by either the Exponential or Humped Exponential DDWFs exhibited unique erosion rate variations and resulting erosion patterns. Notably, the mid bench acted as a key factor influencing gully propagation, and without weathering, the landform exhibited gully development, emphasising the role of initial armouring. The differences in erosion rates between Exponential and Humped Exponential DDWFs can be attributed to the depth-dependent weathering processes and their impact on surface coarseness. These findings underscore the significance of weathering functions in shaping landforms and their erosion patterns.
Analysis of weathering mechanism geometry demonstrated that the size distribution of daughter particles significantly influences erosion rates and landform evolution. Symmetric Fragmentation and Spalling mechanisms, which produce larger daughter particles, resulted lower erosion rates due to enhanced armouring effects. In contrast, Granular Disintegration and Even Breakage, generating smaller daughter particles, resulted in higher erosion rates. The correlation between surface coarseness and erosion rates further highlights the importance of particle breakage geometry in shaping landforms.
Exploring the influence of the largest daughter particle in the Spalling weathering mechanism highlighted its role in erosion rate and landform evolution. Decreasing the size of the largest daughter particle weakened armouring, which resulted in increased erosion rates. The balance between decreasing the largest daughter particle size and the concurrent increase in other daughter particles affected the overall erosion rates. The long-term consequences for landform morphology and surface coarseness underscore the importance of carefully considering weathering mechanism parameters.
The findings highlight the need to quantify weathering and soil production functions to constrain model predictions. This is of high importance as the results demonstrate that our predictive ability for landform evolution is greatly influenced by weathering, armouring and pedogenesis. This is a critical research need for the mining industry where new landscapes are created as well as suboptimal materials buried and encapsulated. Such information would greatly improve model predictions and reduce the costs of post-mining landform design and construction. With models such as SSSPAM, where surface and subsurface processes are linked, there is the potential to engineer ecologically optimised landforms.
Data availability
SSSPAM model and SSSPAM results analysis tools used in this study can be obtained through the following link. https://doi.org/10.5281/zenodo.7808748
Declaration of funding
This work was funded by the mining industry through Australian Coal Association Research Program (ACARP) Projects C34025: New Landscape Evolution Model for Assessing Rehabilitation and C27042: Adaption of design tools to better design rehabilitation and capping over highly mobile mine waste and Australian Research Council Discovery Grant DP110101216.
Author contributions
W.D.D.P. Welivitiya: Writing – original draft, Conceptualisation, Data curation, Software, Formal analysis, Investigation, Visualisation, Methodology. G.R. Hancock: Conceptualisation, Writing – review and editing, Resources, Data curation, Supervision, Methodology, Funding acquisition, Investigation. I.P. Senanayake: Methodology, Writing – original draft, Writing – review and editing.
References
Ahnert F (1977) Some comments on the quantitative formulation of geomorphological processes in a theoretical model. Earth Surface Processes 2(2–3), 191-201.
| Crossref | Google Scholar |
Barnhart KR, Hutton EWH, Tucker GE, Gasparini NM, Istanbulluoglu E, Hobley DEJ, Lyons NJ, Mouchene M, Nudurupati SS, Adams JM, Bandaragoda C (2020) Short communication: landlab v2.0: a software package for Earth surface dynamics. Earth Surface Dynamics 8, 379-397.
| Crossref | Google Scholar |
Barzegar AR, Yousefi A, Daryashenas A (2002) The effect of addition of different amounts and types of organic materials on soil physical properties and yield of wheat. Plant and Soil 247(2), 295-301.
| Crossref | Google Scholar |
Biddle DL, Chittleborough DJ, Fitzpatrick RW (1998) An algorithm to model mass balances quantitatively. Computers & Geosciences 24(1), 77-82.
| Crossref | Google Scholar |
Bui EN, Hancock GJ, Wilkinson SN (2011) ‘Tolerable’ hillslope soil erosion rates in Australia: linking science and policy. Agriculture, Ecosystems & Environment 144(1), 136-149.
| Crossref | Google Scholar |
Cohen S, Willgoose G, Hancock G (2009) The mARM spatially distributed soil evolution model: a computationally efficient modeling framework and analysis of hillslope soil surface organization. Journal of Geophysical Research: Earth Surface 114 F03001.
| Crossref | Google Scholar |
Coulthard TJ, Macklin MG, Kirkby MJ (2002) A cellular model of Holocene upland river basin and alluvial fan evolution. Earth Surface Processes and Landforms 27(3), 269-288.
| Crossref | Google Scholar |
Coulthard TJ, Neal JC, Bates PD, Ramirez J, de Almeida GAM, Hancock GR (2013) Integrating the LISFLOOD-FP 2D hydrodynamic model with the CAESAR model: implications for modelling landscape evolution. Earth Surface Processes and Landforms 38(15), 1897-1906.
| Crossref | Google Scholar |
Cox J, Rose H, Griffiths N (2021) Examination of past and present mine rehabilitation to grazing land as a guide to future research. ACARP Project Number: C27030. Australian Coal Association Research Program, Brisbane. Available at https://www.acarp.com.au/abstracts.aspx?repId=C27030
Emmerton B, Burgess J, Esterle J, Erskine P, Baumgartl T (2018) The application of natural landform analogy and geology-based spoil classification to improve surface stability of elevated spoil landforms in the Bowen Basin, Australia – a review. Land Degradation & Development 29(5), 1489-1508.
| Crossref | Google Scholar |
Evans KG (2000) Methods for assessing mine site rehabilitation design for erosion impact. Soil Research 38(2), 231-248.
| Crossref | Google Scholar |
Hancock GR (2021) A method for assessing the long-term integrity of tailings dams. Science of the Total Environment 779, 146083.
| Crossref | Google Scholar |
Hancock GR, Lowry JBC, Moliere DR, Evans KG (2008) An evaluation of an enhanced soil erosion and landscape evolution model: a case study assessment of the former Nabarlek uranium mine, Northern Territory, Australia. Earth Surface Processes and Landforms 33(13), 2045-2063.
| Crossref | Google Scholar |
Hancock GR, Coulthard TJ, Lowry JBC (2016) Predicting uncertainty in sediment transport and landscape evolution – the influence of initial surface conditions. Computers & Geosciences 90, 117-130.
| Crossref | Google Scholar |
Hancock GR, Lowry JBC, Saynor M (2017) Surface armour and erosion – impacts on long-term landscape evolution. Land Degradation & Development 28(7), 2121-2136.
| Crossref | Google Scholar |
Hancock GR, Duque JFM, Willgoose GR (2020) Mining rehabilitation – using geomorphology to engineer ecologically sustainable landscapes for highly disturbed lands. Ecological Engineering 155, 105836.
| Crossref | Google Scholar |
Hobley DEJ, Adams JM, Nudurupati SS, Hutton EWH, Gasparini NM, Istanbulluoglu E, Tucker GE (2017) Creative computing with Landlab: an open-source toolkit for building, coupling, and exploring two-dimensional numerical models of Earth-surface dynamics. Earth Surface Dynamics 5(1), 21-46.
| Crossref | Google Scholar |
Humphreys GS, Wilkinson MT (2007) The soil production function: a brief history and its rediscovery. Geoderma 139(1–2), 73-78.
| Google Scholar |
Legros JP, Pedro G (1985) The cause of particle-size distribution in soil profiles derived from crystalline rocks, France. Geoderma 36(1), 15-25.
| Crossref | Google Scholar |
McKenna PB, Doley D, Ufer N, Glenn V, Phinn S, Erskine PD (2024) Vegetation recovery of rehabilitated pasture at three coal mine sites following fire disturbance. Ecological Engineering 209, 107383.
| Crossref | Google Scholar |
Minasny B, McBratney AB (2006) Mechanistic soil–landscape modelling as an approach to developing pedogenetic classifications. Geoderma 133(1–2), 138-149.
| Crossref | Google Scholar |
Parker G, Klingeman PC (1982) On why gravel bed streams are paved. Water Resources Research 18(5), 1409-1423.
| Crossref | Google Scholar |
Peterman W, Bachelet D, Ferschweiler K, Sheehan T (2014) Soil depth affects simulated carbon and water in the MC2 dynamic global vegetation model. Ecological Modelling 294, 84-93.
| Crossref | Google Scholar |
Proto M, Courtney R (2023) Application of organic wastes to subsoil materials can provide sustained soil quality in engineered soil covers for mine tailings rehabilitation: a 7 years study. Ecological Engineering 192, 106971.
| Crossref | Google Scholar |
Ritschel T, Totsche KU (2019) Modeling the formation of soil microaggregates. Computers & Geosciences 127, 36-43.
| Crossref | Google Scholar |
Sanchidrián JA, Ouchterlony F, Segarra P, Moser P (2014) Size distribution functions for rock fragments. International Journal of Rock Mechanics and Mining Sciences 71, 381-394.
| Crossref | Google Scholar |
Saynor MJ, Lowry JBC, Boyden JM (2019) Assessment of rip lines using CAESAR-Lisflood on a trial landform at the ranger uranium mine. Land Degradation & Development 30(5), 504-514.
| Crossref | Google Scholar |
Schoorl JM, Sonneveld MPW, Veldkamp A (2000) Three-dimensional landscape process modelling: the effect of DEM resolution. Earth Surface Processes and Landforms 25(9), 1025-1034.
| Crossref | Google Scholar |
Schoorl JM, Veldkamp A, Bouma J (2002) Modeling water and soil redistribution in a dynamic landscape context. Soil Science Society of America Journal 66(5), 1610-1619.
| Crossref | Google Scholar |
Sharmeen S, Willgoose GR (2006) The interaction between armouring and particle weathering for eroding landscapes. Earth Surface Processes and Landforms 31(10), 1195-1210.
| Crossref | Google Scholar |
Sharmeen S, Willgoose GR (2007) A one-dimensional model for simulating armouring and erosion on hillslopes. 2. Long term erosion and armouring predictions for two contrasting mine spoils. Earth Surface Processes and Landforms 32(10), 1437-1453.
| Crossref | Google Scholar |
Sheridan GJ, So HB, Loch RJ, Pocknee C, Walker CM (2000) Use of laboratory scale rill and interrill erodibility measurements for the prediction of hillslope-scale erosion on rehabilitated coal mines soils and overburden. Australian Journal of Soil Research 38(2), 285-298.
| Crossref | Google Scholar |
Slukovskaya MV, Vasenev VI, Ivashchenko KV, Morev DV, Drogobuzhskaya SV, Ivanova LA, Kremenetskaya IP (2019) Technosols on mining wastes in the subarctic: efficiency of remediation under Cu-Ni atmospheric pollution. International Soil and Water Conservation Research 7(3), 297-307.
| Crossref | Google Scholar |
Stockmann U, Minasny B, McBratney AB (2014) How fast does soil grow? Geoderma 216, 48-61.
| Crossref | Google Scholar |
Taylor RK (1988) Coal Measures mudrocks: composition, classification and weathering processes. Quarterly Journal of Engineering Geology and Hydrogeology 21(1), 85-99.
| Crossref | Google Scholar |
Taylor RK, Spears D (1970) The breakdown of British coal measure rocks. International Journal of Rock Mechanics and Mining Sciences & Geomechanics Abstracts 7(5), 481-501.
| Crossref | Google Scholar |
Temme AJAM, Vanwalleghem T (2016) LORICA – a new model for linking landscape and soil profile evolution: development and sensitivity analysis. Computers & Geosciences 90(part B), 131-143.
| Crossref | Google Scholar |
Tucker GE, Hancock GR (2010) Modelling landscape evolution. Earth Surface Processes and Landforms 35(1), 28-50.
| Crossref | Google Scholar |
van der Meij WM, Temme AJAM, Lin HS, Gerke HH, Sommer M (2018) On the role of hydrologic processes in soil and landscape evolution modeling: concepts, complications and partial solutions. Earth-Science Reviews 185, 1088-1106.
| Crossref | Google Scholar |
Vanwalleghem T, Stockmann U, Minasny B, McBratney AB (2013) A quantitative model for integrating landscape evolution and soil formation. Journal of Geophysical Research: Earth Surface 118(2), 331-347.
| Crossref | Google Scholar |
Walker PH, Coventry RJ (1976) Soil profile development in some alluvial deposits of eastern New South Wales. Soil Research 14(3), 305-317.
| Crossref | Google Scholar |
Welivitiya WDDP, Hancock GR (2022) Calibration and validation of the SSSPAM coupled soilscape–landform evolution model for simulating short-term gully development on a post-mining landform. Earth Surface Processes and Landforms 47(11), 2779-2795.
| Crossref | Google Scholar |
Welivitiya WDDP, Hancock GR (2023) Hillslope and catchment scale landform evolution – predicting catchment form and surface properties. Environmental Modelling & Software 166, 105725.
| Crossref | Google Scholar |
Welivitiya WDDP, Hancock GR (2024) Quantifying mine waste rock physical weathering rate and processes for improved geomorphic post-mining landforms. Geomorphology 463, 109357.
| Crossref | Google Scholar |
Welivitiya WDDP, Willgoose GR, Hancock GR (2019) A coupled soilscape–landform evolution model: model formulation and initial results. Earth Surface Dynamics 7(2), 591-607.
| Crossref | Google Scholar |
Welivitiya WDDP, Willgoose GR, Hancock GR (2021) Evaluating a new landform evolution model: a case study using a proposed mine rehabilitation landform. Earth Surface Processes and Landforms 46(11), 2298-2314.
| Crossref | Google Scholar |
Wells T, Willgoose GR, Hancock GR (2008) Modeling weathering pathways and processes of the fragmentation of salt weathered quartz-chlorite schist. Journal of Geophysical Research: Earth Surface 113(F1),.
| Crossref | Google Scholar |
Yang M, Yang Q, Zhang K, Wang C, Pang G, Li Y (2023) Effects of soil rock fragment content on the USLE-K factor estimating and its influencing factors. International Soil and Water Conservation Research 11(2), 263-275.
| Crossref | Google Scholar |
Zhang Y, Slingerland R, Duffy C (2016) Fully-coupled hydrologic processes for modeling landscape evolution. Environmental Modelling & Software 82, 89-107.
| Crossref | Google Scholar |