Impact of soil conditions on hydrology and water quality for a brown clay in the north-eastern cereal zone of Australia
D. M. Freebairn A B D , G. H. Wockner B , N. A. Hamilton B and P. Rowland B CA Natural Solutions Environmental Consultants, PO Box 1156, Fortitude Valley, Qld 4007, Australia.
B Previously Queensland Department of Natural Resources and Water and Queensland Department of Primary Industries and Fisheries, Toowoomba and Roma, Qld, Australia.
C Queensland Environment Protection Agency, 160 Ann Street, Brisbane, Qld 4012, Australia.
D Corresponding author. Email: david.freebairn@gmail.com
Australian Journal of Soil Research 47(4) 389-402 https://doi.org/10.1071/SR07054
Submitted: 11 May 2007 Accepted: 6 March 2009 Published: 30 June 2009
Abstract
Hydrology and water quality impacts of alternative land management practices are poorly quantified for semi-arid environments in the northern Australia cropping zone, yet wide-scale changes in tillage practices and land use were being recommended based on experience from other environments.
The objective of this study was to explore changes in soil profile and catchment hydrology and water quality associated with different soil surface conditions created by different tillage and grazing practices. Soil water, runoff, and suspended sediment concentrations were monitored on 4 contour bay catchments over an 18-year period. Soil conditions were described by soil moisture, soil cover, and surface roughness in order to explore functional relationships between management, hydrology, and water quality. The site was chosen to represent the drier margins of cropping in southern Queensland where clay soils with high water-holding capacity, in conjunction with fallowing to store water for later crop growth, are an essential risk management tool.
Accumulation of soil water in fallows was inefficient, with fallow efficiencies ranging from –7 to 40% due to high evaporation and runoff losses. Runoff amount was determined by soil water content, which was strongly influenced by antecedent rainfall, water use, and evaporation patterns. Surface cover and roughness had subtle influences on runoff, and a greater effect on suspended sediment concentration. Runoff and suspended sediment losses were considerably lower under pasture than cropping.
A participative approach between farmers and scientists was demonstrated to be an efficient method to carry out an extensive and long-term catchment study at a remote location. This study provides benchmark data for future hydrologic and water quality investigations.
Introduction
Extensive cropping along the drier western margins of the north-eastern cropping zone has been considered ‘marginal’ in terms of both profitability and natural resource maintenance because of unreliable rainfall, low yields and in many cases shallow soils with declining fertility (Queensland Department of Primary Industries 1984; Dalal and Mayer 1986). Cropping is mostly restricted to the clay soils which have relatively high water-holding capacity and good natural fertility, with many of these soils associated with brigalow (Acacia harpophylla) vegetation. These soils have been substantially cleared for cropping and grazing since their productive capacity was recognised (Skerman 1959), and significant government-sponsored land development schemes were introduced to encourage this development (Payne 1959). The Maranoa region represents a significant production area for broadacre cropping, with many successful farm businesses utilising what has been Australian farmers’ response to a continual cost/price squeeze and unreliable rainfall – large areas, maintaining low costs of production; a mix of grazing and cropping; and adopting new technology when it becomes available (Freebairn et al. 2006).
Erosion associated with cropping was recognised as a serious issue across all cropping regions of Queensland in the 1930s (Carey et al. 2004), with the construction of contour banks to reduce slope length being the most common preventative practice. Catchment studies on the eastern Darling Downs had shown dramatic reductions in erosion associated with the adoption of conservation tillage practices (Freebairn et al. 1986), but there was no quantification of impacts of different tillage practices on hydrology, erosion, or production for the Maranoa region. In the 1970s and 1980s there was concern that expansion of cropping further west onto less resilient soils might accelerate natural resource degradation (Queensland Department of Primary Industries 1984). Broad-scale trials and detailed experimentation began in the 1970s and 1980s to explore the viability of reduced tillage systems (Freebairn and Boughton 1981; Ward and Norris 1982; Ward et al. 1991). Thomas et al. (2007) reviewed 12 tillage and catchment studies across the cropping zone of Queensland; in summary, conservation tillage practices have potential benefits for production and soil resource stability in most areas. Different soil types and production systems that produce less crop residue make the translation of results from more favourable areas problematic. Such direct translation would certainly lack credibility with the farming and soil conservation community.
This study began in late 1982, to measure runoff, soil erosion, and crop production implications of alternative tillage practices. It was expected that results from this study would complement the expanding database from related catchment and tillage studies in Queensland and northern New South Wales (Thomas et al. 2007). This study has many elements in common with catchment studies near Capella (Sallaway et al. 1990; Carroll et al. 1997) and Theodore (Lawrence et al. 1994; Cowie et al. 2007) in Central Queensland, and Greenmount and Greenwood on the eastern Darling Downs (Freebairn and Wockner 1986a).
Since the study area was 350 km from the main ‘science base’ in Toowoomba, and the managed area was 25 ha. The study did not follow a traditional experimental plan with set treatments. Treatments were designed in consultation with the land owner, with the explicit intent that a broad range of soil surface conditions be created in the 3 or 4 catchments as was practical. With the added intervention of natural climate variability, it was unrealistic to expect that a defined set of treatments could be simply compared. We reflect on the strengths and weaknesses of this approach.
This paper reports on the dynamics of soil water, runoff, and water quality over an 18-year period for a range of tillage practices and improved pastures on a soil that represents a large area of northern New South Wales and southern and central Queensland.
Materials and methods
The study used a set of 4 ‘paired’ contour bay catchments to monitor soil water, catchment hydrology, and water quality aspects of different land management options within a real farm context. Contour bays were chosen as the unit of study as they represent the smallest hydrologic unit that can be managed separately, whether this be crop or pasture type, tillage, or grazing management. This scale of study allowed for typical farm machinery to be used in implementation of ‘treatments’, applied by the farmer yet still be manageable from a hydrology and water quality instrumentation and logistics viewpoint.
Site
The catchment site is on ‘Fairlands’ (26°28′S, 149°06′E), 10 km north of Wallumbilla and 45 km ENE of Roma. It lies in the Maranoa River catchment, a subcatchment of the Queensland Murray-Darling system. The sloping (2%) brown clay soil supported brigalow (Acacia harpophylla), poplar box (Eucalyptus populnea), and belah (Casuarina cristata) vegetation before clearing in 1963 and has been cropped continuously since 1966. The relationship between this site and related tillage and catchment studies in Queensland is shown in Thomas et al. (2007).
Because of the remoteness of the study area from logistic support, the site was selected based on the following criteria, in order of priority: supportive, interested and established landowner; wet weather access; access to equipment that allowed for chemical weed control (spray rig); a blade plough and traditional chisel, scarifier, and disc implements to provide for a wide range of tillage options; and a soil type and topography representative of >20% of the region.
Climate
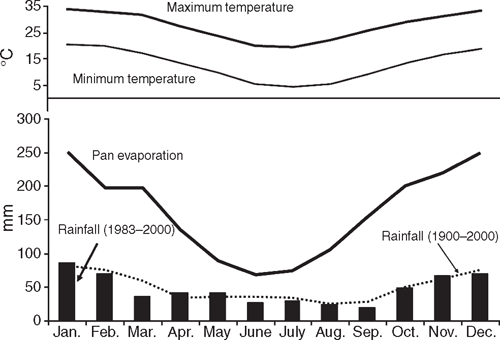
Climate of the region is described as semi-arid subtropical (Bureau of Meteorology based on the Koeppen classification system: www.bom.gov.au). Rainfall in the region is highly variable with an annual coefficient of variation of 30%. Over the 18-year period (1983–2000) annual rainfall varied between 329 and 869 mm with a mean of 577 mm, 70% falling in October–March. Long-term (1900–2000) annual rainfall is 584 mm. Summer rainfall is characterised by intense convective storms and long dry periods with high temperatures and evaporative demand. Average annual evaporation (Class A pan) is 2000 mm with maximum daily values commonly reaching 15 mm. Maximum temperatures in summer frequently exceed 38°C while frosts are common in winter months, restricting planting dates to avoid frost at anthesis. A summary of temperature, evaporation, and rainfall conditions is presented in Fig. 1.
|
Soil type
The predominant soil type is a Grey Vertosol with alkaline surface horizons over strongly acid clays (Isbell 1996). In its virgin state, the soil is most closely related to a Red Brown Earth and is derived from Glauconitic lithic sandstone. Once cultivated, the mixing of the original surface results in the soil being described as a brown clay Ug5.32 (Northcote 1979) or varying between a Grey Vertosol and a Black Sodosol (Isbell 1996). The surface varies from weakly self-mulching to moderately crusted to weakly hard-setting depending on environmental conditions including recent rainfall and soil cover, and exhibits cracking and self-mulching characteristics when dry. The soil has a plant-available water capacity (PAWC) of 140–160 mm in the top 1.5 m. Salts are concentrated at 0.60–0.90 m, and 70% of potential plant available water is held in the top 0.60 m. Infiltration rates are very high when the soil is dry and cracked. However, closure of the cracks through wetting and swelling and formation of surface seals due to instability of the soil under rainfall reduces infiltration rates (Smith et al. 1984; Connolly et al. 1997). Soil carbon in the surface 0.1 m ranges from 0.7 to 0.9%, although before 25 years of cultivation the value was ~2% (Connolly et al. 1997). A summary of soil chemical and physical properties is provided in Table 1.

|
Implementation of catchment treatments
The objective of the study was to explore changes in soil and catchment hydrology associated with different soil surface conditions rather than a comparison of several arbitrary ‘defined’ tillage regimes. It was anticipated that seasonal variability would dictate that any such ‘treatments’ would be different from year to year, and in some cases, surface conditions from one treatment in one year may have similar conditions to others treatment in other years (Freebairn and Wockner 1986a). Indeed, in one fallow, all 4 catchments had similar management and soil conditions due to crop failure.
The logistics of carrying out a catchment study several hundred kilometres from a research institution presented some challenges. Experience from previous studies had shown that runoff and erosion are sporadic processes, and maintenance of equipment was essential to capture rare and extreme events (Freebairn and Wockner 1986a; Pickett 1991). Implementation of agronomic practices to create a range of surface conditions using typical research equipment was impractical given the larger contour bay catchment areas characteristic of lower slopes in the study area, and the necessity that agronomic management had to be of a high standard for both practical and scientific credibility.
The study did not start out to be a participatory on-farm research activity, but developed into a partnership research project, a product of logistics necessity and recognition that farmer skills and insights were essential for successful management of cropping in this challenging environment. The methodology was modelled on Farming Systems Research-Extension (Cornwell et al. 1994). This methodology has 3 key principles: joint effort by researchers, extensionists and farmers to design, test and modify improved agricultural technologies appropriate for local conditions; agriculture is seen as a holistic system in which all important interactions that affect its performance should be considered; and a multidisciplinary perspective to problem analysis, technology design, trial implementation, and evaluation.
Often, what would have been timely in a scientific experimental sense was constrained by other issues. For example, timing of application of herbicides was determined by conditions of the target weeds but also consideration of impact beyond the trial (availability of labour with conflicting on-farm demands, damage to neighbouring crops and pastures, and impact of odour). Hence, treatments more closely mimicked reality on-farm.
Using farmers as co-researchers also identified issues that would not have been apparent to scientists who were not in constant contact with the trial. For example, the farmers observed that summer grasses growing on this soil type often germinate and develop early growth that exceeds the supply of moisture, resulting in the development of moisture stress. Stressed grass weeds are more difficult to kill with herbicides and timeliness of application becomes crucial to success.
Intentions for tillage and crop management were discussed between the farmer and science team at the outset of each summer fallow. The broad intention was to create maximum contrast in surface conditions between catchments, whether this be soil cover or roughness, produced by a range of tillage options. Tillage options available included no tillage with chemical weed control, subsurface or blade tillage which created soil disturbance but maintained stubble residue on the surface, through to aggressive tillage to remove crop residues. This latter approach most closely matched regional practice at the start of the study. There was also no intent to maintain any one management regime in a set catchment, as it was not expected that residual or cumulative benefits could be detected at this scale of study without replication (Thomas et al. 2007). Such comparisons are best carried out using replicated plot studies where more control can be exercised over treatments and spatial variability is better described. Tillage regimes were rotated annually to minimise bias but pasture treatments had to be maintained for several years (5 and 8 years for Bay 1 and 2, respectively) as pastures take some years to establish. Replication was regarded as impractical due to the scale of study introducing further variability with increased scale. The scale of study – contour bay catchments of 2–6 ha – was regarded as a compromise between minimising spatial variability in soil type and rainfall, applying locally relevant management practices using farm machinery, and logistics of measuring water quantity and quality variables.
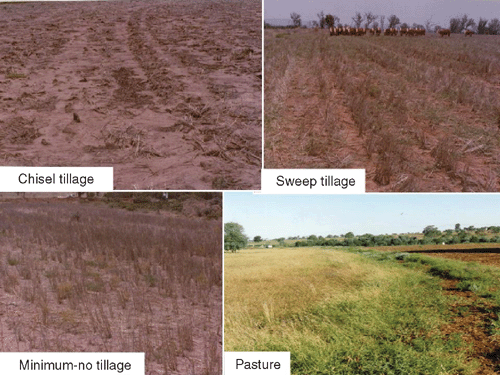
In practice, at any one time, one catchment was intended to be maintained with minimum or no tillage, another with maximum tillage and stubble reduction, and the third catchment intermediate between these extremes. As results emerged, catchment treatments were amended to explore other options. For example, relatively high runoff and subtle differences between treatments led to the exploration of gypsum application (5 t/ha) on catchment hydrology following a simple rainfall simulation study that indicated some possibilities of reducing runoff when gypsum was applied as a soil amendment. No response to gypsum was observed, so this line of investigation was not pursued further and is not discussed in this paper. Pasture was established later in the study (1990) to further explore the possibilities of a pasture phase as a practice to improve soil structure and infiltration characteristics (Connolly et al. 1997, 1998). The breadth of conditions created by different management regimes is shown in Fig. 2.
|
Catchment description
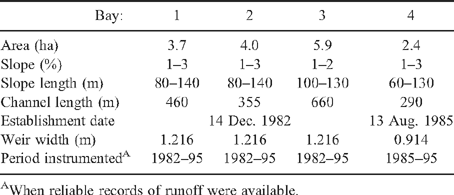
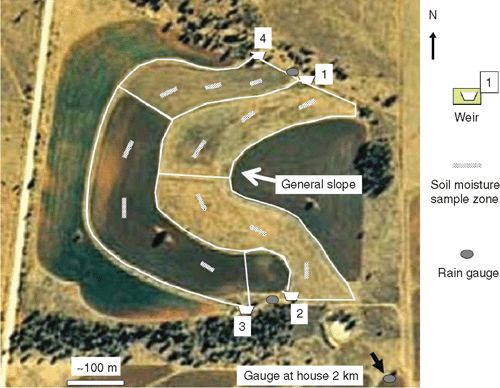
The study was designed based on experience from the eastern Darling Downs where catchments of ~1 ha were instrumented to measure runoff and sample runoff water (Freebairn and Wockner 1986a). Given the design philosophy mentioned above, the need to fit in with farmer practice and equipment, and lower land slopes, catchment areas were significantly larger than the steeper eastern Darling Downs (Table 2). An aerial photograph of the site is shown in Fig. 3.
|
|
Crops and pastures
Wheat was sown annually in the crop catchments, planted in the May–June depending on planting rainfall, with a median planting date of 1 June. Varieties sown were based on time of planting, rainfall, and regional variety recommendations. Wheat was typically harvested within 2 weeks of the beginning of November using the land owner’s harvester. Crops were successfully established in all years, with two seasons resulting in crop failures (1987, 1994).
Pastures were established in Bay 2 in 1990 and Bay 1 in 1996 with Buffel grass (Cenchrus ciliaris) and snail medic (Medicago secetrllata) being the predominant species. Pastures were grazed with cattle when sufficient feed was available and crops were not growing (December–March). A summary of data is available as Accessory Publication on journal’s website.
Rainfall and runoff measurement and water sampling
Rainfall was measured using a network of three tipping bucket recording rain gauges, a manual rain gauge at each side of the catchment, and a gauge at the farm residence ~2 km south. This network provided for some redundancy for equipment failure, and a measure of spatial variability.
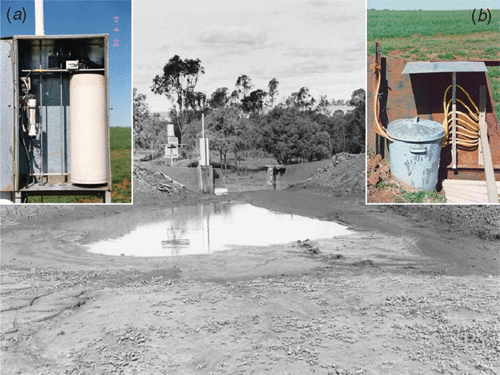
A Cipoletti or trapezoidal weir design was chosen for its simplicity of construction and installation, ability to be simply constructed to match differing catchment areas, and sensitivity to measure total runoff and peak discharge with reasonable resolution (~0.5 mm/h). Figure 4 shows a view of a weir, water level recorder and rising stage water sampling equipment installed at all catchment outlets.
|
Samples of runoff water were collected at the weir outlet to determine suspended sediment concentrations. Rising stage samples were collected automatically at 5, 10, 20, 30, 40, and 50 cm stage heights with samples being drawn from mid flow depth. Method of calculating a weighted mean sediment concentration is presented in detail by Freebairn and Wockner (1986b), with concentration at each height weighted by its relative discharge at each stage.
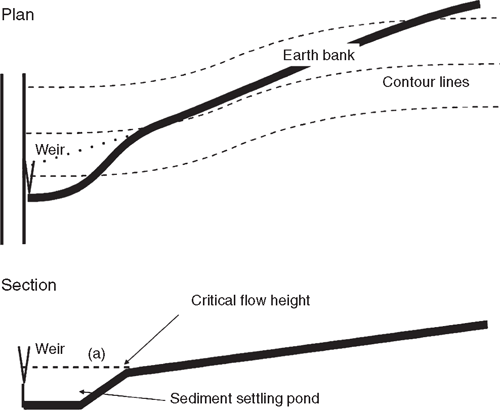
Water approach conditions immediately upstream of each weir were modified to: (i) allow bedload to be deposited well before the weir crest ensuring the weir rating remained stable; (ii) allow bedload to be quantified; (iii) reduce backwater effects of the weirs in the channels; and (iv) to provide some protection against overtopping of the weirs in extreme events. Figure 5 shows the changes in design of entrance conditions to each weir. When the water level reaches a critical point (a on Fig. 5), discharge rates are attenuated as water accumulates in the contour channel. Runoff volume is not affected, but measured peak runoff rates are less than for an uncontrolled outlet. It was recognised from previous experience that large events are responsible for the majority of runoff and soil loss, and it is these extreme events that should be captured without equipment or structure failure.
|
Water samples collected on the rising limb of hydrographs provide for a robust estimate of total suspended sediment eroded from the hillslope (Freebairn and Wockner 1986b). Entrainment of ‘suspended’ material from the graded channel was unlikely due to the low channel slope (0.25%) and consequent low stream power of channel flow. The graded channels were typically aggraded with coarse eroded material from the hillslope. The use of rising stage samples as a reliable estimate of total sediment load assumes that the sediment concentration–discharge relationship for the falling stage is similar to the rising. This assumption rarely holds, yet Freebairn and Wockner (1986b) demonstrated that this approach provided a pragmatic and reasonable estimate of total suspended load for most events at this scale of study (see also Fig. 13 demonstrating relatively triangular hydrographs).
Total soil movement, as described by Freebairn and Wockner (1986a) was not measured in this study, although that was an original intent. Rills and sediment deposits were not as distinct as observed in smaller catchments (<1.2 ha), steeper slopes (>5%) and more aggregated soils, making measurement difficult and prone to large errors.
Soil conditions
Surface cover was measured after each runoff event, after cultivation operations, and at soil sampling and periodic site visits. Visual estimates of surface cover were made using 1-m2 quadrats at 20 random locations in each bay. A diary was kept of all tillage, planting, harvest, and spray operations.
Surface roughness was described using a semiquantitative scale based on a visual assessment made at the same time as soil cover. A smooth surface with no microrelief was rated as roughness 1, while a soil surface with large clods, distinct furrows and maximum potential for surface storage was rated 5. This visual estimate approach was supported by a photographic record.
Soil moisture was determined at 9 locations in each bay to a depth of 1.5 m. Soil samples were collected using a hydraulically driven 30-mm-diameter steel tube. Each core was separated into intervals of 0.1–0.10, 0.10–0.30, 0.30–0.60, 0.60–0.90, 0.90–1.20, and 1.20–1.50 m and moisture content determine gravimetrically. A mean of the 9 samples per depth was used in further analyses. Bulk density was measured on several occasions using 0.10-m-diameter cores, and used to convert gravimetric values to a volumetric basis. To determine a value for driest and wettest soil moisture at each depth, and to estimate a PAWC for the site, the mean (n = 45 for each depth increment) of the 5 driest and wettest samplings were used. Soil moisture was determined 3 times per year: post harvest, mid fallow, and pre-planting, typically November, February, and May.
Other measurements
Grain yield was determined by harvesting 400-m-long strips in each bay using a commercial harvester (6 m wide). It was recognised that this unreplicated study could not be used to make inferences about yields associated with different practices but provided an indication of the sites productivity.
Evaporation (E) in fallows was determined by difference where E = rainfall – runoff – change in soil water over the fallow. Drainage was assumed to be negligible for the purpose of soil water calculations but detailed analysis of chloride distribution have provided estimates of this water pathway, being in the order of 5–15 mm/year (Tolmie et al. 2003). Water use by weeds was ignored, although this was clearly a significant loss mechanism in some seasons when weed control was less than optimum.
Fallow efficiency is defined as the change in plant-available soil water over a fallow period as a percentage of rainfall. Soil moisture was measured at the beginning, middle, and end of fallows.
Analytic approach
A descriptive and statistical approach was used in analysing these data. Given the espoused philosophy of creating a range of soil conditions rather than a comparison of set treatments, data for all events where runoff occurred on any catchment were analysed using multiple regression to explore relationships between dependent variables such as runoff, peak runoff rate (Qp), and sediment concentration and independent variables, rainfall (P) and rainfall intensity (I30, maximum 30 min intensity), an index of soil moisture (P10, rainfall in the previous 10 days), soil cover, and roughness. Squared terms of some variables were explored if a relationship was thought to be non-linear, but no interaction terms were used given the relatively small dataset (n = 133).
Results and discussion
Water accumulation in the fallow period
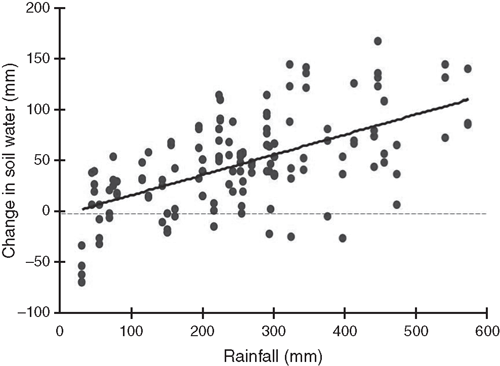
Measuring soil water 3 times per year for 18 years provided a substantial database for statistical analysis. Figure 6 shows the large variation in water accumulation as a function of rainfall, with rainfall between sampling periods explaining only 34% of the variation. Soil cover and roughness were not significant factors in determining soil water accumulation. Water accumulation was insignificant in ~20% of fallow periods, attributable to high evaporation, and small falls of rain which soon evaporate, and in a few cases weed growth.
|
A characteristic of rainfall in this semi-arid subtropical environment is the large number of small rainfall events, with 73% of rain days and 30% of total rain depth with daily falls <12.5 mm. Plant-available water exceeded 120 mm in only 7 fallow periods over the 18-year record and required fallow rainfall of 350–570 mm to accumulate this soil water.
Table 3 summarises the water balance of fallows over the duration of the study. Clearly, the practice of fallowing to store water is inefficient, with an average fallow efficiency of 19%. Evaporation accounts for 73% of the water balance while runoff represents 11%. The large variation in water storage patterns indicates that using a simple rule of thumb such as ‘20% of fallow rainfall is stored in the soil’ can often be misleading, requiring either direct measurement of soil water (Gardner 1988) or more mechanistic approaches for estimating water storage (Freebairn et al. 1994). Winter crop production in the region relies heavily on stored soil water, with an average 62% of crop transpiration coming from stored water present in the soil at planting time (Thomas et al. 2007).

|
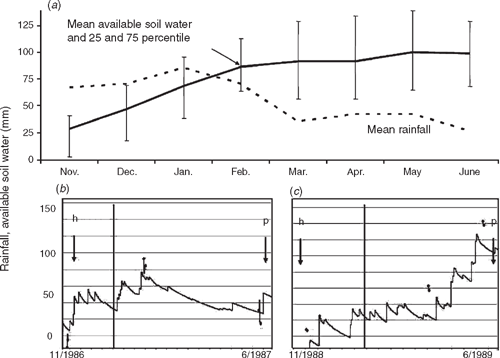
In order to provide a more generalised picture of water storage in this semi-arid environment, ‘Howleaky?’, a daily water balance model (Rattray et al. 2004; McClymont et al. 2006) was calibrated to the Wallumbilla data (Accessory Publication available on journal’s website). An average soil water accumulation pattern is presented in Fig. 7, along with measured and estimated soil water for 2 contrasting fallows. The fallow of 1986/87 showed early water storage that was subsequently lost in a dry late fallow period. In contrast, 1988/89 showed a steady water accumulation with a net gain of ~130 mm of plant-available water. No doubt it is somewhat frustrating for farmers that fallowing is so essential for reliable winter crop production yet is so inefficient.
|
Effect of crops and pasture on the apparent plant available water capacity
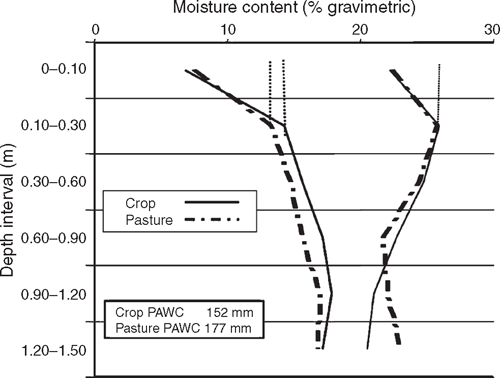
Towards the later part of the study period (1990 onward), cropping and pasture were concurrent on 2 catchments. Figure 8 shows the driest and wettest profiles recorded over 10 and 18 years under annual wheat cropping and improved pasture. PAWC was 156 mm under cropping and 180 mm under pasture. While the difference in PAWC between pasture and crop was only 24 mm, it suggests that the pastures have a slightly greater capacity to extract soil water, and also to store extra soil water at depth. In both cases it is also clear that water is extracted beyond 1.5 m depth, although changes in moisture content at depth are small.
|
Hydrology
Catchment uniformity
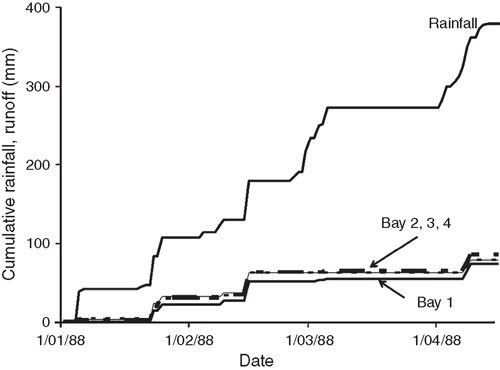
A major uncertainty in comparing runoff from different ‘treatments’ in a catchment study of this scale is attributing differences in runoff to treatment conditions and inherent catchment differences. In this study there was no ‘calibration period’ such as the 17 years employed at the Brigalow Catchment Study near Theodore in Central Queensland (Cowie et al. 2007; Thornton et al. 2007). While the site selected for the catchment study appeared to have the same soil type across the area, natural variability was also apparent with some variation between the ridge and sides of the catchments near the weir outlets. A failed winter crop in 1988 provided an opportunity to compare the 4 catchments by applying the same tillage practices to all catchments, resulting in similar surface cover and roughness (Fig. 9). Runoff varied between the 4 catchments from 18.8 to 21.1% of rainfall over the 4-month period. While this is a short period to describe hydrologic variability it demonstrated that the catchments can be regarded as reasonable hydrologic ‘pairs’.
|
Average annual runoff from the winter-cropped catchments was 11% of rainfall (Table 3). Runoff was episodic, reflecting variable rainfall, high evaporative conditions, and soils capable of storing 150 mm of plant-available water. Daily runoff >1 mm was observed on 63 occasions over a 15-year period or an average of 4 days per year. Since these soils crack when they dry, runoff only occurs when the soil profile is approaching full water capacity, or in extreme cases when rainfall intensity is very high and surface crusting occurs (Connolly and Freebairn 1995). Table 4 demonstrates the extreme variability of this environment, showing rainfall, runoff, and suspended sediment losses from 2 contrasting years. Runoff can be as much as 21% of rainfall in an above-average year or 1% in a dry year. While rainfall is erratic, its summer-dominant distribution and summer fallow being a period of moisture accumulation results in most runoff occurring in January and February for a winter crop–summer fallow rotation (Fig. 10). While rainfall declines significantly after February, runoff is still quite common in March–May, as soil moisture is increasing and evaporation rates are declining. Erosion rates can be significant in the autumn when runoff coincides with low soil cover conditions.

|

|
Influence of catchment conditions on hydrology
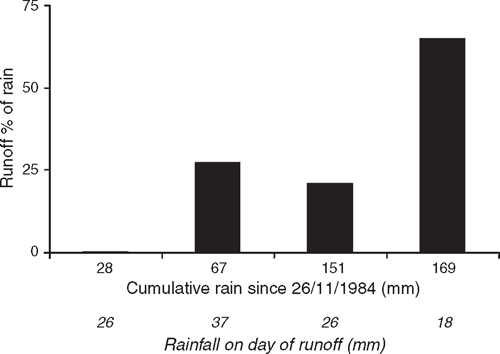
Multiple regression was used to explore relationships between runoff and rainfall, I30, P10, cover, and roughness for all days when runoff occurred on any catchment for the period 1983–1996 where reliable estimates of all variables were available (Table 5). After daily rainfall, soil moisture was the most important factor controlling whether rainfall will result in runoff. Cracking clay soils have high water-holding capacity and, when dry, can absorb a high proportion of their moisture deficit even when rainfall intensity is high. Figure 11 demonstrates the importance of antecedent rainfall on runoff from a series of rain events following harvest when the soil was near empty. When residuals of the regression models (Table 5) with either cover or roughness excluded were regressed with roughness and cover, respectively, both factors explained ~7% of the variation in runoff. A roughness value of 5 or cover of 80% reduced event runoff by ~5 mm. Cover and roughness have similar impact on runoff. Littleboy et al. (1992) incorporated the ability to alter runoff estimates in a daily water balance model based on dynamic estimates of cover and roughness created by tillage using a similar approach to that proposed by Freebairn et al. (1989a).

|
|
In situations where little cover is available (crop failure, grazing, aggressive tillage), creation of roughness is the only management option available to reduce runoff. Typically, if cover is maintained, then roughness associated with minimum tillage is likely to be small, something of a double-edged sword in improving infiltration for this soil type and climate. Experience during the study showed that it was often difficult to create high levels of soil cover (median 12%) due to small crop biomass production. Clearly, runoff is a much more dynamic process, influenced by more factors than tested here, or these independent variables did not adequately describe soil conditions. The P10 variable is unlikely to describe the full impact of moisture status and distribution in a soil with a PAWC of 140 mm to a depth of 1.5 m. Models that account for soil water in a more dynamic manner, such as a daily water balance model, are likely to provide better estimates of runoff and have greater generality in application (Littleboy et al. 1992; Rattray et al. 2004).
A comparison of runoff from pairs of catchments with contrasting conditions is presented in Table 6. A 13-year comparison of 2 tillage regimes, traditional tillage where cultivation was used to control weeds and conservation tillage where weeds were controlled with herbicides, resulted in slightly higher cover and less roughness in the conservation tillage. The 1% difference in runoff over this period was of a similar magnitude to differences observed between catchments (Fig. 9). Differences in cover levels between tillage ‘treatments’ were relatively subtle (Table 6), in part due to the often low residue levels from small biomass produced from water-stressed crops and partly due to the implementation of tillage regimes 1–2 months after harvest, as is normal practice when there are few weeds to control.

|
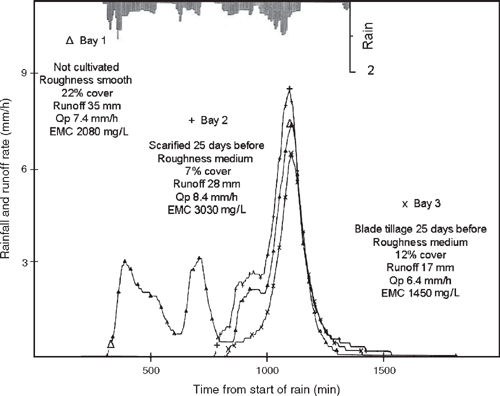
Hydrographs for a significant runoff event where there is contrast in both cover and roughness between catchments are presented in Figure 12. Bay 1 had little roughness or surface storage and higher cover; runoff was initiated 8 h and 25 mm of rain before the other catchments with medium roughness. In this instance, surface storage associated with roughness and probably less continuous surface crusting associated with tillage 25 days prior has resulted in reduced runoff. Overall, these data do not make a strong case for tillage management affecting water balance, although it is clear that both cover and roughness are important factors in controlling infiltration, which in some cases are counteractive. That is to say that to maximise soil cover, tillage needs to be eliminated or minimised, and thus roughness is also minimised. It is clear that in the absence of cover, tillage which establishes roughness will improve infiltration. Event mean sediment concentrations reflect the peak runoff rates (Fig. 12).
|
A similar regression analysis was carried out describing peak runoff rate as a function of independent variables runoff, I30, cover, and roughness. Runoff, I30, and cover were all significant descriptors with the regression model explaining 52% of variability in peak runoff. Cover of 50% is likely to reduce peak runoff rates by 4 mm/h; while statistically significant, is not of great practical impact hydrologically, but may influence erosion via overland flow velocity. The generally low cover levels observed in this study are a feature of the environment, and while high cover levels can be found in some years after above-average crop production, the norm is for low biomass production and subsequent cover levels.
Sediment concentration
Water quality data were available for most runoff events over a 13-year period 1983–95. In order to explore functional relationships between suspended sediment concentration and potentially important variables, multiple linear regression was used with the following variables: rainfall, runoff, Qp, I30, P10, cover, and roughness (Table 7).

|
Peak discharge (Qp) was the most important factor influencing sediment concentration (accounting for 41% of variation) as it best represents stream power (Bagnold 1977), a measure of energy available for detachment and transport of soil in runoff. Cover was also influential in reducing sediment concentration and is consistent with other studies as reflected in the Universal Soil Loss Equation (USLE; Wischmeier and Smith 1978). Roughness and antecedent moisture were also significant factors in determining sediment concentration, a surprise given the inherent variability in the data. Govers and Loch (1993) showed that moist soil had greater resistance to erosion than dry soil on similar clay soils, attributable to lower rates of aggregate failure associated with slower soil wetting. Rainfall intensity was not a significant factor, most likely because of the weak relationship between runoff and rainfall intensity, with runoff being controlled more by antecedent moisture, which is highly time-variable due to evaporation and transpiration patterns.
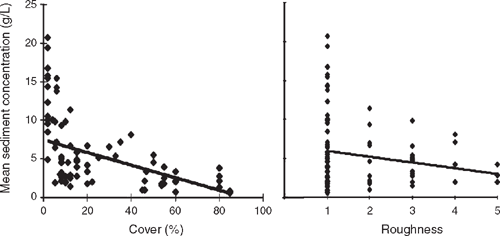
Since cover and roughness are the 2 physical conditions that can be modified by management, their relationship to sediment concentration is presented in Fig. 13; the scatter in relationships is not unexpected but it is notable that very few sediment concentrations exceed 5 g/L when soil cover is >20%, consistent with many erosion studies. The link between runoff rate, cover, and roughness all indicate that they interact to reduce overland flow velocity, and subsequent detachment and transport of sediment.
|
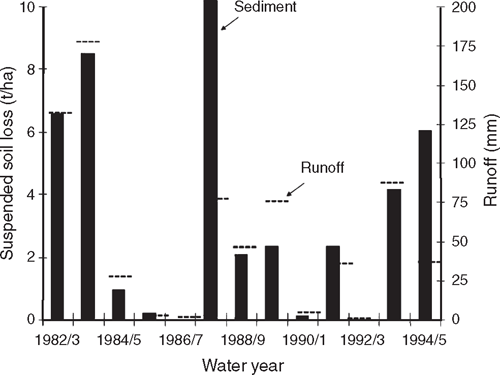
Sediment concentration in runoff is driven by peak runoff rate, cover, and roughness, while peak runoff is influenced by rainfall intensity, runoff depth, and cover. Annual runoff and sediment losses are closely linked, although in some years high runoff has not resulted in high erosion (1987/88), reflecting variable rainfall and soil conditions (Fig. 14).
|
Suspended sediment values reported in this paper are 5–10% of soil movement rates reported by Freebairn and Wockner (1986a) for a black earth soil on a 6% slope at Greenmount. A typical USLE slope–slope length (LS) factor for the site is 0.3 (Wischmeier and Smith 1978) in comparison to a value of 1.1 for Greenmount. Assuming a similar erodibility for the Wallumbilla Red Brown Earth and Greenmount Black Earth and 14% of total soil movement being observed as suspended sediment (M. Silburn, pers. comm.), the 10–20-fold difference between suspended loss at Wallumbilla and total soil movement at Greenmount appears to be in reasonable harmony with the USLE (Freebairn et al. 1989b). Clearly this superficial analysis requires more rigour but is added to put erosion rates from this study in context with other studies. A summary of data is available as Accessory Publication on journal’s website.
Reflections on the process and approach
The site provided a focal point for a range of other activities including: comparison of crop establishment using different tines and presswheels (Radford and Nielsen 1983; Ward et al. 1991); crop nutrition (nitrogen and phosphorus); pasture establishment in a cropping lands; potential role for gypsum in soil amelioration; detailed erosion studies (Govers and Loch 1993); demonstration of principles of infiltration and influence of surface conditions using rainfall simulation (Cawley et al. 1992); measurement of deep drainage for cropping, pasture, and native vegetation (Tolmie et al. 2003); and improved understanding of the soil as a medium for storing and providing a water and nutrient supply for crops and pastures.
This site was 1 of 3 concurrently managed by a team of 3 part-time scientists, and 25% of the time of an experienced technical officer. All tillage, planting, spray, and harvest operations were managed by the farm family at their cost, and they were key members of the decision-making team dealing with day-to-day and strategic operations. This collaboration imparted a strong level of ownership in a group with a diverse group of skills. Local supervision by the farm family was essential in the application of good agronomy, timely collection of samples, and, very importantly, maintenance of equipment over 18 years. The frequent long periods of inactivity between runoff events allowed the team to focus on other tasks until the catchments became wet and runoff was expected. The wide range of conditions created by the management philosophy used in this study allowed for a statistical exploration of the impact of different soil conditions on water storage, runoff, and water quality.
A perceived negative aspect of the approach was that the scientists sometimes felt they had less control (than they were used to!) over timeliness of some operations; at times equipment failures resulted from damage by stock (a reality on a mixed enterprise farm) and the scientists’ lack of attention to the site due to large distances between the site and office. The ‘flexible’ approach to treatment design made it difficult to directly compare ‘treatments’, although as mentioned, high variability in implementation of management practices in this environment makes such comparisons problematic regardless of experimental design.
This study has shown that unreplicated catchments of ~2–6 ha can be sufficiently well described to allow valid comparison of treatments hydrologically, as long as the comparisons have strong contrast (pasture v. crop). If conditions are well described, statistical and water balance model approaches can be used to describe much of the variability in their behaviour. The use of farm-scale machinery and practices that are within the realms of possibility for farmers also makes extension of research findings more practical and of immediate use by farmers.
At the conclusion of any long-term study, a common question asked is: what value was there in measuring runoff, water quality, soil water, and yield for 18 years? The western margin of cropping in eastern Australia is characterised by high variability and extremes in rainfall and temperature. No 2 seasons are the same, and in some cases, a management option may have a positive or a negative influence, depending on the weather sequence experienced during observations. On reflection, it would probably have been more instructive to measure soil water more intensively for a shorter period, aiming to capture the details of wetting and drying sequences, thus better describing evaporation and transpiration, the 2 biggest elements of the water balance. While such an approach is still at the whims of weather, increased effort to gain detail may be more profitable than the routine sampling strategy used in this study. Similarly, a ‘side experiment’ where cover was manipulated to achieve greater contrast in cover would have clarified the potential benefits of cover for runoff control and moisture conservation.
On balance, this study resulted in an efficient use of resources, shared ownership between scientists and farmers, and a better managed site operated at a farm scale and therefore of direct relevance and high credibility with the local farm community. The resulting record of soil water, runoff, and water quality provides a benchmark dataset essential in the development and application of water balance models. Such models, having a foundation in real-world observation, can then be used to explore a wide range of options beyond the experimental record (Littleboy et al. 1992; McCown et al. 1996; Freebairn et al. 2003).
Conclusions
This paper has presented a descriptive analysis from 18 years of monitoring 4 contour bay catchments. These catchments were used to describe the hydrology of a range of crop and pasture conditions.
The climate of the region is characterised by extreme variability in rainfall and high evaporative conditions. While fallowing to accumulate a buffer water supply for use during crop growth is an essential risk management tool, it is an extremely inefficient practice with only 19% of rainfall captured for later use by crops. Evaporation accounts for most of water loss, with runoff being 11% of rainfall. High evaporative conditions and clay soils with a high water-holding capacity particularly near the soil surface are the main contributors to high evaporative losses particularly during summer fallows. Perennial pastures produced less runoff than annual winter cropping, a result of a longer growing season (drier soil) and higher soil cover.
Over the 18 years of this study, conservation tillage adoption increased from a minor practice to 30–50% of farmers applying some form of conservation tillage (Thomas et al. 2007). While the results presented do not provide clear evidence that conservation tillage improves water conservation, it showed that cover greatly reduces sediment losses, and that higher soil cover reduced runoff.
High levels of cover can provide some benefits when it is available, though to a lesser extent on these more hard-setting soils compared with ‘softer’ self-mulching soils. However, it is difficult to produce the higher levels of cover required with the low biomass production in the region. Also, tillage is often not needed for weed control in this region for several months after wheat harvest (due to lack of rain), reducing contrast between tillage systems.
This study was not able to demonstrate significant differences in hydrology between the ‘treatments’ of traditional, aggressive tillage and more conservative tillage practices that result in higher soil cover, although reduction in runoff associated with soil cover and roughness were demonstrated statistically. The late implementation of tillage treatments until tillage was required reduced the contrast between treatments to the latter half of most fallows. Reduced and no till systems which have higher cover but less roughness may have to manage these counteracting influences. When low cover results from crop failure or grazing, tillage to create roughness is required.
Suspended sediment loss rather than net erosion is reported in this study, a result of a modified outlet design, larger catchments making the mapping of rills and fans difficult, and a soil type where definition of rills and fans was less clear than for similar studies on the eastern Darling Downs (Freebairn and Wockner 1986a). Suspended sediment losses of 2–3 t/ha.year resulted from runoff leaving paddocks with 10-20 g/L of sediment, and given that most of this material was silt-sized or finer, it is likely to travel a considerable distance through the catchment. Higher soil cover (>20%) associated with reduced tillage systems will reduce these concentrations to <5 g/L. Runoff and suspended sediment losses were considerable lower under pasture than cropping.
Pasture systems are clearly the most environmentally sustainable with runoff and erosion rates 30% and 10%, respectively, of those from traditional cropping. Measured rates of soil loss from cropped catchments are relatively low (2–3 t/ha.year) compared with wetter and steeper cropping areas to the east (Freebairn and Wockner 1986a) but do represent significant export of nutrients.
We have demonstrated that a participative approach between farmers and scientists allowed an extensive catchment study to be operated efficiently at a remote location over an 18-year period. Descriptions of catchment conditions (cover, roughness, soil moisture) and rainfall were sufficient to allow for descriptive and statistical interpretation of hydrologic and water quality responses on a soil type representative of a significant part of the northern Australian crop and pasture zone. The data from this study will provide an important benchmark for future hydrologic modelling and subsequent extrapolation to other land uses and management options.
Acknowledgments
This study was a collaborative activity between a group of scientists and a farm family. We are indebted to Viv and Barbara Taylor, and their sons Rohan and Michael, who provided physical and moral support over the duration of the study. Their hospitality and continued enthusiasm made this study an enjoyable experience which now provides a valuable legacy for the region. The senior author is grateful to Land and Water Australia, through its provision of a Senior Research Fellowship which has allowed this study to be reinvigorated, analysed, and data made available. We also acknowledge input from Mark Silburn who had an overview of the study for 3 years while the senior author was on study leave.
Carroll C,
Halpin M,
Burger P,
Bell K,
Sallaway MM, Yule DF
(1997) The effect of crop type, crop rotation, and tillage practice on runoff and soil loss on a Vertisol in central Queensland. Australian Journal of Soil Research 35, 925–939.
| Crossref | GoogleScholarGoogle Scholar |
(verified 3 January 2009).
McCown RL,
Hammer GL,
Hargreaves JNG,
Holzworth D, Freebairn DM
(1996) APSIM: A novel software system for model development, model testing, and simulation in agricultural systems research. Agricultural Systems 50, 255–271.
| Crossref | GoogleScholarGoogle Scholar |

Radford BJ, Nielsen RGH
(1983) Extension of crop sowing time during dry weather by means of stubble mulching and water injection. Australian Journal of Experimental Agriculture and Animal Husbandry 23, 302–308.
| Crossref | GoogleScholarGoogle Scholar |

Sallaway MM,
Yule DF,
Mayer D, Burger PW
(1990) Effects of surface management on the hydrology of a Vertisol in semi-arid Australia. Soil & Tillage Research 15, 227–245.
| Crossref | GoogleScholarGoogle Scholar |

Thomas GA,
Titmarsh GW,
Freebairn DM, Radford BJ
(2007) No-tillage and conservation farming practices in grain growing areas of Queensland – a review of 40 years of development. Australian Journal of Experimental Agriculture 47, 887–898.
| Crossref | GoogleScholarGoogle Scholar |

Thornton CM,
Cowie BA,
Freebairn DM, Playford CL
(2007) The Brigalow Catchment Study: II. Clearing brigalow (Acacia harpophylla) for cropping or grazing increases runoff. Australian Journal of Soil Research 45, 496–511.
| Crossref | GoogleScholarGoogle Scholar |

Ward LD,
Norris CP, Thomas EC
(1991) Component interactions in zero-till planters for heavy clay soils in southern Queensland. Soil & Tillage Research 20, 19–32.
| Crossref | GoogleScholarGoogle Scholar |


