

Unravelling male advertisement call variability in the brown tree frog (Litoria ewingii) complex by using citizen science
Jessica Elliott-Tate A B * and Jodi J. L. Rowley A B
A
B
Abstract
In the face of global biodiversity declines, conservation measures are urgently needed. However, our lack of knowledge on species’ diversity, distributions and population trends presents a major obstacle, particularly for morphologically cryptic species. Field surveys to gather this information present a logistical challenge, but the rapid rise of citizen science presents a new opportunity, generating huge volumes of data rapidly across a species’ range. We use data from a national citizen-science project to document the distribution and advertisement call variability in a group of five morphologically conserved treefrogs. Using 542 male advertisement calls across the entire range of five species, we found considerable levels of acoustic variation both among and within species. Note shape, notes per call and positions of the longest and shortest notes were most useful to delineate species. Our research will assist in species delineation and identification in the field and form the basis for a more accurate understanding of species diversity and distributions in the brown tree frog complex. We also demonstrated the utility of citizen science in documenting species distributions and diversity.
Keywords: advertisement call, citizen science, geographic variation, Litoria calliscelis, Litoria ewingii, Litoria paraewingi, Litoria sibilus, Litoria verreauxii.
Introduction
The earth is currently in the midst of its sixth mass extinction event (Kim and Byrne 2006; Wake and Vredenburg 2008; Gillespie et al. 2020). There is an urgent need to stem this biodiversity loss, but there are major obstacles (Krauss et al. 2010; Whiles et al. 2013; Gillespie et al. 2020), including a lack of information on species richness, distribution, and population trends, which can culminate in ineffective conservation strategies (O’Connor and Crowe 2005; Kim and Byrne 2006; Souza et al. 2015; Bull et al. 2020). To address these gaps in knowledge, more comprehensive biodiversity surveys are required; however, traditional surveys are often expensive and time-consuming (Kim and Byrne 2006; Theodoridis et al. 2019; Gillespie et al. 2020). With the recent rise of citizen science, species occurrence data is being collected at greater temporal and spatial scales than ever before, helping overcome these surveying difficulties and fill the gaps present in our biodiversity knowledge base (Amano et al. 2016; Bela et al. 2016; Theodoridis et al. 2019).
One of the most threatened yet poorly known groups of animal is amphibians. Currently, 41% of all amphibian species are threatened, up from 33% in 2004 (IUCN 2021). Additionally, over 16% of amphibian species are listed as Data Deficient (IUCN 2021), indicating such a paucity of data that the conservation status of a species cannot be determined. One of the biggest gaps in knowledge for amphibian species is our lack of understanding of their true species diversity. At present, more than 7500 frog species are known but new species are consistently being scientifically described (Frost 2023). The continued rate of species discovery in such a threatened taxon highlights the need for accurate data on frog biodiversity (Hero and Morrison 2004).
The relative lack of data on frogs is in large part due to difficulties in detecting and identifying frog species. Frogs are often small in size, nocturnal, camouflaged, morphologically similar and reliably detectable only under certain environmental conditions (Oseen and Wassersug 2002; Renan et al. 2017). As a result, one of the most effective methods of surveying is via acoustic surveys (Rocha et al. 2004; Brown et al. 2007). As the male advertisement call of frogs is used to attract mates, it is often species-specific and can be an accurate means by which we can identify frog species (Watson et al. 1971; Smith et al. 2003).
Despite the species-specific nature of frog calls, it is being increasingly recognised that there is a large degree of intraspecific variation across both temporal and spatial scales (Mitchell et al. 2020; Weaver et al. 2020). However, existing guides to identify frogs via male advertisement calls are typically based on calls from few individuals from a small geographic area, because of surveying constraints, and are therefore unlikely to be useful across the whole range of a species (Gerhardt and Davis 1988; Oseen and Wassersug 2002; Weaver et al. 2020). In addition, because of the high degree of both undiagnosed species diversity and morphological conservatism (‘cryptic species’; Lötters et al. 2009) in frogs, an examination of the variability of frog advertisement calls across the range of a taxon may be useful in identifying potentially unrecognisable species (Watson et al. 1971; Lötters et al. 2009; Darwell and Cook 2017). Despite the utility of advertisement calls, obtaining a sufficient sample size to assess geographic variability, map species distributions and identify areas of call divergence presents a logistical challenge (Theodoridis et al. 2019; Weaver et al. 2020).
Obtaining data rapidly and from large spatial scales is increasingly possible as a result of citizen science (Van Sluys et al. 2012; Narins and Meenderink 2014; Heard et al. 2015; Forti et al. 2016). In recent years, acoustic data collected via citizen-science projects has successfully been used in research projects examining the variability of advertisement calls (Mitchell et al. 2020; Weaver et al. 2020); however, there remains a considerable lack of research on the variability of advertisement calls in species over geographic space and how this might affect our ability to delineate species.
We used a database of frog call recordings gathered as part of the national citizen-science project FrogID (Rowley et al. 2019) to document advertisement-call variability across the range of five morphologically conserved tree frogs in Australia, (Litoria ewingii, Litoria verreauxii, Litoria paraewingi, Litoria sibilus and Litoria calliscelis) and develop a key for acoustically identifying each species across its entire range. By examining the geographic variability of advertisement calls, we ascertained whether there is bioacoustic support for the subspecies division of Litoria verreauxii.
Methods
Study species
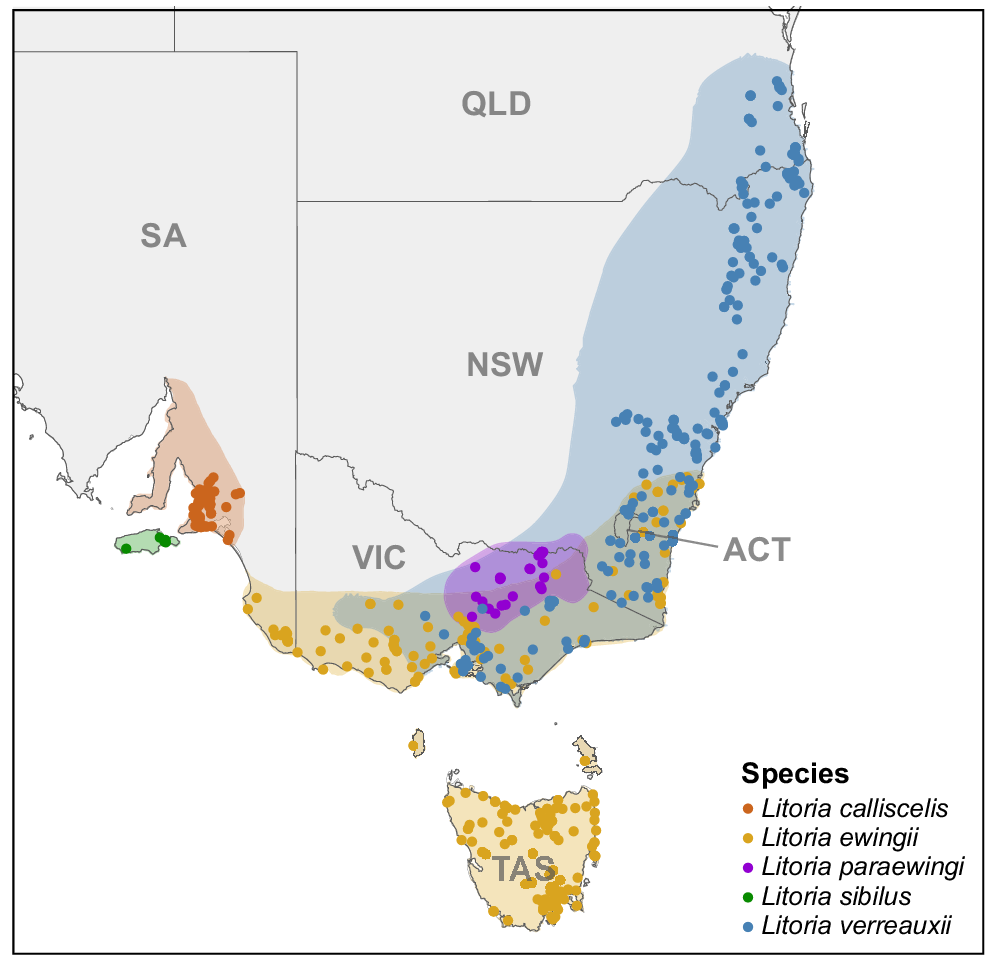
The brown tree-frog group encompasses the following nine species: Litoria ewingii, Litoria verreauxii, Litoria paraewingi, Litoria littlejohni, Litoria jervisiensis, Litoria watsoni, Litoria revelata and the newly described Litoria sibilus and Litoria calliscelis (reviewed in Mahony et al. 2020; Sanders 2021; Parkin et al. 2024). Three species within the group represent a particular challenge for identification, namely L. ewingii, L. paraewingi and L. verreauxii. These species are highly similar in appearance and male advertisement call, and have overlapping ranges (Fig. 1; Littlejohn 1965; Watson et al. 1971; Gerhardt and Davis 1988). In addition, existing male advertisement descriptions have been prepared using few recordings from geographically restricted areas, failing to capture the variation in the calls across the ranges of the species, therefore limiting their utility (Littlejohn 1976; Smith et al. 2003, 2013a). We also include the newly described L. sibilus and L. calliscelis (Parkin et al. 2024), formerly considered to be populations of L. ewingii, because their advertisement calls have not been compared with other members of the group outside of L. ewingii. Litoria verreauxii is currently considered to be two subspecies, Litoria verreauxii alpina and Litoria verreauxii verreauxii. The former is restricted to high-elevation sites in the Australian Alps bioregion, has undergone extensive population declines, is considered Vulnerable and is, therefore, the focus of conservation efforts (Brown et al. 2007; Department of Agriculture, Water and the Environment 2014). The ability to correctly identify and map taxon distribution is essential, given it is critical for any successful conservation strategies. However, the validity of the subspecies has been questioned. The subspecies status was assigned largely on the basis of the difference in skin colour, but more recent research has indicated a lack of genetic support (Banks et al. 2020) and little bioacoustic support (Smith et al. 2003) for the subspecies status. However, these studies had smaller sample sizes and were geographically limited, and therefore unable to consider the breath of variation within the range of L. verreauxii.
A map of south-eastern Australia, showing the distribution of frogs in the brown tree-frog complex. Shaded areas represent species distributions created from the locality data from all Litoria ewingii, Litoria verreauxii, Litoria paraewingi, Litoria sibilus and Litoria calliscelis recordings in FrogID. Dots represent locality of each advertisement call analysed within this study.
FrogID data
FrogID recordings were uploaded as an MPEG AAC audio file with a sampling rate of 44.1 kHz. The time, date and location data (latitude, longitude and an estimate of location accuracy) were automatically uploaded with each recording. Any calling frogs in a submission were identified to a species by an expert (Rowley et al. 2019). FrogID submission quality varied substantially depending on the model of phone, the proximity from phone to frog and background noise (Rowley et al. 2019; Rowley and Callaghan 2020).
Audio selection
We obtained 33,137 audio recordings of L. ewingii (17,309), L. paraewingi (1303), L. verreauxii (13,471), L. sibilus (50) and L. calliscelis (1001) from the FrogID database (exported 11 May 2022). To avoid resampling the same individual, we removed duplicate recordings from single latitude and longitude locations. We then ranked submissions according to the number of frog species detected, selecting recordings with a single species calling and those marked in the FrogID database as ‘quality’. To ensure submissions from across the range of each species, we then mapped locations of all submissions and filled spatial gaps by selecting submissions with more than one species calling (i.e. including species other than the target species). This resulted in 1758 recordings (606 L. ewingii, 159 L. paraewingi, 767 L. verreauxii verreauxii, 27 L. verreauxii alpina, 13 L. sibilus and 186 L. calliscelis.). Some submissions were not of sufficient quality for accurate bioacoustic analyses, containing only incomplete calls, too much background noise or too many overlapping calls, bringing the number of analysed submissions down to 469 (28% of those originally selected). As FrogID recordings are identified only to species level, we identified recordings of L. verreauxii above 1100 m elevation in the Australian Alps bioregion to L. v. alpina (Gartside 1982; Watson et al. 1985; Brown et al. 2007; Banks et al. 2020) and those in all other areas to L. v. verreauxii.
Call analysis
We converted FrogID recordings from MPEG AAC audio files into a WAV format (sampling rate of 48 kHz, 16 bits/sample) using the R vers. 4.1.0 (R Core Team 2021) package ‘av’ (Ooms 2023) prior to analysis in Raven Pro 1.6.3 (K Lisa Yang Center for Conservation Bioacoustics 2022) by using fast-Fourier transformation of 512 points and 50% overlap.
For one call per individual in each recording, we measured call duration (s), note duration (s), dominant frequency (Hz), notes per call, pulses per note, note rate (notes/s), pulse rate (pulses/s), note shape (Fig. 2), frequency modulation, pulse pattern, pulse-rate pattern, frequency pattern and the positions of the longest and shortest notes (for definitions, see Table 1). We selected these call parameters on the basis of their utility in distinguishing the male advertisement calls of different frog species (Lötters et al. 2009; Forti et al. 2016; Köhler et al. 2017), including the brown tree-frog group (Littlejohn 1976; Littlejohn and Watson 1983; Smith et al. 2013b). To our knowledge, several of these parameters (see Table 1) were not commonly used in previous assessments of bioacoustic variation in the study species. We calculated dominant frequency, pulse rate and pulses per note for each note in a call and then calculated an average (versus calculating from a single note in each call as per previous studies on the species Watson et al. 1971, 1985; Watson 1972; Watson and Littlejohn 1978), allowing us to examine changes over the course of a call.
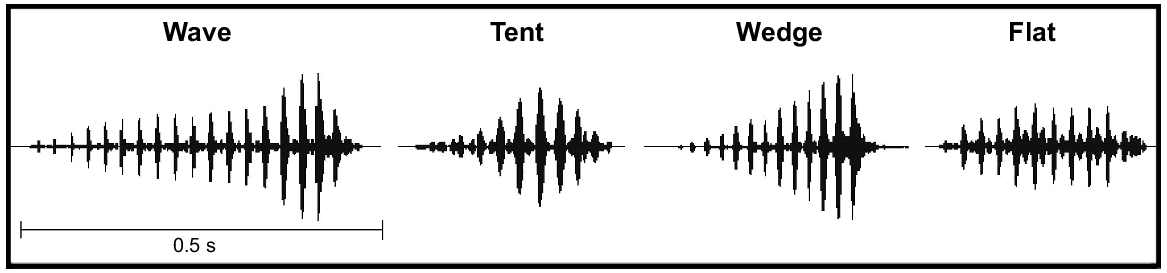
Visual representations of four of the note shapes (wave, tent, wedge, flat) we identified during call analysis of male advertisement calls of five species of the Litoria ewingii complex. The note shape ‘other’ (not shown) refers to a shape other than those shown or a call without a dominant note shape. Note shape is based on the waveform view of an advertisement call, which shows the changing amplitude throughout a note.
| Call parameter | Definition | |
|---|---|---|
| Call duration | Length of one call, measured from the beginning of the first note to end of the last note (s). | |
| Average note duration | The average length of each note, measured beginning to end (s). | |
| Average dominant frequency | The average peak frequency of each note (Hz). | |
| Notes per call | The average number of notes present in one call. | |
| Average pulses per note | The average number of pulses present in one note. | |
| Average pulse rate | The average number of pulses in 1 s (pulses/s). Calculated using: (number of pulses – 1)/note duration. | |
| Note rate | The number of notes in 1 s (notes/s). Calculated using: (number of notes – 1)/call duration. | |
| Frequency modulation | The difference in the dominant frequency between the last and the first notes of the call (Hz). | |
| Frequency pattern A | The pattern of dominant frequency within a call. Six categories: increasing, decreasing, stable, up and down, up then down, stable with dips. | |
| Note shape A | The most prevalent perceived shape of notes within a call based on waveform view. Five categories: wedge, wave, flat, tent, other (Fig. 2). | |
| Position of longest note A | The position of the longest note (s) in the call, (beginning, middle, end, other). | |
| Position of shortest note A | The position of the shortest note (s) in the call, (beginning, middle, end, other). | |
| Pulse pattern A | The pattern in the number of pulses per note over the length of the call. (increasing, decreasing, stable, up and down, up then down). | |
| Pulse-rate pattern A | The pattern of the pulse rate calculated for each note over the length of the call. (increasing, decreasing, stable, up and down, up then down). |
Data analysis
We analysed recordings from allopatric populations first, before analysing from areas where the species exist in sympatry. After determining the range in parameters of each species, we identified calls in areas of sympatry that had call parameters of another species in the group, and after re-analyses of these recordings, they were re-identified. These were corrected in our analyses and in the FrogID database before further analyses.
There was a large amount of variation in the spatial and temporal parameters of advertisement calls. To characterise a typical advertisement call and create a more useful key for species delineation, we removed outliers (above the 3rd quartile + 1.5× interquartile range or below the 1st quartile – 1.5× interquartile range) from Table 2 and the advertisement call key.
| Species | Number of calls (n) | Call duration (s) | Note duration (s) | Dominant frequency (Hz) | Notes/call | Pulses/note | Note rate (notes/s) | Pulse rate (pulses/s) | Note shape A | Longest note A | Shortest note A | |
|---|---|---|---|---|---|---|---|---|---|---|---|---|
| L. ewingii | 223 | 1.05–4.31 (2.33) | 0.10–0.43 (0.21) | 1875–3167 (2475) | 4–18 (9) | 10–46 (23) | 1.6–5.79 (3.37) | 33.59–205.69 (108.55) | Wedge | Beginning | Other | |
| L. verreauxii | 197 | 1.2–6.08 (3.02) | 0.1–0.43 (0.23) | 1781–3153 (2499) | 5–19 (11) | 13–61 (30) | 1.38–6.56 (3.46) | 60.55–221.22 (135.07) | Wave | End | Beginning | |
| L. paraewingi | 26 | 1.4–4.11 (2.64) | 0.23–0.62 (0.36) | 2156–3375 (2741) | 4–9 (6) | 18–43 (28) | 1.02–2.90 (1.88) | 42.52–166.46 (78.12) | Wave | Beginning | Middle | |
| L. sibilus | 5 | 1.48–1.87 (1.67) | 0.11–0.18 (0.14) | 2438–2541 (2510) | 9–11 (10) | 15–31 (22) | 4.29–6.45 (5.19) | 98.91–175.17 (144.39) | Other/Tent | End | Beginning | |
| L. calliscelis | 53 | 1.57–5.24 (3.23) | 0.09–0.23 (0.16) | 2063–2809 (2438) | 7–25 (15) | 10–33 (19) | 2.72–6.43 (4.45) | 43.02–192.68 (111.43) | Other | End | Beginning |
Temperature data were not submitted with FrogID recordings; therefore, to examine the effect of temperature on call parameters, we followed the methods outlined in Mitchell et al. (2020), except that temperature data were retrieved from the Australian Bureau of Meteorology directly rather than by using Bomrang (Sparks et al 2019). We then used the R package ‘chillR’ vers. 0.7.5 (Luedeling 2019) to estimate the ambient temperature for each FrogID recording at the time of recording. The temperature data extracted included the daily minimum and maximum and an estimation of the temperature at the time of calling (the nearest hour of the FrogID-call submission timestamp) collected from the nearest weather station. Temperature data were not able to be retrieved for 23 recordings. To assess the effect of temperature on call parameters, we created scatterplots with regression lines (Supplementary Fig. S1) and completed a Pearsons correlation coefficient to determine the strength and direction of the relationship (Supplementary Table S1). Performing multiple analyses raises the chance of encountering Type 1 errors. To mitigate this risk, we applied the Bonferroni correction to adjust P-values and minimise the likelihood of Type 1 errors (Table S1). We created variation maps using R to visually document the geographic spread of call variability, and these, along with the data, were used to assess the validity of the taxonomic status of L. v. alpina. Packages ‘readr’ (vers. 2.1.4, Wickham et al. 2022b, https://CRAN.R-project.org/package=readr), ‘dplyr’ (vers. 1.1.3, Wickham et al. 2022a, https://CRAN.R-project.org/package=dplyr), ‘tidyr’ (vers. 1.3.0, Wickham and Girlich 2022, https://CRAN.R-project.org/package=tidyr), ‘ggplot2’ (vers. 3.5.0, Wickham 2016, https://CRAN.R-project.org/package=ggplot2, ‘scales’ (vers. 1.3.0, Wickham and Seidel 2020, https://CRAN.R-project.org/package=scales, ‘ggpubr’ (vers. 0.6.0, Kassambara 2020, https://CRAN.R-project.org/package=ggpubr), ‘sf’ (vers. 1.0-14, Pebesma 2018, https://CRAN.R-project.org/package=sf), ‘rnaturalearthdata’ (vers. 1.0.0, South 2017b, https://CRAN.R-project.org/package=rnaturaldata), ‘rnaturalearth’ (vers.1.0.1, South 2017a, https://CRAN.R-project.org/package=rnaturalearth), ‘ozmaps’ (vers. 0.4.5, Sumner 2021, https://CRAN.R-project.org/package=ozmaps), ‘raster’ (vers. 3.5-29, Hijmans 2022, https://CRAN.R-project.org/package=raster, ‘rasterVis’ (vers. 0.51.5, Perpinan Lamigueiro and Hijmans 2022, https://CRAN.R-project.org/package=rasterVis), ‘rgdal’ (vers. 1.6-7, Bivand et al. 2022, https://CRAN.R-project.org/package=rgdal) were used in data analysis.
Results
Acoustic variation among and within species
Of the 469 recordings used, 61 had multiple individuals of the target species calling, resulting in a total of 542 calls (=individuals) (236 L. ewingii, 31 L. paraewingi, 197 L. v. verreauxii, 13 L. v. alpina, 6 L. sibilus and 59 L. calliscelis) being analysed (Fig 1.). Each species had a high degree of variation in the acoustic parameters of their advertisement calls, particularly the more widely distributed L. ewingii and L. verreauxii (Fig. 3).
Variation in measured temporal advertisement-call parameters for Litoria ewingii, Litoria verreauxii, Litoria paraewingi, Litoria sibilus and Litoria calliscelis. Medians are represented by the bold line and outliers indicated by solid circles. The box represents the interquartile range (~50%) of the data set. n indicates the sample size for each species.
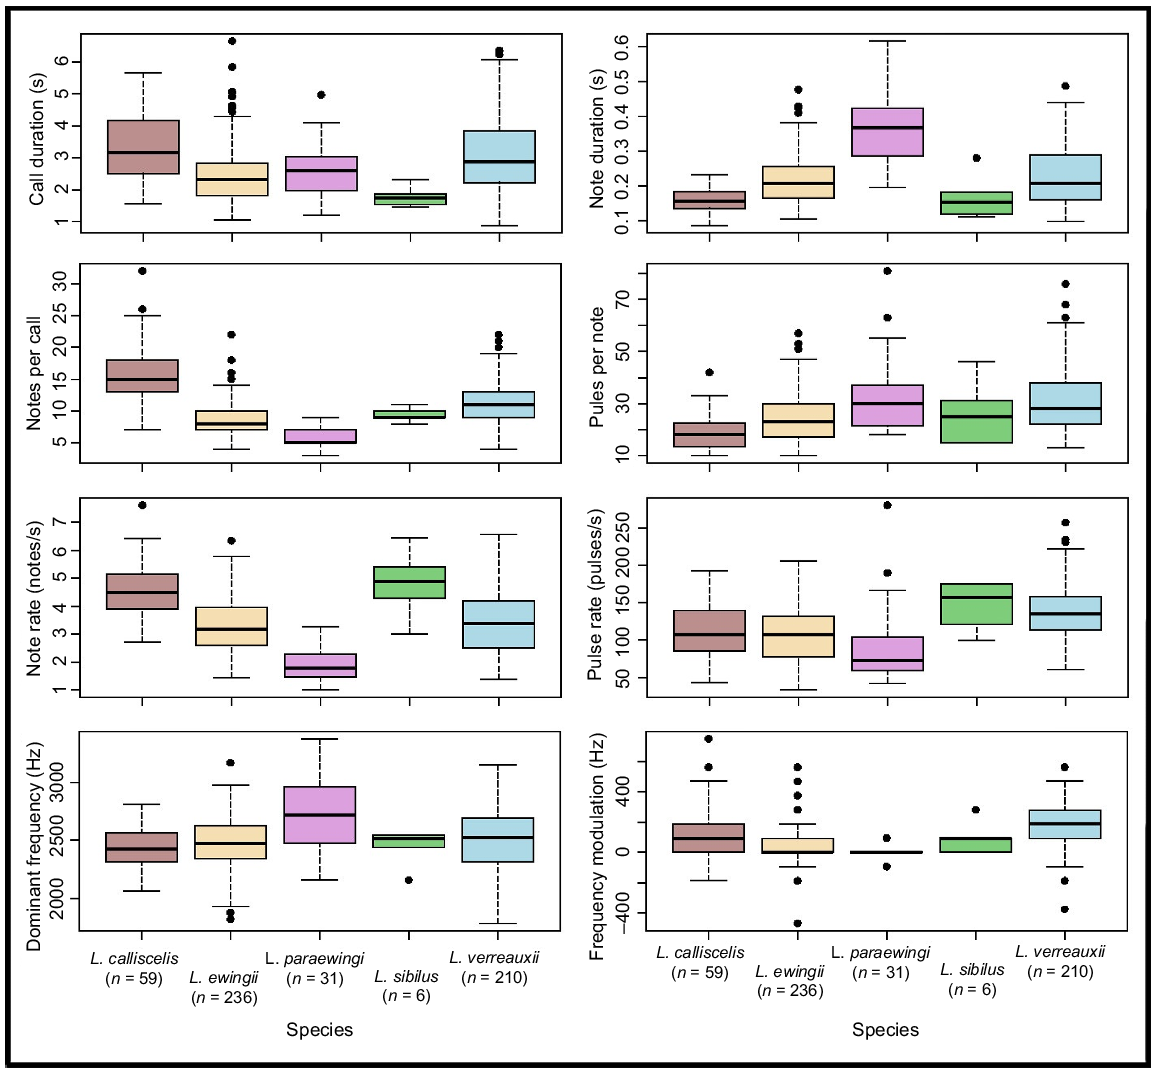
Most measured call parameters overlapped among species (Fig. 3, Tables 2, S2), but the calls of each species could most reliably be distinguished via a combination of note shape, notes per call and positions of the longest and shortest notes (Table 2, Figs 4, 5). These structural parameters were largely unaffected by temperature (Fig. S1, Table S1), whereas the temporal call parameters (call duration and note duration) were affected by temperature (Fig. S1, Table S1). Call duration, note duration, dominant frequency and pulses per note were also useful in delineating some species pairs (Table 2). Pulse-rate pattern, frequency modulation and pulse pattern were not useful in species delineation (Tables 2, S2). Fifty outliers were identified across the five species and were excluded from the call key (L. ewingii – 23, L. verreauxii – 13, L. paraewingi – 5, L. sibilus – 1 and L. calliscelis – 6) (Table S3).
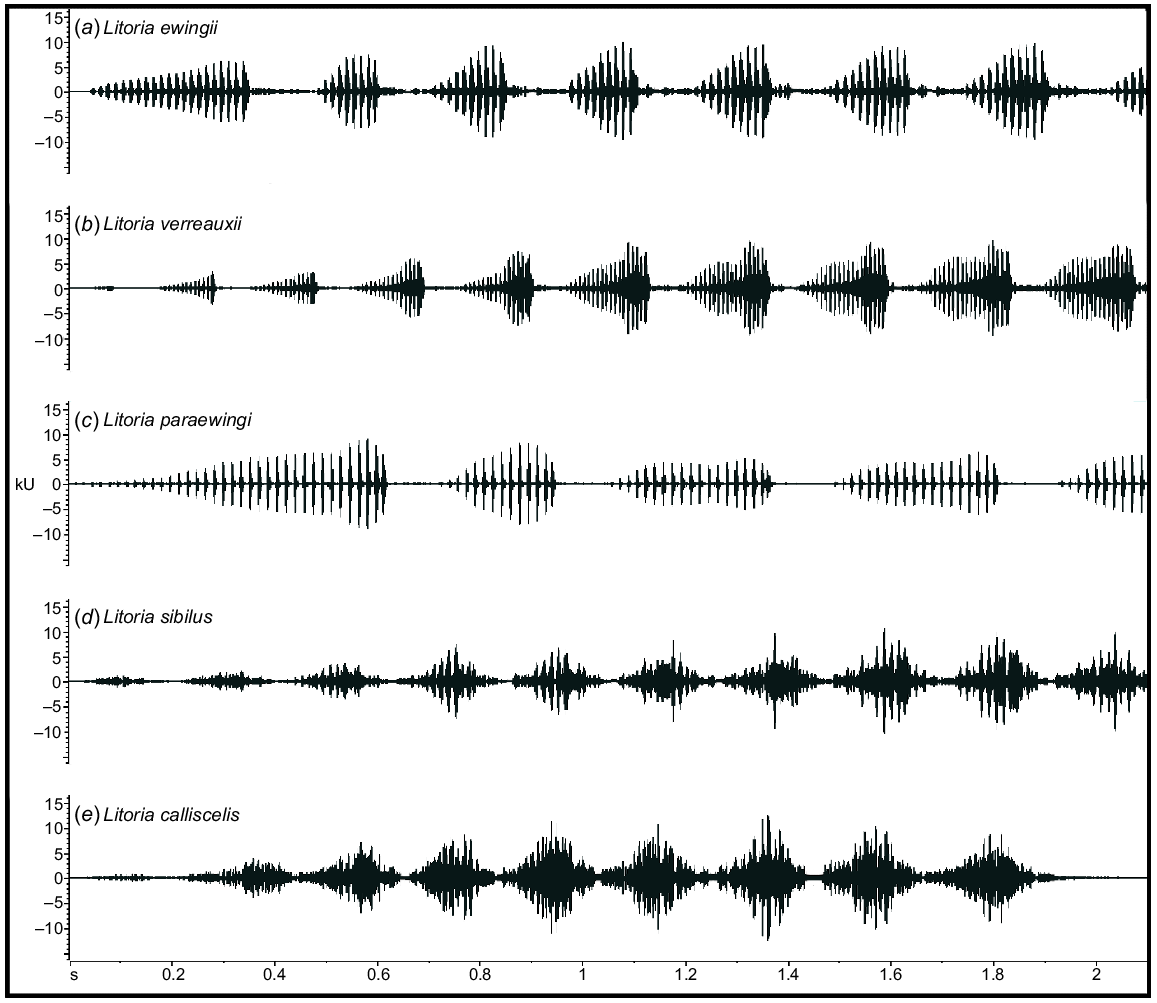
Representative male advertisement calls of (a) Litoria ewingii, (b) Litoria verreauxii, (c) Litoria paraewingi, (d) Litoria sibilus and (e) Litoria calliscelis. Shown in waveform view (amplitude over time) to visually examine the differences among the species.
Bar graphs of the percentage for each note shape (wedge, wave, flat, other) and the positions of the longest and shortest notes (beginning, middle, end, other) present in the male advertisement calls of Litoria ewingii, Litoria verreauxii, Litoria paraewingi, Litoria sibilus and Litoria calliscelis.
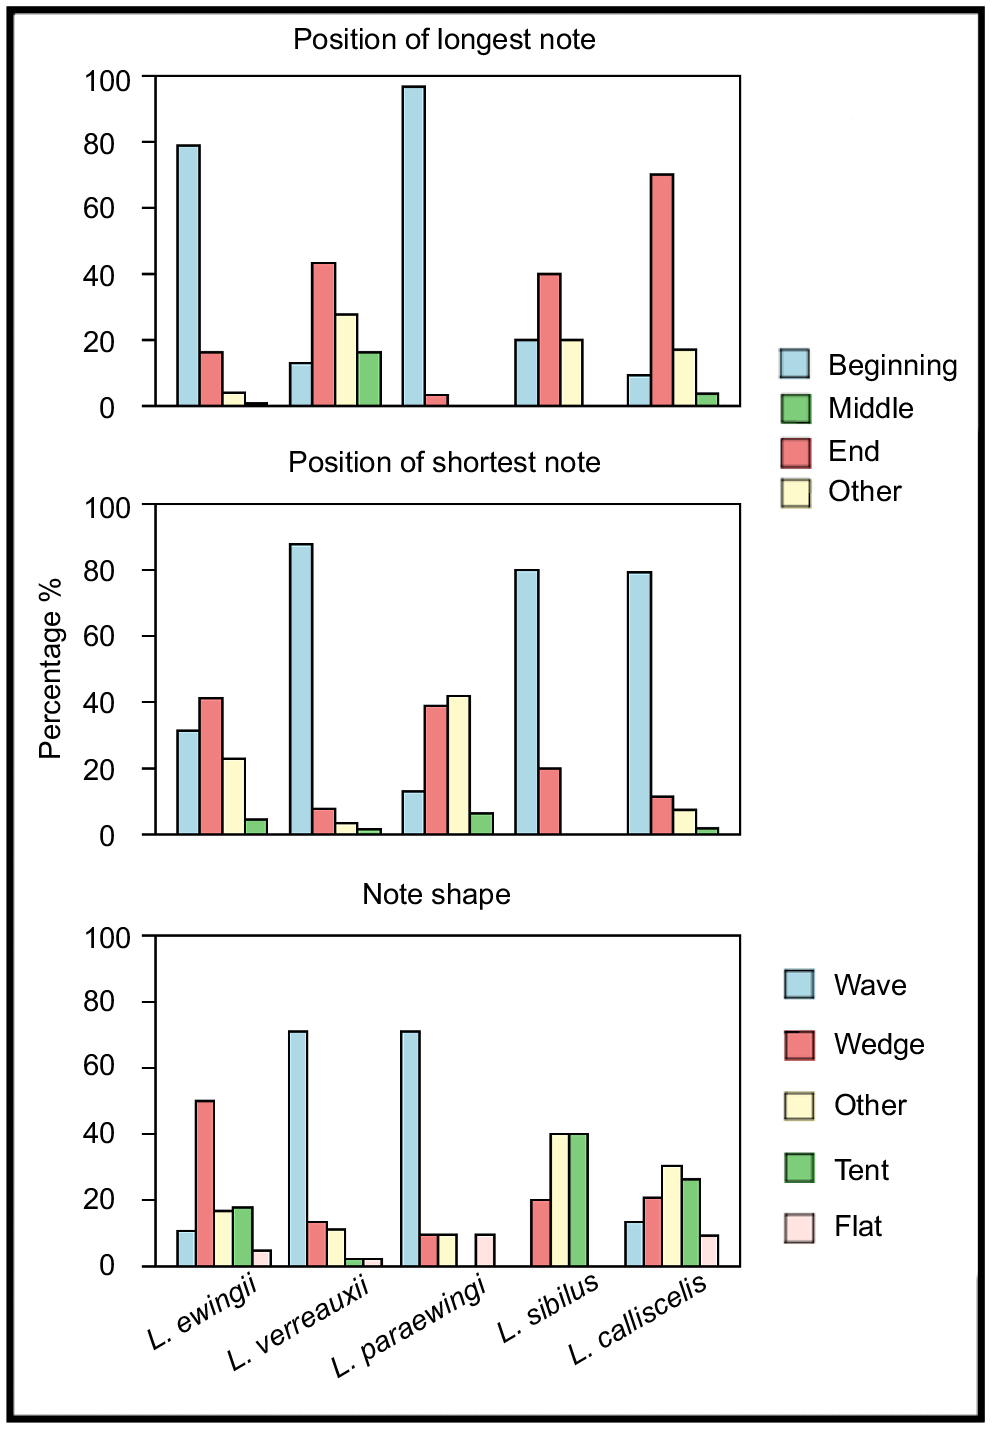
To the human ear, the advertisement call of L. ewingii sounds more short, sharp and harsh than those of the other study species. The advertisement call of L. paraewingi sounded higher pitched and drawn out owing to its higher dominant frequency and long note durations (Table 2, Fig. 4). Individual pulses in the call of L. paraewingi are also more audible than those of both L. ewingii and L. verreauxii. In contrast, the advertisement call of L. verreauxii call commonly starts with short, low-amplitude notes that increase in duration and amplitude over the course of the call. Although L. verreauxii typically has longer note durations and a higher number of pulses, similar to L. paraewingi, they do not sound as pulsed to the human ear. Instead, the amplitude modulation of the ‘wave’-shaped (Fig. 2) notes could be heard. The advertisement calls of the newly described L. sibilus and L. calliscelis are more difficult to discern by ear, but both species are geographically isolated from all other members of the group. The advertisement call of L. sibilus sounds short and fast compared with those of the other study species, because of its typically short note and call durations (Table 2, Fig. 4), whereas the advertisement call of L. calliscelis is similarly fast but has a longer call duration owing to the higher number of notes.
The call key created from analysis of call data to assist with identification of male advertisement calls of L. ewingii, L. paraewingi and L. verreauxii is shown below. Because L. sibilus and L. calliscelis are geographically isolated from the other study species and thus can be identified via their location, we have excluded them from the call key.
| 1. | Long introductory note? …………… 2 Short, low-amplitude (quiet) introductory note? ………… 3 |
| 2. | Introductory note followed by a series of shorter wedge-shaped notes? …………… Litoria ewingii (Fig. 4a) Introductory note followed by a small number (fewer than five) of long wave-shaped notes? ………… Litoria paraewingi (Fig. 4c) |
| 3. | Wave-shaped notes that increase in amplitude (gets louder)? …………… Litoria verreauxii (Fig. 4b) |
Geographic variation in call parameters
We found evidence of geographic patterns within the advertisement calls of L. ewingii and L. verreauxii. In particular, the advertisement calls of L. ewingii in the New South Wales coast region and Tasmania (Fig. 6) appeared to diverge somewhat from those of L. ewingii from other areas in terms of the positions of the shortest and longest notes, pulse rate, note rate and notes per call.
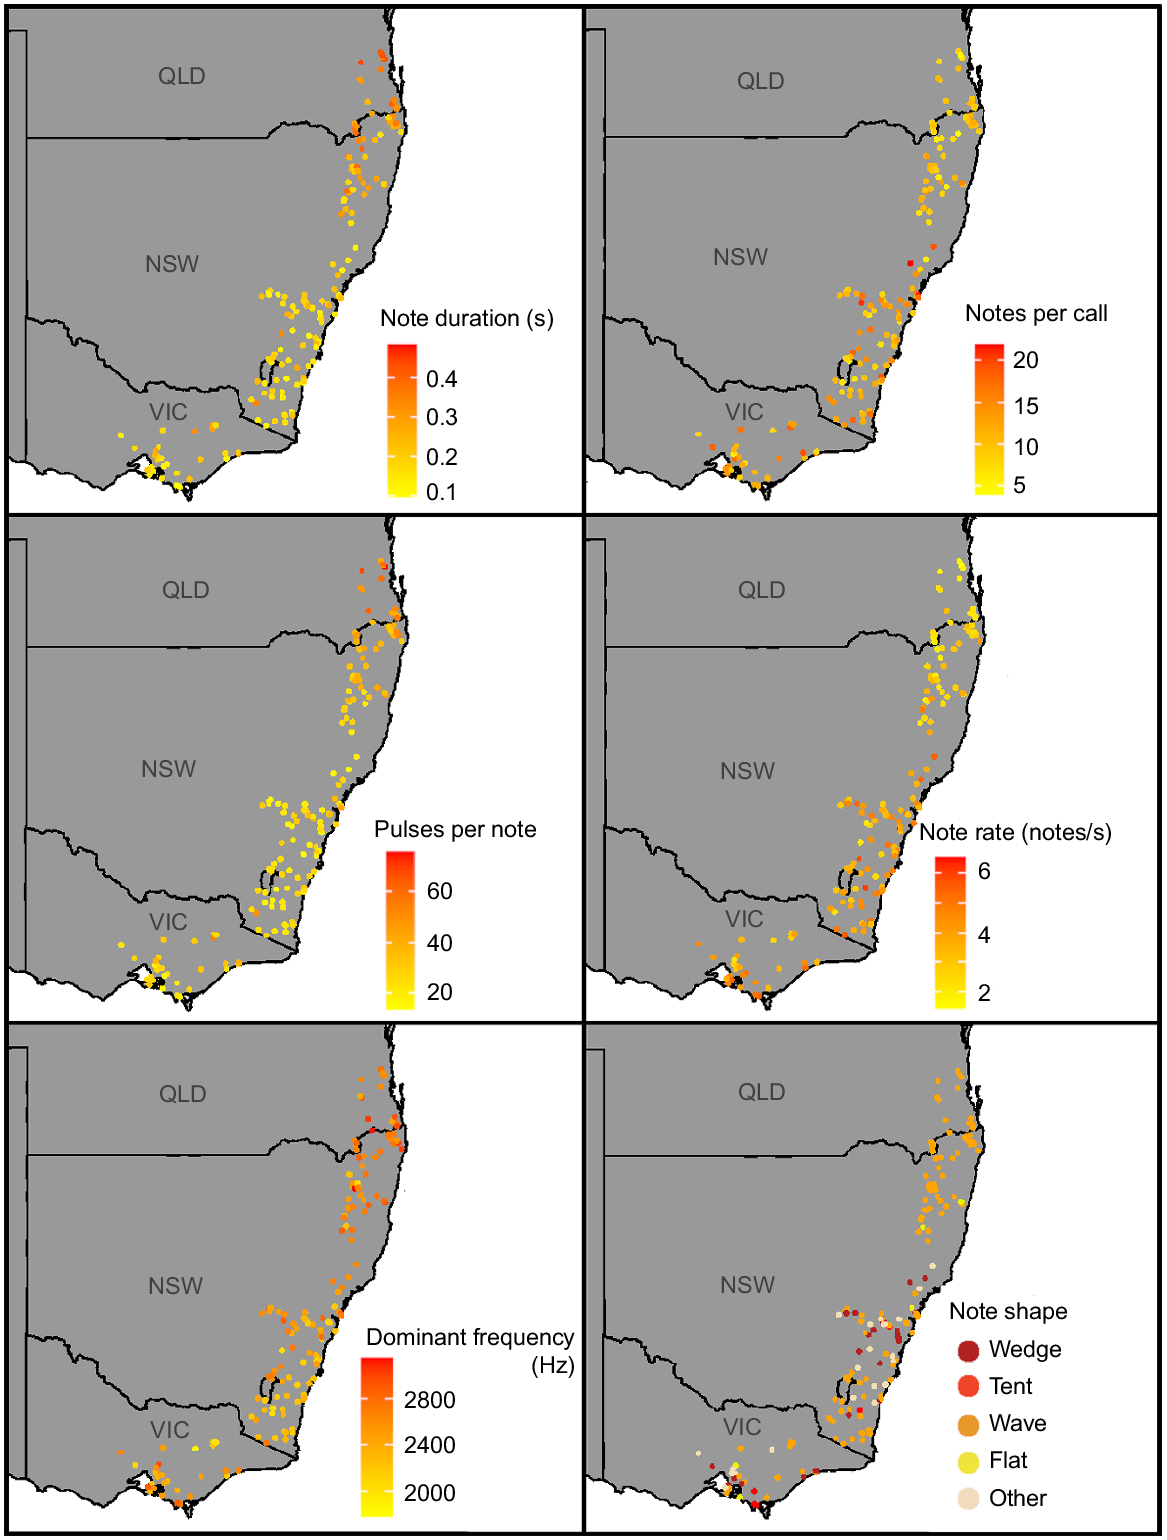
Geographic variation in note duration, notes per call, note rate, note shape and positions of the longest and shortest notes present within the male advertisement call of Litoria ewingii.
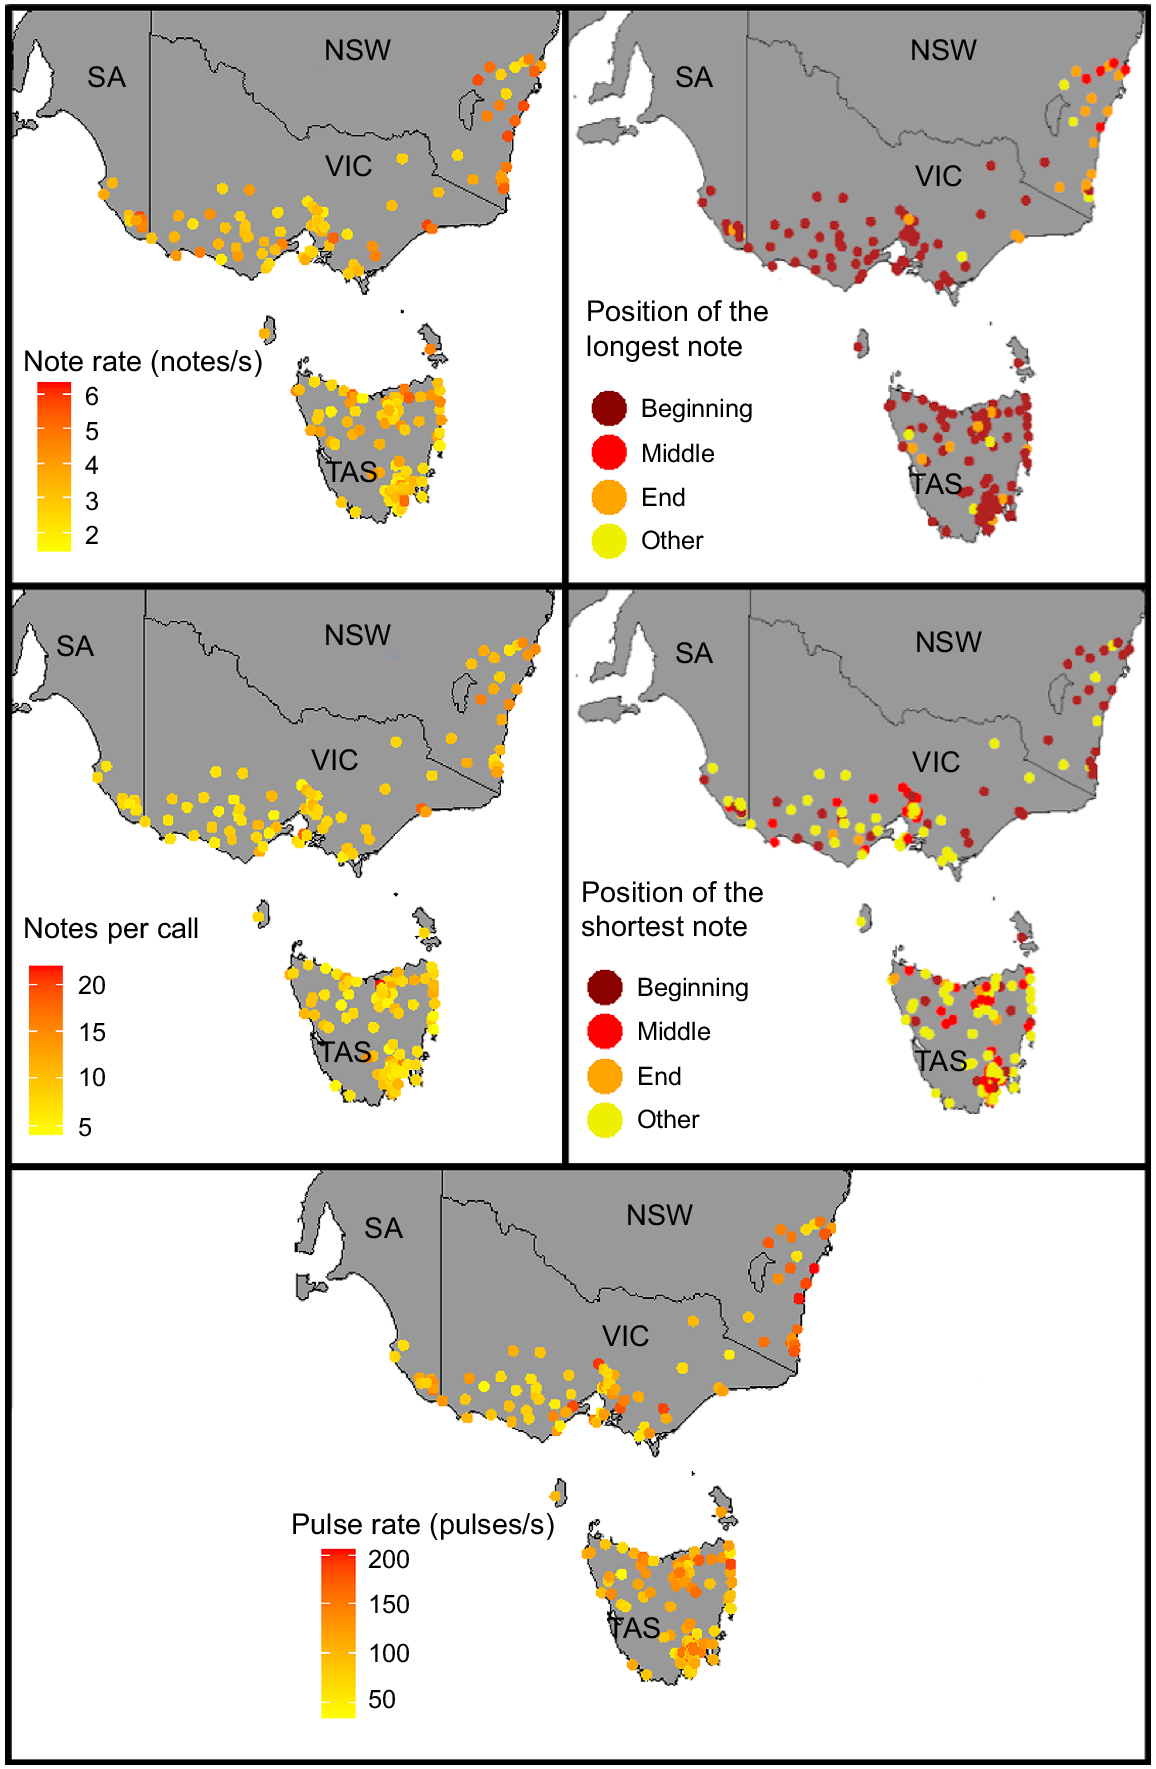
Although there was variation in advertisement calls within the relatively small ranges of L. paraewingi, L. sibilus and L. calliscelis, we found no distinct geographic patterns (Figs S2, S3, S4). Litoria verreauxii showed geographic patterns in several call parameters, most notably between Queensland and northern New South Wales and the rest of the L. verreauxii range (Fig. 7). Call parameters that showed differentiation between these two geographic groups included note duration, notes per call, note rate, pulses per note and dominant frequency. Divergence in L. verreauxii call parameters in the range of L. v. alpina was not evident (Figs 7, S5). The range of all parameters of L. v. alpina (except for dominant frequency) fell within the range of L. v. verreauxii. This pattern held true with (Table S4) and without (Table 3) outliers.
Geographic variation in note duration, note rate, note shape, notes per call, pulses per note and dominant frequency present within the male advertisement call of Litoria verreauxii.
| Species | Number of calls (n) | Call duration (s) | Note duration (s) | Dominant frequency (Hz) | Notes/call | Pulses/note | Note rate (notes/s) | Pulse rate (pulses/s) | Frequency pattern A | Note shape A | Longest note A | Shortest note A | |
|---|---|---|---|---|---|---|---|---|---|---|---|---|---|
| L. v. alpina | 12 | 1.46–4.35 (2.98) | 0.15–0.32 (0.22) | 1781–2560 (2161) | 7–15 (11) | 20–37 (26) | 2.41–4.11 (3.32) | 90.07–161.89 (120.39) | Stable (33.33%) | Wave (83.33%) | End (41.67%) | Beginning (75%) | |
| L. v. verreauxii | 185 | 1.20–6.08 (3.03) | 0.09–0.43 (0.23) | 2031–3153 (2521) | 5–19 (11) | 13–61 (31) | 1.38–6.56 (3.46) | 60.55–221.22 (136.03) | Increasing (42.93%) | Wave (70.11%) | End (43.48%) | Beginning (88.59%) |
Discussion
We characterised the male advertisement call of five widely distributed Australian frog species, by using >500 advertisement calls across the range of each species. Our study showed a high degree of variation in call parameters within each frog species, reinforcing the findings of several recent studies using large acoustic datasets via the FrogID project (Mitchell et al. 2020; Weaver et al. 2020). Within the currently accepted taxonomy, there is a higher degree of intra-specific variations within a species’ advertisement call than was previously thought within a single species (Lötters et al. 2009).
In part because of the high degree of variation in acoustic parameters, there was a substantial amount of overlap in individual call parameters among the species. We found that a combination of call parameters, in particular the structural parameters, was needed to successfully delineate the species. The most effective call parameters for delineation were a combination of notes per call, note shape and the positions of the longest and shortest notes. This is not only because there was less overlap in these call parameters, but because each parameter can rule out a species when used for identification. Importantly, the most useful call parameters were largely unaffected by temperature (Fig. S1, Table S1).
Previous research specified pulse rate and notes per call as being the main delineating factors among species in the brown tree-frog group (Littlejohn 1965; Watson et al. 1971; Littlejohn 1976; Littlejohn and Watson 1983). However, as most previous research on these species was conducted in northern Victoria (Gartside 1972; Watson and Littlejohn 1978; Gartside 1982) with limited sample sizes, the true extent of acoustic variation in the species was not previously captured. Indeed, sample sizes of fewer than 20 individuals and those that do not cover the species range are unlikely to capture the true extent of variation present within a species advertisement call (Weaver et al. 2020). In addition, note shape and note positions proved to be more useful than were other call parameters in delineating species.
Variation in advertisement calls both within and among species can be due to a variety of reasons. Body size is known to influence dominant frequency (Sullivan and Hinshaw 1990) and temperature is known to affect the temporal parameters such as call duration and pulse rate (Narins and Meenderink 2014; Köhler et al. 2017). In addition, habitat structure also affects call parameters (Ryan et al. 1990; Forti et al. 2016). Advertisement call variation within a species can also depend on social contexts, such as female-led preferences, for example, increasing call rate while decreasing call duration and vice versa in the presence of females and male competitors (Wells and Schwartz 1984; Lesbarreres and Lodé 2002; Morais et al. 2012) and male conspecific competition, such as, for example, shifting dominant frequency to avoid overlap and increases in call duration when males are chorusing versus isolated calling (Wells and Taigen 1986; Gerhardt 1991; Bee and Perrill 1996; Howard and Young 1998; Bee et al. 2000; Kime et al. 2004; Martínez-Rivera and Gerhardt 2008; Fang et al 2014; Toledo et al. 2014). Weaver et al. (2020) found that as the geographic area increased, so too did the level of variability; consequently, a large degree of variation was expected. The geographical patterns of advertisement call variation in L. ewingii and L. verreauxii may be related to various factors, including differences in temperature and habitat, isolation by distance, reproductive character displacement (RCD) (Littlejohn 1965; Littlejohn 1976; Gerhardt and Davis 1988) or may be indicative of undiagnosed species diversity within the group. Additional fieldwork, morphological, acoustic and genetic analysis will be required to elucidate the drivers of this variation. Our findings confirmed the persistence of a stable relationship described almost six decades ago by Littlejohn (1965), a pattern of call divergence in regions of sympatry between L. ewingii and L. verreauxii. It is not surprising that no patterns of geographic variation were found for L. paraewingi, L. sibilus and L. calliscelis, given their small distributions and few advertisement calls collected (L. paraewingi – 26, L. sibilus – 5, L. calliscelis – 57).
Although we found slight divergence in three call parameters (Table 3), we found no distinct difference between the advertisement calls of L. v. alpina and L. v. verreauxii. These results support those of previous acoustic research (Smith et al. 2003). However, we analysed only a small number (n = 14) of calls within the most likely range of L. v. alpina at above 1100 m. This may not reflect the true geographic distribution of the species, because additional research is required to understand the current range of the species. In addition, there were no FrogID recordings of the species available within 23.5 km of the type locality of the subspecies, Mount Kosciuszko. The FrogID submissions we used were 23.5–171.9 km from the type locality (mean 103.4 km). The relatively low numbers of recordings in the FrogID database attributed to this species are likely to reflect the true abundance of the subspecies, with the species having disappeared from much of its former range (Osborne et al. 1999; Brown et al. 2007), but also its remote nature, rendering it less likely to be sampled via citizen science. A detailed investigation incorporating morphological, genetic and bioacoustic data is therefore required to resolve the taxonomic status of L. v. alpina.
While citizen-science data provided an unprecedented volume of data across a wide spatial scale to address our study aims, there were important considerations. As with most citizen-science data, there was a geographic bias in sampling (Dickinson et al. 2010; Callaghan et al. 2020), with more remote or sparsely populated areas less well-sampled. Furthermore, many recordings (72%) were of sufficient quality to identify species, and thus provided occurrence records for the species, but were of insufficient audio quality to allow bioacoustic analysis. Previous bioacoustic studies using FrogID data have found a relatively high proportion of submissions of insufficient acoustic quality (Weaver et al. 2020; Mitchell et al 2020). Because FrogID data do not include temperature, we extrapolated ambient temperature (Mitchell et al. 2020; Gillard and Rowley 2023). Although frog body temperature may differ from ambient temperature as a result of microhabitat use (Brattstrom 1963; Lillywhite 1970; Rowley and Alford 2013), all five study species are known to call from water or adjacent overhanging vegetation or pond or stream banks (Littlejohn 1965; Watson et al. 1971, 1985; reviewed by Hunter and Waudby 2017). As such, frog body temperatures are likely to differ from ambient temperatures in a similar manner across taxa and geographic space.
Our analyses of a large volume of advertisement calls across the entire ranges of three tree frog species demonstrated the usefulness of citizen-science data in documenting within- and among-species variation in advertisement calls. Understanding the geographic spread of variation is crucial for several reasons. First, it aids in more accurate, location-specific species identification, providing insights into species diversity, which is pivotal for conservation prioritisation (Caughley and Gunn 1996; Scheele et al. 2018). Additionally, as frogs are indicator species (Blaustein and Wake 1995; Wake and Vredenburg 2008), monitoring frog populations over time can allow a greater understanding of broader environmental health (Blaustein and Wake 1995; Woodford and Meyer 2003; Hopkins 2007). Understanding variation in frog calls also contributes to our understanding of the evolutionary history of frog species, speciation and adaptation (Cocroft and Ryan 1995; Gerhardt and Huber 2002; Wells 2007; Tessarolo et al, 2016). The large amount of variation within a single species, something that has been shown only recently (Lötters et al. 2009; Mitchell et al. 2020; Weaver et al. 2020), is also an important consideration when using frog advertisement calls in delineating species.
Using these data, we produced the only description of the male advertisement call across the entire range of any species of Australian frog (but see wide spatial-scale studies of Littlejohn and Roberts 1975; Roberts 1993) and provided a key to assist identification of the five species in the field, allowing the production of more precise maps, such as Australian Frog Atlas (Cutajar et al. 2022). We also identified geographic patterns in call variability for each species, and drivers of this variation should be the focus of future research.
Our research has demonstrated the utility of citizen-science data in overcoming challenges of traditional surveying, obtaining large volumes of data across a wide spatial scale.
Data availability
The complete raw dataset is not fully available due to sensitivities in relation to locations of rare or threatened species and citizen-scientist information (Rowley and Callaghan 2020). However, the data, with sensitive species’ localities removed or buffered, are made available annually (Rowley and Callaghan 2020; data available through GBIF: https://doi.org/10.15468/wazqft and FrogID: https://www.frogid.net.au/explore) and audio can be requested from the FrogID project. Maps of the current ranges of Litoria ewingii, Litoria paraewingi and Litoria verreauxii in Australia are available as part of the Australian Frog Atlas (https://zenodo.org/record/6544829).
Acknowledgements
We thank Thomas Parkin for his assistance with elevation mapping. We thank the Australian Museum staff and volunteers who contribute to the continued success of FrogID. We also thank the thousands of Australian citizen scientists who dedicate their time and efforts to contributing to FrogID.
References
Amano T, Lamming JDL, Sutherland WJ (2016) Spatial gaps in global biodiversity information and the role of citizen science. Bioscience 66(5), 393-400.
| Crossref | Google Scholar |
Banks SC, Scheele BC, Macris A, Hunter D, Jack C, Fraser CI (2020) Chytrid fungus infection in alpine tree frogs is associated with individual heterozygosity and population isolation but not population-genetic diversity. Frontiers of Biogeography 12(1), e43875e.
| Crossref | Google Scholar |
Bee MA, Perrill SA (1996) Responses to conspecific advertisement calls in the green frog (Rana clamitans) and their role in male-male communication. Behaviour 133, 283-301.
| Crossref | Google Scholar |
Bee MA, Perrill SA, Owen PC (2000) Male green frogs lower the pitch of acoustic signals in defense of territories: a possible dishonest signal of size? Behavioral Ecology 11, 169-177.
| Crossref | Google Scholar |
Bela G, Peltola T, Young JC, Balázs B, Arpin I, Pataki G, Hauck J, Kelemen E, Kopperoinen L, Van Herzele A, Keune H, Hecker S, Suškevičs M, Roy HE, Itkonen P, Külvik M, László M, Basnou C, Pino J, Bonn A (2016) Learning and the transformative potential of citizen science. Conservation Biology 30(5), 990-999.
| Crossref | Google Scholar | PubMed |
Bivand R, Keitt T, Rowlingson B (2022) rgdal: bindings for the ‘geospatial’ data abstraction library. R package version 1.5-29. Available at https://CRAN.R-project.org/package=rgdal
Blaustein AR, Wake DB (1995) The puzzle of declining amphibian populations. Scientific American 272(4), 52-57.
| Crossref | Google Scholar |
Brattstrom BH (1963) A preliminary review of the thermal requirements of amphibians. Ecology 44(2), 238-255.
| Crossref | Google Scholar |
Brown GW, Scroggie MP, Smith MJ, Steane D (2007) An evaluation of methods for assessing the population status of the threatened alpine tree frog Litoria Verreauxii Alpina in Southeastern Australia. Copeia 2007(3), 765-770.
| Crossref | Google Scholar |
Bull JW, Milner-Gulland E-J, Müller J (2020) Choosing prevention or cure when mitigating biodiversity loss: trade-offs under ‘no net loss’ policies. Journal of Applied Ecology 57(2), 354-366.
| Crossref | Google Scholar |
Callaghan CT, Roberts JD, Poore AGB, Alford RA, Cogger H, Rowley JJL (2020) Citizen science data accurately predicts expert-derived species richness at a continental scale when sampling thresholds are met. Biodiversity and Conservation 29(4), 1323-1337.
| Crossref | Google Scholar |
Cocroft RB, Ryan MJ (1995) Patterns of advertisement call evolution in toads and chorus frogs. Animal Behaviour 49, 283-303.
| Crossref | Google Scholar |
Cutajar TP, Portway CD, Gillard GL, Rowley JJL (2022) Australian Frog Atlas: species’ distribution maps informed by the FrogID dataset. Technical Reports of the Australian Museum (online) 36. pp. 1–48. (The Australian Museum) 10.3853/j.1835-4211.36.2022.1789
Darwell CT, Cook JM (2017) Cryptic diversity in a fig wasp community-morphologically differentiated species are sympatric but cryptic species are parapatric. Molecular Ecology 26(3), 937-950.
| Crossref | Google Scholar | PubMed |
Department of Agriculture, Water and the Environment (2014) Approved Conservation Advice for Litoria verreauxii alpina (alpine tree frog). Department of the Environment. Available at http://www.environment.gov.au/biodiversity/threatened/species/pubs/66669-conservation-advice.pdf
Dickinson JL, Zuckerberg B, Bonter DN (2010) Citizen science as an ecological research tool: challenges and benefits. Annual Review of Ecology, Evolution, and Systematics 41, 149-172.
| Crossref | Google Scholar |
Fang G, Jiang F, Yang P, Cui J, Brauth SE, Tang Y (2014) Male vocal competition is dynamic and strongly affected by social contexts in music frogs. Animal Cognition 17, 483-494.
| Crossref | Google Scholar | PubMed |
Forti LR, Costa WP, Martins LB, Nunes-de-Almeida CHL, Toledo LF (2016) Advertisement call and genetic structure conservatism: good news for an endangered Neotropical frog. PeerJ 4, e2014.
| Crossref | Google Scholar |
Frost DR (2023) Amphibian species of the world: an online reference (version 6.1). Electronic Database. American Museum of Natural History, New York, NY, USA. Accessible at https://amphibiansoftheworld.amnh.org/index.php [Accessed 27 January 2023]
Gartside DF (1972) The Litoria ewingi complex (Anura : Hylidae) in south-eastern Australia III. Blood protein variation across a narrow hybrid zone between L. ewingi and L. paraewingi. Australian Journal of Zoology 20(4), 435-443.
| Crossref | Google Scholar |
Gartside DF (1982) The Litoria ewingi complex (Anura : Hylidae) in south-eastern Australia VI. Geographic variation in transferrins of four taxa. Australian Journal of Zoology 30(1), 103-113.
| Crossref | Google Scholar |
Gerhardt HC (1991) Female mate choice in treefrogs: static and dynamic acoustic criteria. Animal Behaviour 42(4), 615-635.
| Crossref | Google Scholar |
Gerhardt HC, Davis MS (1988) Variation in the coding of species identity in the advertisement calls of Litoria verreauxii (Anura: Hylidae). Evolution 42(3), 556-565.
| Crossref | Google Scholar | PubMed |
Gillard GL, Rowley JJL (2023) Assessment of the acoustic adaptation hypothesis in frogs using large-scale citizen science data. Journal of Zoology 320(4), 271-281.
| Crossref | Google Scholar |
Gillespie GR, Roberts JD, Hunter D, Hoskin CJ, Alford RA, Heard GW, Hines H, Lemckert F, Newell D, Scheele BC (2020) Status and priority conservation actions for Australian frog species. Biological Conservation 247, 108543.
| Crossref | Google Scholar |
Heard GW, Canessa S, Parris KM (2015) Interspecific variation in the phenology of advertisement calling in a temperate Australian frog community. Ecology and Evolution 5(18), 3927-3938.
| Crossref | Google Scholar | PubMed |
Hero J, Morrison C (2004) Frog declines in Australia: global implications. The Herpetological Journal 14, 175-186.
| Google Scholar |
Hijmans RJ (2022) raster: geographic data analysis and modeling. R package version 3.5-15. Available at https://CRAN.R-project.org/package=raster
Hopkins WA (2007) Amphibians as models for studying environmental change. ILAR Journal 48(3), 270-277.
| Crossref | Google Scholar | PubMed |
Howard RD, Young JR (1998) Individual variation in male vocal traits and female mating preferences in Bufo americanus. Animal Behaviour 55, 1165-1179.
| Crossref | Google Scholar | PubMed |
IUCN (2021) The IUCN Red List of Threatened Species. Version 2021-3. Available at https://www.iucnredlist.org [Accessed 28 March 2022]
K Lisa Yang Center for Conservation Bioacoustics (2022) Raven Pro: interactive sound analysis software (version 1.6.4) [Computer software]. (The Cornell lab of Ornithology: Ithaca, NY, USA) Available at https://ravensoundsoftware.com/
Kassambara A (2020) ggpubr: ‘ggplot2’ based publication ready plots. R package version 0.4.0. Available at https://CRAN.R-project.org/package=ggpubr
Kim KC, Byrne LB (2006) Biodiversity loss and the taxonomic bottleneck: emerging biodiversity science. Ecological Research 21(6), 794-810.
| Crossref | Google Scholar |
Kime NM, Burmeister SS, Ryan MJ (2004) Female preferences for socially variable call characters in the cricket frog, Acris crepitans. Animal Behaviour 68(6), 1391-1399.
| Crossref | Google Scholar |
Krauss J, Bommarco R, Guardiola M, Heikkinen RK, Helm A, Kuussaari M, Lindborg R, Öckinger E, Pärtel M, Pino J, Pöyry J, Raatikainen KM, Sang A, Stefanescu C, Teder T, Zobel M, Steffan-Dewenter I (2010) Habitat fragmentation causes immediate and time-delayed biodiversity loss at different trophic levels. Ecology Letters 13(5), 597-605.
| Crossref | Google Scholar | PubMed |
Köhler J, Jansen M, Rodríguez A, Kok PJR, Toledo LF, Emmrich M, Glaw F, Haddad CFB, Rödel M-O, Vences M (2017) The use of bioacoustics in anuran taxonomy: theory, terminology, methods and recommendations for best practice. Zootaxa 4251(1), 1-124.
| Crossref | Google Scholar | PubMed |
Lesbarreres D, Lodé T (2002) Variations in male calls and responses to an unfamiliar advertisement call in a territorial breeding anuran, Rana dalmatina: evidence for a “dear enemy” effect. Ethology Ecology & Evolution 14, 287-295.
| Crossref | Google Scholar |
Lillywhite HB (1970) Behavioral temperature regulation in the bullfrog, Rana catesbeiana. Copeia 1970, 158-168.
| Crossref | Google Scholar |
Littlejohn MJ (1965) Premating isolation in the Hyla ewingi complex (Anura: Hylidae). Evolution 19(2), 234-243.
| Crossref | Google Scholar |
Littlejohn MJ (1976) The Litoria ewingi complex (Anura : Hylidae) in south-eastern Australia IV. Variation in mating-call structure across a narrow hybrid zone between L. ewingi and L. paraewingi. Australian Journal of Zoology 24(2), 283-167.
| Crossref | Google Scholar |
Littlejohn MJ, Roberts JD (1975) Acoustic analysis of an intergrade zone between two call races of the Limnodynastes tasmaniensis complex (Anura: Leptodactylidae) in south-eastern Australia. Australian Journal of Zoology 23(1), 113-122.
| Crossref | Google Scholar |
Littlejohn MJ, Watson GF (1983) The Litoria ewingi complex (Anura: Hylidae) in south-eastern Australia VII. Mating-call structure and genetic compatibility across a narrow hybrid zone between L. ewingi and L. paraewingi. Australian Journal of Zoology 31(2), 193-204.
| Crossref | Google Scholar |
Luedeling E (2019) chillR: statistical methods for phenology analysis in temperate fruit trees. R package version 0.70.15. Available at https://CRAN.R-project.org/package=chillR
Lötters S, Schmitz A, Reichle S, Rödder D, Quennet V (2009) Another case of cryptic diversity in poison frogs (Dendrobatidae: Ameerega): description of a new species from Bolivia. Zootaxa 2028, 20-30.
| Crossref | Google Scholar |
Mahony M, Moses B, Mahony SV, Lemckert FL, Donnellan S (2020) A new species of frog in the Litoria ewingii species group (Anura: Pelodryadidae) from south-eastern Australia. Zootaxa 4858(2), 201-230.
| Crossref | Google Scholar |
Martínez-Rivera CC, Gerhardt HC (2008) Advertisement-call modification, male competition, and female preference in the bird-voiced treefrog Hyla avivoca. Behavioral Ecology and Sociobiology 63(2), 195-208.
| Crossref | Google Scholar |
Mitchell BA, Callaghan CT, Rowley JJL (2020) Continental-scale citizen science data reveal no changes in acoustic responses of a widespread tree frog to an urbanisation gradient. Journal of Urban Ecology 6(1), juaa002.
| Crossref | Google Scholar |
Morais AR, Batista VG, Gambale PG, Signorelli L, Bastos RP (2012) Acoustic communication in a neotropical frog (Dendropsophus minutus): vocal repertoire, variability and individual discrimination. Herpetological Journal 22(4), 249-257.
| Google Scholar |
Narins PM, Meenderink SWF (2014) Climate change and frog calls: long-term correlations along a tropical altitudinal gradient. Proceedings of the Royal Society B: Biological Sciences 281(1783), 20140401.
| Crossref | Google Scholar |
Ooms J (2023) av: working with audio and visual in R. R package version 0.9.0. Available at https://CRAN.R-project.org/package=av
Oseen KL, Wassersug RJ (2002) Environmental factors influencing calling in sympatric anurans. Oecologia 133(4), 616-625.
| Crossref | Google Scholar | PubMed |
O’Connor NE, Crowe TP (2005) Biodiversity loss and ecosystem functioning: distinguishing between number and identity of species. Ecology 86(7), 1783-1796.
| Crossref | Google Scholar |
Parkin T, Rowley JJL, Elliott-Tate J, Mahony MJ, Sumner J, Melville J, Donnellan SC (2024) Systematic assessment of the brown tree frog (Anura: Pelodryadidae: Litoria ewingii) reveals two endemic species in South Australia. Zootaxa 5406(1), 1-36.
| Crossref | Google Scholar | PubMed |
Pebesma E (2018) Simple features for R: standardized support for spatial vector data. The R Journal 10(1), 439-446.
| Crossref | Google Scholar |
Perpinan Lamigueiro O, Hijmans R (2022) rasterVis. R package version 0.51.2. Available at https://CRAN.R-project.org/package=rasterVis
R Core Team (2021) ‘R: a language and environment for statistical computing.’ (R Foundation for Statistical Computing, Vienna, Austria) Available at https://www.R-project.org/
Renan S, Gafny S, Perl RGB, Roll U, Malka Y, Vences M, Geffen E (2017) Living quarters of a living fossil-uncovering the current distribution pattern of the rediscovered Hula painted frog (Latonia nigriventer) using environmental DNA. Molecular Ecology 26(24), 6801-6812.
| Crossref | Google Scholar | PubMed |
Roberts JD (1993) Hybridization between the western and northern call races of the Limnodynastes–Tasmaniensis complex (Anura, Myobatrachidae) on the Murray River in South Australia. Australian Journal of Zoology 41(2), 101-122.
| Crossref | Google Scholar |
Rocha CFD, Van Sluys M, Hatano FH, Boquimpani-Freitas L, Marra RV, Marques RV (2004) Relative efficiency of anuran sampling methods in a restinga habitat (Jurubatiba, Rio de Janeiro, Brazil). Brazilian Journal of Biology 64(4), 879-884.
| Crossref | Google Scholar |
Rowley JJL, Alford RA (2013) Hot bodies protect amphibians against chytrid infection in nature. Scientific Reports 3, 1515.
| Crossref | Google Scholar | PubMed |
Rowley JJL, Callaghan CT (2020) The FrogID dataset: expert-validated occurrence records of Australia’s frogs collected by citizen scientists. ZooKeys 912, 139-151.
| Crossref | Google Scholar | PubMed |
Rowley JJL, Callaghan CT, Cutajar T, Portway C, Potter K, Mahony S, Trembath D, Flemons P, Woods A (2019) FrogID: citizen scientists provide validated biodiversity data on frogs of Australia. Herpetological Conservation and Biology 14(1), 155-170.
| Crossref | Google Scholar |
Ryan MJ, Cocroft RB, Wilczynski W (1990) The role of environmental selection in intraspecific divergence of mate recognition signals in the cricket frog, Acris crepitans. Evolution: International Journal of Organic Evolution 44(7), 1869-1872.
| Crossref | Google Scholar | PubMed |
Scheele BC, Legge S, Armstrong DP, Copley P, Robinson N, Southwell D, Westgate MJ, Lindenmayer DB (2018) How to improve threatened species management: an Australian perspective. Journal of Environmental Management 223, 668-675.
| Crossref | Google Scholar | PubMed |
Smith MJ, Osborne W, Hunter D (2003) Geographic variation in the advertisement call structure of Litoria verreauxii (Anura: Hylidae). Copeia 2003(4), 750-758.
| Crossref | Google Scholar |
Smith KL, Hale JM, Kearney MR, Austin JJ, Melville J (2013a) Molecular patterns of introgression in a classic hybrid zone between the Australian tree frogs, L. ewingii and L. paraewingi: evidence of a tension zone. Molecular Ecology 22(7), 1869-1883.
| Crossref | Google Scholar | PubMed |
Smith KL, Hale JM, Gay L, Kearney M, Austin JJ, Parris KM, Melville J (2013b) Spatio-temporal changes in the structure of an Australian frog hybrid zone: a 40-year perspective. Evolution 67(12), 3442-3454.
| Crossref | Google Scholar | PubMed |
South A (2017a) rnaturalearth: world map data from natural earth. R package version 0.1.0. Available at https://CRAN.R-project.org/package=rnaturalearth
South A (2017b) rnaturalearthdata: world vector map data from natural earth used in ‘rnaturalearth’. R package version 0.1.0. Available at https://CRAN.R-project.org/package=rnaturalearthdata
Souza DM, Teixeira RFM, Ostermann OP (2015) Assessing biodiversity loss due to land use with Life Cycle Assessment: are we there yet? Global Change Biology 21(1), 32-47.
| Crossref | Google Scholar | PubMed |
Sparks AH, Padgham M, Parsonage H, Pembleton K, Balamuta J, Anderson B (2019) bomrang: Australian Government Bureau of Meteorology (BOM) data from R. R package version 0.5.0. Available at https://CRAN.R-project.org/package=bomrang
Sullivan BK, Hinshaw SH (1990) Variation in advertisement calls and male calling behavior in the spring peeper (Pseudacris crucifer). Copeia 1990(4), 1146-1150.
| Crossref | Google Scholar |
Sumner M (2021) ozmaps: Australia Maps. R package version 0.4.5. Available at https://CRAN.R-project.org/package=ozmaps
Tessarolo G, Maciel NM, de Morais AR, Bastos RP (2016) Geographic variation in advertisement calls among populations of Dendropsophus cruzi (Anura: Hylidae). Herpetological Journal 26, 219-224.
| Google Scholar |
Theodoridis S, Nogués-Bravo D, Conti E (2019) The role of cryptic diversity and its environmental correlates in global conservation status assessments: insights from the threatened bird’s-eye primrose (Primula farinosa L.). Diversity and Distributions 25(9), 1457-1471.
| Crossref | Google Scholar |
Toledo LF, Martins IA, Bruschi DP, Passos MA, Alexandre C, Haddad CFB (2014) The anuran calling repertoire in the light of social context. Acta Ethologica 18(2), 87-99.
| Crossref | Google Scholar |
Van Sluys M, Marra RV, Boquimpani-Freitas L, Rocha CFD (2012) Environmental factors affecting calling behavior of sympatric frog species at an Atlantic Rain Forest Area, Southeastern Brazil. Journal of Herpetology 46(1), 41-46.
| Crossref | Google Scholar |
Wake DB, Vredenburg VT (2008) Are we in the midst of the sixth mass extinction? A view from the world of amphibians. Proceedings of the National Academy of Sciences of the USA 105, 11466-11473.
| Google Scholar | PubMed |
Watson GF (1972) The Litoria ewingi complex (Anura : Hylida) in south-eastern Australia II. Genetic incompatibility and delimitation of a narrow hybrid zone between L. ewingi and L. paraewingi. Australian Journal of Zoology 20(4), 423-433.
| Crossref | Google Scholar |
Watson GF, Littlejohn MJ (1978) The Litoria ewingi complex (Anura: Hylidae) in south-eastern Australia V. Interactions between northern L. ewingi and adjacent taxa. Australian Journal of Zoology 26(1), 175-195.
| Crossref | Google Scholar |
Watson GF, Loftus-Hills JJ, Littlejohn MJ (1971) The Litoria ewingi complex (Anura : Hylidae) in south-eastern Australia I: a new species from Victoria. Australian Journal of Zoology 19(4), 401-416.
| Crossref | Google Scholar |
Watson GF, Littlejohn MJ, Gartside DF, Loftus-Hills JJ (1985) The Litoria ewingi complex (Anura : Hylidae) in South-Eastern Australia VIII. Hybridization between L. ewingi and L. verreauxii alpina in the Mount Baw Baw Area, south central Victoria. Australian Journal of Zoology 33(2), 143-152.
| Crossref | Google Scholar |
Weaver SJ, Callaghan CT, Rowley JJL (2020) Anuran accents: continental-scale citizen science data reveal spatial and temporal patterns of call variability. Ecology and Evolution 10(21), 12115-12128.
| Crossref | Google Scholar | PubMed |
Wells KD, Schwartz JJ (1984) Vocal communication in a Neotropical treefrog, Hyla ebraccata: advertisement calls. Animal Behaviour 32, 405-420.
| Crossref | Google Scholar |
Wells KD, Taigen TL (1986) The effect of social interactions on calling energetics in the gray treefrog (Hyla versicolor). Behavioral Ecology and Sociobiology 19, 9-18.
| Crossref | Google Scholar |
Whiles MR, Hall RO, Jr, Dodds WK, Verburg P, Huryn AD, Pringle CM, Lips KR, Kilham SS, Colón-Gaud C, Rugenski AT, Peterson S, Connelly S (2013) Disease-driven amphibian declines alter ecosystem processes in a tropical stream. Ecosystems 16(1), 146-157.
| Crossref | Google Scholar |
Wickham H, Girlich M (2022) tidyr: Tidy Messy Data. R package version 1.2.0. Available at https://CRAN.R-project.org/package=tidyr
Wickham H, Seidel D (2020) scales: scale functions for visualization. R package version 1.1.1. Available at https://CRAN.R-project.org/package=scales
Wickham H, François R, Henry L, Müller K (2022a) dplyr: a grammar of data manipulation. R package version 1.0.8. Available at https://CRAN.R-project.org/package=dplyr
Wickham H, Hester J, Bryan J (2022b) readr: read rectangular text data. R package version 2.1.2. Available at https://CRAN.R-project.org/package=readr
Woodford JE, Meyer MW (2003) Impact of lakeshore development on green frog abundance. Biological Conservation 110(2), 277-284.
| Crossref | Google Scholar |