

What has driven acute public hospital expenditure growth in South Australia? An analysis of the relative importance of major expenditure drivers between 2006–07 and 2017–18
Allison Larg A C and John R. Moss B
B
A Central Adelaide Local Health Network, Roma Mitchell House, 136 North Terrace, Adelaide, SA 5000, Australia.
B The University of Adelaide, School of Public Health, North Terrace, Adelaide, SA 5000, Australia. Email: john.moss@adelaide.edu.au
C Corresponding author. Email: allison.larg@sa.gov.au
Australian Health Review 46(2) 134-142 https://doi.org/10.1071/AH21045
Submitted: 7 February 2021 Accepted: 5 July 2021 Published: 9 November 2021
Journal Compilation © AHHA 2022 Open Access CC BY-NC-ND
Abstract
Objective The aim of this study was to investigate whether increasing costs of delivering care have driven real growth in acute public hospital expenditure in South Australia (SA) and what has contributed to these real cost increases.
Methods Using published time-series data, we decomposed inflation-adjusted growth in per capita total acute public hospital recurrent expenditure into its major utilisation and cost components to evaluate their relative contribution over the 12 years to 2017–18.
Results Real per capita total acute public hospital recurrent expenditure grew by AU$667 (45.2%) over the 12-year period; of this, 86.0% was from real growth in input costs per weighted activity unit, with real growth in the average salaries of hospital staff accounting for AU$247 or 37.0%. Hospital utilisation rates contributed a minor 14.0%.
Conclusion Over the 12 years to 2017–18, real growth in average clinical salaries was a more important driver of real growth in per capita total acute public hospital expenditure than rates of hospital utilisation. This would be facilitated by improvements in the scope, accuracy, quality and consistency of published national hospital data.
What is known about the topic? Public hospital expenditure is one of the largest and fastest growing areas of government expenditure in Australia. Policy narratives often centre around demand pressures from an increasingly older, overweight, and chronically ill population. Comparatively little attention has been paid to the influence of increases in real input costs within the Australian context.
What does this paper add? Real salary growth has been a major driver of acute public hospital recurrent expenditure growth in SA, whereas hospital utilisation rates have played a minor role.
What are the implications for practitioners? A clearer understanding of the main drivers of acute public hospital expenditure growth and the resulting benefits to population health is needed to guide the efficient and sustainable use of scarce healthcare resources.
Introduction
Public hospital expenditure is one of the largest and fastest growing areas of government expenditure in Australia,1 comprising ~27.3% of reported total recurrent spending by Commonwealth and State and Territory governments in 2018–19.2 Policymakers and analysts have sought to identify its main drivers to determine effective ways to control future spending, ensure sustainable growth, and direct scarce healthcare resources to their best use.3–9 Attention has often focussed on rising rates of chronic illness from an increasingly older and overweight population.3,7,10–12 Yet, in a previous study, we found that in South Australia (SA), the cost of overweight- and obesity-attributable admitted hospitalisationsA contributed relatively little to the increase in real acute public hospital in-patient expenditure between the financial years 2007–08 and 2011–12.13
Although examining trends in known drivers of hospital utilisation is useful, further insight can be gained from breaking down expenditure growth into its major contributing factors through decomposition analysis.14–19 The decomposition analysis included in our previous study found that most of the real growth in in-patient expenditure in SA acute public hospitals over the 5 years to 2011–12 was from an increased average cost of delivering in-patient care across all treatments and conditions, which is consistent with findings from four studies from the USA and one from China that have found increasing average treatment costs to be the dominant driver of healthcare expenditure growth in those countries.14–18 This prompted our present study to investigate whether our earlier finding is reflective of public hospital expenditure growth overall (i.e. including non-admitted care) and over the longer term and, if so, what has driven the real growth in the costs of delivering public hospital care.
In this paper, we decompose the total (admitted and non-admitted) real expenditure growth in SA acute public hospitals over a longer (12-year) timeframe to 2017–18. During this period, nominal annual expenditureB more than doubled from AU$1.80 billion to AU$3.72 billion,20,21 representing a 61% increase in real terms (2017–18 prices).22 The SA population grew by a relatively minor 11% over the same period, from 1.57 million to 1.74 million.23
We quantified the individual additive contributions to this expenditure growth from changes in: real average salaries; staffing inputs; and the real prices of non-labour inputs, each calculated by using a major expenditure category. Notably, the importance of labour cost drivers in expenditure growth has received seemingly little attention within the Australian literature, despite labour costs typically comprising upwards of two-thirds of acute public hospital expenditure in AustraliaC (67% in 2017–18).24 Unlike our previous study, here we controlled for the effect of changes in the size of the SA population on hospital utilisation to distil the expenditure effects of changes in the per capita rate of hospital utilisation, being the component of utilisation likely to be amenable to healthcare policy and management decisions. We also controlled for the effects of changes in the overall hospital case mix on the average cost per hospitalisation to appropriately distinguish these effects as related to changes in hospital use rather than average input costs.
Methods
We used decomposition analysis to quantify the individual effects of changes in hospital utilisation rates and average input costs on the growth in total per capita acute public hospitalD expenditure (APHE) between the base (2006–07) and final (2017–18) year of the study period. We excluded depreciation expenditure from the analysis because the focus of this study was growth in non-capital recurrent expenditure. During the reported years, depreciation comprised between 3.1% and 3.6% of SA’s total acute public hospital expenditure.20,21,25–34 APHE in each year was measured in constant 2017–18 prices, using the All Price Consumer Price Index (CPI) for Australia’s eight capital cities.22
For this study, we defined hospital spending as the product of the reported quantity of admitted and non-admitted services provided and the cost per service provided. We attributed the minor proportion (between 3.7% and 5.4%, based on the data available for our study period35–38) of APHE that went towards teaching and research, and other miscellaneous activities to the non-admitted component of hospital services.
For the number of acute public hospital services provided, we used published activity units,E and adjusted these for the average case complexity by multiplying by the average SA public hospital cost weight for the relevant year. This was to account for overall changes in case complexity as a utilisation-related driver of hospital expenditure growth. Average SA public hospital cost weights represent the relative cost of treating a given mix of cases in SA compared with the national average public hospital case mix during the corresponding year.
Notably, the absence of a single published series of counts of non-admitted activity over the study period necessitated that the decomposition analysis be split into two periods over which consistent non-admitted activity time-series data were published: 2006–07 to 2013–14 and 2013–14 to 2017–18. This was made possible by the reporting of counts derived from the original and revised counting method for the overlapping year (2013–14) in the published data. We summed our estimates of decomposed expenditure growth for each period to derive estimates for the whole period.
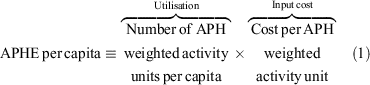
We controlled for population growth by dividing APHE in each year by the size of the SA population in that year.23 Thus, we defined APHE per capita in terms of its major drivers of utilisation and input cost (Eqn 1).
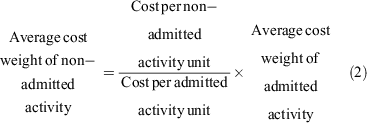
In the absence of published annual cost weights for non-admitted activity, we derived these by assuming that the ratio of the non-admitted to admitted average cost weight in each year would be equal to the ratio of the cost per non-admitted to admitted activity unit for the corresponding year (Eqn 2).
Finally, to identify the main drivers of expenditure growth, we further split per capita APHE into its non-labour and labour components, and the labour component into its components of input quantity (full-time equivalent hospital employed staff, or FTE) and the cost per hospital staff FTE (average salary). Visiting Medical Officer (VMO) payments were added as a separate item under labour, because VMO FTE data are not available, precluding such a split. To derive salary and wages expenditures for each occupational category inclusive of superannuation, we apportioned superannuation expenditure to salary costs on a pro rata basis.
The final APHE model is represented by the identity in Eqn 3, which delineates the major expenditure drivers and their components.
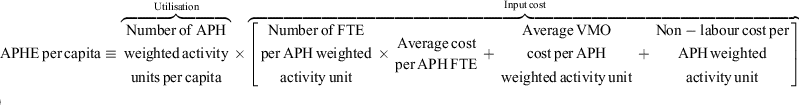
where Average cost per APH FTE = average salary plus superannuation.
We decomposed the growth in real per capita APHE from the base (2006–07) to the final year (2017–18) by applying the demographic decomposition approach, in accordance with Chapter 5 of Das Gupta (1993),39 to Eqn 3. The decomposition calculations, described in Supplementary File S1 available at the journal website, were performed for each input category for which APHE was reported, with the exceptions of administrative labour and non-labour for reasons explained below. Annual results were also obtained for each intervening year by applying the same method to the year-by-year change in real APHE.
The distinguishing feature of Das Gupta’s approach is that the calculated individual components of growth are completely additive, with no residual terms. It has been adopted elsewhere to decompose healthcare expenditure growth and the burden of disease where several contributing factors were identified.17,18,40 To assist in interpreting our results, we calculated each factor’s contributions using two other common decomposition approaches, namely variance analysis from cost accounting and the interaction approach, which are provided (along with an explanation of the differences in these methods) in Supplementary Material File S1.
We populated the expenditure and hospital activity components of Eqn 3 with publicly available SA time-series data sourced from the tables presented within Australian Institute of Health and Welfare (AIHW) publications.20,21,25–34,41–50 The published data were from the national databases compiled from the Public hospital establishments National Minimum Data Set (PHE NMDs) and the Local Hospital Network Data Set Specification (LHN DSS) whose collection by State and Territory governments is mandated through National Healthcare Agreements in accordance with the specifications of the National Data Dictionaries. These data are sourced from the patient and financial administrative systems of acute public hospitals (with minor exceptions), including psychiatric hospitals, drug and alcohol hospitals and dental hospitals, and excluding dedicated subacute hospitals. The individual States and Territories are primarily responsible for the quality of their own submissions, so although AIHW undertakes extensive data validation processes, it does not correct for errors or missing values.41
From the 2014–2015 financial year onwards, expenditure and FTE within the central Health Department and Local Health Networks related to acute public hospital-related administrative activities were included for the first time in the reported SA acute public hospital data.42 To avoid an artefactual estimate of expenditure growth resulting from these reporting changes, we excluded reported administrative labour and non-labour expenditure components and administrative FTE from our decomposition analysis. Detailed descriptions and sources for all data used in this analysis are provided in Supplementary File S2.
Results
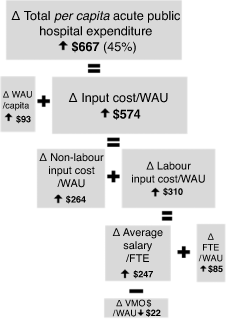
Per capita APHE in SA grew in real terms by AU$667, equating to a total of 45.2% growth over the 12-year period (Table 1) and an average annual compounded growth rate of 3.4%. Although expenditure on non-labour inputs grew by a considerably greater percentage (70.8%) than expenditure on labour inputs (35.2%), the latter contributed more to the total real growth in per capita APHE (AU$375 vs AU$293), due to labour costs making up a larger proportion of total expenditure.

|
From the results of the decomposition analysis presented in Table 2 and summarised in Figure 1, real per capita APHE growth over the 12-year period was largely driven by real increases in input costs per weighted activity unit (WAU), which accounted for an estimated AU$574 (86.0%) In contrast, increases in hospital utilisation rates contributed a relatively minor AU$93 (14.0%).

|
|
Of the AU$310 growth in real per capita APHE that was from labour input costs, AU$247 was attributable to real increases in average salaries (salary expenditure per FTE), with medical and nursing increases making up the majority (AU$233) (Table 2). Overall, real increases in the average salaries of hospital staff contributed an estimated 37.0% of the total real per capita APHE growth over the 12-year period. The real increase in average nursing salaries was the most important single driver of real per capita APHE growth overall, contributing AU$117 (17.6%). This was despite this rise in nursing salaries being relatively small in percentage terms (19.6% or 1.6% compounded annually) compared with that of medical staff (37.3% or 2.9% compounded annually), as shown in Table 3; and reflects the high proportion of nursing staff FTE (56.7% and 58.9% respectively in the base and final years). Nonetheless, the real uplift in average medical salaries (AU$64 355) over the 12-year the period (Table 3) was sufficiently large to contribute a similar share towards real per capita APHE growth (AU$116 and 17.4%) over the 12-year period (Table 2). Although the percentage growth in the average salaries of diagnostic and allied health staff over the 12-year period was similar to that of nursing staff (20.1% or 1.7% compounded annually), the former accounted for a much smaller (AU$19 or 2.8%) share of real per capita APHE growth, due to their much smaller representation within the hospital workforce.

|
The contribution from increases in the number of clinical FTE per 1000 WAUs was AU$85 (12.8%) over the 12-year period. The largest contribution by occupational category was from medical officers, representing AU$63 or 9.4% of the growth and whose FTE per 1000 WAUs increased by 22.7% or 0.87 FTE per 1000 WAUs. This was followed by nursing staff at AU$38 or 5.7% of the growth and whose FTE inputs per 1000 WAUs increased by 1.21 (7.6%) over the period (Table 3). Diagnostic and allied health FTE per 1000 WAUs grew by a similar percentage as nursing (7.4%, from Table 3), but contributed a much smaller share (AU$11 or 1.7%) of the total real per capita APHE growth (Table 2), due to their much lower FTE base. In contrast, domestic and other staff FTE per 1000 WAUs reduced over the period (Table 3), providing a small offset; albeit the real increase in the cost of domestic services per WAU contributed 14.1% to total real growth, making it the third largest single driver.
Figure 2 depicts the estimated cumulative annual contribution of utilisation rates and input cost drivers (split into labour and non-labour components) to per capita APHE growth over the 12-year study period. Although the year-on-year relative contributions of each of these factors varied, input costs had a substantially greater overall effect than utilisation rates.

|
Discussion
We found that the main contributor to real growth in total per capita acute public hospital recurrent expenditure in SA over the 12 years to 2017–18 was growth in the input cost per weighted activity unit, driven foremost by real increases in the average salaries of hospital staff, particularly medical and nursing. These results concur with our earlier finding that growth in the use of public hospital services has not been a major expenditure driver in SA.13 This is despite the population prevalence of overweight and obesity increasing from 61.6% to 69.7% of adults between 2007–08 and 2017–18, and evidence that overweight and obese individuals are relatively more frequent users of healthcare services compared with their normal weight counterparts.51–53
Our main finding is also consistent with that from four recent decomposition analyses from the US and one from China, which have identified increasing average treatment costs as the most important healthcare expenditure driver.14–18 However, it is difficult to make more detailed comparisons with these studies because, rather than the contribution of the cost per treatment, they reported the cost per treated person, which embodies both the number of treatments per person and the cost per treatment. The former requires yearly counts of treated individuals, which are not reported in the Australian data. For the same reason, we could not further decompose throughput-related expenditure growth into the number of persons treated and the frequency of treatments per person.
We found one Australian decomposition analysis of total hospitalisation costs for cardiovascular disease from 1993–94 to 2003–04, which reported that an increase in the average cost per healthcare episode was the largest cost driver for acute conditions and a major cost driver for chronic conditions, even without controlling for the impact of population growth.54 However, we could find no studies in the published or grey literature that identified the contribution of labour input costs to hospital expenditure in Australia or elsewhere, with which to compare our main finding. Nonetheless, disproportionate real increases in labour costs within the healthcare industries of some Organisation for Economic Co-operation and Development (OECD) countries have been described.55,56
In SA, upward pressure on labour costs has perhaps been influenced by local industrial conditions such as a strong union presence and workforce shortages, although whether this may have limited technology-enabled productivity growth is unknown. At the same time, increases in treatment complexity, combined with budgetary-related pressures for earlier discharge could conceivably have driven up the required average skill mix of hospital staff, leading to a higher-paid staffing configuration, while reducing recovery times and length of stay.57 AIHW data suggest that over time, clinical input has been compressed into fewer days, which may well have justified greater financial compensation.58,59 Likewise, a recent report attributed real increases in Australian healthcare expenditure to the provision of ‘new, improved and more services per person’ over a period that overlapped our present study (2002–03 to 2011–12).60
Regarding medical officer salaries, public sector employment arrangements in Australia have permitted concurrent employment in private hospitals, at which doctors may set their own practice fees. Those seeking to match remuneration levels through the public sector enterprise bargaining process may have put upward pressure on public sector remuneration. Although this is not unique to SA, comparisons of average wages across other Australian jurisdictions indicate that SA’s industrial awards for medical officers have been relatively favourable, with the average full-time medical salary in SA reportedly higher than in most other States, including 37.5% higher than in New South Wales, which has the lowest.61 In contrast, because medical officers may not always accurately document all of their hours worked in public hospitals, reported FTE may well be understated, and thus average salaries overstated. Moreover, the calculation method for historical hospital FTE data reported by government officials within the SA Health Department has been publicly questioned.62 Such phenomena may introduce uncertainty into our assessment of the relative contribution to real per capita APHE growth from salary increases versus increases in the number of FTEs per WAU. However, they do not affect our assessment of the importance of the growth in real labour costs to real per capita APHE growth in SA over the 12-year period examined.
It is difficult to determine with certainty from the published data the extent to which patient complexity changed over the 12-year period. Although average cost weights reflect relative resource intensity, which may be influenced by patient and treatment complexity, they are not generally accepted as a sound clinical indicator of either. Moreover, the cost weight of an individual Diagnosis Related Group (DRG) in comparison to another is influenced not just by patient complexity, but also by changes in the prices of its specific inputs and in related clinical practices over time.63 In any case, the patient and treatment characteristics accounted for when classifying cases into DRGs and subsequently assigning cost weights are relatively limited; the completeness with which such information is documented in patients’ files is variable; and the quality of clinical coding can change over time.64
It is also difficult to detect improvements in the quality of treatment or in patients’ health and wellbeing from published data, which other than some rudimentary indicators of patient safety, lack patient outcome or treatment effectiveness measures, as these are not routinely recorded in Australian public hospitals. Yet, such information is needed in an aggregate form to understand the benefits from increased labour and other costs.
Notwithstanding these limitations, our findings highlight the importance of correctly understanding the relative influence of expenditure drivers and their mechanisms, and the value generated from additional public hospital expenditure, particularly given the magnitudes involved.65–67 They also suggest that improvements in data collections are warranted to enable the tracking of changes in the quality and outcomes of hospital care associated with changes in input prices and quantities.
Finally, although we found that increases in the rate of hospital utilisation have not been a major driver of real per capita APHE growth in SA, it should be noted that constrained public hospital waiting lists may have left unmet demand that has not been expressed in published hospital statistics. Similarly, we may not yet have seen the full impact of past increases in the prevalence of overweight and obesity. The extent to which overweight and obese cohorts may develop consequent health complications as children or as they traverse middle age and beyond, combined with expanded availability of treatments for obesity, such as bariatric surgery, within public hospitals, remain important considerations when projecting future expenditure growth.
Conclusion
The conventional wisdom among decision-makers about what drives public hospital expenditure influences the choice of mechanisms to control future spending.6 Yet, the ways in which costs have been conceptualised and reported have often provided an incomplete understanding, while pointing to policy approaches and actions that may not provide the greatest potential to contain costs, improve population health, and maximise the value gained from available resources. To correctly gauge the potential efficacy of cost containment approaches and avoid misguided resource allocation, a clear accounting of the contribution of the main expenditure drivers over time is needed and can be provided through decomposition analysis.
Our decomposition analysis presented here found that, in SA, increasing real clinical labour costs have been the most important expenditure driver, with the real growth in the average salary of clinicians accounting for the largest component, whereas changes in rates of hospital utilisation played a minor role. These findings suggest quite a different policy focus than studies that have emphasised the potential for increased demands on public hospital services from a changing population demographic and disease profile.
This analysis could be repeated in other settings for which similar data are available, using the spreadsheet templates provided as supplemental material (Supplementary File S3). To improve the robustness of such analyses for Australian jurisdictions, it is recommended that State and Territory governments: invest in improving the quality and standardisation of FTE data; develop and publish standardised time-series data on key measures of patient complexity, hospital quality and treatment outcomes; and report condition-specific public hospital activity and cost data on a routine basis.
The data that support this study are available in published reports, of which full details are provided in Supplementary File S2.
Competing interests
The authors declare no competing interests.
Acknowledgements
This research did not receive any specific funding.
References
[1] Duckett SJ, Breadon P, Weidmann B, Nicola I. Controlling costly care: a billion dollar hospital opportunity. Melbourne: Grattan Institute; 2014. Available at: https://grattan.edu.au/wp-content/uploads/2014/03/806-costly-care.pdf [verified 4 October 2020].[2] Productivity Commission. Report on Government Services 2020. Part E. Australian Government; 2020. Available at: https://www.pc.gov.au/research/ongoing/report-on-government-services/2020 [verified 4 November 2020].
[3] Goss J. Projection of Australian health care expenditure by disease, 2003 to 2033. Canberra: Australian Institute of Health and Welfare; 2008. Available at: https://www.aihw.gov.au/getmedia/7bfc67e9-8fe8-4637-835d-4f0a02749f9e/pahced03-33.pdf.aspx?inline=true [verified 4 November 2020].
[4] Cooper C, Hagan P. The Ageing Australian Population and Future Health Costs: 1996–2051. Canberra: Commonwealth Department of Health and Aged Care; 1999.
[5] Ang JB. The determinants of health care expenditure in Australia. Appl Econ Lett 2010; 17 639–44.
| The determinants of health care expenditure in Australia.Crossref | GoogleScholarGoogle Scholar |
[6] Antioch KM, Walsh MK, Anderson D, Brice R. Forecasting hospital expenditure in Victoria: Lessons from Europe and Canada. Aust Health Rev 1999; 22 133–55.
| Forecasting hospital expenditure in Victoria: Lessons from Europe and Canada.Crossref | GoogleScholarGoogle Scholar | 10387897PubMed |
[7] Banks G. Health costs and policy in an ageing Australia, in Health Policy Oration, P.C. Chairman, Editor. Menzies Centre for Health Policy, John Curtin School of Medical Research, ANU: Canberra; 2008.
[8] Productivity Commission. 2015 Intergenerational Report: Australia in 2055. Canberra: Australian Government; 2015. Available at: https://treasury.gov.au/sites/default/files/2019-03/2015_IGR.pdf [verified 4 November 2020].
[9] Productivity Commission. An ageing Australia: Preparing for the future. Canberra: Australian Government; 2013. Available at: https://www.pc.gov.au/research/completed/ageing-australia [verified 4 November 2020].
[10] Coory MD. Ageing and healthcare costs in Australia: a case of policy-based evidence? Med J Aust 2004; 180 581–3.
| Ageing and healthcare costs in Australia: a case of policy-based evidence?Crossref | GoogleScholarGoogle Scholar | 15174990PubMed |
[11] Schofield DJ, Earnest A. Demographic change and the future demand for public hospital care in Australia, 2005 to 2050. Aust Health Rev 2006; 30 507–15.
| Demographic change and the future demand for public hospital care in Australia, 2005 to 2050.Crossref | GoogleScholarGoogle Scholar | 17073546PubMed |
[12] Kendig H, Woods M. Intergenerational Report 2015: A limited and political view of our future. Australas J Ageing 2015; 34 217–9.
| Intergenerational Report 2015: A limited and political view of our future.Crossref | GoogleScholarGoogle Scholar | 26643228PubMed |
[13] Larg A, Moss JR, Spurrier N. Relative contribution of overweight and obesity to rising public hospital in-patient expenditure in South Australia. Aust Health Rev 2019; 43 148–56.
| Relative contribution of overweight and obesity to rising public hospital in-patient expenditure in South Australia.Crossref | GoogleScholarGoogle Scholar | 29467071PubMed |
[14] Thorpe KE. Treated disease prevalence and spending per treated case drove most of the growth in health care spending in 1987–2009. Health Aff 2013; 32 851–8.
| Treated disease prevalence and spending per treated case drove most of the growth in health care spending in 1987–2009.Crossref | GoogleScholarGoogle Scholar |
[15] Roehrig CS, Rousseau DM. The Growth In Cost Per Case Explains Far More Of US Health Spending Increases Than Rising Disease Prevalence. Health Aff 2011; 30 1657–63.
| The Growth In Cost Per Case Explains Far More Of US Health Spending Increases Than Rising Disease Prevalence.Crossref | GoogleScholarGoogle Scholar |
[16] Starr M, Dominiak L, Aizcorbe A. Decomposing spending growth finds annual cost of treatment contributed most towards spending growth, 1980–2006. Health Aff 2014; 33 823–31.
| Decomposing spending growth finds annual cost of treatment contributed most towards spending growth, 1980–2006.Crossref | GoogleScholarGoogle Scholar |
[17] Dieleman JL, Squires E, Bui AL, et al Factors associated with increases in US healthcare spending, 1996–2013. JAMA 2017; 318 1668–78.
| Factors associated with increases in US healthcare spending, 1996–2013.Crossref | GoogleScholarGoogle Scholar | 29114831PubMed |
[18] Zhai T, Goss J, Li J. Main drivers of health expenditure growth in China: a decomposition analysis. BMC Health Serv Res 2017; 17 185
| Main drivers of health expenditure growth in China: a decomposition analysis.Crossref | GoogleScholarGoogle Scholar | 28274228PubMed |
[19] Dunn ALE, Shapiro AH. Decomposing Medical-Care Expenditure Growth. Federal Reserve Bank of San Francisco, Editor. 2012. Available at: https://www.frbsf.org/economic-research/publications/working-papers/2012/26/ [verified 10 September 2021]
[20] Australian Institute of Health and Welfare, Australian hospital statistics 2006-07. Catalogue. no. HSE 55. Canberra: AIHW; 2008. Available at: https://www.aihw.gov.au/reports/hospitals/ahs-2006-07/contents/table-of-contents [verified 5 November 2020].
[21] Australian Institute of Health and Welfare, Hospital resources 2017-18: Australian hospital statistics. Catalogue no. HSE 233. Canberra: AIHW; 2019. Available at: https://www.aihw.gov.au/reports/hospitals/hospital-resources-2017-18-ahs [verified 3 November 2020].
[22] Australian Bureau of Statistics. 6401.0 Consumer Price Index, Australia. Time Series Workbook Table 9. CPI: Group, Sub-group and Expenditure Class, Index Numbers by Capital City [Excel spreadsheet] 2019 31/07/2019; Available at: https://www.abs.gov.au/statistics/economy/price-indexes-and-inflation/consumer-price-index-australia/latest-release [verified 4 October 2020].
[23] Australian Bureau of Statistics, Australian Demographic Statistics: Table 54. Estimated Resident Population By Single Year Of Age, South Australia. cat. no. 3101.0. Canberra, Australia: ABS; 2018. Available at: https://www.abs.gov.au/AUSSTATS/abs@.nsf/DetailsPage/3101.0Jun%202018 [verified 4 October 2020].
[24] Australian Institute of Health and Welfare, Hospital resources 2017-18: Australian hospital statistics, Table 2.7: Recurrent expenditure ($’000) on public hospital services, states and territories, 2017–18. Catalogue no. HSE 233. Canberra: AIHW; 2019. Available at: https://www.aihw.gov.au/reports/hospitals/hospital-resources-2017-18-ahs [verified 3 November 2020].
[25] Australian Institute of Health and Welfare, Australian hospital statistics 2007-08. Catalogue no. HSE 71. Canberra: AIHW; 2009. Available at: https://www.aihw.gov.au/reports/hospitals/ahs-2007-08/contents/table-of-contents [verified 5 November 2020].
[26] Australian Institute of Health and Welfare, Australian hospital statistics 2008-09. Catalogue no. HSE 84. Canberra: AIHW; 2010. Available at: https://www.aihw.gov.au/reports/hospitals/ahs-2008-09/contents/table-of-contents [verified 5 November 2020].
[27] Australian Institute of Health and Welfare, Australian hospital statistics 2009-10. Catalogue no. HSE 107. Canberra: AIHW; 2011. Available at: https://www.aihw.gov.au/reports/hospitals/australian-hospital-statistics-2009-10/contents/table-of-contents [verified 5 November 2020].
[28] Australian Institute of Health and Welfare, Australian hospital statistics 2010-11. Catalogue no. HSE 117. Canberra: AIHW; 2012. Available at: https://www.aihw.gov.au/reports/hospitals/australian-hospital-statistics-2010-11/contents/table-of-contents [verified 5 November 2020].
[29] Australian Institute of Health and Welfare, Australian hospital statistics 2011-12. Catalogue no. HSE 134. Canberra: AIHW; 2013. Available at: https://www.aihw.gov.au/reports/hospitals/australian-hospital-statistics-2011-12/contents/table-of-contents [verified 5 November 2020].
[30] Australian Institute of Health and Welfare, Australian hospital statistics 2012-13. Catalogue no. HSE 145. Canberra: AIHW; 2014. Available at: https://www.aihw.gov.au/reports/hospitals/australian-hospital-statistics-2012-13/contents/table-of-contents [verified 5 November 2020].
[31] Australian Institute of Health and Welfare, Hospital resources 2013-14: Australian hospital statistics. Catalogue no. HSE 160. Canberra: AIHW; 2015. Available at: https://www.aihw.gov.au/reports/hospitals/ahs-2013-14-hospital-resources/contents/table-of-contents [verified 5 November 2020].
[32] Australian Institute of Health and Welfare, Hospital resources 2014-15: Australian hospital statistics. Catalogue no. HSE 176. Canberra: AIHW; 2016. Available at: https://www.aihw.gov.au/reports/hospitals/ahs-2014-15-hospital-resources/contents/table-of-contents [verified 5 November 2020].
[33] Australian Institute of Health and Welfare, Hospital resources 2015-16: Australian hospital statistics. Catalogue no. HSE 190. Canberra: AIHW; 2017. Available at: https://www.aihw.gov.au/reports/hospitals/ahs-2015-16-hospital-resources/contents/table-of-contents [verified 5 November 2020].
[34] Australian Institute of Health and Welfare, Hospital resources 2016–17: Australian hospital statistics. Catalogue no. HSE 205. Canberra: AIHW; 2018. Available at: https://www.aihw.gov.au/reports/hospitals/ahs-2016-17-hospital-resources [verified 5 November 2020].
[35] Australian Institute of Health and Welfare, Hospital resources 2015-16: Australian hospital statistics, Table 4.9: Estimated recurrent expenditure ($’000) (including depreciation), by NHRA product streams, public hospital services, states and territories, 2015–16. Catalogue no. HSE 190. Canberra: AIHW; 2017. Available at: https://www.aihw.gov.au/reports/hospitals/ahs-2015-16-hospital-resources/contents/table-of-contents [verified 5 November 2020].
[36] Australian Institute of Health and Welfare, Hospital resources 2016-17: Australian hospital statistics, Table 4.9: Estimated recurrent expenditure ($’000) (including depreciation) on public hospital services, by NHRA product streams, states and territories, 2016–17. Catalogue no. HSE 205. Canberra: AIHW; 2018. Available at: https://www.aihw.gov.au/reports/hospitals/ahs-2016-17-hospital-resources [verified 4 November 2020].
[37] Australian Institute of Health and Welfare, Hospital resources 2017-18: Australian hospital statistics, Table 2.8: Estimated recurrent expenditure ($’000) (including depreciation) on public hospital services, by NHRA product streams, states and territories, 2017–18. Catalogue no. HSE 233. Canberra: AIHW; 2019. Available at: https://www.aihw.gov.au/reports/hospitals/hospital-resources-2017-18-ahs [verified 3 November 2020].
[38] Australian Institute of Health and Welfare, Hospital resources 2014-15: Australian hospital statistics, Table 4.8: Estimated recurrent expenditure ($’000) (including depreciation), by NHRA product streams, public hospital services, states and territories, 2014–15. Catalogue no. HSE 176. Canberra: AIHW; 2016. Available at: https://www.aihw.gov.au/reports/hospitals/ahs-2014-15-hospital-resources/contents/table-of-contents [verified 5 November 2020].
[39] Das Gupta P. Standardization and Decomposition of Rates: A User’s manual, U.S. Bureau of the Census, Editor. 1993, U.S. Government Printing Office: Washington, DC.
[40] Global Burden of Disease Health Financing Collaborator Network, Trends in future health financing and coverage: future health spending and universal health coverage in 188 countries, 2016–40. Lancet 2018; 391: 1783–98
[41] Australian Institute of Health and Welfare, Admitted patient care 2013-14: Australian hospital statistics. Catalogue no. HSE 156. Canberra: AIHW; 2015. Available at: https://www.aihw.gov.au/reports/hospitals/ahs-2013-14-admitted-patient-care/contents/table-of-contents [verified 5 November 2020].
[42] Australian Institute of Health and Welfare, Admitted patient care 2014-15: Australian hospital statistics. Catalogue no. HSE 172. Canberra: AIHW; 2016. Available at: https://www.aihw.gov.au/reports/hospitals/ahs-2014-15-admitted-patient-care/contents/table-of-contents [verified 5 November 2020].
[43] Australian Institute of Health and Welfare, Admitted patient care 2016-17: Australian hospital statistics Catalogue no. HSE 201. Canberra: AIHW; 2018. Available at: https://www.aihw.gov.au/reports/hospitals/ahs-2016-17-admitted-patient-care/contents/table-of-contents [verified 5 November 2020].
[44] Australian Institute of Health and Welfare, Non-admitted patient care 2013-14: Australian hospital statistics. Catalogue no. HSE 159. Canberra: AIHW; 2015. Available at: https://www.aihw.gov.au/reports/hospitals/ahs-2013-14-non-admitted-patient-care/contents/table-of-contents [verified 5 November 2020].
[45] Australian Institute of Health and Welfare, Non-Admitted Patient Care 2014-15: Australian Hospital Statistics. Cat. no. HSE 174. Canberra: AIHW; 2016. Available at: https://www.aihw.gov.au/reports/hospitals/non-admitted-patient-care-2014-15-australian-hospital-statistics/contents/table-of-contents [verified 5 November 2020].
[46] Australian Institute of Health and Welfare, Non-admitted patient care 2016-17: Australian hospital statistics. Catalogue no. HSE 206. Canberra: AIHW; 2018. Available at: https://www.aihw.gov.au/reports/hospitals/ahs-2016-17-non-admitted-patient-care/contents/table-of-contents [verified 5 November 2020].
[47] Australian Institute of Health and Welfare, Non-admitted patient care 2015–16: Australian hospital statistics. Catalogue no. HSE 188. Canberra: AIHW; 2017. Available at: https://www.aihw.gov.au/reports/hospitals/ahs-2015-16-non-admitted-patient-care [verified 5 November 2020].
[48] Australian Institute of Health and Welfare, Admitted patient care 2015-16: Australian hospital statistics. Catalogue no. HSE 185. Canberra: AIHW; 2017. Available at: https://www.aihw.gov.au/reports/hospitals/ahs-2015-16-admitted-patient-care/contents/table-of-contents [verified 5 November 2020].
[49] Australian Institute of Health and Welfare, Admitted patient care 2017-18: Australian hospital statistics Catalogue no. HSE 225. Canberra: AIHW; 2019. Available at: https://www.aihw.gov.au/reports/hospitals/admitted-patient-care-2017-18/contents/table-of-contents [verified 4 October 2021].
[50] Australian Institute of Health and Welfare, Non-admitted patient care 2017-18: Australian hospital statistics. Catalogue no. HSE 234. Canberra: AIHW; 2019. Available at: https://www.aihw.gov.au/reports/hospitals/non-admitted-patient-care-2017-18-ahs [verified 4 October 2021].
[51] Korda RJ, Joshy G, Paige E, et al The Relationship between Body Mass Index and Hospitalisation Rates, Days in Hospital and Costs: Findings from a Large Prospective Linked Data Study. PLoS One 2015; 10 e0118599
| The Relationship between Body Mass Index and Hospitalisation Rates, Days in Hospital and Costs: Findings from a Large Prospective Linked Data Study.Crossref | GoogleScholarGoogle Scholar | 25739093PubMed |
[52] Biener AI, Decker SL. Medical Care Use and Expenditures Associated With Adult Obesity in the United States Medical Care Use and Expenditures Associated With Adult Obesity in the United States. JAMA 2018; 319 218
| Medical Care Use and Expenditures Associated With Adult Obesity in the United States Medical Care Use and Expenditures Associated With Adult Obesity in the United States.Crossref | GoogleScholarGoogle Scholar | 29340665PubMed |
[53] Australian Bureau of Statistics. Health conditions and risks: Overweight and obesity. National Health Survey 2017–18. Canberra: ABS; 2018. Available at: https://www.abs.gov.au/statistics/health/healthconditions-and-risks/overweight-and-obesity/2017-18 [verified 4 October 2020]
[54] Ha NT, Hendrie D, Moorin R. Impact of population ageing on the costs of hospitalisations for cardiovascular disease: a population-based data linkage study. BMC Health Serv Res 2014; 14 554
| Impact of population ageing on the costs of hospitalisations for cardiovascular disease: a population-based data linkage study.Crossref | GoogleScholarGoogle Scholar | 25392132PubMed |
[55] Charlesworth A. Why is health care inflation greater than general inflation? J Health Serv Res Policy 2014; 19 129–30.
| Why is health care inflation greater than general inflation?Crossref | GoogleScholarGoogle Scholar | 24740980PubMed |
[56] Hartwig J. What drives health care expenditure?–Baumol’s model of ‘unbalanced growth’ revisited. J Health Econ 2008; 27 603–23.
| What drives health care expenditure?–Baumol’s model of ‘unbalanced growth’ revisited.Crossref | GoogleScholarGoogle Scholar | 18164773PubMed |
[57] Grimmer K, Moss J, Falco J. Experiences of elderly patients regarding independent community living after discharge from hospital: a longitudinal study. Int J Qual Health Care 2004; 16 465–72.
| Experiences of elderly patients regarding independent community living after discharge from hospital: a longitudinal study.Crossref | GoogleScholarGoogle Scholar | 15557356PubMed |
[58] Australian Institute of Health and Welfare. Australian hospital statistics 2006–07; Table 2.4: Summary of separation(a), average cost weight, patient day and average length of stay statistics, by hospital type, states and territories, 2006–07. Catalogue no. HSE 55. Canberra: AIHW; 2008. Available at: https://www.aihw.gov.au/reports/hospitals/ahs-2006-07/contents/table-of-contents [verified 4 November 2020].
[59] Australian Institute of Health and Welfare. Admitted patient care 2016–17: Australian hospital statistics, Table 2.16: Average length of stay, public and private hospitals, 2012–13 to 2016–17. Catalogue no. HSE 201. Canberra: AIHW; 2018. Available at: https://www.aihw.gov.au/reports/hospitals/ahs-2016-17-admitted-patient-care/contents/table-of-contents [verified 5 November 2020].
[60] Daley J, McGannon C, Hunter A. Budget pressures on Australian governments. Melbourne: 2014. Available at: https://grattan.edu.au/report/budget-pressures-on-australian-governments-2014/ [verified 28 September 2021].
[61] Australian Institute of Health and Welfare, Hospital resources 2017-18: Australian hospital statistics, Table 3.4: Average salaries, full time equivalent staff, public hospital services, states and territories, 2017–18. Catalogue no. HSE 233. Canberra: AIHW; 2019. Available at: https://www.aihw.gov.au/reports/hospitals/hospital-resources-2017-18-ahs [verified 3 November 2020].
[62] South Australia, House of Assembly. Estimates Committee A (2014–07–18). Adelaide: Parliament of South Australia; 2014. Available at http://hansardpublic.parliament.sa.gov.au/Pages/HansardResult.aspx#/docid/HANSARD-5-305 [verified 10 September 2021].
[63] Anthony RN. The analysis of performance, in Management Accounting: Text and cases. Richard D. Irwin, Inc.: Homewood, Illinois; 1970. p. 531–539.
[64] Assareh H, Achat HM, Stubbs JM, Guevarra VM, Hill K. Incidence and Variation of Discrepancies in Recording Chronic Conditions in Australia Hospital Administrative Data. PLoS One 2016; 11 e0147087
| Incidence and Variation of Discrepancies in Recording Chronic Conditions in Australia Hospital Administrative Data.Crossref | GoogleScholarGoogle Scholar | 26808428PubMed |
[65] Conway PH. Factors associated with increased us health care spending: Implications for controlling health care costs. JAMA 2017; 318 1657–8.
| Factors associated with increased us health care spending: Implications for controlling health care costs.Crossref | GoogleScholarGoogle Scholar | 29114814PubMed |
[66] Hillis DJ, Watters DAK, Malisano L, et al Variation in the costs of surgery: Seeking value: Transparency is key to achieving affordability of health care. Med J Aust 2017; 206 153–4.
| Variation in the costs of surgery: Seeking value: Transparency is key to achieving affordability of health care.Crossref | GoogleScholarGoogle Scholar |
[67] McRae IS, van Gool KC. Variation in the fees of medical specialists: problems, causes, solutions. Med J Aust 2017; 206 162–3.
| Variation in the fees of medical specialists: problems, causes, solutions.Crossref | GoogleScholarGoogle Scholar | 28253465PubMed |
A Conditions attributable to overweight and obesity included diabetes mellitus, congestive heart failure, asthma, gallbladder disease, gallbladder cancer, rectal cancer, ischemic stroke, osteoarthritis, hypertensive heart disease, ovarian cancer, hypertension, oesophageal adenocarcinoma, breast cancer, endometrial cancer, pancreatic cancer, kidney cancer, colon cancer, and ischemic heart disease.
B Figures exclude administrative and depreciation expenditure, which have been inconsistently reported over the period.
C Includes visiting medical officer payments and superannuation and excludes other contractors (e.g. nursing agency staff).
D The number of SA acute public hospitals includes all SA public hospitals except free-standing dedicated public rehabilitation hospitals.
E Inpatient activity units were measured by completed admitted episodes of care. Emergency department activity units were measured by presentations until 2014–15 and then by service events; and outpatient activity units were measured by occasions of service until 2014–15 and then by service events. Definitions of each are provided in Supplementary File S2.