

Use of consolidated time-lapse camera imagery to detect and monitor platypus (Ornithorhynchus anatinus) activity
Simon Roberts A and Melody Serena B *A
B
Abstract
The platypus is a challenging species to survey and monitor. We investigated the use of time-lapse cameras to detect platypus activity in a Tasmanian creek by deploying three camera models diurnally at a single site over 6 months, and deploying one model both nocturnally and diurnally at two sites over 12 months. Variation in camera attributes and settings (camera view angle, length of time-lapse intervals) contributed to a 10-fold difference in the mean number of platypus images recorded in a given behavioural sequence (or ‘event’) and an approximately 50% difference in median event duration among the three models. Results also varied between sites and at diel and bimonthly time scales due to pool topography, day length (affecting site illumination) and likely temporal differences in platypus activity and population size. However, even the least-effective camera model reliably captured ≥1 platypus image within the first 24 h of deployment at the two study sites throughout the year. Time-lapse cameras are a suitable tool to assess platypus occurrence and measure activity, as long as appropriate equipment is selected for the intended purpose and sources of spatial and temporal variation are carefully considered when designing studies and interpreting results.
Keywords: camera trap, Huon River, Kellaways Creek, non-invasive animal survey, platypus activity, platypus on land, platypus population monitoring, platypus reproductive timing, time-lapse camera imagery.
Introduction
Having access to reliable survey techniques is a basic requirement for effective species management and conservation. In the case of the platypus (Ornithorhynchus anatinus), factors impeding detection include a characteristic absence of vocalisations, footprints or food remains as evidence of activity (Triggs 1996). Prey items (mainly benthic macro-invertebrates; Faragher et al. 1979; McLachlan-Troup et al. 2010; Marchant and Grant 2015; Hawke et al. 2022) are obtained exclusively in the water, commonly at a depth >1 m (Grant 2004), though also in edge habitats and shallow riffles (Serena 1994; McLachlan-Troup et al. 2010). A platypus is generally most active at night (Grigg et al. 1992; Serena 1994; Gardner and Serena 1995; Gust and Handasyde 1995; Otley et al. 2000; Bethge et al. 2009; Bino et al. 2018) and rests in burrows with mainly hidden or cryptic entrances (Serena et al. 1998; Thomas et al. 2019). Platypus population density is also typically quite low, e.g. an estimated 1.2–2.1 animals km−1 in peri-urban creeks near Melbourne (Serena 1994; Gardner and Serena 1995; Serena et al. 2014) or 2.0–3.6 animals km−1 in relatively pristine creeks located on Kangaroo Island (Serena and Williams 1997).
Platypus survey and monitoring programs currently rely on capturing animals in nets, identifying traces of DNA left in the water (environmental DNA or eDNA) or collating sightings by human observers. Each method has its drawbacks. Nets are technically demanding to set, have to be monitored at regular nocturnal intervals and often yield few captures (Grant 2012; Serena and Williams 2012); animals can also become trap-shy in places where nets are set repeatedly (Griffiths et al. 2013). Environmental DNA studies generate only presence–absence data, with detectability potentially affected by numerous factors, including ambient temperature, water chemistry, exposure to UV light, sediment attributes, discharge volume and temporal variation in the rate at which animals shed DNA (Pilliod et al. 2014; Strickler et al. 2015; Barnes and Turner 2016; Stoeckle et al. 2017; Harrison et al. 2019). Sightings made by human observers are subject to inaccuracy due to misidentification, rely on people being active near water and are generally restricted to daylight hours (Easton et al. 2008; Grant 2012).
As an alternative approach, camera traps have been used successfully to detect a wide range of Australian vertebrates (Meek et al. 2015b; Driessen et al. 2017). These cameras are relatively inexpensive, can be deployed with minimal disturbance to animals and their habitat and yield readily quantifiable data for substantial time periods (Mills et al. 2016; Welbourne et al. 2017).
Cameras used in wildlife studies are most commonly fitted with passive infrared (PIR) sensors triggered in part by body heat. PIR sensors may consequently fail to detect animals with a limited heat signature (Hobbs and Brehme 2017), as exemplified by a platypus swimming in the water. In contrast, cameras operated in time-lapse mode take photos at regular fixed intervals and are triggered regardless of the temperature of target organisms. Time-lapse technology also allows for highly controlled sampling effort and is less subject to bias caused by camera sensitivity and orientation than are PIR-triggered cameras (Seidlitz et al. 2021). Disadvantages of time-lapse triggering include the need for high-capacity memory cards and batteries, especially if an automatic nocturnal flash is used. This method also typically generates many blank images, contributing to the effort required for post-deployment processing (Hobbs and Brehme 2017). To address this concern, researchers can seek to optimise the length of time-lapse intervals (Collett and Fisher 2017) or process raw images with the help of machine learning software (Hilton et al. 2022) or citizen scientists (Jones et al. 2018). Alternatively, some time-lapse cameras can convert discrete photos into videos at a defined frame rate. When combined with video-editing software, much larger data sets can be managed and reviewed efficiently. Converting photos to videos has the added advantage that animals can sometimes be detected from associated features such as water ripples, though this depends on the duration of time-lapse intervals and the site’s visual dynamics.
Our study investigated the use of three time-lapse camera models and video-conversion software to detect the presence and characterise the activity and behaviour of a platypus population occupying a Tasmanian stream. More specifically, the study aimed to address the following questions:
Does platypus detection frequency or the duration of activity records vary significantly among time-lapse camera models?
Does the frequency of platypus activity records differ significantly between nearby sites located along the same creek?
Does the frequency of platypus activity records vary significantly between day and night or through the year?
In addition, information is presented relating to the timing of platypus breeding behaviour in southern Tasmania and how often animals exited the water in the course of normal activity.
Materials and methods
Study area
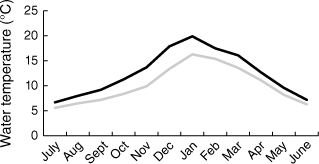
Our study was conducted along Kellaways Creek, a reliably perennial tributary of the lower Huon River, ⁓30 km south of Hobart, Tasmania. The catchment in and upstream of the study area (⁓50 km2) is dominated by native forest, with some areas of cleared pasture. The channel in the study area is typically 6–10 m wide, reaching a depth of 10–15 cm in riffles and up to 1.5 m in pools, which measure up to ~25 m in length. The channel substrate is mainly cobbles with some emergent bedrock. The local climate is temperate, receiving a mean 850 mm of rainfall annually. Based on temperature readings recorded at 5-s intervals from 1 July 2021 to 25 June 2022 by a temperature logger (Onset HOBO MX2201) placed at mid-channel in Pool 1 (see below), mean daily maximum and minimum water temperatures were respectively 19.9 ± 0.3 and 16.3 ± 0.2°C in the study’s warmest month (January) and 6.7 ± 0.2 and 5.6 ± 0.2°C in the coldest month (July) (Fig. 1). Platypus sightings have been recorded throughout the Huon River catchment (Otley 2001).
Mean monthly maximum (black line) and minimum (grey line) water temperatures from July 2021 to June 2022 at Pool 1.
Cameras were positioned at two pools separated by ⁓200 m of channel, located respectively at latitude and longitude co-ordinates GDA94 −43.06212, 147.08786 (Pool 1) and GDA94 −43.06350, 147.08887 (Pool 2). Both pools are >20 m long and normally characterised by laminar surface flow. A depth gauge was installed at Pool 1 to provide an objective basis for excluding occasions when increased surface turbulence due to storm runoff could compromise results; the boundary of acceptable conditions for reviewing platypus activity was deemed to be defined by an increase in depth of 30 cm above normal base flow.
Camera models and deployment
Three time-lapse camera models were utilised. The Cuddeback Colour Model 1279 (hereafter Cuddeback) had an inbuilt 850 nm infrared flash and was powered by six D-size batteries with a running time of ≥24 days. The SD memory card held up to 32 GB of data and could be left for ≥10 days (recording 1 MB photos at 10-s intervals) before being filled. The Brinno BCC100 (fitted with an ATH120 weather-resistant housing; hereafter Brinno100) and Brinno MAC200DN (hereafter Brinno200) models did not have inbuilt flashes and were only operated diurnally. Both cameras were set to capture 0.3–0.5 MB images (medium photo quality), at 3-s intervals, and could run for 10–14 days when powered by four AAA-size batteries (Brinno100) or two D-size batteries (Brinno200). When fitted with the maximum allowable 32-GB SD memory card, both models could be left unattended for 6–8 days before the card was filled.
Cameras were positioned to provide the widest possible unobstructed view of a pool that included some adjoining bank and was above usual flood levels. Cameras faced south and were attached to mounting brackets fixed near the top of 1.5-m metal stakes hammered vertically into the bank at a distance of ⁓1.5–2 m from the water’s edge (selected during a period of normal base flow); stake location remained unchanged throughout the study, with cameras located next to each other when deployed simultaneously (Supplementary Fig. S1). Their lateral view angles were respectively 50° (Cuddeback), 75° (Brinno200) and 140° (Brinno100) (Supplementary Fig. S2); to improve its viewable area (sensu Moeller et al. 2023), the Cuddeback was mounted ⁓40 cm higher than the other two models. In practice, diurnal viewable areas for the three cameras at Pool 1 typically comprised an estimated 90 m2 (Cuddeback), 125 m2 (Brinno200) and 190 m2 (Brinno100) of the pool’s surface, with smaller viewable areas monitored both at Pool 2 (due to its shape differing from that of Pool 1) and nocturnally (Table 1; Supplementary Fig. S3).
| Camera (time of day) | Site | Deep area (m2) | % deep | Shallow area (m2) | % shallow | |
|---|---|---|---|---|---|---|
| Cuddeback (D) | Pool 1 | 45 | 50 | 45 | 50 | |
| Cuddeback N) | Pool 1 | 5 | 11 | 40 | 89 | |
| Cuddeback (D) | Pool 2 | 40 | 57 | 30 | 43 | |
| Cuddeback (N) | Pool 2 | 15 | 50 | 15 | 50 | |
| Brinno200 (D) | Pool 1 | 70 | 56 | 55 | 44 | |
| Brinno100 (D) | Pool 1 | 75 | 39 | 115 | 61 |
Deep area: platypus submerged when foraging (depth generally ≥0.8 m). Shallow area: platypus partly exposed at surface when foraging (depth generally ≤0.4 m).
Video review
The two Brinno cameras automatically converted time-lapse sequences into sequential AVI video files of ~3–5 Gb. The playback rate was set at 20 frames s−1. Photos from the Cuddeback were converted into 12-h mp4 video files at 6 frames s−1 using the freeware version of VideoPad© 10.84 software.
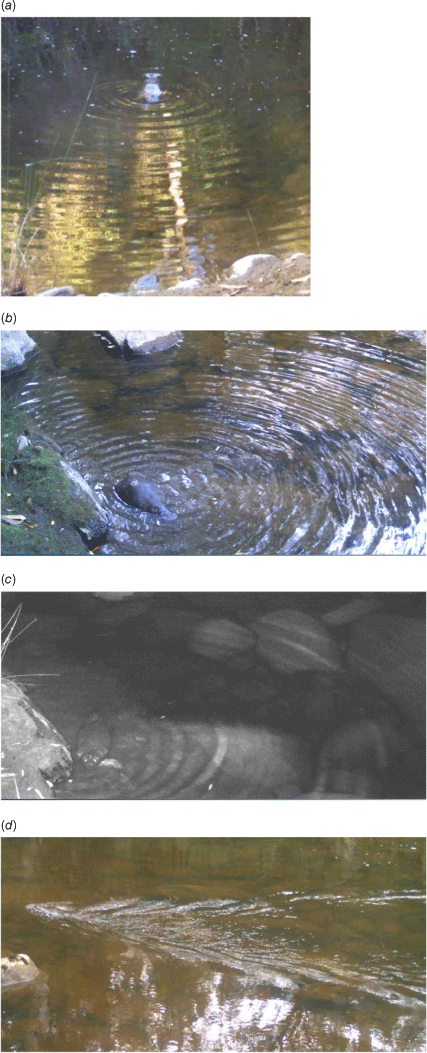
Videos were reviewed using freeware (VLC Media Player version 3.0.18), with 1 min of video equalling 1 h of real time. Videos were played at normal speed until a platypus was seen or a surface disturbance unrelated to water flow or wind was detected, at which point the sequence was rewound for 4–5 s and reviewed image by image. Waves caused by platypus activity included concentric ‘bull’s-eye’ ripples (seen when a platypus dives or emerges on the surface), semi-circular ripples propagating from the shoreline (seen when a platypus feeds in shallow water near the channel edge) or a prominent ‘V-shaped’ ripple pattern (associated with surface swimming) (Fig. 2).
Analysis of activity
Sequences of images lacking evidence of platypus activity were discarded, e.g. those showing surface ripples caused by fish (which generally produce weaker ripples than those associated with platypus activity) or birds. Sequences containing platypus images and platypus-generated waves were defined as events, with consecutive events separated by at least 5 min of no recorded activity. The first and last photos featuring either a platypus (hereafter referred to as a platypus image) or platypus-related ripples were then identified, and intervening photos were classified as featuring a platypus, platypus-related waves only or neither (mainly when an animal moved briefly out of view before returning to the viewable area). An event’s location, date, time and duration (measured in 3-s increments for the two Brinno models and 10-s increments for the Cuddeback) were also recorded, along with additional details when a platypus was seen exiting the water (including how long it remained on land or on a rock and whether this occurred diurnally or nocturnally).
Statistical analysis
Statistical tests were conducted using SYSTAT 13.0, with significance set at 0.05. Single-factor ANOVA and post hoc Tukey’s pairwise comparisons were used to test whether the mean number of platypus images recorded per event differed among cameras, and if the mean number of diel events differed among bimonthly periods. Two-sample t-tests were used to test if the mean number of diel events differed between study sites at different time scales or if the mean number of nocturnal and diurnal events differed across the year. The strength of the relationship between the number of platypus images per event and event duration was tested using least squares linear regression, as was the strength of the relationship between the mean frequency of diurnal or nocturnal events and day length. Nonparametric Mann–Whitney tests were used to test if the durations of diurnal and nocturnal events (which were markedly non-normally distributed) differed significantly. Means and other statistical values are reported ±1 standard error.
Results
Does platypus detection frequency vary by camera model?
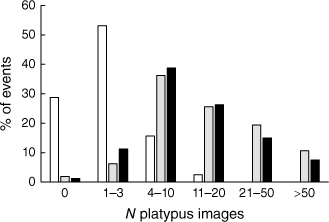
In total, 160 platypus events were recorded by at least one camera when all three models were simultaneously deployed diurnally at Pool 1 from July to December 2021. Median event duration was 60 s (range = 0–830 s) for the Cuddeback, 94.5 s (range = 0–870 s) for the Brinno100 and 96 s (range = 0–900 s) for the Brinno200. The Cuddeback failed to record a platypus image in 29% of events detected by one or both of the other cameras, as compared with 2% for the Brinno100 and 1% for the Brinno200 (Fig. 3). The mean number of platypus images recorded per event by the Brinno100 (21.1 ± 2.0) and Brinno200 (16.4 ± 1.5) was respectively 10 and eight times greater than the number recorded by the Cuddeback (2.1 ± 0.2). These values differ significantly (F = 48.388, P < 0.001), with post hoc pairwise comparisons confirming that the Cuddeback recorded significantly fewer platypus images per event than the other models (P < 0.001), which did not differ significantly (P = 0.063). The maximum number of platypus images recorded in a given event was 17 for the Cuddeback, 147 for the Brinno100 and 94 for the Brinno200.
The numbers of platypus images recorded by three time-lapse camera models deployed simultaneously at Pool 1 (n = 160 events). White bars = Cuddeback; grey bars = Brinno100; black bars = Brinno200.
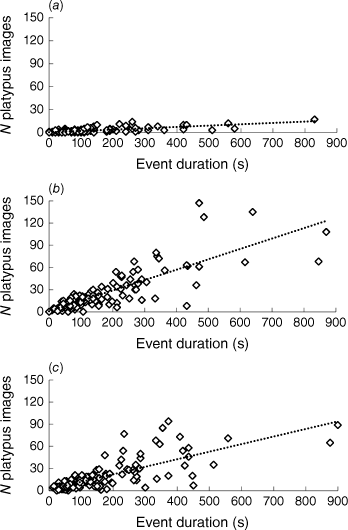
For all three cameras, a significant positive relationship existed between event duration and the number of platypus images recorded (Cuddeback: F = 180.300, P < 0.001, r2 = 0.533; Brinno100: F = 347.197, P < 0.001, r2 = 0.687; Brinno200: F = 231.414, P < 0.001, r2 = 0.594) (Fig. 4). The number of images increased most rapidly with event duration in the Brinno100 (regression slope b = 0.140 ± 0.008), followed by Brinno200 (b = 0.102 ± 0.007) and then Cuddeback (b = 0.017 ± 0.001); the three slopes differ significantly (Cuddeback and Brinno100: t = 15.256, P < 0.001; Cuddeback and Brinno200: t = 12.021, P < 0.001; Brinno100 and Brinno200: t = 3.575, P < 0.001).
Does the frequency of recorded platypus activity vary by site or among bimonthly periods?
From July 2021 to June 2022, the Cuddeback was deployed for 183 diel periods (defined as a 24-h unit of time corresponding to one calendar day) at Pool 1 and 178 diel periods at Pool 2. Fewer than 13 events were recorded at Pool 1 in all but two diel periods, and fewer than 10 events at Pool 2 in all but one diel period. The exceptions comprised 28 events (on 24 November) and 31 events (25 November) at Pool 1, and 36 events (2 December) at Pool 2. Presumed courtship or mating behaviour was captured on film on 26 November at 0107 hours (Pool 1) and on 2 December at 0729 hours (Pool 2) (Supplementary Fig. S4).
Excluding the three exceptional dates, the mean number of diel events recorded at Pool 1 exceeded that recorded at Pool 2 in five of six bimonthly periods, though the difference was significant only for November–December (Table 2). The mean number of diel events recorded across the year at Pool 1 (2.8 ± 0.2) significantly exceeded the mean number recorded at Pool 2 (2.3 ± 0.1) (t = 2.338, P = 0.020).
| Months | Pool 1 | Pool 2 | t (P) | |||
|---|---|---|---|---|---|---|
| Mean ± s.e. (n) | % non-event days | Mean ± s.e. (n) | % non-event days | |||
| July–Aug | 1.4 ± 0.2 (22) | 27.3 | 0.7 ± 0.3 (9) | 55.6 | 1.806 (0.081) | |
| Sept–Oct | 2.7 ± 0.4 (32) | 18.7 | 1.7 ± 0.2 (23) | 13.0 | 1.928 (0.059) | |
| Nov–Dec | 3.5 ± 0.5 (33) | 6.1 | 2.3 ± 0.3 (39) | 17.9 | 2.219 (0.030) | |
| Jan–Feb | 2.5 ± 0.2 (40) | 2.5 | 2.6 ± 0.2 (30) | 3.3 | 0.321 (0.749) | |
| Mar–Apr | 3.2 ± 0.3 (39) | 5.1 | 2.6 ± 0.2 (50) | 6.0 | 1.415 (0.161) | |
| May–June | 3.3 ± 0.4 (15) | 0.0 | 2.6 ± 0.5 (26) | 19.2 | 1.058 (0.297) | |
Sample size (number of days) in brackets. Difference between bimonthly means tested using two-sample t-tests.
The annual mean number of diel events varied significantly among bimonthly periods at both Pool 1 (F = 3.747, P = 0.003) and Pool 2 (F = 2.905, P = 0.015). Post hoc tests showed that the mean number of diel events at Pool 1 in July–August was significantly less than in March–April (P = 0.010), May–June (P = 0.044) and November–December (P = 0.001); the mean number of diel events at Pool 2 in July–August was significantly less than in January–February (P = 0.033), March–April (P = 0.020) and May–June (P = 0.049).
Across the 12-month study period, events were not recorded in 9.4% of diel periods at Pool 1 and 13.6% of diel periods at Pool 2. Nonetheless, ≥1 platypus event was recorded within the first 24 h that cameras were deployed at both sites in every month of the year. The longest interval before an event was recorded at a given site in a given month occurred at Pool 1 in July (four consecutive diel periods).
Does the frequency of recorded platypus activity vary by time of day or as a function of day length?
Platypus events occurred throughout the diel period, including on dates of exceptionally high platypus activity (Fig. 5). At both sites, the lowest frequency of events was recorded in late morning (1100–1200 hours) and the highest frequency in late afternoon and early evening (1800–2100 hours, Pool 1; 1600–1900 hours, Pool 2). The mean number of nocturnal events recorded in a given diel period at Pool 1 (1.6 ± 0.1) significantly exceeded the corresponding diurnal number (1.2 ± 0.1) (t = 2.758, P = 0.006). Conversely, the mean number of nocturnal events recorded in a given diel period at Pool 2 (1.0 ± 0.1) was significantly less than the diurnal number (1.3 ± 0.1) (t = 2.116, P = 0.035).
Number of platypus events recorded in consecutive hourly periods at (a) Pool 1 and (b) Pool 2 from July 2021 to June 2022. Black bars denote nocturnal events (Pool 1, n = 292; Pool 2, n = 181); grey bars denote diurnal events (Pool 1, n = 218; Pool 2, n = 233); white bars denote events on dates of exceptionally high platypus activity (Pool 1, 24–25 Nov, n = 59; Pool 2, 2 Dec, n = 36).
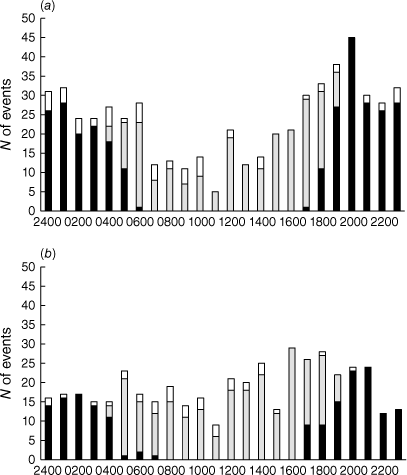
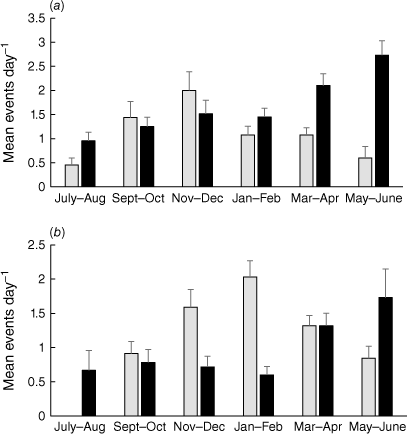
After excluding dates of exceptionally high platypus activity, the mean number of diurnal events per bimonthly period was distributed quite symmetrically across the year, peaking in November–December (Pool 1) or January–February (Pool 2) (Fig. 6). A significant positive linear relationship was evident between diurnal event frequency and day length at Pool 1 (F = 10.354, P = 0.032), and nearly so at Pool 2 (F = 7.390, P = 0.053), with variation in day length accounting for 65–72% of variation in diurnal activity (Pool 1, r2 = 0.721; Pool 2, r2 = 0.649). In contrast, nocturnal event frequency peaked at both Pool 1 and Pool 2 in autumn and early winter (March–June) before dropping sharply in July–August. The mean number of nocturnal events was not significantly related to night length at either Pool 1 (F = 0.561, P = 0.495) or Pool 2 (F = 2.430, P = 0.194).
Mean number of platypus events recorded diurnally (grey bars) or nocturnally (black bars) in a given diel period from July 2021 to June 2022 at (a) Pool 1 and (b) Pool 2. Error bars indicate s.e.; n of days sampled in each period are listed in Table 2.
Does the duration of recorded platypus activity vary between day and night?
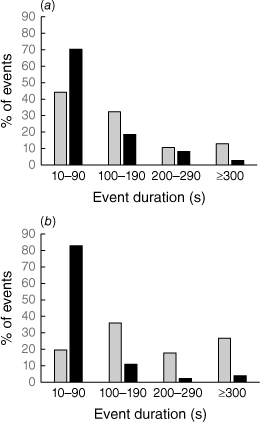
Excluding dates of exceptionally high activity, a high percentage of nocturnal events terminated in ≤90 s (70%, Pool 1; 83%, Pool 2) (Fig. 7), with a maximum recorded nocturnal duration of 790 s (Pool 1) or 730 s (Pool 2). By comparison, fewer diurnal events terminated in ≤90 s (44%, Pool 1; 20%, Pool 2), with a maximum recorded diurnal duration of 2050 s (Pool 1) or 3110 s (Pool 2). Median event durations at night were respectively 60 s (Pool 1) or 30 s (Pool 2), whereas those during the day were respectively 100 s (Pool 1) or 180 s (Pool 2). Diurnally recorded events were significantly longer than nocturnally recorded events both at Pool 1 (Mann–Whitney U = 19 792.50, χ2 approximation = 51.340, d.f. = 1, P < 0.001) and Pool 2 (Mann–Whitney U = 3940.50, χ2 approximation = 188.015, d.f. = 1, P < 0.001).
How frequently was a platypus observed exiting the water?
A platypus exited the water in 21 of the 1019 events recorded on days when cameras were deployed for an entire 24-h period. All such events occurred between November and April. Three events (one diurnal, two nocturnal) involved a platypus climbing briefly onto a rock in the channel. Eighteen events (12 diurnal, six nocturnal) involved a platypus walking or resting on land for <30 s before re-entering the water within a short distance (<3 m) of where it had first emerged.
Discussion
Our study confirms that time-lapse cameras can be usefully employed to detect and monitor platypus activity throughout the year in creek environments. Our results also indicate that camera attributes and settings and sources of spatial and temporal variation can influence both the likelihood that a platypus is recorded and the duration of recorded activity.
Does platypus detection frequency vary by camera model?
Variation in the performance of motion- and heat-activated camera traps can be influenced by multiple design factors (e.g. Meek et al. 2015a; Driessen et al. 2017). In our study of time-lapse cameras, more than a 50% difference in event duration and up to a 10-fold difference in the mean number of platypus images recorded per event occurred among models. The relatively poor performance of the Cuddeback partly reflects the fact that it recorded images at 10-s intervals, whereas the other two models recorded images at 3-s intervals. Accordingly, events recorded by the Cuddeback were truncated on average by 7 s at the start and finish of each sequence and otherwise comprised only 30% as many images as compared with those recorded by the other cameras. The Cuddeback’s view angle (50°) was also narrower than those of the other two models (75° for the Brinno200; 140° for the Brinno100), substantially reducing the length of channel in which it recorded activity. The fact that the Brinno100 monitored a much longer channel segment than the Brinno200 also plausibly contributed to the Brinno100 recording on average nearly 30% more platypus images per event. Similarly, more than twice as many numbat images were captured in captivity by cameras featuring a 110° view angle as compared with ones featuring a 37° view angle (Seidlitz et al. 2021).
Does the frequency of recorded platypus events vary between nearby sites?
The mean frequency of diel events recorded at Pool 1 significantly exceeded the frequency recorded at Pool 2 (by approximately 22%) across a 12-month period, despite the fact that the sites were located only about 200 m apart, i.e. less than the distance that a platypus is likely to travel in a single daily foraging bout in a creek (Serena 1994; Gardner and Serena 1995). This difference is parsimoniously explained by the fact that the Pool 1 viewable area was approximately 22% larger than that of Pool 2 during the day and 33% larger at night. In addition, other physical differences may potentially have contributed to variation in platypus usage and/or visibility at the two sites, e.g. Pool 1 contained a higher proportion of relatively shallow water where a platypus is likely to remain continuously visible while foraging.
How are the days of unusually high platypus activity best interpreted?
Platypus mating behaviour in captivity and the wild has been recorded from early August to early November in both Victoria (De-La-Warr and Serena 1999; Holland and Jackson 2002; Easton et al. 2008) and New South Wales (Burrell 1927; Hawkins and Battaglia 2009), with the temporal midpoint of these observations occurring in late September. Assuming that platypus reproductive events in Tasmania may occur up to 2 months later than on the mainland (Temple-Smith and Grant 2001), the exceptionally high frequencies of platypus events recorded on 24–25 November at Pool 1 and 2 December at Pool 2 reasonably reflect activity by one or more adult males repeatedly swimming past a camera in the course of courting or defending access to a nearby receptive female. This hypothesis was also supported by photographic evidence of courtship behaviour at Pool 1 on 26 November and mating behaviour at Pool 2 on 2 December. The resulting young would be expected to hatch in mid- to late December (following a gestation period of ⁓16 days and incubation period of around ⁓10 days; Holland and Jackson 2002; Hawkins and Battaglia 2009; Thomas et al. 2020) and first enter the water in approximately late March, towards the end of a lactational period lasting up to 14 weeks in the wild (Grant et al. 2004).
What factors may influence seasonal variation in the frequency of recorded platypus events?
Seasonal variation in camera trap findings has previously been reported in studies of terrestrial mammals (Smith and Weston 2017; Montalvo et al. 2023). In our study, significantly fewer events were recorded in a given 24-h period in July and August as compared with the 4 months from March to June. In absolute terms, the mean frequency of diel events recorded in late winter was respectively about 43% (Pool 1) and 27% (Pool 2) of the corresponding frequencies recorded in autumn and early winter.
In Victoria, Serena and Williams (2012) ascribed monthly variation in the frequency of platypus captures mainly to two factors: (1) daily activity areas may expand and contract in response to breeding-related activity and other variables (such as water temperature) affecting energetic requirements; and (2) depending on local reproductive success, large numbers of juveniles may be present as a cohort for a few months before they disperse or otherwise disappear. The annual schedule of breeding-related energy demands was also posited to vary for males and females, insofar as male costs are expected to peak just before and during the period when females enter oestrus, due to territorial defence and/or searching for mates (Handasyde et al. 2003), whereas peak female costs are predicted to be driven by lactational demands, particularly towards the end of lactation (Thomas et al. 2020). As a further consideration, this species has been documented to remain inactive in a burrow or the equivalent for up to 6 days in winter (both in captivity and along a Victorian creek; Serena 1994), though not in winter studies that monitored platypus activity and/or body temperature in larger aquatic systems, including a subalpine Tasmanian lake (Grigg et al. 1992; Bethge et al. 2009).
In the absence of knowledge about platypus demography in Kellaways Creek, it is not possible to evaluate the contribution made by male and female activity patterns to variation in the frequency of bimonthly platypus events through the year. However, the hypothesis that juvenile activity may have contributed to high numbers of nocturnal events being recorded from March to June is consistent with the timing of presumed mating activity in our study area (as discussed in the previous section). In both Victoria and New South Wales, a sharp drop in the number of juveniles captured in autumn has been posited to reflect the onset of a wave of juvenile dispersal approximately 3–4 months after young animals first enter the water (Grant 1989; Serena and Williams 2012), implying that juveniles might be expected to disperse from Kellaways Creek starting in July.
Due to limited illumination provided by the Cuddeback’s infrared lighting, the viewable area monitored by our cameras was much smaller at night than during the day (comprising an estimated 50% of the diurnal viewable area at Pool 1 and 43% at Pool 2). In practice, this reduced the number of images recorded nocturnally to approximately half the number that would have been recorded if natural daylight prevailed at night, as illustrated in Supplementary Fig. S3. This, in turn, may plausibly have contributed to fewer events being recorded in southern Tasmania in July–August as compared with months with much longer day lengths, particularly November–December (day length exceeds that in July–August by ≥3 h) and January–February (day length exceeds that in July–August by ≥2 h) (https://www.timehubzone.com/sun/australia/hobart).
What factors may influence the relative frequency of platypus diurnal activity?
Platypus activity was recorded through the entire diel period at Kellaways Creek, with the same being true for activity presumed to be associated primarily with reproductive behaviour. At both study sites, the lowest frequency of recorded events occurred in late morning and the highest frequency in late afternoon and early evening, with the relative frequency of nocturnal events likely to have been underestimated due to viewable areas being smaller at night than during the day (see previous section).
The extent of diurnal activity by a platypus is believed to reflect trade-offs between predator avoidance, temporal segregation of activity to reduce food competition or agonistic encounters with conspecifics, and the amount of foraging time needed to meet energy demands (e.g. Serena 1994; Gust and Handasyde 1995; Otley et al. 2000; Bethge et al. 2009), and may also vary significantly with environmental factors such as the amount of cloud cover (Easton et al. 2008). Factors that are likely to be of lesser importance in encouraging diurnal activity include optimising prey detection (given that a platypus routinely shuts its eyes when underwater; Pettigrew et al. 1998) or reducing platypus thermoregulatory costs (given the typically small difference between diurnal and nocturnal water temperatures in platypus habitats, especially in the colder months of the year (Bethge et al. 2009; this study).
Implications for future use of time-lapse cameras to detect and monitor platypus populations
Our results show that time-lapse cameras demonstrably can be used to detect and monitor platypus activity. In our study area, at least one platypus image was consistently captured throughout the year within the first 24 h that Cuddeback cameras (the least effective model trialled for daytime use) were deployed simultaneously at two pools located just 200 m apart. However, it is important to recognise that different camera models can vary significantly with respect to how effectively they record platypus activity. The fact that a foraging platypus engages in minimal travel across land (this study) means that it is expected to swim past and therefore potentially be filmed by a camera stationed at virtually any point within the animal’s daily activity range. However, camera specifications, how they are positioned and any use of artificial light sources must still be carefully matched to channel dimensions and salient aspects of platypus behaviour, such as how fast animals can travel, to minimise the likelihood that the species fails to be recorded if present.
Acknowledgements
We thank C. Bobbi, R. Goldingay, T. R. Grant, G. A. Williams and an anonymous reviewer for very helpful feedback that improved this paper.
References
Barnes, M. A., and Turner, C. R. (2016). The ecology of environmental DNA and implications for conservation genetics. Conservation Genetics 17, 1-17.
| Crossref | Google Scholar |
Bethge, P., Munks, S., Otley, H., and Nicol, S. (2009). Activity patterns and sharing of time and space of platypuses, Ornithorhynchus anatinus, in a subalpine Tasmanian lake. Journal of Mammalogy 90, 1350-1356.
| Crossref | Google Scholar |
Bino, G., Kingsford, R. T., Grant, T., Taylor, M. D., and Vogelnest, L. (2018). Use of implanted acoustic tags to assess platypus movement behaviour across spatial and temporal scales. Scientific Reports 8, 5117.
| Crossref | Google Scholar | PubMed |
Collett, R. A., and Fisher, D. O. (2017). Time-lapse camera trapping as an alternative to pitfall trapping for estimating activity of leaf litter arthropods. Ecology and Evolution 7, 7527-7533.
| Crossref | Google Scholar | PubMed |
De-La-Warr, M., and Serena, M. (1999). Observations of platypus Ornithorhynchus anatinus mating behaviour. The Victorian Naturalist 116, 172-174.
| Google Scholar |
Driessen, M. M., Jarman, P. J., Troy, S., and Callander, S. (2017). Animal detections vary among commonly used camera trap models. Wildlife Research 44, 291-297.
| Crossref | Google Scholar |
Easton, L., Williams, G., and Serena, M. (2008). Monthly variation in observed activity of the platypus Ornithorhynchus anatinus. The Victorian Naturalist 125, 104-109.
| Google Scholar |
Faragher, R. A., Grant, T. R., and Carrick, F. N. (1979). Food of the platypus (Ornithorhynchus anatinus) with notes on the food of brown trout (Salmo trutta) in the Shoalhaven River, NSW. Australian Journal of Ecology 4, 171-179.
| Crossref | Google Scholar |
Gardner, J. L., and Serena, M. (1995). Spatial organization and movement patterns of adult male platypus, Ornithorhynchus anatinus (Monotremata: Ornithorhynchidae). Australian Journal of Zoology 43, 91-103.
| Crossref | Google Scholar |
Grant, T. R. (2004). Depth and substrate selection by platypuses, Ornithorhynchus anatinus, in the lower Hastings River, New South Wales. Proceedings of the Linnean Society of New South Wales 125, 235-241.
| Google Scholar |
Grant, T. R., Griffiths, M., and Temple-Smith, P. D. (2004). Breeding in a free-ranging population of platypuses, Ornithorhynchus anatinus, in the upper Shoalhaven River, New South Wales – a 27 year study. Proceedings of the Linnean Society of New South Wales 125, 227-234.
| Google Scholar |
Griffiths, J., Kelly, T., and Weeks, A. (2013). Net-avoidance behaviour in platypuses. Australian Mammalogy 35, 245-247.
| Crossref | Google Scholar |
Grigg, G. C., Beard, L., Grant, T. R., and Augee, M. (1992). Body-Temperature and Diurnal Activity Patterns in the Platypus (Ornithorhynchus-Anatinus) During Winter. Australian Journal of Zoology 40, 135-142.
| Crossref | Google Scholar |
Gust, N., and Handasyde, K. (1995). Seasonal-Variation in the Ranging Behavior of the Platypus (Ornithorhynchus-Anatinus) on the Goulburn River, Victoria. Australian Journal of Zoology 43, 193-208.
| Crossref | Google Scholar |
Handasyde, K. A., McDonald, I. R., and Evans, B. K. (2003). Plasma glucocorticoid concentrations in free-ranging platypuses (Ornithorhynchus anatinus): response to capture and patterns in relation to reproduction. Comparative Biochemistry and Physiology Part A: Molecular & Integrative Physiology 136, 895-902.
| Crossref | Google Scholar | PubMed |
Harrison, J. B., Sunday, J. M., and Rogers, S. M. (2019). Predicting the fate of eDNA in the environment and implications for studying biodiversity. Proceedings of the Royal Society B 286, 20191409.
| Crossref | Google Scholar | PubMed |
Hawke, T., Bino, G., Shackleton, M. E., Ross, A. K., and Kingsford, R. T. (2022). Using DNA metabarcoding as a novel approach for analysis of platypus diet. Scientific Reports 12, 2247.
| Crossref | Google Scholar | PubMed |
Hawkins, M., and Battaglia, A. (2009). Breeding behaviour of the platypus (Ornithorhynchus anatinus) in captivity. Australian Journal of Zoology 57, 283-293.
| Crossref | Google Scholar |
Hilton, M. L., Goessling, J. M., Knezevich, L. M., and Downer, J. M. (2022). Utility of machine learning for segmenting camera trap time-lapse recordings. Wildlife Society Bulletin 46, e1342.
| Crossref | Google Scholar |
Hobbs, M. T., and Brehme, C. S. (2017). An improved camera trap for amphibians, reptiles, small mammals, and large invertebrates. PLoS One 12, e185026.
| Crossref | Google Scholar | PubMed |
Holland, N., and Jackson, S. M. (2002). Reproductive behaviour and food consumption associated with the captive breeding of platypus (Ornithorhynchus anatinus). Journal of Zoology 256, 279-288.
| Crossref | Google Scholar |
Jones, F. M., Allen, C., Arteta, C., Arthur, J., Black, C., Emmerson, L. M., Freeman, R., Hines, G., Lintott, C. J., Macháčková, Z., Miller, G., Simpson, R., Southwell, C., Torsey, H. R., Zisserman, A., and Hart, T. (2018). Time-lapse imagery and volunteer classifications from the Zooniverse Penguin Watch project. Scientific Data 5, 180124.
| Crossref | Google Scholar | PubMed |
Marchant, R., and Grant, T. R. (2015). The productivity of the macroinvertebrate prey of the platypus in the upper Shoalhaven River, New South Wales. Marine and Freshwater Research 66, 1128-1137.
| Crossref | Google Scholar |
McLachlan-Troup, T. A., Dickman, C. R., and Grant, T. R. (2010). Diet and dietary selectivity of the platypus in relation to season, sex and macroinvertebrate assemblages. Journal of Zoology 280, 237-246.
| Crossref | Google Scholar |
Meek, P. D., Ballard, G.-A., and Fleming, P. J. S. (2015a). The pitfalls of wildlife camera trapping as a survey tool in Australia. Australian Mammalogy 37, 13-22.
| Crossref | Google Scholar |
Meek, P. D., Ballard, G.-A., Vernes, K., and Fleming, P. J. S. (2015b). The history of wildlife camera trapping as a survey tool in Australia. Australian Mammalogy 37, 1-12.
| Crossref | Google Scholar |
Mills, C. A., Godley, B. J., and Hodgson, D. J. (2016). Take only photographs, leave only footprints: novel applications of non-invasive survey methods for rapid detection of small, arboreal animals. PLoS One 11, e0146142.
| Crossref | Google Scholar | PubMed |
Moeller, A. K., Waller, S. J., DeCesare, N. J., Colter Chitwood, M., and Lukacs, P. M. (2023). Best practices to account for capture probability and viewable area in camera-based abundance estimation. Remote Sensing in Ecology and Conservation 9, 152-164.
| Google Scholar |
Montalvo, V. H., Sáenz-Bolaños, C., Cruz-Díaz, J. C., Kamilar, J. M., Carrillo, E., and Fuller, T. K. (2023). Effects of camera trap placement on photo rates of jaguars, their prey, and competitors in northwestern Costa Rica. Wildlife Society Bulletin 47, e1428.
| Crossref | Google Scholar |
Otley, H. (2001). The use of a community-based survey to determine the distribution of the platypus Ornithorhynchus anatinus in the Huon River catchment, southern Tasmania. Australian Zoologist 31, 632-641.
| Crossref | Google Scholar |
Otley, H. M., Munks, S. A., and Hindell, M. A. (2000). Activity patterns, movements and burrows of platypuses (Ornithorhynchus anatinus) in a sub-alpine Tasmanian lake. Australian Journal of Zoology 48, 701-713.
| Crossref | Google Scholar |
Pettigrew, J. D., Manger, P. R., and Fine, S. L. (1998). The sensory world of the platypus. Philosophical Transactions of the Royal Society of London. Series B: Biological Sciences 353, 1199-1210.
| Crossref | Google Scholar | PubMed |
Pilliod, D. S., Goldberg, C. S., Arkle, R. S., and Waits, L. P. (2014). Factors influencing detection of eDNA from a stream-dwelling amphibian. Molecular Ecology Resources 14, 109-116.
| Crossref | Google Scholar | PubMed |
Seidlitz, A., Bryant, K. A., Armstrong, N. J., Calver, M., and Wayne, A. F. (2021). Optimising camera trap height and models increases detection and individual identification rates for a small mammal, the numbat (Myrmecobius fasciatus). Australian Mammalogy 43, 226-234.
| Crossref | Google Scholar |
Serena, M. (1994). Use of time and space by platypus (Ornithorhynchus anatinus: Monotremata) along a Victorian stream. Journal of Zoology 232, 117-131.
| Crossref | Google Scholar |
Serena, M., and Williams, G. A. (1997). Population attributes of platypus (Ornithorhynchus anatinus) in Flinders Chase National Park, Kangaroo Island. The South Australian Naturalist 72, 28-34.
| Google Scholar |
Serena, M., and Williams, G. A. (2012). Effect of sex and age on temporal variation in the frequency and direction of platypus (Ornithorhynchus anatinus) captures in fyke nets. Australian Mammalogy 34, 75-82.
| Crossref | Google Scholar |
Serena, M., Thomas, J. L., Williams, G. A., and Officer, R. C. E. (1998). Use of stream and river habitats by the platypus, Ornithorhynchus anatinus, in an urban fringe environment. Australian Journal of Zoology 46, 267-282.
| Crossref | Google Scholar |
Serena, M., Williams, G. A., Weeks, A. R., and Griffiths, J. (2014). Variation in platypus (Ornithorhynchus anatinus) life-history attributes and population trajectories in urban streams. Australian Journal of Zoology 62, 223-234.
| Crossref | Google Scholar |
Smith, D. H. V., and Weston, K. A. (2017). Capturing the cryptic: a comparison of detection methods for stoats (Mustela erminea) in alpine habitats. Wildlife Research 44, 418-426.
| Crossref | Google Scholar |
Stoeckle, B. C., Beggel, S., Cerwenka, A. F., Motivans, E., Kuehn, R., and Geist, J. (2017). A systematic approach to evaluate the influence of environmental conditions on eDNA detection success in aquatic ecosystems. PLoS One 12, e0189119.
| Crossref | Google Scholar | PubMed |
Strickler, K. M., Fremier, A. K., and Goldberg, C. S. (2015). Quantifying effects of UV-B, temperature, and pH on eDNA degradation in aquatic microcosms. Biological Conservation 183, 85-92.
| Crossref | Google Scholar |
Temple-Smith, P., and Grant, T. (2001). Uncertain breeding: a short history of reproduction in monotremes. Reproduction, Fertility and Development 13, 487-497.
| Crossref | Google Scholar | PubMed |
Thomas, J. L., Parrott, M. L., Handasyde, K. A., and Temple-Smith, P. (2019). Burrow use by juvenile platypuses (Ornithorhynchus anatinus) in their natal home range. Journal of Mammalogy 100, 1182-1190.
| Crossref | Google Scholar |
Thomas, J. L., Parrott, M. L., Handasyde, K. A., and Temple-Smith, P. (2020). Maternal care of platypus nestlings (Ornithorhynchus anatinus). Australian Mammalogy 42, 283-292.
| Crossref | Google Scholar |
Welbourne, D. J., Paull, D. J., Claridge, A. W., and Ford, F. (2017). A frontier in the use of camera traps: surveying terrestrial squamate assemblages. Remote Sensing in Ecology and Conservation 3, 133-145.
| Crossref | Google Scholar |