

Who lives in the open sea? Distribution and densities of surfacing marine megafauna in three subregions of the South Pacific (New Caledonia, Wallis and Futuna, and French Polynesia)
Sophie Laran A * , Olivier Van Canneyt A , Ghislain Dorémus A , Claire Garrigue B C , Tristan Berr B D , Hugo Bourgogne B E , Mathieu Genu A , Jérôme Spitz A F and Vincent Ridoux A F
A
B
C
D
E
F
Abstract
Assessing the distribution and abundance of marine fauna and the ecological status of coastal and pelagic ecosystems is key to biodiversity conservation, but the monitoring of mobile marine species raises multiple logistical and financial challenges.
The project describes the distribution, abundance and taxonomic assemblage of several marine megafauna taxa in three subregions of the western and central South Pacific Ocean (New Caledonia, Wallis and Futuna, and French Polynesia).
Large-scale aerial surveys were conducted using a standardised multi-taxon protocol, to characterise the occurrence and abundance of marine megafauna over 2.5 million km2. Analysing more than 122 000 km of transects, the densities of 22 different taxa were estimated: seven taxonomic groups of marine mammals (Physeteridae, Kogiidae, Ziphiidae, Globicephalinae, Small Delphininae, Large Delphininae, and Dugongidae), a single group for hard-shelled sea turtles, three groups of elasmobranchs (including whale sharks), and 11 groups of seabirds (including Phaethontidae, Hydrobatidae, Fregatidae and Sulidae).
Contrasting patterns of species distribution were found. Marine mammal diversity increases north and west, with a distinct species assemblage in New Caledonia, compared to other subregions. A strong latitudinal gradient was observed across French Polynesia, independent of taxa.
This study provides the first comparison of marine species assemblages across the three oceanic subregions and sets a regional baseline for the biogeography of marine megafauna in the region.
The taxonomic and spatial extension of the results opens up new perspectives for the development of local conservation measures, especially for taxa with already documented population declines.
Keywords: aerial survey, cetacean, dugong, elasmobranch, marine mammal, marine megafauna, seabird, sea turtle, Southwest Pacific Ocean.
Introduction
Marine megafauna (defined here as marine mammals, seabirds, sea turtles, and large elasmobranchs) face major conservation challenges worldwide (Dulvy et al. 2014). These include overfishing, illegal captures, bycatch, reduced resource availability, plastic and chemical pollution, habitat loss or degradation, and global warming and its effect on ecosystems (Worm et al. 2006; Lefort et al. 2015; Senko et al. 2020; Finlayson and van de Merwe 2021; van Weelden et al. 2021; Nelms et al. 2023). Addressing these threats requires the development of appropriate management and mitigation strategies, which in turn require reliable estimates of the abundance and distribution of marine megafauna (Williams et al. 2002). However, effective offshore monitoring poses several challenges due to the high financial and logistical costs of marine survey campaigns. As a result, population trends of most marine megafauna species, their ecological functions, and species interactions within marine communities are poorly studied, despite the fact that they are expected to play a major role in marine ecosystem processes (Estes et al. 2016).
Used for many decades, aerial surveys are an efficient platform for collecting wildlife data over large spatial extents (Caughley et al. 1976), and in short time frames (Davis et al. 2022). Aircraft facilitate large-scale monitoring, and relatively rapid inter-regional comparisons of the abundance and density of target species. Comparable boat-based surveys can take weeks to monitor the same area that an aerial survey can cover in a matter of days. Thus, systematic aerial surveys can be less expensive than large-boat surveys to monitor a given area despite being significantly more expensive per unit of time (Davis et al. 2022). These advantages have led to the increasing use of aerial transects for monitoring and estimating the relative abundance of marine mammals and seabirds (e.g. Pollock et al. 2006; Henkel et al. 2007; Certain and Bretagnolle 2008; Hammond et al. 2013; Laran et al. 2017a, 2017b; Pettex et al. 2017), while less developed for sea turtles (Lauriano et al. 2011; Fuentes et al. 2015) or elasmobranchs (Westgate et al. 2014; Notarbartolo di Sciara et al. 2015). To further reduce costs, simultaneous observations of multiple species groups can be conducted within a single aerial survey (Lauriano et al. 2011; Mannocci et al. 2013a; Laran et al. 2017a), providing the opportunity to describe marine megafaunal assemblages with minimal bias on data collection (Lambert et al. 2019; Stephenson et al. 2023).
A compilation of published geospatial databases of marine mammals transect surveys between 1975 and 2005 shows very poor representation of the Pacific, Indian and South Atlantic Oceans (Kaschner et al. 2012). On average, only 10% of the predicted range of cetacean species was covered by at least one study, and offshore waters have the greatest lack of data on species composition and abundance estimates. Furthermore, most research on marine mammal species in remote areas such as French Polynesia, New Caledonia or Wallis and Futuna is focused on nearshore waters. For example, most of the studies in those three subregions are primarily dedicated on seasonal humpback whales (Megaptera novaeangliae) (Gannier 2004; Garrigue et al. 2015, 2020; Derville et al. 2019, 2020), or dugongs (Dugong dugon), for the lagoons of New Caledonia (Cleguer et al. 2020; Derville et al. 2022; Garrigue et al. 2022). A few studies exist for other species such as the rough-toothed dolphin (Steno bredanensis) (Gannier and West 2005; Oremus et al. 2012; Albertson et al. 2017), the spinner dolphin (Stenella longirostris) (Gannier and Petiau 2006; Oremus et al. 2007), or the Indo-Pacific bottlenose dolphin (Tursiops aduncus) (Bonneville et al. 2021). However, they do not provide estimates of local population sizes and offer limited prospects for conservation. Similarly, knowledge on marine megafaunal species such as seabirds or sea turtles in these three subregions of the south-west and central Pacific is still scarce and/or based on old observational records. Consequently, this lack of data is a major handicap in the implementation of conservation measures such as the designation of marine protected areas (MPAs) or the effective management of anthropogenic activities.
The first objective of this study was to establish a baseline map of the diversity and densities of marine mammals, seabirds, elasmobranchs, and sea turtles in three subregions of the western and central South Pacific Ocean (New Caledonia, Wallis and Futuna, and French Polynesia), using a standardised aerial survey methodology in order to compare megafaunal assemblages along longitudinal gradients and biogeographic provinces. This survey was part of a larger initiative, the REMMOA (Recensement des Mammifères marins et autre Mégafaune pélagique par Observation Aérienne) surveys launched in 2008 by the French Agency for Marine Protected Areas (now the Office Français de la Biodiversité, OFB) to conduct an aerial census of marine mammals and other pelagic megafauna throughout the tropical waters of the French Exclusive Economic Zone (EEZ) to provide marine conservation agencies with baseline information on the marine megafaunal distribution. This large-scale project was conducted in the Caribbean-Guiana (Mannocci et al. 2013a), south-western Indian Ocean (Mannocci et al. 2013b; Laran et al. 2017a), French Polynesia (Lambert et al. 2014; Mannocci et al. 2014) and southwestern Pacific within New Caledonia (Receveur et al. 2022) and Wallis and Futuna waters.
In addition to greatly improved cost-effectiveness, the rationale for developing such multi-taxa surveys using a standardised methodology is to address ecological questions at the community level by collecting information on a wide range of taxa that are visible from the air.
Materials and methods
Study area and survey designs
The geographical extent of the sampling design was chosen to cover a latitudinal and longitudinal gradient and a diversity of marine habitats, but also with regard to the availability of suitable airfields and aircraft maintenance facilities (Fig. 1). Surveys were conducted during the southern tropical wet season (from mid-October to early May), in order to maximise good weather conditions for aerial detection (especially wind speed). The total survey area covers 2.5 million km2 throughout the tropical western and central South Pacific Ocean (Fig. 1). It overlaps with three biogeographic provinces in the Longhurst system (Longhurst 2010), which aims to represent the broad-scale processes that drive ocean productivity. First, the Archipelagic Deep Basin has a very large latitudinal extent from 22°N to 35°S, a complex topography including deep basins and shelves, and includes New Caledonia and the Coral Sea at its eastern boundary. The second province is the Western Pacific Warm Pool, a ‘typical’ tropical system, with an oligotrophic mixed layer and known to be at the heart of the El Niño Southern Oscillation (ENSO) mechanism (Longhurst 2010) and including Wallis and Futuna on its south-eastern border. Finally, the South Pacific Subtropical Gyre, characterised by nutrient depleted waters and often described as the most uniform and stable region of the open ocean (Longhurst 2010) which includes French Polynesia.
Study area and track of effort for REMMOA aerial surveys in the Tropical Pacific Ocean. (a) New Caledonia in 2014, (b) Wallis and Futuna EEZ in 2015, and (c) French Polynesia in 2010, with bold line corresponding to effort covered two times. Top left: the Longhurst Biogeographical Provinces (from http://www.marineregions.org) with (a) in the Archipelagic deep basins, (b) in the Western Pacific warm pool, and (c) in the South Pacific gyre. a–c maps are at the same scale.
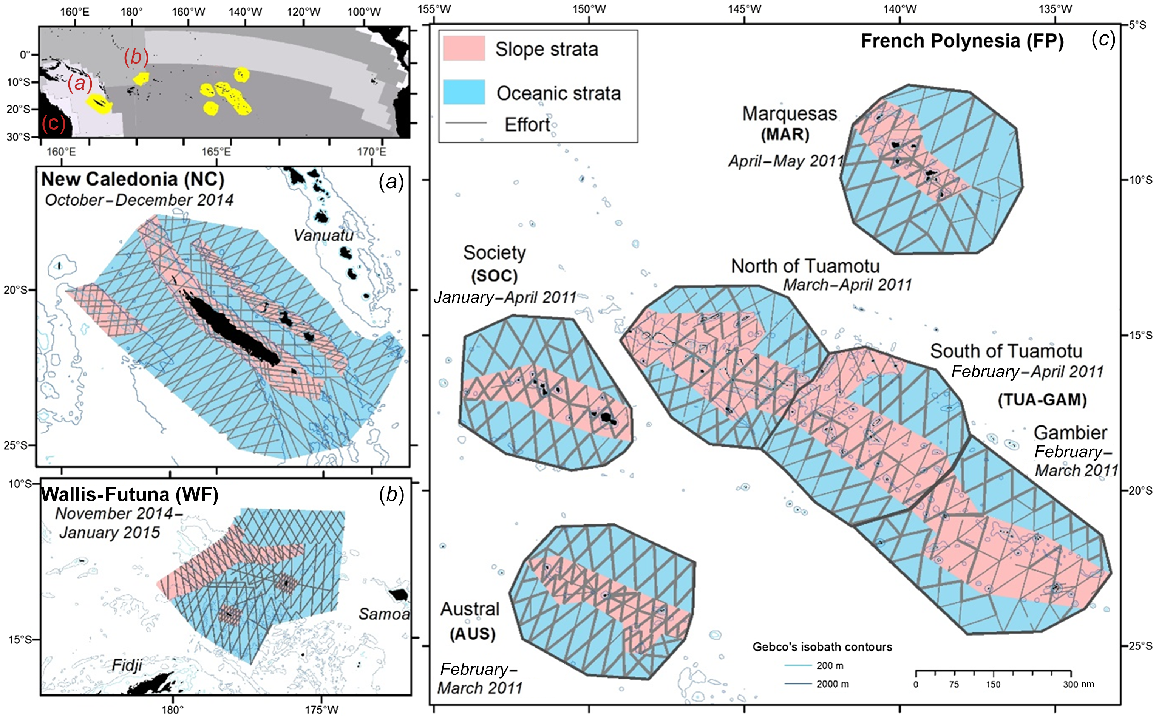
The New Caledonia subregion (25–17°S, 160–171°E) is part of the south-west Pacific, which is considered as the centre of major water pathways from the subtropics to the equator and to southern latitudes (Ganachaud et al. 2007). New Caledonia’s EEZ is included in the Natural Park of the Coral Sea, the fifth largest MPA in the world (1.3 million km2). The study area includes oceanic waters located outside of the barrier reef of the main island up to 250 km to the west, including the shallow banks of Landsdowne and Fairway, and the Loyalty and Walpole Islands to the east, Bélep and d’Entrecasteaux Reefs to the north, and the Isle of Pines in to the south (Fig. 1). This subregion encompasses a variety of habitats including slope, shallow banks, seamounts, and abyssal plains. It was surveyed from October to December 2014. The Chesterfield-Bampton and Bellona submarine plateaus were not surveyed due to their distance from the nearest airfield (Table 1).
| Subregions | Blocks | Area (km2) | Total effort (km) | Effort selected for analyses | Period | |
|---|---|---|---|---|---|---|
| Wallis and Futuna | 230 722 | 22 840 | 21 824 | November 2014–January 2015 | ||
| New Caledonia | 542 216 | 43 301 | 38 675 | October–December 2014 | ||
| French Polynesia | 1 761 472 | 101 280 | 62 165 | |||
| Austral | (AUS) | 261 557 | 23 500 | 15 212 | February–March 2011 | |
| Gambier | (GAM) | 336 802 | 13 648 | 12 103 | February–March 2011 | |
| Society | (SOC) | 271 881 | 17 854 | 12 127 | January–April 2011 | |
| South of Tuamotu | (TUAM) | 297 924 | 14 139 | 7188 | February–April 2011 | |
| North of Tuamotu | 286 174 | 15 571 | 9708 | March–April 2011 | ||
| Marquesas | (MAR) | 307 133 | 16 569 | 5826 | April–May 2011 | |
| Total | 2 534 410 | 167 422 | 122 664 |
The second subregion comprises most of the EEZ of Wallis and Futuna (WF, 15–10°S, 4–9°W). It includes the volcanic islands of Wallis and Futuna and the uninhabited Alofi, as well as some seamounts to the north of Rothuma, Cook’s Dome and Waterwhich Sandbank, and deep offshore waters to the south (Fig. 1). This subregion was surveyed between late November 2014 and mid-January 2015.
Finally, the third subregion which makes up the second largest maritime domain in the South Pacific, is French Polynesia (26–6°S, 154–133°W). Five main archipelagos, all oriented northwest–southeast, create major obstacles to ocean currents in this area. Due to the size of the EEZ, the subregion has been divided into four distinct survey blocks (an isolated group of strata, Fig. 1). The central Tuamotu Archipelago is the largest and includes numerous islands and atolls. Adjacent to it and at its southeastern border is the more dispersed Gambier Archipelago, both of which are included in the Tuamotu-Gambier survey block (TUA-GAM). To the west and south are two major island groups separated by wide deep passages: the Society and Austral archipelagos (Martinez et al. 2009). The French Polynesia subregion exhibits a strong latitudinal gradient in primary production, from the depleted south, to the northern Marquesas Archipelago (Table 1). The western part of the latter benefits from contrasting strong primary production compared to the surrounding oceanic waters, due to a remarkable island mass effect (Martinez and Maamaatuaiahutapu 2004). In addition, the complex geomorphology of the Marquesas archipelago creates a diversity of marine habitats (Galzin et al. 2016). This subregion was surveyed from January to early April 2011.
Survey design in each subregion was pre-determined by airfield locations on islands and aircraft endurance, then the accessible spatial extent was divided into smaller blocks, which were in turn stratified into bathymetric strata: slope (<2000 m) and oceanic (>2000 m). Survey design was optimised with a zigzag track layout, performed with Distance 6.2 software (Thomas et al. 2010) using Equal space zigzag for the New Caledonia and Wallis and Futuna subregions. In French Polynesia tracks were designed manually using a geospatial software (ArcMap from Esri), the survey plan was carried out and some transects were flown a second time on the same axes (56% of the effort in this subregion; Fig. 1) to minimise logistical constraints for the pilots of the three aircraft, with a time lag between crossings of 1 day to 3 months (average 16 days). For the three subregions, the effort/area ratio was not homogeneous between strata, in order to collect enough sightings for specific habitats for distribution modelling. Details are available in the field reports (Van Canneyt et al. 2011, 2015).
Aerial survey protocol
Surveys were conducted using a standard line-transect methodology (Buckland et al. 2001), as previously used for marine mammals (Hammond et al. 2013), but adapted for a multi-target protocol (Laran et al. 2017a; Lambert et al. 2019). To achieve the planned effort in a relatively short period of time, we simultaneously used three twin-engine Britten Norman Islander (BN-2 high-winged aircrafts with fixed landing gear). Transects were flown at 90 knots (167 km.h−1) with a target altitude of 600 feet (183 m). The survey team consisted of 12 to 19 different observers per subregion (with the same team in New Caledonia and Wallis and Futuna), including five observers consistent across the three subregions. Observers attended a 1-week training course before participating in the surveys, which included a few training flights. Each flight typically consisted of two observers scanning the sea surface on either side of the aircraft with the naked eye in order to survey close to the track line through both bubble windows. Both were connected by intercom to the data recorder and the pilot. To minimise bias due to observer fatigue, crew members rotated approximately every hour, with an off-duty observer on board. Data were collected using the SAMMOA software (SAMMOA 2014), which provides an audio recording that can be used for post-validation. Observers recorded all environmental conditions impacting the detection of animals: sea state (Beaufort scale), turbidity (from 0 for clear water to 2 for turbid water, where animals are only visible very close to the surface), cloud cover (0–8 octas), glare angle (0–360°) and severity (from 0 with no glare to 3 a strong glare that affects the ability to detect sightings), and a subjective ranking of sighting conditions (excellent, good, medium, poor). These covariates were recorded for each transect and whenever any of them changed. Observers scanned the sea surface and sub-surface as well as the air column searching for all targeted taxa. Maximum collection distance from the transect was 200 m for seabirds, jellyfish, plankton (as Trichodesmium mats) and marine debris using a strip transect methodology, assuming that all available individuals were seen within the 200 m on either side of the transect, while for boat sightings two 500 m strip were considered. Both distances were marked on the landing gear. In addition, surfacing flying fish species, from Exocoetidae family, were counted using two manual counters and aggregated by section of transect. For marine mammals, sea turtles, and elasmobranchs, perpendicular distance was measured with clinometers when the animal was abeam. Number of individuals in each sighting, and presence of juvenile were also recorded. All taxa were identified to the lowest taxonomic level possible. Several taxa that could not be distinguished from the air, such as small sized delphinids, hard-shelled turtles or ‘grey’ terns, were grouped together for analyses (see Supplementary Table S1–S4 for the list of taxa). In this study, only sightings of marine mammals, seabirds, sea turtles and large fish were considered.
The aircraft stayed on the track line except when circle-back manoeuvres were engaged in order to check identification, group size or to collect digital images for some specific marine mammal sightings. The effort was stopped for a few minutes and resumed when the aircraft rejoined the track at the stopping point. Flights were scheduled only in good weather condition (Beaufort scale <4) with the Zygrib interface (www.zygrib.org) for visualisation of NOAA-GFS standard weather forecast grib files.
Data analysis
A total of 167 422 km of transects were flown across the three subregions. To visualise the spatial distribution of identified taxa, the number of individuals encountered per kilometre was mapped on a 60 km × 60 km grid (to optimise effort homogeneity among cells).
For density estimates, only effort and sightings collected under good conditions (sea state <4 Beaufort and subjective condition equal to, or better than, ‘Medium’ on both sides of the aircraft) were retained thereby limiting variation in perception bias.
The strip transect methodology for seabirds assumes perfect detection within 2 m × 200 m bands (each side of the aircraft). For other taxa, sightings with larger perpendicular distances were truncated (≈5% of sightings) and excluded (Buckland et al. 2001), and detection functions were fitted. The effective strip widths (ESW) were estimated for all species or groups of species using Distance sampling methodology (Thomas et al. 2010), with the R package PelaCDS (ver. 0.1.0.9002) from Pelaverse package environment1. Data from all three subregions were pooled, as these surveys share the same protocol, training procedures and partially the same observers across subregions.
Hazard rate and half normal models were fitted to perpendicular distances, and for each taxa the model that minimised the Akaike Information Criterion (AIC) was selected as the detection function (see Supplementary Fig. S1). Multiple Covariate Distance Sampling analysis (MCDS, Marques and Buckland 2004) was tested using sea state, turbidity, cloud cover and glare severity as covariates. Mean group size and encounter rate were estimated for each bathymetric strata for seven marine mammal taxa, eleven seabird groups, three elasmobranch groups and the hard-shelled sea turtles. And then densities were re-estimated (weighted according to strata area), as the coefficient of variation, following Buckland et al. (2001).
The detection probability on the track line is typically composed of the perception and the availability bias. No specific protocol was implemented to estimate the perception bias and it was kept as constant as possible (standardised protocol, same aircraft types, partly same observers). Regarding the availability bias, information on diving behaviour and the proportion of time spent visible at surface of the different species was collected from the literature and used as the correction (Thomson et al. 2012). Correction factors applied to density estimates were assumed to be equal to 1 for seabird taxa and summarised on Table 2 for other groups. The same proportions were used as in the previous study in the south-west Indian Ocean (see Laran et al. (2017a), Table S1); supplemented by an availability correction factor of 0.834 for dugongs estimated in New Caledonia, using a global value for all water depths (Hagihara et al. 2016, 2018) and 0.25 as the mean percentage of time spent in the top 5 m for more than 60 individuals of whale sharks (Rhincodon typus) (Andrzejaczek et al. 2022).
| Taxa | Family | Group | % time spent at surface | |
|---|---|---|---|---|
| Marine mammals | Deep diver | Physeteridae | 20 | |
| Kogiidae | 10 | |||
| Ziphiidae | 9 | |||
| Globicephalinae | Large Globicephalinae | 70 | ||
| Risso’s dolphins | ||||
| Small Globicephalinae | ||||
| Delphininae | Large Delphininae | 75 | ||
| Small Delphininae | ||||
| Dugongidae | 83.4 A | |||
| Sea turtles | Hard-shelled turtles | 35 | ||
| Elasmobranchs | Whale sharks | 25 B | ||
| Sharks | 10 | |||
| Rays | 50 |
Additional references from:
To examine regional patterns in the marine megafaunal community, we compared relative densities of 22 different taxa, corrected (for availability bias only) in six survey areas considered as sample sites: New Caledonia, Wallis and Futuna, and French Polynesia divided among Austral, Society, Tuamotu-Gambier (TUA-GAM) and Marquesas. For each, the community assemblage was investigated with Principal Component Analysis (PCA) using the multivariate analysis R package FactoMineR of R 2.7 (Lê et al. 2008).
Results
A total of 122 664 km of transect were retained for analyses from the three subregions, including 38 675 km for New Caledonia, 21 824 km for Wallis and Futuna and 62 165 km for the French Polynesia conducted in good sighting conditions (Table 1). Sighting conditions filters resulted in a significant reduction in effort for the TUA-GAM and Marquesas survey blocks in French Polynesia (Table 1).
Detection functions for marine mammals, sea turtles and elasmobranchs were presented by group (Fig. S1). MCDS analysis obtained minimum AIC for Globicephalinae and sea state, same for Kogiidae and sea turtles with glare severity, but none had a logical trend (Fig. S2), excepted for Ziphiidae which was the only group where MCDS was included to estimate abundance, the others were estimated through CDS without any covariates.
Marine mammals
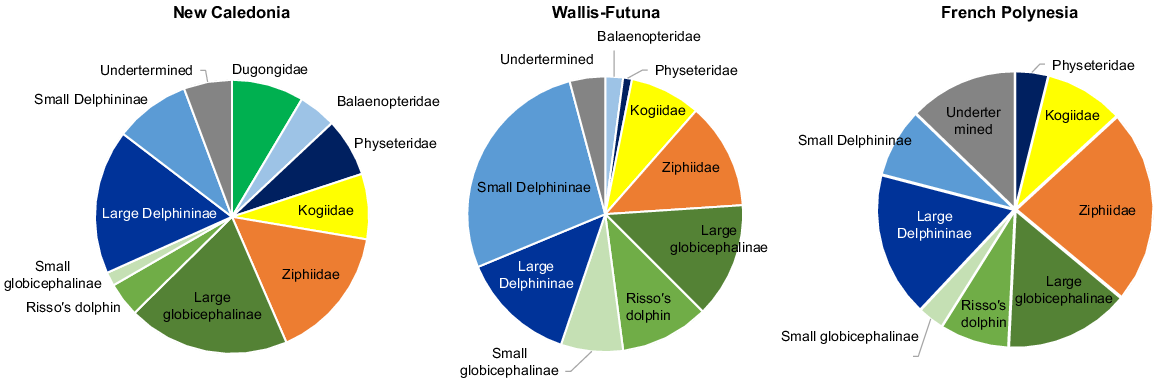
A total of 19 species of marine mammals were identified at the species level (or genus level for Kogia spp) from 602 sightings (5169 individuals) across the three subregions (see Table S1 for details by species and subregion). Results were pooled into taxonomic groups, with the exception of the dugong, because of the general difficulty of identifying species from the air. Selected taxa were: Balaenopteridae, Ziphiidae, Kogiidae, Physeteridae, small Delphininae (S. longirostris, Stenella attenuata, Delphinus spp) large Delphininae (Tursiops truncatus, Lagenodelphis hosei, Steno bredanensis, T. aduncus), small Globicephalinae (Peponocephala electrea, Feresa attenuata), large Globicephalinae (Globicephala macrorhynchus, Pseudorca crassidens, Orcinus orca or the well distinctive Grampus griseus). The minimum diversity was encountered in Austral, with only five distinct taxonomic groups, increasing north-ward and west-ward to 18 groups in New Caledonia, including four species of baleen whales and the dugong. Delphininae account for a quarter of the sightings, except in Wallis and Futuna (41%). Deep divers, such as Physeteridae, Kogiidae and Ziphiidae accounted for one quarter of sightings in Wallis and Futuna to one-third in the other two subregions (Fig. 2). Occurrences of Globicephalinae were about the same in all subregions. Balaenopteridae were seen from October to January in New Caledonia and Wallis and Futuna, but not at all in French Polynesia, which was surveyed later, between January and early May.
Taxonomic composition of sightings of marine mammals (on transect of effort) collected over the three subregions.
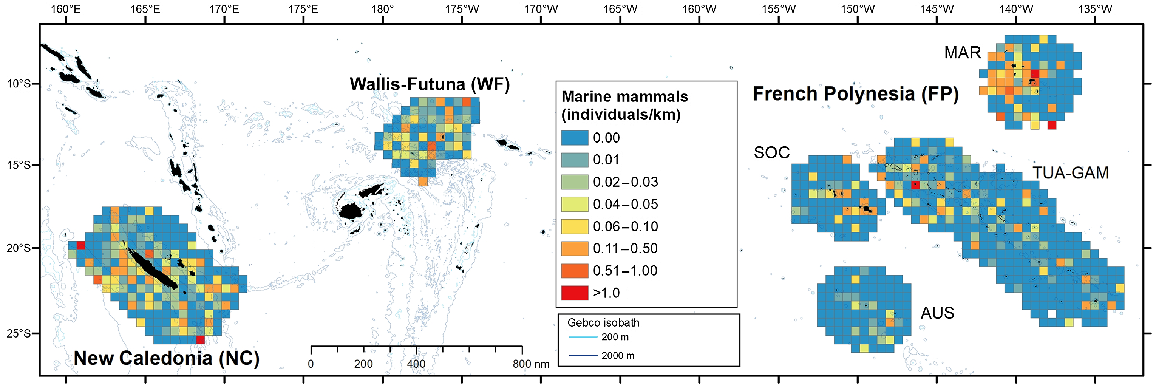
Marine mammals, in terms of individuals per kilometre of effort, exhibited a patchy distribution in French Polynesia, favouring nearshore waters, with the exception of the western part of Marquesas, where cells with the maximum index of individuals per kilometre were found even offshore (Fig. 3). In New Caledonia and Wallis and Futuna, their distribution is more homogeneous. Among taxonomic groups, deep divers were the most evenly distributed with juveniles (about 1/3 to 1/2 the size of adults) encountered in all subregions (Fig. S3). Higher densities of Ziphiidae and Kogiidae were estimated in the Marquesas survey block, with 0.08 and 0.06 individuals/km2, respectively (corrected density, Table 3). Large and small Delphininae preferred waters around islands, except in Wallis and Futuna and west of the Marquesas (French Polynesia) where they were also encountered offshore. Juveniles were encountered in all three subregions (Fig. S3). Wallis and Futuna had the highest corrected density of small Delphininae with 0.05 individuals/km2 (CV = 31%), twice that of New Caledonia, while the density of large Delphininae peaked in New Caledonia (0.03 individuals/km2, CV = 38%). The encounter rate of Globicephalinae peaked west of New Caledonia, in the Coral Sea (west of Grande Terre Island, where several sightings included juveniles), and west of the Marquesas, but the higher densities were estimated in Wallis and Futuna (0.07 individuals/km2, CV = 55%) and New Caledonia (0.06 individuals/km2, CV = 55%), with values at least three times higher than in central and northern French Polynesia (Table 3).
Spatial distribution of individuals visually detected per kilometre for marine mammals in the three Pacific’s subregions: New Caledonia, Wallis and Futuna and French Polynesia during REMMOA surveys. Each pooled on a 60 km × 60 km grid cell and given in individuals per kilometre. Cells accounting for a minimum effort of 50 km.
| Taxa | Uncorrected for availability | Corrected for availability | |||||||||
|---|---|---|---|---|---|---|---|---|---|---|---|
| Subregion -blocks | Density | CV (%) | Abundance | CI 95% | Density | Abundance | CI 95% | ||||
| Min | Max | Min | Max | ||||||||
| Dugongidae | NC | 0.0010 | 32 | 554 | 301 | 1022 | 0.001 | 664 | 361 | 1225 | |
| Small Delphininae | NC | 0.0211 | 35 | 11 424 | 4058 | 33 790 | 0.028 | 15 232 | 5411 | 45 053 | |
| WF | 0.0366 | 31 | 8453 | 3394 | 21 674 | 0.049 | 11 271 | 4525 | 28 899 | ||
| FP-AUS | – | – | – | – | – | – | – | – | |||
| FP-SOC | 0.0114 | 86 | 3475 | 804 | 15 029 | 0.015 | 3604 | 829 | 15 651 | ||
| FP-TUA-GAM | 0.0062 | 51 | 5716 | 1199 | 27 854 | 0.008 | 7621 | 1599 | 37 139 | ||
| FP-MAR | 0.0087 | 68 | 2473 | 617 | 10 029 | 0.012 | 3297 | 823 | 13 372 | ||
| Large Delphininae | NC | 0.0229 | 38 | 12 416 | 4188 | 38 304 | 0.031 | 16 555 | 5584 | 51 072 | |
| WF | 0.0109 | 38 | 2517 | 827 | 7887 | 0.015 | 3356 | 1103 | 10 516 | ||
| FP-AUS | – | – | – | – | – | – | – | – | |||
| FP-SOC | 0.0030 | 88 | 734 | 143 | 3786 | 0.004 | 943 | 183 | 4864 | ||
| FP-TUA-GAM | 0.0022 | 55 | 2030 | 513 | 8139 | 0.003 | 2707 | 684 | 10 852 | ||
| FP-MAR | 0.0075 | 78 | 2111 | 431 | 10 366 | 0.010 | 2815 | 575 | 13 821 | ||
| Globicephalinae | NC | 0.0423 | 42 | 22 932 | 7121 | 86 048 | 0.060 | 32 760 | 10 173 | 122 926 | |
| WF | 0.0477 | 55 | 11 012 | 2856 | 43 710 | 0.068 | 15 731 | 4080 | 62 443 | ||
| FP-AUS | 0.0006 | 79 | 170 | 43 | 669 | 0.001 | 243 | 61 | 956 | ||
| FP-SOC | 0.0149 | 52 | 3682 | 1192 | 11 399 | 0.021 | 5017 | 1630 | 15 477 | ||
| FP-TUA-GAM | 0.0154 | 61 | 14 164 | 3447 | 60 481 | 0.022 | 20 234 | 4924 | 86 401 | ||
| FP-MAR | 0.0163 | 67 | 4631 | 1398 | 15 337 | 0.023 | 6616 | 1997 | 21 910 | ||
| Kogiidae | NC | 0.0011 | 29 | 621 | 231 | 1806 | 0.011 | 6210 | 2310 | 18 060 | |
| WF | 0.0013 | 38 | 291 | 101 | 876 | 0.013 | 2910 | 1010 | 8760 | ||
| FP-AUS | 0.0005 | 60 | 119 | 29 | 504 | 0.005 | 1190 | 290 | 5040 | ||
| FP-SOC | – | – | – | – | – | – | – | – | – | ||
| FP-TUA-GAM | 0.0003 | 62 | 240 | 60 | 987 | 0.003 | 2400 | 600 | 9870 | ||
| FP-MAR | 0.0065 | 43 | 1834 | 818 | 4108 | 0.065 | 18 340 | 8180 | 41 080 | ||
| Physteridae | NC | 0.0010 | 40 | 544 | 136 | 2352 | 0.005 | 2720 | 680 | 11 760 | |
| WF | 0.0002 | 101 | 38 | 7 | 197 | 0.001 | 190 | 35 | 985 | ||
| FP-AUS | 0.0012 | 93 | 313 | 67 | 1469 | 0.006 | 1565 | 335 | 7345 | ||
| FP-SOC | – | – | – | – | – | – | – | – | |||
| FP-TUA-GAM | 0.0001 | 102 | A | A | A | A | A | A | A | ||
| FP-MAR | – | – | – | – | – | – | – | – | – | ||
| Ziphiidae | NC | 0.0047 | 24 | 2554 | 1025 | 6629 | 0.052 | 28 378 | 11 389 | 73 656 | |
| WF | 0.0014 | 4 | 334 | 101 | 1143 | 0.016 | 3711 | 1122 | 12 700 | ||
| FP-AUS | 0.0011 | 53 | 293 | 83 | 1041 | 0.012 | 3256 | 922 | 11 567 | ||
| FP-SOC | 0.0014 | 69 | 367 | 108 | 1242 | 0.016 | 4078 | 1200 | 13 800 | ||
| FP-TUA-GAM | 0.0022 | 27 | 2063 | 741 | 6175 | 0.025 | 22 922 | 8233 | 68 611 | ||
| FP-MAR | 0.0076 | 41 | 2145 | 935 | 4982 | 0.084 | 23 833 | 10 389 | 55 356 | ||
| Hard-shelled turtles | NC | 0.0094 | 13 | 5104 | 3712 | 7427 | 0.027 | 14 583 | 10 606 | 21 220 | |
| WF | 0.0024 | 37 | 561 | 196 | 1678 | 0.007 | 1603 | 560 | 4794 | ||
| FP-AUS | 0.0005 | 59 | 129 | 31 | 544 | 0.001 | 369 | 89 | 1554 | ||
| FP-SOC | 0.0011 | 85 | 342 | 80 | 1459 | 0.003 | 760 | 177 | 3257 | ||
| FP-TUA-GAM | 0.0022 | 25 | 2069 | 952 | 4767 | 0.006 | 5911 | 2720 | 13 620 | ||
| FP-MAR | 0.0007 | 100 | 195 | 38 | 1002 | 0.002 | 557 | 109 | 2863 | ||
| Rays | NC | 0.0158 | 13 | 8556 | 6173 | 12 333 | 0.032 | 17 112 | 12 346 | 24 666 | |
| WF | 0.0021 | 33 | 473 | 160 | 1496 | 0.004 | 946 | 320 | 2992 | ||
| FP-AUS | 0.0009 | 51 | 228 | 65 | 797 | 0.002 | 456 | 130 | 1594 | ||
| FP-SOC | 0.0027 | 51 | 789 | 266 | 2425 | 0.005 | 1266 | 420 | 3982 | ||
| FP-TUA-GAM | 0.0041 | 25 | 3731 | 1532 | 10 474 | 0.008 | 7462 | 3064 | 20 948 | ||
| FP-MAR | 0.0182 | 24 | 5165 | 2700 | 9975 | 0.036 | 10 330 | 5400 | 19 950 | ||
| Sharks | NC | 0.0094 | 17 | 5107 | 2884 | 9277 | 0.094 | 51 070 | 28 840 | 92 770 | |
| WF | 0.0019 | 29 | 438 | 142 | 1430 | 0.019 | 4380 | 1420 | 14 300 | ||
| FP-AUS | 0.0001 | 102 | A | 7 | 177 | 0.001 | 340 | 70 | 1770 | ||
| FP-SOC | 0.0055 | 74 | 1620 | 402 | 6541 | 0.055 | 12 910 | 3200 | 52 130 | ||
| FP-TUA-GAM | 0.0082 | 19 | 7512 | 4172 | 14 441 | 0.082 | 75 120 | 41 720 | 144 410 | ||
| FP-MAR | 0.0031 | 44 | 892 | 337 | 2399 | 0.031 | 8920 | 3370 | 23 990 | ||
| Whale sharks | NC | 0.0004 | 34 | 233 | 85 | 694 | 0.002 | 932 | 340 | 2776 | |
| WF | 0.0016 | 27 | 360 | 145 | 916 | 0.006 | 1440 | 580 | 3664 | ||
| FP-AUS | 0.0004 | 60 | 105 | 27 | 415 | 0.002 | 420 | 108 | 1660 | ||
| FP-SOC | 0.0005 | 60 | 130 | 32 | 544 | 0.002 | 519 | 129 | 2178 | ||
| FP-TUA-GAM | 0.0002 | 60 | 199 | 48 | 845 | 0.001 | 796 | 192 | 3380 | ||
| FP-MAR | – | – | – | – | – | – | – | – | – | ||
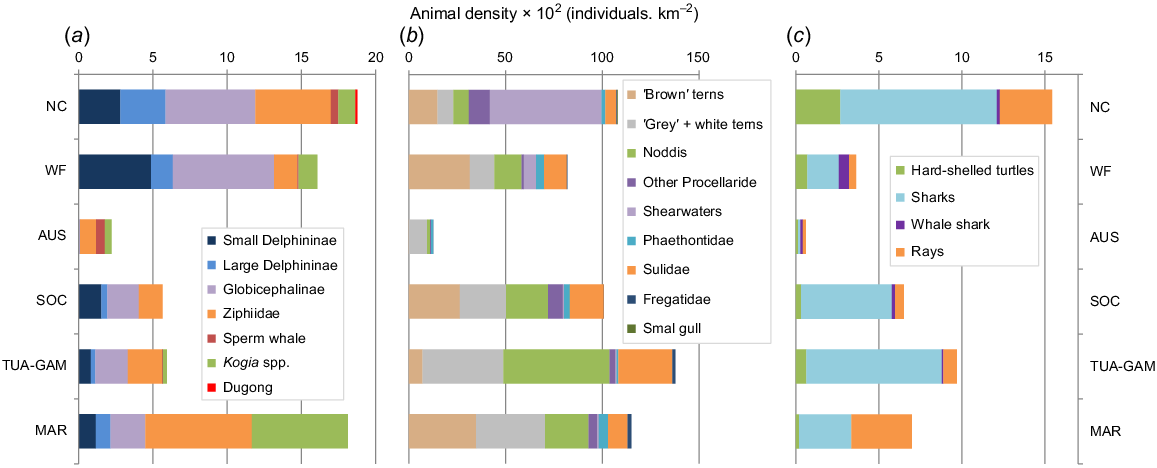
Cumulative density (corrected for availability) of marine mammals was minimal in the oligotrophic waters of Austral (Fig. 4). It increased towards the north of French Polynesia, culminating in the Marquesas, where it was similar to that of New Caledonia and, to a lesser extent, Wallis and Futuna. New Caledonia had the more diverse composition with similar estimates for Delphininae, Globicephalinae, and deep divers (Ziphiidae, Physeteridae and Kogiidae). Wallis and Futuna was dominated by small Delphininae and Globicephalinae (mainly Risso’s dolphin, melon-headed whales and pygmy killer whales). And among the deep divers, Longman’s beaked whales (Indopacetus pacificus) were particularly abundant, while in the Marquesas Ziphiidae and Kogiidae were dominant.
Cumulative densities (×102 individuals/km2) across the six distinctive survey blocks of the tropical Pacific Ocean, corrected for availability bias considering averaged proportion of time spend at surface for (a) cetaceans, (c), turtles, sharks and rays; while (b) seabird densities were not corrected. (NC, New Caledonia; WF, Wallis-Futuna; and for French Polynesia AUS, Austral, SOC, Society; TUA-GAM, Tuamotu-Gambier and MAR, Marquesas).
Seabirds
Of the 25 842 seabird sightings (73 310 individuals), 4094 could be assigned to single species and 16 011 were identified at the genus level (eight genera). The remaining sightings (5737) could only be identified at higher taxonomic levels (Table S2). Species with only one sighting record were considered to be rare and were excluded from tables and analyses. For consistency, sightings were pooled into 11 different taxonomic groups: ‘Brown’ terns, ‘Grey’ terns, White terns, Noddies, Hydrobatidae, ‘Grey’ petrels, ‘Brown’ petrels, Shearwaters, Sulidae, Phaethontidae, Fregatidae and silver gull (Larus novaehollandiae) for New Caledonia only (see Tables 4 and S3 for detail on species).
| Taxa | Subregion – blocks | Density | CV (%) | Abundance | CI 95% | ||
|---|---|---|---|---|---|---|---|
| Min | Max | ||||||
| Silver gull (small gull) | NC | 0.0172 | 100 | 1378 | 308 | 6161 | |
| ‘Brown’ terns | NC | 0.1491 | 18 | 80 841 | 42 833 | 159 837 | |
| WF | 0.3151 | 15 | 72 709 | 44 335 | 119 500 | ||
| FP-AUS | 0.0019 | 51 | 492 | 140 | 1714 | ||
| FP-SOC | 0.2634 | 27 | 65 030 | 35 622 | 118 722 | ||
| FP-TUA-GAM | 0.0715 | 23 | 65 807 | 35 527 | 123 289 | ||
| FP-MAR | 0.3481 | 20 | 98 640 | 59 951 | 164 957 | ||
| ‘Grey’ terns | NC | 0.0653 | 18 | 35 405 | 23 726 | 53 285 | |
| WF | 0.0021 | 49 | 487 | 155 | 1560 | ||
| FP-AUS | 0.0001 | 99 | A | A | A | ||
| FP-SOC | 0.0022 | 48 | 567 | 197 | 1703 | ||
| FP-TUA-GAM | 0.0103 | 25 | 9463 | 4723 | 19 765 | ||
| FP-MAR | 0.0115 | 64 | 3252 | 989 | 12 090 | ||
| White terns | NC | 0.0152 | 12 | 8249 | 5070 | 13 607 | |
| WF | 0.1241 | 11 | 28 632 | 20 248 | 40 758 | ||
| FP-AUS | 0.0934 | 12 | 24 417 | 17 528 | 34 046 | ||
| FP-SOC | 0.2375 | 25 | 60 099 | 37 079 | 100 945 | ||
| FP-TUA-GAM | 0.4073 | 5 | 375 119 | 297 613 | 474 522 | ||
| FP-MAR | 0.3447 | 12 | 97 671 | 71 193 | 135 341 | ||
| Noddies | NC | 0.0802 | 22 | 43 463 | 25 711 | 73 770 | |
| WF | 0.1413 | 39 | 32 612 | 13 477 | 80 079 | ||
| FP-AUS | 0.0144 | 40 | 3772 | 1437 | 9946 | ||
| FP-SOC | 0.2160 | 26 | 56 604 | 29 382 | 109 693 | ||
| FP-TUA-GAM | 0.5487 | 12 | 505 280 | 320 103 | 807 827 | ||
| FP-MAR | 0.2243 | 17 | 63 550 | 41 397 | 97 648 | ||
| Hydrobatidae | NC | 0.0009 | 31 | 465 | 151 | 1516 | |
| WF | 0.0001 | 101 | A | A | A | ||
| FP-AUS | – | – | – | – | |||
| FP-SOC | 0.0004 | 73 | 113 | 22 | 586 | ||
| FP-TUA-GAM | – | – | – | – | |||
| FP-MAR | 0.0095 | 26 | 2696 | 1370 | 5311 | ||
| ‘Grey’ petrels | NC | 0.0589 | 9 | 31 910 | 23 924 | 43 339 | |
| WF | 0.0040 | 22 | 912 | 469 | 1826 | ||
| FP-AUS | 0.0011 | 39 | 291 | 108 | 808 | ||
| FP-SOC | 0.0049 | 24 | 1208 | 683 | 2187 | ||
| FP-TUA-GAM | 0.0019 | 26 | 1768 | 667 | 4934 | ||
| FP-MAR | 0.0036 | 41 | 1030 | 477 | 2224 | ||
| ‘Brown’ petrels | NC | 0.0503 | 12 | 27 279 | 17 342 | 43 541 | |
| WF | 0.0069 | 56 | 1584 | 520 | 5674 | ||
| FP-AUS | 0.0040 | 27 | 1040 | 504 | 2158 | ||
| FP-SOC | 0.0436 | 14 | 11 729 | 7998 | 17 212 | ||
| FP-TUA-GAM | 0.0260 | 10 | 23 942 | 15 734 | 37 444 | ||
| FP-MAR | 0.0395 | 14 | 11 179 | 7613 | 16 650 | ||
| Shearwaters | NC | 0.5767 | 11 | 312 692 | 210 308 | 469 006 | |
| WF | 0.0634 | 16 | 14 618 | 8890 | 24 134 | ||
| FP-AUS | – | – | – | – | |||
| FP-SOC | 0.0065 | 34 | 1648 | 710 | 3886 | ||
| FP-TUA-GAM | 0.0056 | 15 | 5138 | 2839 | 9795 | ||
| FP-MAR | 0.0081 | 27 | 2288 | 1127 | 4652 | ||
| Sulidae | NC | 0.0567 | 17 | 30 751 | 17 790 | 57 506 | |
| WF | 0.1180 | 14 | 27 223 | 16 383 | 45 478 | ||
| FP-AUS | – | – | – | – | |||
| FP-SOC | 0.1746 | 22 | 49 058 | 27 655 | 87 120 | ||
| FP-TUA-GAM | 0.2779 | 14 | 255 939 | 149 057 | 448 567 | ||
| FP-MAR | 0.1011 | 31 | 28 640 | 13 312 | 62 083 | ||
| Phaethontidae | NC | 0.0192 | 8 | 10 392 | 7480 | 14 677 | |
| WF | 0.0417 | 7 | 9618 | 7458 | 12 513 | ||
| FP-AUS | 0.0101 | 15 | 2634 | 1752 | 3964 | ||
| FP-SOC | 0.0300 | 11 | 8193 | 6038 | 11 119 | ||
| FP-TUA-GAM | 0.0096 | 13 | 8879 | 5145 | 15 495 | ||
| FP-MAR | 0.0480 | 12 | 13 605 | 10 179 | 18 204 | ||
| Fregatidae | NC | 0.0042 | 22 | 2263 | 1124 | 4653 | |
| WF | 0.0015 | 28 | 352 | 121 | 1067 | ||
| FP-AUS | 0.0003 | 72 | 82 | 16 | 421 | ||
| FP-SOC | 0.0008 | 58 | 189 | 66 | 544 | ||
| FP-TUA-GAM | 0.0155 | 29 | 14 286 | 6212 | 33 707 | ||
| FP-MAR | 0.0190 | 19 | 5375 | 3203 | 9033 | ||
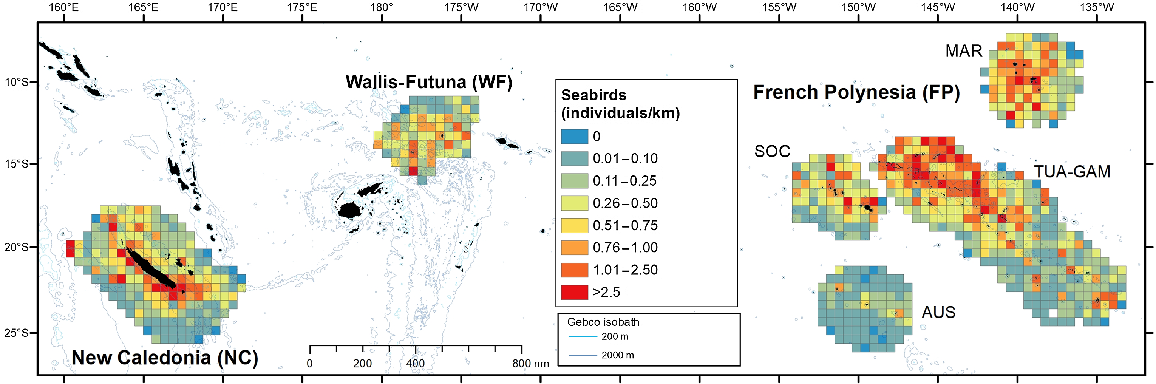
Taxonomic diversity appeared to be roughly similar across subregions, with most categories found in all three subregions (Table 4). Encounter rate of seabirds (in individuals/km) showed contrasting patterns, with high values in the north of the TUA-GAM survey block (French Polynesia) and the south-west coast of New Caledonia (Fig. 5). Similarly, the cumulative density of seabirds peaked in TUA-GAM, followed by Marquesas, New Caledonia and Society survey blocks (Fig. 4). New Caledonia hosts the highest densities of shearwaters and ‘Grey’ petrels, with densities decreasing along a west-east longitudinal gradient, decreasing by one or two orders of magnitude in Wallis and Futuna and French Polynesia (Table 4; Fig. S4). This presence seems to be rather coastal and coincides with the breeding of petrels (Tahiti petrel, Pseudobulweria rostrata; black-winged petrel, Pterodroma nigripennis and Gould’s petrel, P. leucoptera) or shearwaters (wedgetailed, Ardenna pacifica; short-tailed shearwaters, Ardenna tenuirostris) breeding or migrating during the beginning of the monitoring in December. Conversely, noddies, white terns, Sulidae and Fregatidae were most abundant in French Polynesia compared to western subregions. Phaethontidae stood out as the only group with homogeneous densities in all three subregions.
Spatial distribution of individuals visually detected per kilometre for seabirds in the three Pacific’s subregions: New Caledonia, Wallis and Futuna and French Polynesia during REMMOA surveys. Each pooled on a 60 km × 60 km grid cell and given in individuals/km. Cells accounting for a minimum effort of 50 km.
Elasmobranchs
A total of 702 sightings (905 individuals) of elasmobranchs were collected during line transect efforts (Table S4). The highest occurrence (individuals/km) was observed along the west coast of New Caledonia and west of Marquesas (Fig. 6), while only a few encounters were observed in the south of French Polynesia. Both Marquesas and New Caledonia have similar densities of rays (Table 3), while shark density peaked in New Caledonia, then in TUA-GAM (Fig. 4).
Spatial distribution of individuals visually detected per kilometre for elasmobranchs (sharks including whale shark and rays), in the three Pacific’s subregions: New Caledonia, Wallis and Futuna and French Polynesia during REMMOA surveys. Each pooled on 60 km × 60 km grid cell and given in individuals per kilometre. Cells accounting for a minimum effort of 50 km. Sightings of whale sharks were plotted (pink diamond).
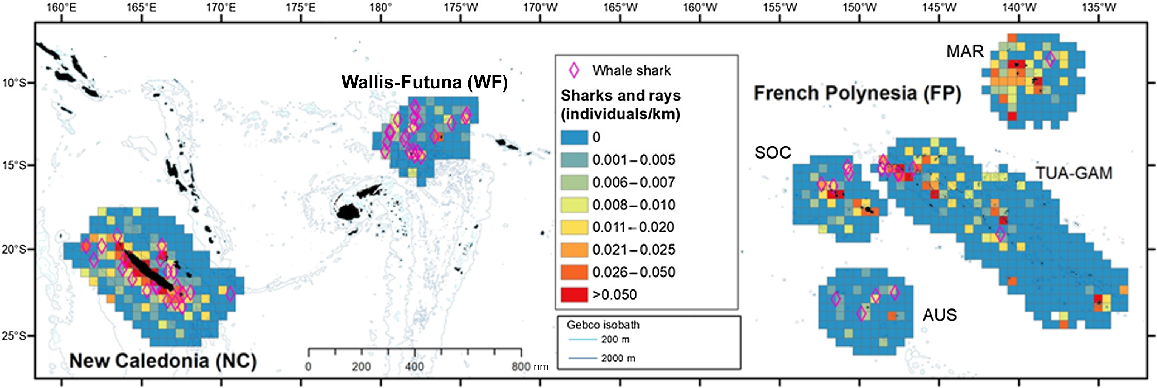
Only a few conspicuous taxa could be identified at the species level from the air, notably the whale shark, only encountered as single individuals. Although encountered in all three subregions, whale sharks were particularly abundant along the west coast of Grande Terre (New Caledonia) and in the waters of Wallis and Futuna (surveyed from October to January; Fig. 6), where the density was highest (Table 3).
Sea turtles
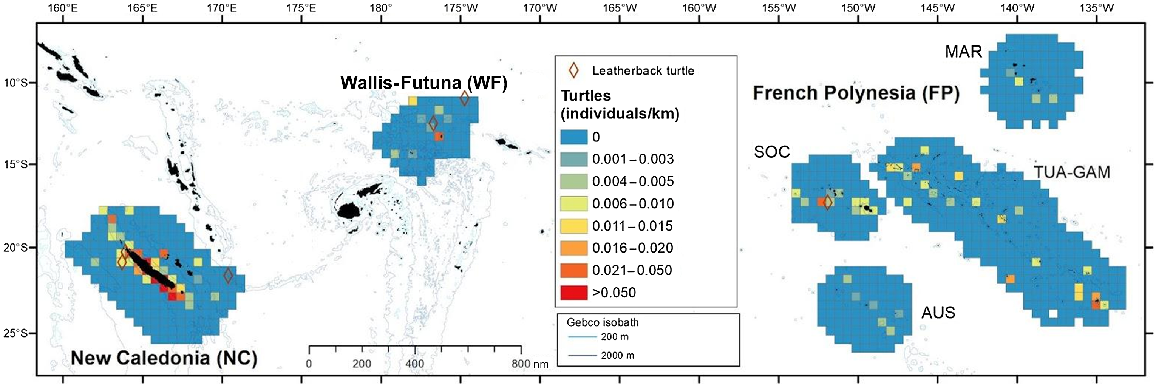
A total of the 260 sea turtle sightings (equivalent to 287 individuals) were collected during the transect effort. Only three were identified as leatherback turtles (Dermochelys coriacea) (Table S4), one in each of the three subregions, indicating the scarcity of this relatively distinctive species, at least during the survey period.
Hard-shelled sea turtles were encountered in all subregions, mostly in coastal waters, where the index of individuals per km peaked (Fig. 7). Global density of hard-shelled sea turtles was highest in New Caledonia, followed by Wallis and Futuna and TUAM-GAM, although densities were almost four times lower (Table 3, Fig. 4).
Spatial distribution of individuals visually detected per kilometre for hard-shelled sea turtles (with sightings of leatherback turtles) in the three Pacific’s subregions: New Caledonia, Wallis and Futuna and French Polynesia during REMMOA surveys. Each pooled on a 60 km × 60 km grid cell and given in individuals per kilometre. Cells accounting for a minimum effort of 50 km. Sightings of leatherback turtles were plotted (brown diamond).
Megafauna assemblages
When considering cumulative corrected densities for all taxa (Fig. 4), consistent general patterns emerged, with the western-most subregion (New Caledonia) peaking for marine mammals, turtles, and elasmobranchs, the Marquesas for marine mammals and the TUA-GAM for seabirds only.
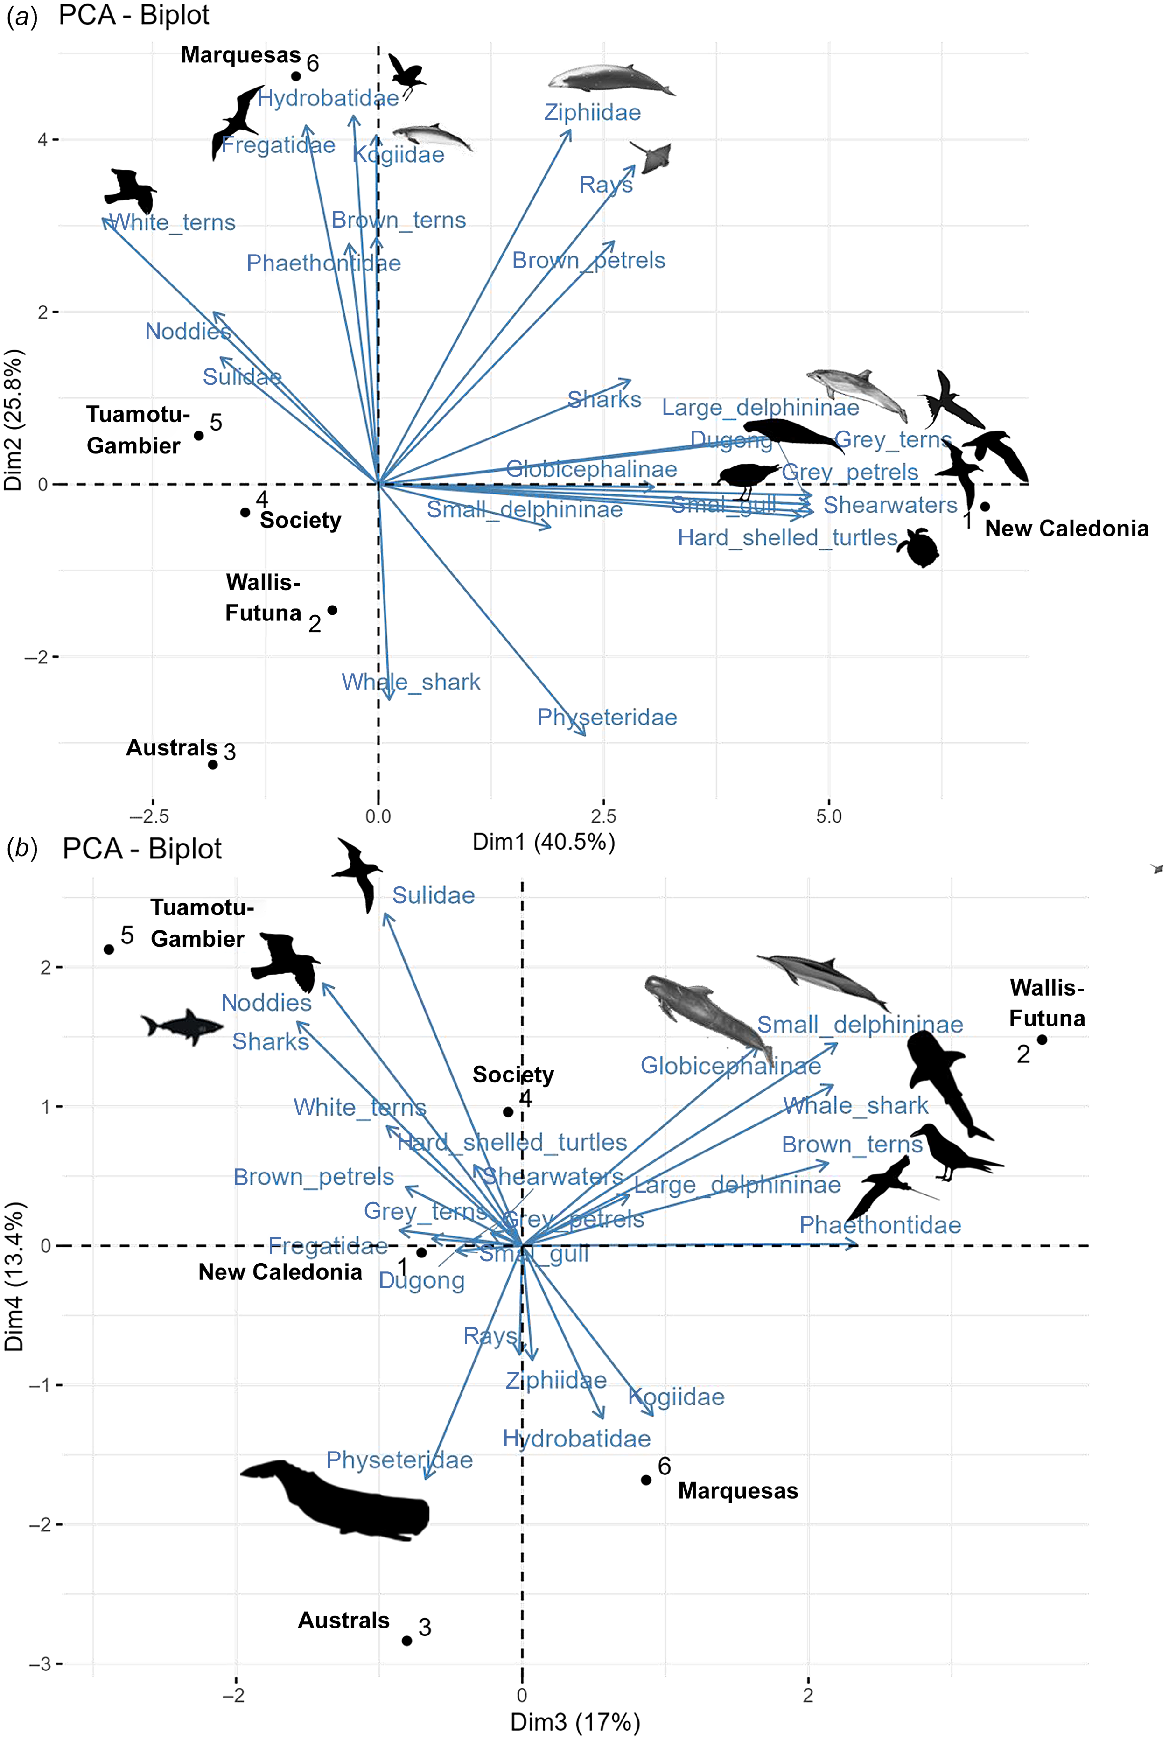
From the PCA conducted over the six survey blocks representing the three subregions and including densities of 22 different vertebrate taxa (seven marine mammal groups, hard-shelled sea turtles, three groups of elasmobranchs and 11 seabird groups), biogeographical provinces were well isolated and the latitudinal gradient was highlighted. PCA axis 1 explained 40% of the variance and discriminated New Caledonia with the dugong, large Delphininae, silver gull, ‘grey’ petrels, shearwaters, ‘grey’ terns and hard-shelled turtles, apart from other subregions (Fig. 8), as visible on the species correlations for the first dimensions of the PCA (Fig. S5). PCA axis 2, discriminated the northern of French Polynesia (Marquesas) from the southern (Austral), accounting for 26% of the variance with higher contribution of Ziphiidae, Kogiidae, Fregatidae, Hydrobatidae and rays associated with Marquesas. The next two following axes explained 17% and 13% of the variance respectively, with association of Wallis and Futuna with small Delphininae, Globicephalinae, whale shark, ‘brown’ tern and Phaethontidae while TUA-GAM were associated with Sulidae, noddies and sharks, contrary to the Austral archipelago associated with Physeteridae.
Result of the first two axes (a) and the third and fourth axes (b) of the Principal Component Analysis obtained with the corrected densities of 22 groups of megafauna over six distinct survey blocks of the three Pacific subregions. Survey blocks discriminate by axes are underlined and associated species (contribution to the PCA dimension greater than 9) are represented by silhouette (from https://www.phylopic.org/).
Discussion
We analysed a series of comprehensive and methodologically homogeneous visual surveys to establish a regional baseline for the distribution and density of marine megafauna across the western and central South Pacific Ocean. The marine mammal diversity increased north-ward and west-ward, while their densities and those of seabirds rose following a south–north gradient through French Polynesia. This study provides the first comparison of marine species assemblages among the three oceanic subregions studied. It discriminates New Caledonia from other subregions that have shown a latitudinal gradient. Multi-taxa data collected during aerial surveys allows the monitoring of marine megafauna, and provides a comprehensive baseline for the conservation of coastal and oceanic waters.
However, the timing of the surveys (aiming to maximise the low-wind period to optimise sighting conditions) had a substantial effect on the observed distribution of migratory species such as baleen whales, which were almost absent in this study, several species of seabirds, sea turtles, or possibly the whale shark. In particular, the latter appears to move between the three major ocean basins (Sequeira et al. 2013). Therefore, our results should be interpreted with caution.
Given the methodological limitations of aerial sampling and correction bias, the main improvement would be to estimate the availability bias from local and species-specific diving patterns and to consider spatial heterogeneity of sighting conditions to account for the perception bias, but this was not possible during our study. General limitations have been discussed previously in the south-western Indian Ocean study (Laran et al. 2017a).
Marine mammals
Interestingly, the corrected abundance estimate (for availability bias only) for dugongs in our study is 660 individuals (CV: 32%), which is consistent with previous estimates from dedicated aerial surveys ranging from 649 to 898 (CV: 30% and 25%, respectively) in November 2011 and 2012 (Cleguer et al. 2017). Given that the sampling design of the REMMOA survey was not dedicated to lagoon habitats and that we applied a coarse availability bias correction, it is likely that using a more refined bias correction, with sighting location and specificity of each protocol could reduce the difference between these results.
Prior to our REMMOA survey, only four marine mammal species were known to occur in the waters around Wallis and Futuna (Doremus et al. 2010; Miller 2023). The present study allowed 13 new species or genera to be added to this list (Table S1). The distribution of this remarkable diversity denotes a widespread use of the EEZ by marine mammals.
Of the 15 odontocete species already reported in the French Polynesia subregion (Reeves et al. 1999; Gannier 2000, 2002, 2004, 2009; Gannier and West 2005; Gannier and Petiau 2006; Oremus et al. 2012), 14 were recorded during the REMMOA aerial surveys in 2011. We recorded some species in archipelagos where they had not been observed before, especially around the Austral and Gambier Archipalago, which were poorly documented before (cf. Table S1). Our standardised survey effort allows for the first time to clearly visualise the strong latitudinal gradient for Delphininae and Globicephalinae, confirming the previously mentioned high diversity of the Marquesas (Gannier 2009). The waters of the Society Archipelago show a high number of individuals per kilometre for marine mammals, and is confirmed by coastal transects carried out around some islands during the REMMOA survey (but not included in the present analyses as overlapping spatially (see Laran et al. 2012) are consistent with previous results (Gannier 2000). Our study emphasises the importance of the Society Archipelago for cetacean conservation, particularly for spinner dolphins or rough-toothed dolphins which show site fidelity between groups and little movement between archipelagos (Oremus et al. 2007, 2012). When considering densities, corrected for availability bias, Kogiidae and Ziphiidae are almost as abundant as Delphininae and Globicephalinae combined in the Marquesas. In addition, juveniles were observed in half of the 13 sperm whale encounters, suggesting the Marquesas Archipelago is a nursing ground.
Seabirds
All three subregions studied in this study include important seabird colonies. However, comparing published figures for breeding populations with the abundances estimated at sea is not straightforward. Indeed, many open-ocean seabird populations include abundant non-breeding segments (immatures and sabbatical adults) that are not bound to colonies and can therefore wander over large stretches of the ocean. As a consequence, seabirds observed at sea in any of the three subregions considered here can be composed of a combination of local breeders foraging at sea, a fraction of local non-breeders foraging in the area surrounding their colony of origin, and a number of non-breeders from other regions of the Pacific and Indian Oceans, keeping in mind that the latter may outnumber the former. Therefore, an exact match between abundance at sea and the size of local colonies cannot be expected. In contrast, past land-based seabird monitoring has been heterogeneous in the three subregions studied, both spatially (uneven geographic coverage) and temporally (intermittent survey efforts). Available data are generally scarce, leaving considerable uncertainty about the distribution, abundance and phenology of breeding seabird species, and limiting the comparability of census data. Therefore, this information on seabirds at sea is less accurate than direct counts at colonies, but is still important because it provides information on major foraging areas and may make it possible to identify areas of increased presence that may correspond to unknown colonies or resting sites.
There are two main limitations in this study. First, the phenology of the species encountered and the short timeframe of the survey. Tropical seabird communities generally host species with both seasonal and aseasonal breeding activity (e.g. Baudat-Franceschi 2011, 2012), therefore observations collected over short periods of time (here 2–4 months) may not reflect the full diversity and/or abundance of breeding species in a given region. Second, in relation to their specific foraging behaviour, with some having both parents travelling short distances multiple times per day (e.g. brown noddy, Anous stolidus; roseate tern, Sterna dougallii) (Maxwell et al. 2016; Pratte et al. 2021), while others have parents that alternately travel away from the colony over several days (e.g. wedge-tailed shearwater, Tahiti petrel; Ravache et al. 2020; Weimerskirch et al. 2020).
The REMMOA surveys covered approximately one-third of the New Caledonian EEZ. Due to practical and logistical constraints, the survey tracks did not include the Chesterfield-Bampton submarine plateau and its archipelago, which supports a large number of breeding seabirds (Spaggiari et al. 2007; Borsa et al. 2022). Observations showed a wide use of the surveyed areas by seabirds, with Procellariidae and Sulidae species mostly found in pelagic waters, according to their known foraging distances (Ravache et al. 2020; Weimerskirch et al. 2020). With the exception of ‘brown’ terns, encounters of terns and noddies were higher near the mainland, probably reflecting their shorter foraging distances. Shearwaters were as expected, the most abundant species group, as the wedge-tailed shearwater, is by far the most abundant species among New Caledonia’s breeding seabirds (0.5–1 million breeding pairs; (Baudat-Franceschi 2006, 2011, 2012; Barré et al. 2011). Short-tailed shearwaters, may have also been observed passing through New Caledonian waters during their seasonal migration, although they do not breed locally (Baudat-Franceschi 2012). ‘Grey’ petrels (mainly Gould’s petrel, and black-winged petrel) were found in slightly higher numbers than expected, with an estimated abundance of 23 000–42 000 individuals compared to an approximate total colony size of 1100–10 100 breeding pairs (Spaggiari et al. 2007). Among the Laridae, the ‘brown’ terns (mainly sooty terns (Onychoprion fuscatus), and a few bridled terns (Onychoprion anaethetus) were the most abundant species group (95% IC: 43 000–160 000 individuals), but their estimates are lower than the estimated population size (~300 000 individuals for the sooty tern, Barré et al. 2011). This is probably due to the absence of Chesterfield Reef from our study area, where 90 000–100 000 breeding pairs of sooty terns are concentrated (Baudat-Franceschi 2011). Sulidae, Fregatidae and noddies show similar discrepancies, while the numbers of ‘grey’ terns (roseate tern, black-naped tern, Sterna sumatrana; fairy tern Sternula nereis; and greater-crested tern, Thalasseus bergii) are close to land-based estimates, as all species breed mostly near the mainland in the areas included in the survey (Baudat-Franceschi 2006, 2012; Berr et al. 2020, 2021, 2022). White terns (here Gygis alba) and Phaethontidae (Phaethon lepturus and Phaethon rubricauda) are the only species for which there are important differences between at-sea observations and land-based counts that cannot be explained by the extent of the surveyed area. Both had much higher numbers in aerial surveys (5000–13 600 and 7500–14 700 individuals, respectively) than in land observations (~1500 and ~2000 suspected breeding pairs respectively; Barré et al. 2011). This discrepancy may reflect the cryptic on-land behaviour of the two species groups (seasonal breeding by isolated pairs in either cliffs or tall trees) and/or foraging by individuals from other locations (Fiji, Vanuatu) in New Caledonian waters.
Published data on seabirds from the Wallis and Futuna archipelago are scarce, as the only reliable monitoring campaigns were conducted in 1985–1986, 2014 and 2018–2019 (Thibault et al. 2014, 2015; Berr and Mathivet 2018; Berr 2019). For species groups except noddies, the abundance estimates derived from the REMMOA surveys are much higher than the land counts. The estimates for noddies (95% IC: 13 500–80 000 individuals) are consistent with surveys conducted in 2018 which reported a colony of 15 000–30 000 breeding pairs on islets north of the Wallis lagoon (Berr and Mathivet 2018). For other species, the estimated at-sea densities suggest that a large number of non-breeding seabirds use the waters of Wallis and Futuna for foraging or pass through them during migration. The frequent observations of shearwaters at sea (95% IC:8900–24 100 individuals) may explain the temporary presence of mixed species nesting on Fiji Islands (Watling 2001), as procellariid species are thought to have been nearly extirpated from all the islands of Wallis and Futuna (Thibault et al. 2014; Berr and Mathivet 2018; Berr 2019).
The geographical extent of French Polynesia (2.5 M km2 EEZ) and the number of islands (>100 main islands and >1000 islets in total) contribute to the scarcity of survey data on most seabird breeding sites (Thibault and Bretagnolle 1999). Therefore, density estimates derived from the REMMOA surveys provide some new information on seabird distribution and abundance. White terns and noddies are the dominant species group among Polynesian seabirds, as they are found at all of our survey blocks, with particularly high densities in the northern Tuamotu archipelago. Sulidae (mainly red-footed, Sula sula and brown boobies, Sula leucogaster) are also abundant in the Tuamotu archipelago, in agreement with previous land-based surveys (Thibault and Bretagnolle 1999). The high abundance of seabirds in the northern Tuamotu and southern Marquesas can be linked to the distribution of their prey: within French Polynesian waters, epipelagic micronekton biomass is highest in these two areas (Bertrand et al. 2002). In contrast, the southern Austral Islands have very few birds compared to the rest of the EEZ, similar to other megafaunal species.
Elasmobranchs
Approximately 50 shark species are known to occur in the waters of New Caledonia, where they inhabit reef-lagoon and open-ocean ecosystems throughout their life cycle (fishbase.org, Boussarie et al. 2018). Previous studies using baited cameras and environmental DNA analyses revealed higher diversity and density of sharks in remote areas, particularly in northern New Caledonia, Chesterfield and d’Entrecasteaux (Bakker et al. 2017; Juhel et al. 2018). The REMMOA surveys highlight a distribution of elasmobranchs throughout the Grande Terre with a clear preference for the west coast. The most common ray species encountered during the flights was the spotted eagle ray (Aetobatus narinari) while among manta rays, the reef species (Mobula alfredi) is dominant in New Caledonia (Lassauce 2021). This corresponds well with the location of sightings inside the lagoon during the survey in New Caledonia, unlike the other two subregions (see https://pelabox.univ-lr.fr/pelagis/PelaObs/ for species distribution).
Knowledge of elasmobranchs in the Wallis and Futuna EEZ is also very limited, but 10 species of sharks and five species of rays inhabit the waters around the islands (Williams et al. 2006). These include several pelagic species such as whale shark, longfin shark (Isurus paucus) and manta ray. Several sightings of devil rays (Mobula spp) were also collected during the survey. In contrast to New Caledonia, no hammerhead sharks (Sphyrna spp) were observed, but 20 whale sharks were detected during transects. Higher encounter rates (of individuals) were estimated around Wallis Island (including the lagoon). Pelagic and migratory species such as whale sharks and Mobula spp were ubiquitous in the oceanic and shallow waters north of the surveyed area. Noting that aerial surveys detect only animals at or near the sea-surface, when all species were combined, nearly 4400 sharks (95% IC: 1400–14 300) and about 900 rays (95% IC: 320–3000) were estimated for the surveyed area (corrected for availability bias only), all species combined. For the endangered whale shark, the encounter rate recorded in the Wallis and Futuna subregion is the highest of all surveyed areas covered by the REMMOA project. This area may represent a favourable zone for juveniles, as most sightings were of small individuals (5 m or less). However, none of our three subregions were highlighted in the global map of whale shark hotspots, revealed by spatial distribution of tracked animals (Womersley et al. 2022).
Since 2006, the entire French Polynesian EEZ has been declared a shark sanctuary for all species (Decree No. 396 of the Environmental Code 28 April 2006 and the mako shark (Isurus spp) since 2012). The sanctuary prohibits fishing and trade in products of all fish belonging to the taxon Elasmobranchii, with the exception of rays (Ward-Paige 2017). Approximately 30 species of elasmobranchs have been reported through citizen science in the Marquesas (Séguigne et al. 2023). The Tuamotu-Gambier survey block has a density of sharks equivalent to New Caledonia, mainly encountered around the Tuamotu Archipelago. Regarding rays, this study highlighted a high density of manta rays in the Marquesas Archipelago, where the oceanic manta ray, and the reef manta ray, co-occur (Carpentier et al. 2019). Despite the protected status, there are concerns about bycatch in fisheries and tourism, including the development of feeding sites (Carpentier et al. 2019).
Sea turtles
In New Caledonia waters, leatherback sea turtle presence had only been mentioned in the Loyalty Archipelago by a telemetry study (Benson et al. 2011), and to our knowledge, the REMMOA survey reported the first sighting within the Grande Terre lagoon. The aerial surveys occurred during the nesting season of the critically endangered North-east Indian Ocean and East Pacific Ocean subpopulations (Petro et al. 2007; Robinson et al. 2014), which may result in underestimation of leatherback turtle presence. The REMMOA survey was conducted at the beginning of the nesting season for green (Chelonia mydas) and loggerhead (Caretta caretta) turtles, which occurs from late October to late March (Read et al. 2013; Fournière et al. 2015; Barbier et al. 2023; Fretey et al. 2023). Both species migrate between foraging and nesting areas as part of their life cycle (Read et al. 2014). There are no estimates for these species in the area to compare with our corrected abundance of 14 600 individuals (95% IC: 10 600–21 200) excluding the Chesterfield and Bellona Reefs, recently identified as major breeding rookeries (Fretey et al. 2023). REMMOA therefore provides a much needed first assessment at sea of the sea turtle community in New Caledonia.
Only the green turtle has been regularly observed in the Wallis and Futuna area, with no mention of nesting sites on the main islands (SPREP 2007) but a rising awareness of potential sites on insular, small and scattered nesting grounds (Berr 2019; B. Bouchard, pers. comm.). Our study complements the knowledge on the distribution of hard-shelled sea turtles in the area. They were mainly encountered found in the Wallis lagoon, and less frequently around Futuna and Alofi (neither of which has a lagoon) or offshore. The presence of the leatherback sea turtle was also attested with two encounters in the north of the study area.
Five species of sea turtles are in French Polynesia waters, green, hawksbill (Eretmochelys imbricata), leatherback, loggerhead and olive ridley turtle (Lepidochelys olivacea). Scientific knowledge on the distribution of sea turtles is limited, the size of the territory and the dispersion of the islands being a major obstacle. The two regularly reported species are: (1) the green turtle, which nests from November to April, with Tetiaroa (included in the Society surveyed block) being the largest known nesting site across the Windward Islands in the Society Archipelago (Petit et al. 2013; Laloë et al. 2020); and (2) and the hawksbill turtle. The flights took place at the end of the green turtle nesting season. Two other important nesting rookeries are monitored and classified as territorial reserves: Scilly and Bellinghausen Atolls (out of the study area). In addition to bycatch threats, destruction of nesting sites, pollution, and predation of hatchlings by dogs, rats or other introduced predators (Gronwald et al. 2019), the consumption of turtle meat is a traditional practice still on going in this subregion (Brikke 2009; Rudrud 2010), while prohibited by the environmental regulations of French Polynesia (arrêté 466 CM of 22 March 2018).
Conservation of marine megafauna
Marine megafaunal species are diverse and charismatic. They provide a source of protein for human populations and/or support regional economies and cultures and are an integral part of biodiversity. These species are valuable as ecological indicators and may play pivotal roles in assessments of marine ecosystem health (Estes et al. 2016). They influence their ecosystems in various way as consumers, prey, detritus sources, and nutrient vectors, and their impacts extend to all species through direct and indirect interactions over large time and space scales from coastal to oceanic food webs, providing top-down effects on marine food webs that can control community stability (Estes et al. 2016). Most megafaunal species are long-lived and slow to reproduce making them particularly vulnerable to all sorts of environmental change, including climate change, whose effects on vertebrates have consequences for marine ecosystem structure and services (Sydeman et al. 2015). Large-scale climate phenomena such as the ENSO, the major year-to-year climate signal on earth involves both the ocean and atmosphere. This variability in oceanographic mechanisms affects ecological and biological processes, and in turn foraging patterns, breeding performance and thus population dynamics of marine top predators (Nowicki et al. 2019). Oceanic and atmospheric conditions in the tropical Pacific fluctuate somewhat irregularly between warm El Niño phases and cold phases called La Niña in which surface waters cool across the tropical Pacific. Among the three subregions, French Polynesia was sampled by the REMMOA survey during a weak to moderate La Niña event, while Wallis and Futuna and New Caledonia were sampled during weak El Niño conditions (2007–2020 ONI values from https://psl.noaa.gov/data/correlation/oni.data; cf. Fig. S6). This difference in general oceano-climatic conditions could have an effect on the distribution of megafauna and on our observations. Long-term datasets are crucial to assess extreme climatic events and potential impacts of climate change, but few are available due to logistical difficulties and financial costs (e.g. Simmonds and Isaac 2007; Bost et al. 2015). In our project, the three subregions were surveyed only once, with no opportunity to test for the effects of extreme climatic events or global change. However, in a context of rapid change in marine ecosystems, our results provide a large-scale baseline, but the need for more regular sampling in the future is critical for monitoring change in the ocean.
There is a trend to establish MPAs based on their marine megafauna, and particularly mammals or seabirds, and to use top predators as ecological indicators or focal species (Hooker and Gerber 2004; Tetley et al. 2022). Knowledge of the distribution and abundance of megafauna is important to better understand and manage the impacts of anthropogenic activities. The ability to monitor progress towards such goals has been constrained by the lack of robust data on MPAs. A multi-species monitoring approach provides an opportunity to collect data on multiple taxa simultaneously, which can improve cost-effectiveness and help to better understand and predict how taxa are likely to respond to or be affected by disturbances. In addition this approach can identify areas where more dedicated surveys would be important in term of the unknown presence of a species, a hot spot or human interactions.
MPAs are increasing in number and size around the world as a tool for pelagic conservation (Game et al. 2009). However, most MPAs have been identified as too small to encompass the complete home ranges of most highly mobile species, as shown by tracking data for five megafaunal taxa (Conners et al. 2022). Our multi-taxa study may also inform future designations. Indeed 30 by 30 worldwide initiative was agreed at the COP15 meeting of the Convention on Biological Diversity (https://www.cbd.int/meetings/COP-15), to designate 30% of Earth’s land and ocean areas as protected by 2030 and there is now a global call to increase the coverage of MPAs. France is a major actor in marine conservation due to its numerous overseas territories scattered across the Oceans, and especially in the three subregions surveyed in our study, which account for 64% of the French EEZ (French Polynesia, 47%; New Caledonia, 14%; Wallis and Futuna, 3%). Nonetheless, according to regulation-based classification system (Horta e Costa et al. 2016), France currently uses a case specific, loose approach to define strong protection, with no criteria for the representativeness of protection across the French Ocean basins (Claudet et al. 2021). Due to their status as overseas local authorities, French Polynesia, New Caledonia and Wallis and Futuna have full authority to manage and protect the environment in their EEZ (Schaffar 2011). A standardised recurring protocol could help to assess some species of marine megafauna (marine mammals, seabirds, sea turtles and large fish) as in the case, for example, in the European the Marine Strategy Framework Directive.
More recently, the Important Marine Mammal Areas (IMMAs) initiative, launched by the Marine Mammal Protected Areas Task Force of the International Union for the Conservation of Nature (Tetley et al. 2022), identifies discrete portions of habitat that are important to one or more marine mammal species, and have the potential to be delineated and managed for conservation. REMMOA surveys have contributed to the designation of several IMMAs, which were identified through a biocentric expert process independent of political and socio-economic pressure or concerns (Notarbartolo di Sciara and Hoyt 2020). Four IMMAs have been identified in New Caledonia, and three in French Polynesia, while the one for Wallis and Futuna is still under revision (www.marinemammalhabitat.org/imma-eatlas/). Similar initiatives are underway for sharks and rays (Important Sharks and Rays Areas, ISRA, https://sharkrayareas.org/) and sea turtles (Important Marine Turtles Areas, IMTA). The aerial multi-taxa protocol used here represents a powerful tool for measuring marine megafauna abundance and potential long-term changes by repeating this protocol on a regular basis.
Data availability
All data collected during those surveys are visible and available on https://pelabox.univ-lr.fr/pelagis/PelaObs/.
Conflicts of interest
No ethics approval was needed, as the research did not involve animal subjects.
Declaration of funding
The Office Français dela Biodiversité (OFB) and the Ministère français en charge de l’Environnement funded the three aerial surveys REMMOA.
Acknowledgements
We thank the French Ministry in charge of the Environment (Ministère français en charge de l’Environnement), in particular the Direction de l’Eau et de la Biodiversité (DEB) and the Office Français de la Biodiversité (OFB), which initiated and financed the project, and particularly Pierre Watremez who put a lot of energy into the REMMOA surveys initiative and Sophie Dorothée Duron for her help in French Polynesia. We also thank the Ministry of the Environment of French Polynesia, the Direction of the Environment of French Polynesia, the Government of New Caledonia, the Environment Departments of the North, South and Loyalty Islands Province, and the Environment Department of Wallis and Futuna. We thank all observers Thomas Auger, Ludwig Blanc, Pauline Bosserelle, Olivier Bossuet, Pamela Carzon, Fabrice Cugny, Cécile Dars, Adèle de Toma, Cécile Gaspar, Sylvie Geoffroy, Olivier Hébert, Bassen Inagaje, Charlotte Lambert, Emmanuelle Levesque, Waia Luepak, Laura Mannocci, Aurélie Monthy-Hermans, Devis Monthy, Morgane Perri, Julie Petit, Guy Pincemin, Michael Poole, Renato Rinaldi, Thierry Sanchez, Richard Sears, Thierry Sommer, Jean-Luc Tison and Auriane Virgili and the organisations: Dolphin and Whale Watching Expedition, Groupe d’Etude des Mammifères Marins, association Evasion Tropicale, Mauritius Marine Conservation Society, Mingan Island Cetacean Study, Opération Cétacés, Pa’e Pa’e No Te Ora, Société Ornithologique de Polynésie Manu, Société Calédonienne d’Ornithologie, Te Mana o te Moana and Waco me Wela, as well as Remi Dodemont, Cécile Gaspar, Marie-Ange Hnaujie and Jean-Emmanuel Rattinacannou. We are indebted to all the flight crew members of Aerosotravia, Unity Airlines and Great Barrier Airlines, coordinated by Jean Philippe Pelletier: Andrew Archies, Bertrand Badie, Noël Barange, Guillaume Bertrand, Benjamin Bokobza, Hubert Chouvenc, Tony Deamer, Gilles Didou, Romain Fert, Alexandre Gahide, Vickie Haining, Kevin Jaillet, John Kerr, Terii Lau, Jérôme Leparc, Jean-Luc Mangin, Laurent Pellicer, Paul Rameau, Augustin Rives, Ben Turner and Sébastien Voillot. Finally, we thank the municipalities of the islands of French Polynesia (Raiatea, Tubuai, Fakarava, Hao, Tureia, Mangareva and Hiva Oa), the customary authorities in New Caledonia (customary areas of Hoot ma Waap, Drehu) and the district of Hahake, Hihifo and Mu’a in Wallis for their welcome, their attentiveness and for the particularly rich exchanges during the customary meetings. Flight permits have been obtained from civil aviation authorities of each surveyed area. We are grateful to the reviewers and the handling editor, whose insightful and helpful comments greatly improved the final version of this manuscript.
References
Albertson GR, Baird RW, Oremus M, Poole MM, Martien KK, Baker CS (2017) Staying close to home? Genetic differentiation of rough-toothed dolphins near oceanic islands in the central Pacific Ocean. Conservation Genetics 18(1), 33-51.
| Crossref | Google Scholar |
Andrzejaczek S, Lucas TCD, Goodman MC, Hussey NE, Armstrong AJ, Carlisle A, Coffey DM, Gleiss AC, Huveneers C, Jacoby DMP, Meekan MG, Mourier J, Peel LR, Abrantes K, Afonso AS, Ajemian MJ, Anderson BN, Anderson SD, Araujo G, Armstrong AO, Bach P, Barnett A, Bennett MB, Bezerra NA, Bonfil R, Boustany AM, Bowlby HD, Branco I, Braun CD, Brooks EJ, Brown J, Burke PJ, Butcher P, Castleton M, Chapple TK, Chateau O, Clarke M, Coelho R, Cortes E, Couturier LIE, Cowley PD, Croll DA, Cuevas JM, Curtis TH, Dagorn L, Dale JJ, Daly R, Dewar H, Doherty PD, Domingo A, Dove ADM, Drew M, Dudgeon CL, Duffy CAJ, Elliott RG, Ellis JR, Erdmann MV, Farrugia TJ, Ferreira LC, Ferretti F, Filmalter JD, Finucci B, Fischer C, Fitzpatrick R, Forget F, Forsberg K, Francis MP, Franks BR, Gallagher AJ, Galvan-Magana F, García ML, Gaston TF, Gillanders BM, Gollock MJ, Green JR, Green S, Griffiths CA, Hammerschlag N, Hasan A, Hawkes LA, Hazin F, Heard M, Hearn A, Hedges KJ, Henderson SM, Holdsworth J, Holland KN, Howey LA, Hueter RE, Humphries NE, Hutchinson M, Jaine FRA, Jorgensen SJ, Kanive PE, Labaja J, Lana FO, Lassauce H, Lipscombe RS, Llewellyn F, Macena BCL, Mambrasar R, McAllister JD, McCully Phillips SR, McGregor F, McMillan MN, McNaughton LM, Mendonça SA, Meyer CG, Meyers M, Mohan JA, Montgomery JC, Mucientes G, Musyl MK, Nasby-Lucas N, Natanson LJ, O’Sullivan JB, Oliveira P, Papastamtiou YP, Patterson TA, Pierce SJ, Queiroz N, Radford CA, Richardson AJ, Richardson AJ, Righton D, Rohner CA, Royer MA, Saunders RA, Schaber M, Schallert RJ, Scholl MC, Seitz AC, Semmens JM, Setyawan E, Shea BD, Shidqi RA, Shillinger GL, Shipley ON, Shivji MS, Sianipar AB, Silva JF, Sims DW, Skomal GB, Sousa LL, Southall EJ, Spaet JLY, Stehfest KM, Stevens G, Stewart JD, Sulikowski JA, Syakurachman I, Thorrold SR, Thums M, Tickler D, Tolloti MT, Townsend KA, Travassos P, Tyminski JP, Vaudo JJ, Veras D, Wantiez L, Weber SB, Wells RJD, Weng KC, Wetherbee BM, Williamson JE, Witt MJ, Wright S, Zilliacus K, Block BA, Curnick DJ (2022) Diving into the vertical dimension of elasmobranch movement ecology. Science Advances 8(33), eabo1754.
| Crossref | Google Scholar |
Bakker J, Wangensteen OS, Chapman DD, Boussarie G, Buddo D, Guttridge TL, Hertler H, Mouillot D, Vigliola L, Mariani S (2017) Environmental DNA reveals tropical shark diversity in contrasting levels of anthropogenic impact. Scientific Reports 7(1), 16886.
| Crossref | Google Scholar | PubMed |
Barbier M, Lafage D, Bourgogne H, Read T, Attard M, Fournière K, et al. (2023) Assessment of the nesting population demography of loggerhead turtles (Caretta caretta) in La Roche Percée: First long-term monitoring in New Caledonia. Aquatic Conservation: Marine and Freshwater Ecosystems 33(6), 579-591.
| Crossref | Google Scholar |
Benson SR, Eguchi T, Foley DG, Forney KA, Bailey H, Hitipeuw C, Samber BP, Tapilatu RF, Rei V, Ramohia P, Pita J, Dutton PH (2011) Large-scale movements and high-use areas of western Pacific leatherback turtles, Dermochelys coriacea. Ecosphere 2(7), 1-27.
| Crossref | Google Scholar |
Berr T, Mathivet M, Perez F, Poitié L, Bouyard T, de Méringo H, Vidal E (2022) Évaluation des enjeux oiseaux marins sur les îlots de la province Sud dans le cadre de la stratégie îlots – Ⓘlots de la Corne Sud. Rapport intermédiaire 2021-2022, Rapport Technique. IRD - Province Sud de Nouvelle-Calédonie. p. 53.
Bertrand A, Bard F-X, Josse E (2002) Tuna food habits related to the micronekton distribution in French Polynesia. Marine Biology 140, 1023-1037.
| Crossref | Google Scholar |
Bonneville CD, Derville S, Luksenburg JA, Oremus M, Garrigue C (2021) Social structure, habitat use and injuries of indo-pacific bottlenose dolphins (Tursiops aduncus) reveal isolated, coastal, and threatened communities in the South Pacific. Frontiers in Marine Science 8, 606975.
| Crossref | Google Scholar |
Borsa P, Philippe A, Le Bouteiller A (2022) Oiseaux marins des atolls d’Entrecasteaux (parc naturel de la mer de Corail): bilan des observations des deux dernières décennies. Bulletin de la Société Zoologique de France 146(4), 175-188 Available at https://archimer.ifremer.fr/doc/00822/93440/.
| Google Scholar |
Bost CA, Cotté C, Terray P, Barbraud C, Bon C, Delord K, Gimenez O, Handrich Y, Naito Y, Guinet C, Weimerskirch H (2015) Large-scale climatic anomalies affect marine predator foraging behaviour and demography. Nature Communications 6(1), 8220.
| Crossref | Google Scholar |
Boussarie G, Bakker J, Wangensteen OS, Mariani S, Bonnin L, Juhel J-B, Kiszka JJ, Kulbicki M, Manel S, Robbins WD, Vigliola L, Mouillot D (2018) Environmental DNA illuminates the dark diversity of sharks. Science Advances 4(5), eaap9661.
| Crossref | Google Scholar |
Carpentier AS, Berthe C, Ender I, Jaine FRA, Mourier J, Stevens G, De Rosemont M, Clua E (2019) Preliminary insights into the population characteristics and distribution of reef (Mobula alfredi) and oceanic (M. birostris) manta rays in French Polynesia. Coral Reefs 38(6), 1197-1210.
| Crossref | Google Scholar |
Caughley G, Sinclair R, Scott-Kemmis D (1976) Experiments in aerial survey. The Journal of Wildlife Management 40, 290-300.
| Crossref | Google Scholar |
Certain G, Bretagnolle V (2008) Monitoring seabirds population in marine ecosystem: the use of strip-transect aerial surveys. Remote Sensing of Environment 112(8), 3314-3322.
| Crossref | Google Scholar |
Claudet J, Loiseau C, Pebayle A (2021) Critical gaps in the protection of the second largest exclusive economic zone in the world. Marine Policy 124, 104379.
| Crossref | Google Scholar |
Cleguer C, Garrigue C, Fuentes MMPB, Everingham Y, Hagihara R, Hamann M, Payri C, Marsh H (2017) Drivers of change in the relative abundance of dugongs in New Caledonia. Wildlife Research 44(4), 365-376.
| Crossref | Google Scholar |
Cleguer C, Garrigue C, Marsh H (2020) Dugong (Dugong dugon) movements and habitat use in a coral reef lagoonal ecosystem. Endangered Species Research 43, 167-181.
| Crossref | Google Scholar |
Conners MG, Sisson NB, Agamboue PD, Atkinson PW, Baylis AMM, Benson SR, Block BA, Bograd SJ, Bordino P, Bowen WD, Brickle P, Bruno IM, González Carman V, Champagne CD, Crocker DE, Costa DP, Dawson TM, Deguchi T, Dewar H, Doherty PD, Eguchi T, Formia A, Godley BJ, Graham RT, Gredzens C, Hart KM, Hawkes LA, Henderson S, Henry RW, III, Hückstädt LA, Irvine LM, Kienle SS, Kuhn CE, Lidgard D, Loredo SA, Mate BR, Metcalfe K, Nzegoue J, Kouerey Oliwina CK, Orben RA, Ozaki K, Parnell R, Pike EP, Robinson PW, Rosenbaum HC, Sato F, Shaffer SA, Shaver DJ, Simmons SE, Smith BJ, Sounguet G-P, Suryan RM, Thompson DR, Tierney M, Tilley D, Young HS, Warwick-Evans V, Weise MJ, Wells RS, Wilkinson BP, Witt MJ, Maxwell SM (2022) Mismatches in scale between highly mobile marine megafauna and marine protected areas. Frontiers in Marine Science 9, 897104.
| Crossref | Google Scholar |
Davis KL, Silverman ED, Sussman AL, Wilson RR, Zipkin EF (2022) Errors in aerial survey count data: identifying pitfalls and solutions. Ecology and Evolution 12(3), e8733.
| Crossref | Google Scholar | PubMed |
Derville S, Torres LG, Dodémont R, Perard V, Garrigue C (2019) From land and sea, long-term data reveal persistent humpback whale (Megaptera novaeangliae) breeding habitat in New Caledonia. Aquatic Conservation: Marine and Freshwater Ecosystems 29(10), 1697-1711.
| Crossref | Google Scholar |
Derville S, Torres LG, Zerbini AN, Oremus M, Garrigue C (2020) Horizontal and vertical movements of humpback whales inform the use of critical pelagic habitats in the western South Pacific. Scientific Reports 10(1), 4871.
| Crossref | Google Scholar | PubMed |
Derville S, Cleguer C, Garrigue C (2022) Ecoregional and temporal dynamics of dugong habitat use in a complex coral reef lagoon ecosystem. Scientific Reports 12(1), 552.
| Crossref | Google Scholar | PubMed |
Doremus G, Perri M, Van Canneyt O, Ridoux V (2010) Echantillonnage visuel des mammifères et oiseaux marins dans la ZEE de Wallis & Futuna sur la campagne FUTUNA. Rapport de campagne de l’Observatoire PELAGIS pour l’Agence des Aires Marines Protégées. p. 22. Avalaible at https://www.observatoire-pelagis.cnrs.fr/wp-content/uploads/2023/11/RAPPORT_CampagneFUTUNA2010.pdf
Dulvy NK, Fowler SL, Musick JA, Cavanagh RD, Kyne PM, Harrison LR, Carlson JK, Davidson LNK, Fordham SV, Francis MP, Pollock CM, Simpfendorfer CA, Burgess GH, Carpenter KE, Compagno LJV, Ebert DA, Gibson C, Heupel MR, Livingstone SR, Sanciangco JC, Stevens JD, Valenti S, White WT (2014) Extinction risk and conservation of the world’s sharks and rays. eLife 3, e00590.
| Crossref | Google Scholar | PubMed |
Estes JA, Heithaus M, McCauley DJ, Rasher DB, Worm B (2016) Megafaunal impacts on structure and function of ocean ecosystems. Annual Review of Environment and Resources 41(1), 83-116.
| Crossref | Google Scholar |
Finlayson KA, van de Merwe JP (2021) Differences in marine megafauna in vitro sensitivity highlights the need for species-specific chemical risk assessments. Aquatic Toxicology 239, 105939.
| Crossref | Google Scholar | PubMed |
Fretey J, Read T, Carron L, Fontfreyde C, Fourdrain A, Kerandel J, Liardet V, Oremus M, Reix-Tronquet M, Girondot M (2023) From terra incognita to hotspot: the largest South Pacific green turtle nesting population in the forgotten reefs of New Caledonia. Oryx 57(5), 626-636.
| Crossref | Google Scholar |
Fuentes MMPB, Bell I, Hagihara R, Hamann M, Hazel J, Huth A, Seminoff JA, Sobtzick S, Marsh H (2015) Improving in-water estimates of marine turtle abundance by adjusting aerial survey counts for perception and availability biases. Journal of Experimental Marine Biology and Ecology 471, 77-83.
| Crossref | Google Scholar |
Game ET, Grantham HS, Hobday AJ, Pressey RL, Lombard AT, Beckley LE, Gjerde K, Bustamante R, Possingham HP, Richardson AJ (2009) Pelagic protected areas: the missing dimension in ocean conservation. Trends in Ecology & Evolution 24(7), 360-369.
| Crossref | Google Scholar | PubMed |
Ganachaud A, Kessler W, Wijffels S, Ridgway K, Cai W, Holbrook N, Bowen M, Sutton P, Qiu B, Timmermann A, Roemmich D, Sprintall J, Cravatte S, Gourdeau L, Aung T (2007) Southwest Pacific Ocean Circulation and Climate Experiment (SPICE) – Part I. Scientific Background. International CLIVAR Project Office, Seattle, WA.
Gannier A (2000) Distribution of cetaceans off the Society Islands (French Polynesia) as obtained from dedicated surveys. Aquatic Mammals 26, 111-126.
| Google Scholar |
Gannier A (2002) Cetaceans of the Marquesas Islands (French Polynesia): distribution and relative abundance as obtained from a small boat dedicated survey. Aquatic Mammals 28, 198-210.
| Google Scholar |
Gannier A (2004) The large-scale distribution of Humpback Whales (Megaptera novaeangliae) wintering in French Polynesia during 1997-2002. Aquatic Mammals 30(2), 227-236.
| Crossref | Google Scholar |
Gannier A (2009) Comparison of odontocete populations of the Marquesas and Society Islands (French Polynesia). Journal of the Marine Biological Association of the United Kingdom 89, 931-941.
| Crossref | Google Scholar |
Gannier A, Petiau E (2006) Environmental variables affecting the residence of spinner dolphins (Stenella longirostris) in a bay of Tahiti (French Polynesia). Aquatic Mammals 32(2), 202-211.
| Crossref | Google Scholar |
Gannier A, West KL (2005) Distribution of the rough-toothed dolphin (Steno bredanensis) around the Windward Islands (French Polynesia). Pacific Science 59, 17-24.
| Crossref | Google Scholar |
Garrigue C, Clapham PJ, Geyer Y, Kennedy AS, Zerbini AN (2015) Satellite tracking reveals novel migratory patterns and the importance of seamounts for endangered South Pacific humpback whales. Royal Society Open Science 2, 150489.
| Crossref | Google Scholar |
Garrigue C, Derville S, Bonneville C, Baker CS, Cheeseman T, Millet L, Paton D, Steel D (2020) Searching for humpback whales in a historical whaling hotspot of the Coral Sea, South Pacific. Endangered Species Research 42, 67-82.
| Crossref | Google Scholar |
Garrigue C, Bonneville C, Cleguer C, Oremus M (2022) Extremely low mtDNA diversity and high genetic differentiation reveal the precarious genetic status of dugongs in New Caledonia, South Pacific. Journal of Heredity 113(5), 516-524.
| Crossref | Google Scholar | PubMed |
Gronwald M, Genet Q, Touron M (2019) Predation on green sea turtle, Chelonia mydas, hatchlings by invasive rats. Pacific Conservation Biology 25(4), 423-424.
| Crossref | Google Scholar |
Hagihara R, Jones RE, Sobtzick S, Cleguer C, Garrigue C, Marsh H (2018) Compensating for geographic variation in detection probability with water depth improves abundance estimates of coastal marine megafauna. PLoS ONE 13(1), e0191476.
| Crossref | Google Scholar | PubMed |
Hammond PS, Macleod K, Berggren P, Borchers DL, Burt L, Cañadas A, Desportes G, Donovan GP, Gilles A, Gillespie D, Gordon J, Hiby L, Kuklik I, Leaper R, Lehnert K, Leopold M, Lovell P, Øien N, Paxton CGM, Ridoux V, Rogan E, Samarra F, Scheidat M, Sequeira M, Siebert U, Skov H, Swift R, Tasker ML, Teilmann J, Van Canneyt O, Vázquez JA (2013) Cetacean abundance and distribution in European Atlantic shelf waters to inform conservation and management. Biological Conservation 164, 107-122.
| Crossref | Google Scholar |
Henkel LA, Ford RG, Tyler WB, Davis JN (2007) Comparison of aerial and boat-based survey methods for Marbled Murrelets Brachyramphus marmoratus and other marine birds. Marine Ornithology 35, 145-151.
| Google Scholar |
Hooker SK, Gerber LR (2004) Marine reserves as a tool for ecosystem-based management: the potential importance of megafauna. BioScience 54, 27-39.
| Crossref | Google Scholar |
Horta e Costa B, Claudet J, Franco G, Erzini K, Caro A, Gonçalves EJ (2016) A regulation-based classification system for Marine Protected Areas (MPAs). Marine Policy 72, 192-198.
| Crossref | Google Scholar |
Juhel J-B, Vigliola L, Mouillot D, Kulbicki M, Letessier TB, Meeuwig JJ, Wantiez L (2018) Reef accessibility impairs the protection of sharks. Journal of Applied Ecology 55(2), 673-683.
| Crossref | Google Scholar |
Kaschner K, Quick NJ, Jewell R, Williams R, Harris CM (2012) Global coverage of cetacean line-transect surveys: status quo, data gaps and future challenges. PLoS ONE 7(9), e44075.
| Crossref | Google Scholar | PubMed |
Laloë J-O, Monsinjon J, Gaspar C, Touron M, Genet Q, Stubbs J, Girondot M, Hays GC (2020) Production of male hatchlings at a remote South Pacific green sea turtle rookery: conservation implications in a female-dominated world. Marine Biology 167(5), 70.
| Crossref | Google Scholar |
Lambert C, Mannocci L, Lehodey P, Ridoux V (2014) Predicting cetacean habitats from their energetic needs and the distribution of their prey in two contrasted tropical regions. PLoS ONE 9(8), e105958.
| Crossref | Google Scholar | PubMed |
Lambert C, Authier M, Dorémus G, Gilles A, Hammond P, Laran S, Ricart A, Ridoux V, Scheidat M, Spitz J, Van Canneyt O (2019) The effect of a multi-target protocol on cetacean detection and abundance estimation in aerial surveys. Royal Society Open Science 6(9), 190296.
| Crossref | Google Scholar | PubMed |
Laran S, Van Canneyt O, Dorémus G, Massart W, Ridoux V, Watremez P (2012) Distribution et abondance de la mégafaune marine en Polynésie française. REMMOA- Polynésie. Rapport final pour l’Agence des Aires Marines Protégées. p. 185. Available at www.observatoire-pelagis.cnrs.fr
Laran S, Authier M, Van Canneyt O, Dorémus G, Watremez P, Ridoux V (2017a) A comprehensive survey of pelagic megafauna: their distribution, densities, and taxonomic richness in the tropical southwest Indian Ocean. Frontiers in Marine Science 4, 139.
| Crossref | Google Scholar |
Laran S, Pettex E, Authier M, Blanck A, David L, Dorémus G, Falchetto H, Monestiez P, Van Canneyt O, Ridoux V (2017b) Seasonal distribution and abundance of cetaceans within French waters- Part I: The North-Western Mediterranean, including the Pelagos sanctuary. Deep Sea Research Part II: Topical Studies in Oceanography 141, 20–30. doi:10.1016/j.dsr2.2016.12.011
Lauriano G, Panigada S, Casale P, Pierantonio N, Donovan GP (2011) Aerial survey abundance estimates of the loggerhead sea turtle Caretta caretta in the Pelagos Sanctuary, northwestern Mediterranean Sea. Marine Ecology Progress Series 437, 291-302.
| Crossref | Google Scholar |
Lefort S, Aumont O, Bopp L, Arsouze T, Gehlen M, Maury O (2015) Spatial and body-size dependent response of marine pelagic communities to projected global climate change. Global Change Biology 21(1), 154-164.
| Crossref | Google Scholar | PubMed |
Lê S, Josse J, Husson F (2008) FactoMineR: an R package for multivariate analysis. Journal of Statistical Software 25(1), 1-18.
| Crossref | Google Scholar |
Mannocci L, Monestiez P, Bolaños-Jiménez J, Dorémus G, Jeremie S, Laran S, Rinaldi R, Van Canneyt O, Ridoux V (2013a) Megavertebrate communities from two contrasting ecosystems in the western tropical Atlantic. Journal of Marine Systems 111–112, 208-222.
| Crossref | Google Scholar |
Mannocci L, Laran S, Monestiez P, Dorémus G, Van Canneyt O, Watremez P, Ridoux V (2013b) Predicting top predator habitats in the South West Indian Ocean. Ecography 36, 1-18.
| Crossref | Google Scholar |
Mannocci L, Catalogna M, Dorémus G, Laran S, Lehodey P, Massart W, Monestiez P, Van Canneyt O, Watremez P, Ridoux V (2014) Predicting cetacean and seabird habitats across a productivity gradient in the South Pacific gyre. Progress in Oceanography 120, 383-398.
| Crossref | Google Scholar |
Martinez E, Maamaatuaiahutapu K (2004) Island mass effect in the Marquesas Islands: time variation. Geophysical Research Letters 31, L18307.
| Crossref | Google Scholar |
Martinez E, Ganachaud A, Lefevre J, Maamaatuaiahutapu K (2009) Central South Pacific thermocline water circulation from a high-resolution ocean model validated against satellite data: seasonal variability and El Niño 1997–1998 influence. Journal of Geophysical Research: Oceans 114(C5), C05012.
| Crossref | Google Scholar |
Maxwell SM, Conners MG, Sisson NB, Dawson TM (2016) Potential benefits and shortcomings of marine protected areas for small seabirds revealed using miniature tags. Frontiers in Marine Science 3, 264.
| Crossref | Google Scholar |
Notarbartolo di Sciara G, Hoyt E (2020) Healing the wounds of marine mammals by protecting their habitat. Ethics in Science and Environmental Politics 20, 15-23.
| Crossref | Google Scholar |
Notarbartolo di Sciara G, Lauriano G, Pierantonio N, Cañadas A, Donovan G, Panigada S (2015) The devil we don’t know: investigating habitat and abundance of endangered giant devil rays in the North-Western Mediterranean Sea. PLoS ONE 10(11), e0141189.
| Crossref | Google Scholar | PubMed |
Nowicki R, Heithaus M, Thomson J, Burkholder D, Gastrich K, Wirsing A (2019) Indirect legacy effects of an extreme climatic event on a marine megafaunal community. Ecological Monographs 89(3), e01365.
| Crossref | Google Scholar |
Oremus M, Poole MM, Steel D, Baker CS (2007) Isolation and interchange among insular spinner dolphin communities in the South Pacific revealed by individual identification and genetic diversity. Marine Ecology Progress Series 336, 275-289.
| Crossref | Google Scholar |
Oremus M, Poole MM, Albertson GR, Baker CS (2012) Pelagic or insular? Genetic differentiation of rough-toothed dolphins in the Society Islands, French Polynesia. Journal of Experimental Marine Biology and Ecology 432–433, 37-46.
| Crossref | Google Scholar |
Petro G, Hickey FR, Mackay K (2007) Leatherback turtles in Vanuatu. Chelonian Conservation and Biology 6(1), 135-137.
| Crossref | Google Scholar |
Pettex E, Laran S, Authier M, Blanck A, Dorémus G, Falchetto H, Lambert C, Monestiez P, Stéfan E, Van Canneyt O, Ridoux V (2017) Using large scale surveys to investigate seasonal variations in seabird distribution and abundance. Part II: the Bay of Biscay and the English Channel. Deep Sea Research Part II: Topical Studies in Oceanography 141, 86-101.
| Crossref | Google Scholar |
Pollock KH, Marsh HD, Lawler IR, Allredge MW (2006) Estimating animal abundance in heterogeneous environments: an application to aerial surveys for dugongs. Journal of Wildlife Management 70(1), 255-262.
| Crossref | Google Scholar |
Pratte I, Ronconi RA, Craik SR, McKnight J (2021) Spatial ecology of endangered roseate terns and foraging habitat suitability around a colony in the western North Atlantic. Endangered Species Research 44, 339-350.
| Crossref | Google Scholar |
Ravache A, Bourgeois K, Weimerskirch H, Pagenaud A, de Grissac S, Miller M, Dromzée S, Lorrain A, Allain V, Bustamante P, Bylemans J, Gleeson D, Letourneur Y, Vidal É (2020) Behavioral and trophic segregations help the Tahiti petrel to cope with the abundance of wedge-tailed shearwater when foraging in oligotrophic tropical waters. Scientific Reports 10(1), 15129.
| Crossref | Google Scholar |
Read T, Booth DT, Limpus CJ (2013) Effect of nest temperature on hatchling phenotype of loggerhead turtles (Caretta caretta) from two South Pacific rookeries, Mon Repos and La Roche Percée. Australian Journal of Zoology 60(6), 402-411.
| Crossref | Google Scholar |
Read TC, Wantiez L, Werry JM, Farman R, Petro G, Limpus CJ (2014) Migrations of green turtles (Chelonia mydas) between nesting and foraging grounds across the Coral Sea. PLoS ONE 9(6), e100083.
| Crossref | Google Scholar | PubMed |
Receveur A, Allain V, Menard F, Lebourges Dhaussy A, Laran S, Ravache A, Bourgeois K, Vidal E, Hare SR, Weimerskirch H, Borsa P, Menkes C (2022) Modelling marine predator habitat using the abundance of its pelagic prey in the tropical South-Western Pacific. Ecosystems 25(4), 757-779.
| Crossref | Google Scholar |
Robinson NJ, Valentine SE, Tomillo PS, Saba VS, Spotila JR, Paladino FV (2014) Multidecadal trends in the nesting phenology of Pacific and Atlantic leatherback turtles are associated with population demography. Endangered Species Research 24(3), 197-206.
| Crossref | Google Scholar |
Rudrud RW (2010) Forbidden sea turtles: traditional laws pertaining to sea turtle consumption in polynesia (Including the Polynesian Outliers). Conservation and Society 8(1), 84-97.
| Crossref | Google Scholar |
Senko JF, Nelms SE, Reavis JL, Witherington B, Godley BJ, Wallace BP (2020) Understanding individual and population-level effects of plastic pollution on marine megafauna. Endangered Species Research 43, 234-252.
| Crossref | Google Scholar |
Sequeira AMM, Mellin C, Meekan MG, Sims DW, Bradshaw CJA (2013) Inferred global connectivity of whale shark Rhincodon typus populations. Journal of Fish Biology 82(2), 367-389.
| Crossref | Google Scholar | PubMed |
Simmonds MP, Isaac SJ (2007) The impacts of climate change on marine mammals: early signs of significant problems. Oryx 41(1), 19-26.
| Crossref | Google Scholar |
Stephenson F, Hamilton ONP, Torres LG, Kozmian-Ledward L, Pinkerton MH, Constantine R (2023) Fine-scale spatial and temporal distribution patterns of large marine predators in a biodiversity hotspot. Diversity and Distributions 29, 804-820.
| Crossref | Google Scholar |
Sydeman WJ, Poloczanska E, Reed TE, Thompson SA (2015) Climate change and marine vertebrates. Science 350(6262), 772-777.
| Crossref | Google Scholar | PubMed |
Séguigne C, Mourier J, Clua É, Buray N, Planes S (2023) Citizen science provides valuable data to evaluate elasmobranch diversity and trends throughout the French Polynesia’s shark sanctuary. PLoS ONE 18(3), e0282837.
| Crossref | Google Scholar | PubMed |
Tetley MJ, Braulik GT, Lanfredi C, Minton G, Panigada S, Politi E, Zanardelli M, Notarbartolo di Sciara G, Hoyt E (2022) The important marine mammal area network: a tool for systematic spatial planning in response to the marine mammal habitat conservation crisis. Frontiers in Marine Science 9, 841789.
| Crossref | Google Scholar |
Thibault J-C, Bretagnolle V (1999) Breeding seabirds of Gambier Islands, eastern Polynesia: numbers and changes during the 20th century. Emu - Austral Ornithology 99, 100-107.
| Crossref | Google Scholar |
Thibault J-C, Cibois A, Meyer J-Y (2015) Birds of Uvea (Wallis), Futuna and Alofi islands (South-West Pacific): an update. Notornis 62(1), 30-37.
| Google Scholar |
Thomas L, Buckland ST, Rexstad EA, Laake JL, Strindberg S, Hedley SL, Bishop JRB, Marques TA, Burnham KP (2010) Distance software: design and analysis of distance sampling surveys for estimating population size. Journal of Applied Ecology 47, 5-14.
| Crossref | Google Scholar | PubMed |
Thomson JA, Cooper AB, Burkholder DA, Heithaus MR, Dill LM (2012) Heterogeneous patterns of availability for detection during visual surveys: spatiotemporal variation in sea turtle dive–surfacing behaviour on a feeding ground. Methods in Ecology and Evolution 3, 378-387.
| Crossref | Google Scholar |
Van Canneyt O, Dorémus G, Falchetto H, Laran S, Ridoux V, Watremez P (2011) Distribution et abondance de la mégafaune marine en Polynésie française. Available at https://www.observatoire-pelagis.cnrs.fr/wp-content/uploads/2021/05/7-RAPPORT_REMMOA_PF_INTER_20110712.pdf
Van Canneyt O, Dorémus G, Laran S, Ridoux V, Watremez P (2015) REMMOA Nouvelle-Calédonie, Wallis et Futuna: Rapport de campagne. Available at https://www.observatoire-pelagis.cnrs.fr/wp-content/uploads/2021/05/9-RAPPORT_REMMOA_SOP_INTER_2015.pdf
van Weelden C, Towers JR, Bosker T (2021) Impacts of climate change on cetacean distribution, habitat and migration. Climate Change Ecology 1, 100009.
| Crossref | Google Scholar |
Ward-Paige CA (2017) A global overview of shark sanctuary regulations and their impact on shark fisheries. Marine Policy 82, 87-97.
| Crossref | Google Scholar |
Weimerskirch H, de Grissac S, Ravache A, Prudor A, Corbeau A, Congdon BC, McDuie F, Bourgeois K, Dromzée S, Butscher J, Menkes C, Allain V, Vidal E, Jaeger A, Borsa P (2020) At-sea movements of wedge-tailed shearwaters during and outside the breeding season from four colonies in New Caledonia. Marine Ecology Progress Series 633, 225-238.
| Crossref | Google Scholar |
Westgate AJ, Koopman HN, Siders ZA, Wong SNP, Ronconi RA (2014) Population density and abundance of basking sharks Cetorhinus maximus in the lower Bay of Fundy, Canada. Endangered Species Research 23(2), 177-185.
| Crossref | Google Scholar |
Williams JT, Wantiez L, Chauvet C, Galzin R, Harmelin-Vivien M, Jobet E, Juncker M, Mou-Tham G, Planes S, Sasal P (2006) Checklist of the shorefishes of Wallis Islands (Wallis and Futuna French Territories, South-Central Pacific). Cybium 30(3), 247-260.
| Google Scholar |
Womersley FC, Humphries NE, Queiroz N, Vedor M, da Costa I, Furtado M, Tyminski JP, Abrantes K, Araujo G, Bach SS, Barnett A, Berumen ML, Bessudo Lion S, Braun CD, Clingham E, Cochran JEM, de la Parra R, Diamant S, Dove ADM, Dudgeon CL, Erdmann MV, Espinoza E, Fitzpatrick R, Cano JG, Green JR, Guzman HM, Hardenstine R, Hasan A, Hazin FHV, Hearn AR, Hueter RE, Jaidah MY, Labaja J, Ladino F, Macena BCL, Morris JJ, Jr., Norman BM, Peñaherrera-Palma C, Pierce SJ, Quintero LM, Ramírez-Macías D, Reynolds SD, Richardson AJ, Robinson DP, Rohner CA, Rowat DRL, Sheaves M, Shivji MS, Sianipar AB, Skomal GB, Soler G, Syakurachman I, Thorrold SR, Webb DH, Wetherbee BM, White TD, Clavelle T, Kroodsma DA, Thums M, Ferreira LC, Meekan MG, Arrowsmith LM, Lester EK, Meyers MM, Peel LR, Sequeira AMM, Eguíluz VM, Duarte CM, Sims DW (2022) Global collision-risk hotspots of marine traffic and the world’s largest fish, the whale shark. Proceedings of the National Academy of Sciences 119(20), e2117440119.
| Crossref | Google Scholar |
Worm B, Barbier EB, Beaumont N, Duffy JE, Folke C, Halpern BS, Jackson JBC, Lotze HK, Micheli F, Palumbi SR, Sala E, Selkoe KA, Stachowicz JJ, Watson R (2006) Impacts of biodiversity loss on ocean ecosystem services. Science 314(5800), 787-790.
| Crossref | Google Scholar | PubMed |