

Impact of increased antiretroviral therapy use during the treatment as prevention era in Australia
Richard T. Gray A *
A *
A The Kirby Institute, UNSW Sydney, Sydney, NSW, Australia.
Sexual Health - https://doi.org/10.1071/SH23088
Submitted: 3 May 2023 Accepted: 2 June 2023 Published online: 3 July 2023
© 2023 The Author(s) (or their employer(s)). Published by CSIRO Publishing. This is an open access article distributed under the Creative Commons Attribution-NonCommercial-NoDerivatives 4.0 International License (CC BY-NC-ND)
Abstract
Background: We analysed the impact of increased antiretroviral therapy (ART) on HIV epidemiology and healthcare costs in Australia during the ‘Treatment-as-prevention’ and ‘Undetectable equals Untransmissible (U=U)’ eras.
Methods: We conducted a retrospective modelling analysis between 2009 and 2019 to calculate the potential impact of early initiation of ART and treatment-as-prevention on HIV among gay and bisexual men (GBM). The model incorporates the change in the proportion diagnosed, treated, and virally suppressed, as well as the scale-up of oral HIV pre-exposure prophylaxis (PrEP) and the change in sexual behaviour during this period. We simulated a baseline and a no ART increase scenario and conducted a costing analysis from a national health provider perspective with cost estimates in 2019 AUD.
Results: Increasing ART use between 2009 and 2019 averted an additional 1624 [95% percentile interval (PI): 1220–2099] new HIV infections. Without the increase in ART, the number of GBM with HIV would have increased from 21 907 (95% PI: 20 753–23 019) to 23 219 (95% PI: 22 008–24 404) by 2019. HIV care and treatment costs for people with HIV increased by $296 (95% PI: $235–367) million AUD (assuming no change in annual healthcare costs). This was offset by a decrease in the lifetime HIV costs (with 3.5% discounting) for those newly infected of $458 (95% PI: $344–592) million AUD, giving a net cost saving of $162 (95%: $68–273) million AUD (and a benefits-to-cost ratio of 1.54).
Conclusions: Increasing the proportion of Australian GBM on effective ART between 2009 and 2019 likely resulted in substantial reductions in new HIV infections and cost savings.
Keywords: antiretroviral therapy, cost-effectiveness, epidemiology, HIV/AIDS, mathematical models, public health, treatment as prevention.
Introduction
Early initiation of effective antiretroviral therapy (ART) among people living with HIV to achieve viral suppression results in long-term disease remission reducing morbidity and mortality.1–4 By the late 2000s, evidence for ART to also reduce HIV transmission with the potential for overall population effectiveness accumulated.5–9 This ‘treatment as prevention’ effect became well-established following several clinical trials that showed high population efficacy (>90%) and the benefits for starting ART as soon as possible after diagnosis.10–14 These results formed the basis for the concept that ‘Undetectable equals Untransmissible’ or U=U.15 Treatment as prevention is now a key prevention strategy and a crucial component for the HIV response internationally and in Australia. It underpins the UNAIDS 95-95-95 HIV cascade targets and the goal of ending AIDS by 2030.16–18
Following the publication of the interim results from the seminal HIV Prevention Trials Network (HPTN) 052 trial in 2011, which estimated that ART reduces the risk of sexual transmission to others by 96%,7 several modelling studies estimated the population-level impact and cost-effectiveness of early initiation of ART and treatment-as-prevention.19–22 These studies generally conducted scenario analyses to project the future impact of ART and showed that early initiation would reduce new HIV infections and associated HIV care and treatment costs, potentially resulting in net savings. For Australia, one study modelled the potential population-level impact of increased testing and treatment.23 Another longitudinal cohort study using routine health record data extracted from health services that provide HIV diagnosis and care to gay and bisexual men (GBM) in the Australian states of New South Wales and Victoria, reported substantial population-level reductions in HIV incidence due to treatment-as-prevention.24 However, we are not aware of any retrospective studies estimating the national population level impact and cost-effectiveness of increasing ART in Australia following changes in guidelines to recommend earlier initiation of ART.
As the evidence for the benefits of the early initiation of ART became apparent, HIV treatment guidelines in Australia changed. In 2007, guidelines started recommending people with HIV begin ART when their CD4 cell count fell <350 cells/μL.25 This treatment threshold changed to <500 cells/μL in 2009. Even though the United States Department of Health and Human Services (DHHS) and other organisations began recommending treatment for all people with HIV in 2012, there was no definitive recommendation in Australian guidelines for all people with HIV to be on treatment until June 2015 after the release of the Strategic Timing of Antiretroviral Therapy (START) trial results.10 Prior to 2015, Australian HIV treatment recommendations provided qualified support for the initiation of ART in all people with HIV, but with a consideration of risks and benefits. Despite these qualifications, it is likely that international guidelines influenced clinician and patient decision-making, meaning changes in treatment initiation at the population level likely occurred prior to 2015.
In this retrospective study, we used a mathematical model to calculate the potential impact of increased ART use during the early initiation and treatment-as-prevention era. We considered the change in ART use, the scale-up of PrEP and the associated changes in sexual behaviour after Australian guidelines first started to recommend the earlier initiation of ART in 2009. We provide estimates of the population-level changes in new HIV infections and the potential costs and benefits of increasing the proportion of people on ART up to 2019 just prior to the start of the coronavirus disease 2019 (COVID-19) pandemic.
Methods
We used a risk equation model to estimate the annual number of new HIV infections among GBM in Australia between 2009 and 2019. The approach expands previous methods for estimating the impact of ART and PrEP on HIV infections.26–28 The period of analysis ranges from prior to the publication of the HPTN 052 clinical trial results in mid-20117 to the start of the COVID-19 pandemic.
We focused on GBM living with HIV because they are the largest group of people with HIV in Australia, and use treatment and with undetectable viral load as a risk-reduction strategy.29 For simplicity, we did not stratify this population by risk behaviours for HIV acquisition prior to infection or transmission to susceptible sexual partners and considered the overall population-level effects of changing HIV treatment coverage, sexual behaviour and primary prevention coverage, and the scale-up of PrEP.
Model equations
To estimate the number of people living with HIV over time, we used the following difference equation:
where Nt is the number of people living with HIV in year t, It is the number of new HIV infections in year t, and is the number of people living with HIV arriving from overseas in year t. Given the relatively slow dynamics of HIV epidemics, this difference equation approach with a yearly time step is appropriate.26–28 We also validated this approach for the HIV epidemiology among Australian GBM (see details below).
To calculate the number of new HIV infections in Australia each year, we derived an equation that incorporates the effects of viral suppression due to treatment, HIV PrEP, and changes in sexual behaviour on transmission. First, we assume the probability for a person with HIV with unsuppressed virus to transmit HIV to another person is fixed over time (denoted by β per person per year). If no one is on effective treatment or PrEP and there is no change in prevention strategies or sexual behaviour, the number of new infections in year t is It = Ntβ. This means β captures all the complex sexual behaviour among the GBM population. This is a similar approach to that taken in previous studies26–28 and is appropriate because the focus of our analysis is on the impact of ART and PrEP rather than interventions aimed at changing sexual behaviour. The effects of changing trends in sexual behaviour (potentially due to ART and PrEP) are incorporated into the model through consistent condom use (see details below).
People with viral suppression through effective ART have a lower probability of transmission given by a factor (1 − ϵART). The concept of undetectable equalling untransmittable or U=U is based on the efficacy of viral suppression, ϵART, being 100%. However, at the population level where there might not be perfect adherence, this efficacy will be high but less than 100%.30 We assumed ϵART equals 95% (range: 90–99%). If in year t, the proportion of people with HIV diagnosed is dt, the proportion diagnosed on ART is θt and the proportion treated with viral suppression is ψt (following the HIV cascade steps), then the overall proportion virally suppressed will be dtθtψt and the value of β will be reduced by a factor (1 − dtθtψtϵART). If a proportion pt of the susceptible population is taking PrEP in year t then there will be a similar reduction in β due to the efficacy of PrEP [ϵPrEP; assumed to be 85% (range: 75–95%)]31 given by (1 − ptϵPrEP).
To consider the effects of changes in sexual behaviour and the impact of other prevention strategies on transmission over time, we incorporated the effect of changing condom use. If condoms are used a proportion c1 of the time in the initial year t = 1 (2009 for our analysis) with an effectiveness of ϵc, but in year t there is a condom usage of ct, then the relative change in transmission on average will be given by the relative factor (1 − ctϵc)/(1 – c1ϵc) for the overall population.
Combining each of these effects for viral suppression, PrEP, and the relative change in condom use gives the following equation for the number of new infections each year:
From initial estimates for N1, I1, and for t = 1 and the parameter inputs, the model iterates over each year using Eqns 1 and 2 to obtain estimates for the number of people with HIV and the annual number of new HIV infections.
Input parameters
The model has three parameters that are fixed over time, ϵART, ϵPrEP, and ϵc. These are all biologically based. We specified a best estimate and a uniform range of values based on empirical data (see Table 1). Most inputs can vary over time and require an estimate for each year between 2009 and 2019 (Table 2).
| Parameter | Description | Estimate and range | Notes |
|---|---|---|---|
| N(0) | Number of GBM living with HIV in 2009 | 14 961 (14 213–15 709) | A |
| HIV transmission parameters | |||
| β | Annual probability an untreated person transmits HIV to another person | Calculated using initial values | B |
| ϵART | Efficacy of ART in preventing HIV transmission if virus is suppressed | 0.95 (0.90–0.99) | C |
| ϵPrEP | Efficacy of PrEP in preventing HIV transmission | 0.85 (0.75–0.95) | D |
| ϵc | Efficacy of condoms in preventing HIV transmission | 0.70 (0.50–0.90) | E |
| HIV treatment costs | |||
| cART | Average annual cost of providing care and ART in 2019 AUD | $17 038 ($11 457–27 325) | F |
| Undiscounted lifetime cost of providing care and ART post infection in 2019 AUD | $436 403 ($293 466–699 883) | G | |
| Lifetime cost of providing care and ART post infection in 2019 AUD discounted 3.5% | $282 093 ($194 198–421 615) | G | |
| Lifetime cost of providing care and ART post infection in 2019 AUD discounted 5% | $240 493 ($166 285–351 252) | G | |
Notes provide justifications for these parameter values. The simulations used for the calculations take samples from these ranges assuming a uniform distribution.
AEstimates for the number of GBM with HIV over 2009–2019 were obtained using the HIV cascade methodology used for national surveillance.17 The 2009 estimate was used as the initial conditions for the model calculations with the following remaining estimates used for validation (see Table 2).
BThis value was calculated using Eqn 2, the fixed input parameters, the time-varying parameter values for the year 2009, and the initial values of people with HIV and the number of notifications (excluding those previously diagnosed overseas) reported in national surveillance.17 This value was then held constant over the calculation period.
CThe efficacy of ART is based on clinical trial results.10–14
DThe efficacy of HIV PrEP is based on the results from the PRe-exposure Option for reducing HIV in the UK: an open-label randomisation to immediate or Deferred daily Truvada for HIV negative gay men (PROUD) study.31
EThe efficacy of condoms is based on the efficacy for consistent condom use reported by Smith et al.32
FThe estimated annual cost of providing care and treatment to people with HIV in 2019 was obtained by taking the 10-year undiscounted cost reported in the study by Lim et al.33 and dividing by 10 to produce a yearly cost.
GThe lifetime HIV costs for each discounting rate were obtained from the study by Lim et al.33
| 2009 | 2010 | 2011 | 2012 | 2013 | 2014 | 2015 | 2016 | 2017 | 2018 | 2019 | Uncertainty (%) | Notes | |
|---|---|---|---|---|---|---|---|---|---|---|---|---|---|
| People living with HIV | 14 961 | 15 567 | 16 247 | 17 022 | 17 687 | 18 424 | 19 207 | 19 878 | 20 459 | 20 952 | 21 404 | ±5 | A |
| Proportion diagnosed | 0.888 | 0.893 | 0.893 | 0.893 | 0.894 | 0.894 | 0.895 | 0.896 | 0.898 | 0.903 | 0.910 | ±5 | A |
| Proportion diagnosed on ART | 0.670 | 0.700 | 0.720 | 0.780 | 0.760 | 0.840 | 0.870 | 0.890 | 0.920 | 0.900 | 0.900 | ±5 | B |
| Proportion virally suppressed | 0.835 | 0.863 | 0.879 | 0.903 | 0.933 | 0.943 | 0.952 | 0.951 | 0.971 | 0.975 | 0.975 | ±5 | C |
| Proportion on PrEP | 0 | 0 | 0 | 0 | 0 | 0.028 | 0.064 | 0.240 | 0.106 | 0.147 | 0.210 | ±10 | D |
| Consistent condom use (proportion) | 0.451 | 0.451 | 0.450 | 0.451 | 0.443 | 0.446 | 0.421 | 0.398 | 0.302 | 0.263 | 0.229 | ±10 | E |
| Number diagnosed previously overseas | 109 | 125 | 131 | 153 | 154 | 166 | 151 | 145 | 200 | 214 | 214 | 0 | F |
| Number diagnosed in Australia | 636 | 611 | 720 | 778 | 727 | 807 | 752 | 765 | 664 | 576 | 598 | ±10 | F |
| Inflation index | 1.021 | 1.028 | 1.030 | 1.022 | 1.027 | 1.017 | 1.017 | 1.015 | 1.019 | 1.018 | 1.018 | 0 | G |
These parameters are estimated separately for input into the model with an estimated value each year and an uncertainty range obtained using an assumed multiplicative factor. The uncertainty specifies the range of the multiplicative factor used to generate the uncertainty estimates over time. The notes provide references and justifications. The values for people living with HIV and diagnoses after 2009 are not used in the calculations, instead they are used for validation.
AEstimates for the number of GBM with HIV over 2009–2019 and the proportion diagnosed were estimated using the methodology for producing the Australian HIV cascade for national surveillance.17
BThe proportion of diagnosed GBM taking ART was obtained from Gay Community Periodic Survey (GCPS) results reported in the Annual Trends in Behaviour report.34
CThe proportion of GBM taking ART with suppressed virus was estimated using data from the Australian Observational HIV Database (AHOD) for GBM.35 These are the same data used for viral suppression in the Australian HIV cascade.
DThe proportion of GBM taking HIV PrEP was assumed to be zero before 2014. After 2014, we used the proportion eligible for PrEP multiplied by the proportion eligible taking PrEP, as reported in the Annual Trends in Behaviour report.34
EThe proportion of GBM using condoms was given by the proportion reporting consistent condom use in the Annual Trends in Behaviour report and Holt et al.34,36
FThe number of notifications for HIV in Australia as reported in national surveillance was assumed to equal the number of diagnoses each year.17 The notifications were split into those for people previously diagnosed overseas and those for people first diagnosed in Australia.
GThe inflation index is the annual consumer price index (CPI) reported by the Australian Bureau of Statistics represented as a multiplicative factor.37
Annual estimates for each step of the HIV cascade for GBM were obtained using methods developed for national surveillance.17 The methods to estimate the annual proportion diagnosed have been detailed previously with the code available online.38 For the treatment and suppression steps, we followed a previous approach to estimating the HIV cascade for GBM.39 To estimate the number of GBM taking ART, we used the reported percentage on treatment from the Australian Trends in Behaviour Reports, which collates data from Gay Community Periodic Surveys across Australia.34 Defining viral suppression to be <200 copies/mL, data from the Australian HIV Observational Database (AHOD) was used to estimate the proportion virally suppressed.35 The resulting proportions for each cascade step are shown in Table 2. The Australian Trends in Behaviour Reports also provided data for the coverage of PrEP in the overall GBM population.34 We estimated PrEP use by multiplying the reported proportion eligible for PrEP by the proportion who take PrEP. We assumed PrEP coverage was zero prior to 2014 (see Table 2). To estimate condom use, we used data for consistent condom use from the Australian Trends in Behaviour Report.34 The trends in this indicator are likely consistent with the proportion of sexual acts where a condom is used, even if it does not measure this directly. As the model uses a ratio to incorporate condom use over time, consistent condom use provides a suitable measure for the relative change in condom use. The resulting estimates are presented in Table 2. Finally, the number of overseas born people living with HIV entering Australia each year ( in Eqn 1) was set to equal the annual number of notifications of people previously diagnosed overseas.17
To reflect the uncertainty in the model parameters and estimates, we generated 1000 sets of parameter values to run in the model using random sampling. For each fixed parameter, we uniformly sampled 1000 parameter values from the ranges specified in Table 1. We produced uncertainty ranges for the time-varying input parameters using a multiplicative factor for each year. The multiplicative factors were generated by sampling a value for the factor for the start and end years of the period separately from an assumed range and then extrapolating across the middle years linearly. The resulting vector of multiplicative values was then applied to the corresponding time-varying parameter values to produce the values for the corresponding set of parameters (Table 2).
To run the calculations using Eqns 1 and 2 requires an initial estimate for N1 and I1 and the value of corresponding to the year 2009. We set N1 to equal the estimated number of people with HIV in 2009 from the Australian HIV cascade.17 To initialise new infections, I1, we used the reported number of notifications of HIV excluding those previously diagnosed overseas in 2009.17 Although notifications lag new infections and depend on testing, they are a reasonable indicator for new infections for Australian GBM due to high testing rates in this population.40 The estimates of people living with HIV and the reported notifications excluding those previously diagnosed overseas after 2009 (in Table 2) were used for model validation.
HIV treatment costs
We estimated the annual unit cost of providing HIV care and treatment to GBM separately for input into the model calculations. A recent study by Lim et al. estimates the lifetime cost of providing HIV care and treatment from a health provider perspective in 2019 Australian dollars (AUD).33 The estimated cost varied from an undiscounted cost of $436 403 (range: $293 466–699 883) to $240 493 (range: $166 285–351 252) with 5% discounting. The Lim et al. study also estimated the short- to medium-term cost, which we used to estimate the annual cost by dividing the undiscounted 10-year costing by 10. This resulted in an estimated annual cost of $17 038 (range: $11 457–27 325) (see Table 1).
To estimate retrospective costs prior to 2019 is challenging due to several factors. The change in HIV costs are not solely driven by inflation, and simply applying the recorded consumer price index (CPI) to back date the 2019 costs is inappropriate because that assumes everything remains the same as it was in 2019. Since 2009, there have been substantial changes to treatment guidelines for HIV in Australia as new drugs and formulations became available with demonstrated superiority over older regimens in clinical trials.35 For example, there has been a marked decline in the use of non-nucleoside reverse transcriptase inhibitors and an increase in integrate inhibitors to reduce the development of drug resistance.17 The proportion of people taking first, second, and higher lines of ART also changes as people age and potentially develop other morbidities or drug resistance. Finally, individual drug prices change due to market forces and with the availability of generic versions as patents expire.
The main contributor to HIV costs in Australia are drug costs.33 To estimate the potential change in costs, we first reviewed previous estimates for HIV care and treatment costs in Australia.41,42 The estimated costs for each line of ART compared to the Lim et al. analysis are shown in the Supplementary Table S1. Since 2013, the cost of first-line therapy has remained relatively constant, whereas higher lines of ART have fallen in price.
To assess changes in price between 2009 and 2013, we reviewed data from the Australian Statistics of Medicine reports, which are available up to 2015.43 These reports provide the total cost and the number of packs (between 2009 and 2011) or scripts dispensed (between 2012 and 2015) of individual drugs. The change in reporting from packs to scripts made it difficult to determine any trend in price between 2009 and 2015. Looking at key drugs that formed part of ART regimens showed varying trends, with some remaining at a similar price whereas others increased or decreased over the 2009–2011 and 2012–2015 periods.
Given the unclear data for ART drug costs, we considered several inflationary and deflationary scenarios for the change in annual unit costs between 2009 and 2019. For the base case, we assumed there was no change in costs between 2009 and 2019 (no inflation scenario). The other scenarios were based on the geometric mean of the annual CPI inflation rates between 2009 and 2019 obtained from the Australian Bureau of Statistics.37 This mean inflation rate, IR, was used as a base factor to define the costing scenarios. Two of these scenarios were inflationary with the cost of HIV care and treatment between 2009 and 2019 increasing annually at IR (Inflation 1 scenario) and 2 × IR (Inflation 2 scenario), and two scenarios were deflationary with the annual HIV costs decreasing by IR (Deflation 1 scenario) and 2 × IR (Deflation 2 scenario). Using the specified annual inflation/deflation rates, we were then able to adjust the lifetime and annual costs in 2019 AUD to obtain costs for each year from 2009 to 2018.
For each costing scenario, we calculated the total cost of providing ART by multiplying the number on treatment from the model calculations by the annual care and treatment cost for that year. Similarly, the lifetime costs for people newly infected with HIV were obtained by multiplying the number of new infections estimated in the model each year by the associated annual lifetime cost for that year.
Calculation scenarios
To estimate the potential impact and costs associated with increased ART during the treatment-as-prevention era, we simulated two scenarios using Eqns 1 and 2. The first scenario represents the retrospective baseline scenario where the proportion of people diagnosed with HIV on ART matches the reported estimates for 2009–2019. The second or counter-factual scenario assumes ART coverage among the diagnosed population, θt, did not change after 2011, the year after the landmark HPTN 052 study was published and the year prior to the US DHHS recommendation that all people living with HIV initiate ART irrespective of their CD4 count. Although the Australian guidelines did not fully adapt the US DHHS recommendation, it was influential on clinical practice and there were recommendations to consider ART for all people with HIV including those with CD4 counts >500 cells/μL from 2013. In 2011, the estimated percentage of all diagnosed GBM on ART was 72.0% (Table 2). In our counterfactual scenario, we assumed this percentage was fixed from 2011 to 2019.
Model outputs
Results were obtained for the best estimate inputs and from summary statistics for all simulations. Total costs are in 2019 AUD rounded to the nearest A$1 million. All analyses and results were generated using R: A langauge and environment for statistical computing ver. 4.2.2 (https://www.R-project.org/) with a reproducible code available in an open access repository along with input parameters and the results.44
Results
The model estimates under the baseline scenario that the number of people living with HIV in 2019 was 21 907 [95% percentile interval (PI): 20 753–23 019] with 430 (95% PI: 266–621) new infections. This closely aligns with estimates from the Australian HIV cascade calculations, which estimated there were 21 400 (range: 18 520–24 440) people living with HIV in 2019.17 The number of new infections estimated was lower, but comparable to the number of new notifications excluding those previously diagnosed overseas between 2009 and 2019 (see Supplementary Fig. S1). In contrast, the estimated number of new infections was higher than estimates from the Treatment with Antiretroviral and their Impact on Positive and Negative Men (TAIPAN) study (with data from health services that provide HIV diagnosis and care to GBM in New South Wales and Victoria).24 These results show our model has good validity for estimating the number of people taking ART and the number of new infections over the analysis period.
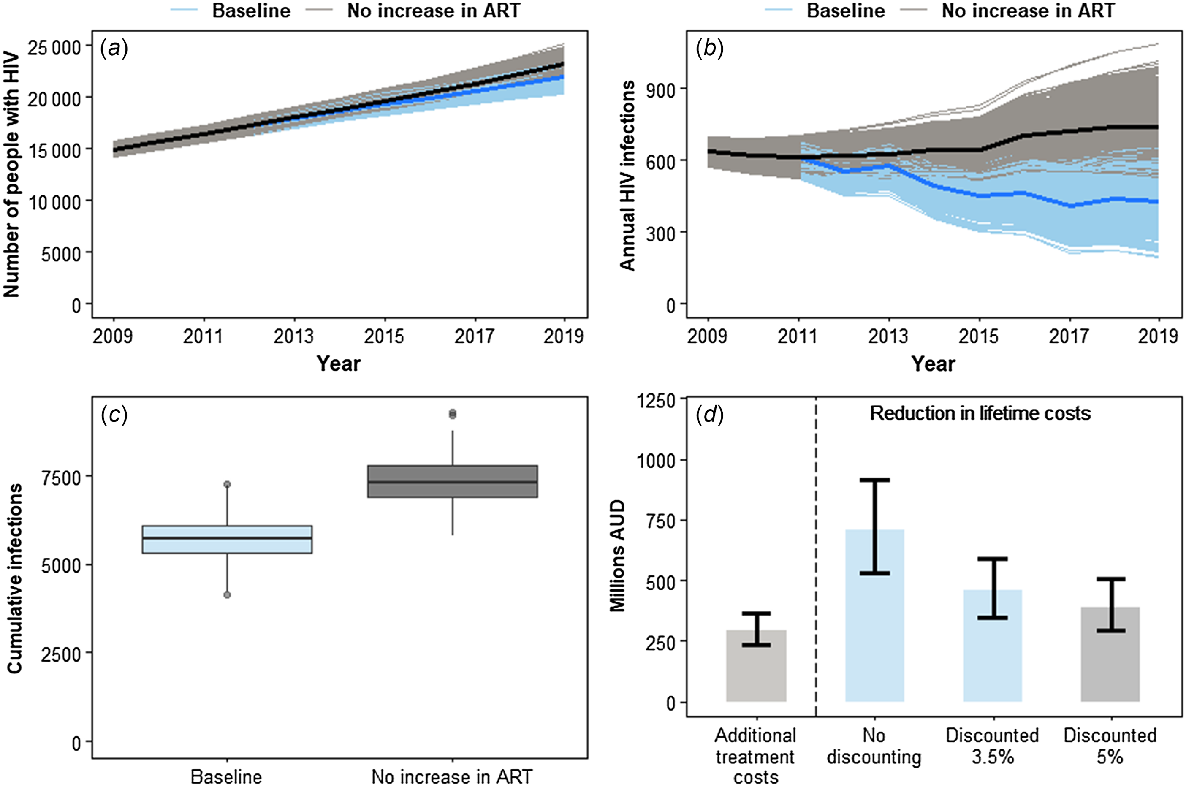
If there was no increase in ART since 2011 (the counter factual scenario), the model estimates there would have been 23 219 (95% PI: 22 008–24 404) people living with HIV in 2019 (Fig. 1a) and 741 (95% PI: 580–953) new HIV infections (Fig. 1b). These are 5.99% and 72.50% higher, respectively, than for the baseline scenario. Cumulatively, we estimated there were 5696 (95% PI: 4725–6818) and 7320 (95% PI: 6289–8535) new HIV infections for the baseline and counter factual scenarios, respectively, between 2009 and 2019 (Fig. 1c). This implies the increase in ART coverage since the start of the early initiation and treatment-as-prevention era could have averted an additional 1624 (95% PI: 1220–2099) new HIV infections (see Table 3).
Summary results from the baseline and no ART increase scenarios. (a) Number of people living with HIV over 2009–2019. (b) Annual number of new infections of HIV over 2009–2019. (c) Distribution of the total number of infections during the 2009–2019 period. (d) Median and 95% percentile range from across all simulations for the additional costs in providing ART compared to the no ART increase scenario and the reduction in lifetime care and treatment costs.
| Indicator | No ART increase scenario | Baseline scenario |
|---|---|---|
| People living with HIV in 2019 | 23 219 (22 008–24 404) | 21 907 (20 753–23 019) |
| New infections in 2019 | 741 (580–953) | 430 (266–621) |
| Cumulative infections | 7320 (6289–8535) | 5696 (4725–6818) |
| Infections averted | NA | 1624 (1220–2099) |
| Total treatment costs (no inflation) | $2271 ($2098–2452) million | $2568 ($2389–2756) million |
| Additional treatment costs (no inflation) | NA | $296 ($235–367) |
| Lifetime HIV care and treatment costs (discounted 3.5%, no inflation) | $2065 ($1774–2408) million | $1607 ($1333–1923) million |
| Reduction in lifetime HIV costs (discounted 3.5%, no inflation) | NA | $458 ($344–592) million |
| Benefits-to-cost ratio | NA | 1.54 (1.22–1.95) |
The range in brackets is the 95% percentile interval. Costs are rounded to the nearest million and are in 2019 AUD.
NA, not applicable.
If the cost of care and treatment did not change between 2009 and 2019, then the total HIV healthcare cost is estimated to be $2568 (95% PI: $2389–2756) million AUD for the baseline scenario and $2271 (95% PI: $2098–2452) million AUD for the counterfactual scenario. This means the increase in ART between 2009 and 2019 resulted in an estimated increase of $296 (95% PI: $235–367) million AUD in the cost of providing care and treatment. The corresponding HIV lifetime costs (assuming 3.5% discounting), however, would increase from $1607 (95% PI: $1333–1923) million AUD for the baseline scenario to $2065 (95% PI: $1774–2408) million AUD for the no increase in ART scenario. This is an increase of $458 (95% PI: $344–592) million AUD, an overall reduction in lifetime costs greater than the increase in HIV healthcare costs over this period giving a total cost saving of $162 (95% PI: $68–273) million AUD and a benefits-to-cost ratio of 1.54 (95% PI: 1.22–1.95). This means for every additional AUD spent on HIV care and treatment, there is a $1.54 AUD saving in HIV lifetime costs. Such a cost saving was achieved for each discounting scenario (see Fig. 1d) and for each inflationary and deflationary scenario, as shown in Table 4. Even when the greatest HIV healthcare cost and the lowest HIV lifetime cost in Table 4 are compared, there is still a cost saving [though the benefits-to-cost ratio = 1.06 (95% PI: 0.84–1.34) has an uncertainty range that includes 1].
| Cost indicator | Deflation scenario 2 | Deflation scenario 1 | No inflation | Inflation scenario 1 | Inflation scenario 2 |
|---|---|---|---|---|---|
| Additional treatment costs | $334 ($267–412) | $314 ($250–389) | $296 ($235–367) | $280 ($222–348) | $266 ($210–331) |
| Reduction in lifetime HIV costs (no discounting) | $789 ($597–1016) | $746 ($563–963) | $709 ($533–916) | $674 ($506–873) | $643 ($482–834) |
| Benefits-to-cost ratio (no discounting) | 2.36 (1.87–2.96) | 2.37 (1.88–2.99) | 2.39 (1.89–3.01) | 2.40 (1.90–3.04) | 2.42 (1.91–3.06) |
| Reduction in lifetime HIV costs (3.5% discounting) | $510 ($386–657) | $483 ($364–623) | $458 ($344–592) | $436 ($327–564) | $416 ($311–539) |
| Benefits-to-cost ratio (3.5% discounting) | 1.53 (1.21–1.92) | 1.54 (1.22–1.93) | 1.54 (1.22–1.95) | 1.55 (1.23–1.96) | 1.56 (1.23–1.98) |
| Reduction in lifetime HIV costs (5% discounting) | $435 ($329–560) | $411 ($310–531) | $390 ($293–505) | $372 ($279–481) | $355 ($265–460) |
| Benefits-to-cost ratio (5% discounting) | 1.30 (1.03–1.63) | 1.31 (1.04–1.65) | 1.32 (1.04–1.66) | 1.32 (1.05–1.67) | 1.33 (1.05–1.69) |
The range in brackets is the 95% percentile interval.
Discussion
We estimated the potential impact of increased ART use among GBM in Australia between 2009 and 2019 on the number of new infections and HIV-related healthcare costs. Using a simple HIV transmission model incorporating the effects of ART, PrEP, and changes in sexual behaviour, we showed that increasing ART use during the period when early initiation of treatment and treatment-as-prevention became established could have averted a substantial number of new infections and be cost saving.
Although the cost-effectiveness of treatment-as-prevention has been evaluated in previous studies, we believe this is the first costing analysis done for Australia. The results from previous studies were generally obtained from future projections simulated by a model or were trial based.19–23 In contrast, we conducted a retrospective analysis comparing the results from a baseline scenario, which incorporated data on the actual changes in prevention and treatment since 2009 to a counterfactual scenario where the proportion of people with HIV using ART did not increase. This is an advantage as all the impacts and changes seen in the epidemiology, population demographics, and behaviour since 2009 can be incorporated into the analysis. Conversely, there is no way of knowing exactly what would have happened without this increase in ART, and the counterfactual scenario is based on several assumptions, including that the impacts estimated by the model are due to this increase in ART rather than something else. Nevertheless, our results are consistent with previous cost-effectiveness analyses of early initiation of ART and treatment-as-prevention, which showed that it is very cost-effective to cost saving (depending on the context and assumptions used), providing confirmation of those results and showing the benefits to Australia.
Given the simplicity of our analysis, some caution is required when interpreting our results. Several assumptions were used to simplify the calculations. For example, consistent condom use was used as a proxy for changes in sexual risk behaviour rather than incorporating the full range of risk-reduction strategies GBM use against HIV infection. However, our model validation showed the number of people living with HIV overall was accurately reflected by the calculations, suggesting the annual increase in the number of people with HIV was approximated well. We only conducted the calculations for Australian GBM because there is substantial data available for this population and GBM are the population most affected by HIV in Australia. Our analysis could easily be expanded to include other populations if data were available. In all likelihood, including other populations would not change the conclusions of our results and only change the magnitude of the costs and benefits. The specifications of the counterfactual scenario where there was no increase in the ART proportion since 2011 could also affect the results. Varying when the change occurred or incorporating the trends in this proportion prior to 2011 would result in different outcomes for new infections, healthcare costs and lifetime care and treatment costs. However, the differences from the baseline scenario for each of these scenarios would scale proportionally, meaning there would be little change to the overall conclusions of the analyses. The main limitation is the lack of accurate retrospective cost data for ART and how these costs have changed since 2009. We conducted a scenario analysis to cover the potential changes in treatment costs for those living with HIV between 2009 and 2019 and lifetime healthcare costs for those newly infected during this period. Even if we take the most expensive treatment cost scenario and the least expensive lifetime cost scenario, the increase in ART would still be cost saving or at least cost neutral (see Fig. 1d and Table 4). A more detailed and comprehensive modelling and costing analysis would change the estimates, but is unlikely to change the overall conclusion that the increase in the cost of providing care and treatment is negated by the reduction in lifetime HIV costs.
Our results confirm the overall population level benefits of initiating ART and achieving viral suppression as soon as possible after infection. Achieving high ART coverage among all populations affected by HIV is key to maximising the benefits of U=U and would be cost saving. It will be important to ensure continued access to HIV treatment during the COVID-19 era. The use of injectable and long-acting antiretroviral drugs,45 which are now becoming available, will likely enhance access to ART, though the overall healthcare cost implications in Australia will need to be assessed.
Data availability
All input parameters, modelling code and results are available in an open access repository under an open access MIT license.44
Acknowledgements
We thank Dr Jason Ong, Dr Sophy Shih, and Dr Caroline Watts for useful discussions regarding healthcare costs.
References
1 Bor J, Herbst AJ, Newell M-L, Barnighausen T. Increases in adult life expectancy in rural South Africa: valuing the scale-up of HIV treatment. Science 2013; 339: 961-5.
| Crossref | Google Scholar |
2 Brinkhof MWG, Boulle A, Weigel R, et al. Mortality of HIV-infected patients starting antiretroviral therapy in sub-Saharan Africa: comparison with HIV-unrelated mortality. PLoS Med 2009; 6: e1000066.
| Crossref | Google Scholar |
3 Egger M, May M, Chêne G, et al. Prognosis of HIV-1-infected patients starting highly active antiretroviral therapy: a collaborative analysis of prospective studies. Lancet 2002; 360: 119-29.
| Crossref | Google Scholar |
4 May M, Boulle A, Phiri S, et al. Prognosis of patients with HIV-1 infection starting antiretroviral therapy in sub-Saharan Africa: a collaborative analysis of scale-up programmes. Lancet 2010; 376: 449-57.
| Crossref | Google Scholar |
5 Attia S, Egger M, Müller M, Zwahlen M, Low N. Sexual transmission of HIV according to viral load and antiretroviral therapy: systematic review and meta-analysis. AIDS 2009; 23: 1397-404.
| Crossref | Google Scholar |
6 Donnell D, Baeten JM, Kiarie J, et al. Heterosexual HIV-1 transmission after initiation of antiretroviral therapy: a prospective cohort analysis. Lancet 2010; 375: 2092-8.
| Crossref | Google Scholar |
7 Cohen MS, Chen YQ, McCauley M, et al. Prevention of HIV-1 infection with early antiretroviral therapy. N Engl J Med 2011; 365: 493-505.
| Crossref | Google Scholar |
8 Granich RM, Gilks CF, Dye C, De cock KM, Williams BG. Universal voluntary HIV testing with immediate antiretroviral therapy as a strategy for elimination of HIV transmission: a mathematical model. Lancet 2009; 373: 48-57.
| Crossref | Google Scholar |
9 Wilson DP, Law MG, Grulich AE, Cooper DA, Kaldor JM. Relation between HIV viral load and infectiousness: a model-based analysis. Lancet 2008; 372: 314-20.
| Crossref | Google Scholar |
10 The INSIGHT START Study Group. Initiation of antiretroviral therapy in early asymptomatic HIV infection. N Engl J Med 2015; 373: 795-807.
| Crossref | Google Scholar |
11 The TEMPRANO ANRS 12136 Study Group. A trial of early antiretrovirals and isoniazid preventive therapy in Africa. N Engl J Med 2015; 373: 808-22.
| Crossref | Google Scholar |
12 Koenig SP, Dorvil N, Dévieux JG, et al. Same-day HIV testing with initiation of antiretroviral therapy versus standard care for persons living with HIV: a randomized unblinded trial. PLoS Med 2017; 14: e1002357.
| Crossref | Google Scholar |
13 Rosen S, Maskew M, Fox MP, et al. Initiating antiretroviral therapy for HIV at a patient’s first clinic visit: the RapIT randomized controlled trial. PLoS Med 2016; 13: e1002015.
| Crossref | Google Scholar |
14 Pilcher CD, Ospina-Norvell C, Dasgupta A, et al. The effect of same-day observed initiation of antiretroviral therapy on HIV viral load and treatment outcomes in a U.S. public health setting. J Acquir Immune Defic Syndr 2017; 74: 44-51.
| Crossref | Google Scholar |
15 The Lancet HIV. U=U taking off in 2017. Lancet HIV 2017; 4: e475.
| Crossref | Google Scholar |
19 Granich R, Kahn JG, Bennett R, et al. Expanding ART for treatment and prevention of HIV in South Africa: estimated cost and cost-effectiveness 2011–2050. PLoS ONE 2012; 7: e30216.
| Crossref | Google Scholar |
20 Kahn JG, Marseille EA, Bennett R, Williams BG, Granich R. Cost-effectiveness of antiretroviral therapy for prevention. Curr HIV Res 2011; 9: 405-15.
| Crossref | Google Scholar |
21 Long LC, Maskew M, Brennan AT, et al. Initiating antiretroviral therapy for HIV at a patient’s first clinic visit: a cost-effectiveness analysis of the rapid initiation of treatment randomized controlled trial. AIDS 2017; 31: 1611-9.
| Crossref | Google Scholar |
22 Eaton JW, Menzies NA, Stover J, et al. Health benefits, costs, and cost-effectiveness of earlier eligibility for adult antiretroviral therapy and expanded treatment coverage: a combined analysis of 12 mathematical models. Lancet Glob Health 2014; 2: e23-e34.
| Crossref | Google Scholar |
23 Jansson J, Kerr C, Wilson DP. Predicting the population impact of increased HIV testing and treatment in Australia. Sex Health 2014; 11: 146-54.
| Crossref | Google Scholar |
24 Callander D, McManus H, Gray RT, et al. HIV treatment-as-prevention and its effect on incidence of HIV among cisgender gay, bisexual, and other men who have sex with men in Australia: a 10-year longitudinal cohort study. Lancet HIV 2023; 10: 385-93.
| Crossref | Google Scholar |
25 ASHM. Antiretroviral guidelines: US DHHS Guidelines with Australian commentary. ARV Guidelines. 2020. Available at https://arv.ashm.org.au/ [Accessed 5 April 2023]
26 Kelly SL, Wilson DP. HIV cascade monitoring and simple modeling reveal potential for reductions in HIV incidence. J Acquir Immune Defic Syndr 2015; 69: 257-63.
| Crossref | Google Scholar |
27 Gray RT, Watson J, Cogle AJ, et al. Funding antiretroviral treatment for HIV-positive temporary residents in Australia prevents transmission and is inexpensive. Sex Health 2018; 15: 13-9.
| Crossref | Google Scholar |
28 Scott N, Stoové M, Kelly SL, Wilson DP, Hellard ME. Achieving 90-90-90 Human Immunodeficiency Virus (HIV) targets will not be enough to achieve the HIV incidence reduction target in Australia. Clin Infect Dis 2018; 66: 1019-23.
| Crossref | Google Scholar |
29 Holt M, Lea T, Mao L, et al. Community-level changes in condom use and uptake of HIV pre-exposure prophylaxis by gay and bisexual men in Melbourne and Sydney, Australia: results of repeated behavioural surveillance in 2013–17. Lancet HIV 2018; 5: e448-e56.
| Crossref | Google Scholar |
30 Cohen MS, Chen YQ, McCauley M, et al. Antiretroviral therapy for the prevention of HIV-1 transmission. N Engl J Med 2016; 375: 830-9.
| Crossref | Google Scholar |
31 McCormack S, Dunn DT, Desai M, et al. Pre-exposure prophylaxis to prevent the acquisition of HIV-1 infection (PROUD): effectiveness results from the pilot phase of a pragmatic open-label randomised trial. Lancet 2016; 387: 53-60.
| Crossref | Google Scholar |
32 Smith DK, Herbst JH, Zhang X, Rose CE. Condom effectiveness for HIV prevention by consistency of use among men who have sex with men in the United States. J Acquir Immune Defic Syndr 2015; 68: 337-44.
| Crossref | Google Scholar |
33 Lim M, Devine A, Gray RT, Kwon JA, Hutchinson JL, Ong JJ. Lifetime cost of HIV management in Australia: an economic model. Sex Health 2022; 19: 517-24.
| Crossref | Google Scholar |
34 Mao L, Broady T, Newman C, Treloar C, Holt M. Annual report of trends in behaviour 2022: HIV/STIs and sexual health in Australia. Sydney: UNSW; 2022. doi:10.26190/1fhh-ab12
35 The Kirby Institute, UNSW Sydney. The Australian HIV Observational database (AHOD). The Kirby Institute, UNSW Sydney; 2020. Available at https://kirby.unsw.edu.au/project/ahod [Accessed 26 April 2023]
36 Holt M, Lea T, Mao L, et al. Adapting behavioural surveillance to antiretroviral-based HIV prevention: reviewing and anticipating trends in the Australian Gay Community Periodic Surveys. Sex Health 2017; 14: 72-9.
| Crossref | Google Scholar |
37 Australian Bureau of Statistics. Consumer Price Index, Australia. 2023. Available at https://www.abs.gov.au/statistics/economy/price-indexes-and-inflation/consumer-price-index-australia/latest-release [Accessed 18 April 2023]
38 Gray RT, Neil Bretana P. leftygray/Cascade_calculations: version used for the 2022 Annual surveillance report HIV chapter; 2022. https://zenodo.org/record/7056070. Updated code available at https://github.com/The-Kirby-Institute/Cascade_calculations
39 Gray RT, Wilson David P, Guy Rebecca J, et al. Undiagnosed HIV infections among gay and bisexual men increasingly contribute to new infections in Australia. J Int AIDS Soc 2018; 21: e25104.
| Crossref | Google Scholar |
40 Jansson J, Kerr CC, Mallitt K-A, Wu J, Gray RT, Wilson DP. Inferring HIV incidence from case surveillance with CD4+ cell counts. AIDS 2015; 29: 1517-25.
| Crossref | Google Scholar |
41 Schneider K, Gray RT, Wilson DP. A cost-effectiveness analysis of HIV preexposure prophylaxis for men who have sex with men in Australia. Clin Infect Dis 2014; 58: 1027-34.
| Crossref | Google Scholar |
42 Australian Department of Health and Aged Care. (Pharmaceutical Benefits Scheme PBS) Recommendations made by the PBAC - December 2017. 2017. Available at https://www.pbs.gov.au/pbs/industry/listing/elements/pbac-meetings/pbac-outcomes/recommendations-pbac-december-2017 [Accessed 23 March 2022]
43 Australian Department of Health and Aged Care. Pharmaceutical Benefits Scheme (PBS) Australian Statistics on Medicines. 2016. Available at https://www.pbs.gov.au/info/statistics/asm/australian-statistics-on-medicines [Accessed 17 April 2023]
44 Gray RT. Impact and effectiveness of U=U on HIV in Australia. The-Kirby-Institute/Impact_TasP_Australia. Zenodo; 2023. 10.5281/zenodo.7865576. Updated code available at: https://github.com/The-Kirby-Institute/Impact_TasP_Australia
45 Bares SH, Scarsi KK. A new paradigm for antiretroviral delivery: long-acting cabotegravir and rilpivirine for the treatment and prevention of HIV. Curr Opin HIV AIDS 2022; 17: 22-31.
| Crossref | Google Scholar |