Distribution, prevalence and persistence of mucormycosis in Tasmanian platypuses (Ornithorhynchus anatinus)
Nick Gust A D , Joshua Griffiths A , Michael Driessen A , Annie Philips A , Niall Stewart B and Dominic Geraghty CA Department of Primary Industries, Parks, Water and Environment, GPO Box 44, Hobart, Tas. 7001, Australia.
B Menzies Research Institute, University of Tasmania, Hobart, Tas. 7000, Australia.
C School of Human Life Sciences, University of Tasmania, Locked Bag 1320, Launceston, Tas. 7250, Australia.
D Corresponding author. Email: platypus.gust@gmail.com.au
Australian Journal of Zoology 57(4) 245-254 https://doi.org/10.1071/ZO09034
Submitted: 3 April 2009 Accepted: 23 July 2009 Published: 26 October 2009
Abstract
While the fungal disease mucormycosis has infected Tasmanian platypuses for nearly three decades, its impacts remain largely unknown. This study documents the spatial and temporal distribution of mucormycosis in Tasmanian platypuses as a baseline for assessing its impacts. Over 1800 platypus capture and observation records were collated and mapped, and indicate that between 1982 and 2007 mucormycosis-infected platypuses were present in at least 11, and potentially 22, of Tasmania’s 48 river catchments. During 2008–09, live-trapping surveys were undertaken to determine the spread, prevalence and persistence of the disease. Surveys of 75 rivers and creeks across 18 catchments captured 167 individuals, and an additional 12 platypuses were obtained from the public. Only seven of the 179 sampled animals were ulcerated with clinical signs of mucormycosis. All infected individuals were obtained from catchments with prior histories of disease, where platypuses have persisted despite mucormycosis being present for up to 20 years. Detection probabilities were calculated to estimate the probability that the other surveyed catchments are currently disease free. Detection probabilities were generally high (>0.75) per catchment, indicating that sampling effort was adequate to reliably detect diseased animals at historically reported prevalence (which averaged 0.295 from surveys undertaken between 1994 and 2000). Mean disease prevalence in affected catchments sampled during the present study declined to 0.071. This significant four-fold reduction in prevalence makes disease detection more challenging and increased sample sizes are required to confidently assert that some catchments are currently disease free. Reduced disease prevalence suggests that mucormycosis is exerting less impact on Tasmanian platypuses now than it was in the mid to late 1990s; however, the individual consequences of infection are poorly understood and require further investigation.
Introduction
Since 1982, Tasmanian platypuses (Ornithorhynchus anatinus) have been reported with a fungal disease that can cause skin lesions, morbidity and mortality (Stewart and Munday 2005). We refer to this disease as mucormycosis, a term used by Connolly et al. (2000), although it has variously been referred to as ulcerative dermatitis (Munday and Peel 1983), mycotic granulomatous dermatitis (Connolly et al. 1999) and ulcerative mycotic dermatitis (Whittington et al. 2002). Mucormycosis was first detected in platypuses from the Elizabeth River (41°56′S, 147°30′E), in Tasmania’s northern midlands in 1982 (Munday and Peel 1983). The pathogen responsible was identified a decade later as Mucor amphibiorum (Obendorf et al. 1993) and is probably an endemic Australian fungus, although it may have been introduced to Australia from Hawaii with cane toads (Bufo marinus) in 1935 (Speare et al. 1994). M. amphibiorum can cause mortality in a variety of amphibian species (Frank 1975; Speare et al. 1994), and may have been introduced to Tasmania via infected frogs or toads transported with fruit shipments from mainland Australia (Munday et al. 1998), or illegally imported as pets. Descriptions of the fungal pathogen, its potential transmission pathways, the clinical signs of infection and the history of mucormycosis research in Tasmania have been recently reviewed (Gust and Griffiths 2009).
Although there are no confirmed cases of mucormycosis in mainland Australian platypuses, public observations of ulcerated animals suggest that the disease has spread widely in Tasmanian platypuses since 1982 (Gust and Griffiths 2009). The first field survey to directly investigate mucormycosis in Tasmanian platypuses was conducted in 1994–95 at Brumby’s Creek (41°43′S, 147°04′E) near Cressy. At that time, the disease prevalence (proportion of infected animals) at Brumby’s Creek was high: 13 of 36 captured platypuses were ulcerated with clinical signs of mucormycosis (prevalence = 0.361), as were 2 of 3 from the nearby Liffey River (41°31′S, 147°00′E) near Carrick (Connolly et al. 1998). Additional trapping surveys were undertaken over four years from 1997 to 2000 in the Brumby’s–Lake catchment near Cressy (41°43′S, 147°04′E), in the Pipers catchment near Glengarry (41°20′S, 146°52′E) and from the Ford River (41°27′S, 146°36′E) in the North Esk catchment (Stewart 2001). Platypuses with clinical signs of mucormycosis were captured in each of these catchments. In total, 11 of the 49 individuals captured were ulcerated (mean prevalence was 0.224). Together, these studies suggest that high disease prevalence existed in northern Tasmanian catchments in the mid and late 1990s.
In the decade since these surveys were conducted, little additional ecological information has been collected in Tasmania to help assess the impacts of mucormycosis, or its conservation significance for platypuses. There is insufficient information on the distribution and prevalence of the disease across Tasmania to assess the magnitude of potential threat. For instance, it is unclear what the current distribution of mucormycosis is, what the prevalence of disease is within affected catchments, whether the disease has persisted in platypus populations that were historically affected, or whether platypuses still persist in formerly affected areas.
The progressive and potentially fatal nature of mucormycosis and the infection of multiple animals in different populations suggest that the disease may exert an effect on the population dynamics of Tasmanian platypuses (Whittington 1992). Contemporary understanding of the epidemiology of mucormycosis and its potential impacts on the conservation status of platypuses has been reviewed by Gust and Griffiths (2009). They note that it is unclear what the route of individual infection is, how mucormycosis is spread within or between catchments, or what the mortality and reproductive consequences of infection are for individuals (the per capita impacts). The impact of mucormycosis disease on Tasmanian platypuses can broadly be considered a function of its geographic spread, prevalence within local populations, persistence through time and per capita impacts. To provide an initial indication of the magnitude of potential impact of mucormycosis disease, the current study assessed historic evidence for the temporal and spatial distribution of platypus mucormycosis, and used public observations and trapping surveys to:
-
assess the current distribution of platypus mucormycosis in Tasmania;
-
quantify disease prevalence, i.e. the proportion of animals with clinical signs of mucormycosis as defined by Munday and Peel (1983), Obendorf et al. (1993) and Connolly et al. (2000); and
-
determine whether platypuses and mucormycosis still persist in areas historically known to be affected.
Methods
In order to quantify the distribution and prevalence of platypus mucormycosis widely across the 66 000 km2 of Tasmania in the 18 months available for this study, we undertook the following four steps. (1) We defined the spatial scale of interest. (2) We collected and mapped historic data to examine evidence for spread of mucormycosis. (3) We identified historically affected locations for trapping surveys. (4) We conducted an intensive field trapping survey program to assess the health of Tasmanian platypuses.
Spatial scale of interest
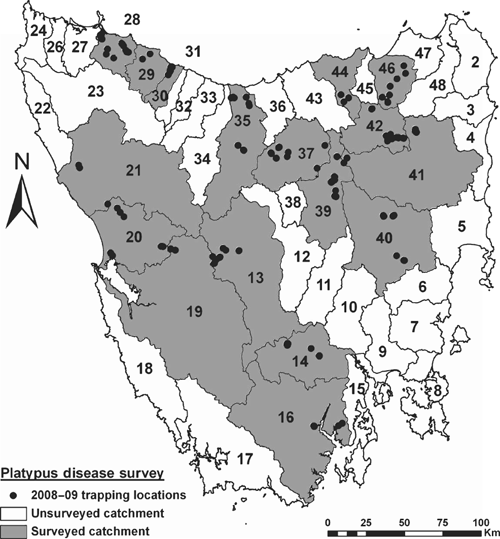
Tasmania has extensive habitat for platypuses with a myriad of suitable rivers, creeks, lakes and farm dams that contribute to a large platypus metapopulation. Since detailed understanding of platypus movement patterns within and between water bodies through the life of individuals is poorly understood, the spatial scale at which breeding populations exist in Tasmania is currently unclear. Here we define the spatial scale of interest for disease assessment as individual river catchments, since they are discrete management and conservation units, and contain a network of interconnecting water bodies where platypuses can potentially interact and breed. Catchment boundaries around Tasmania’s 48 river catchments (Fig. 1) are defined by Land Information Service Tasmania (hereafter LIST) at the Department of Primary Industries, Parks, Water and Environment (DPIPWE).
|
Public observations and historic mucormycosis records
To produce a comprehensive database of platypus mucormycosis records in Tasmania, we collated and categorised diverse information from a wide variety of sources. Historic information was gleaned from published scientific literature, unpublished platypus capture records, laboratory pathology reports, Queen Victoria Museum (Launceston) and Tasmanian Museum (Hobart) records, Tasmanian Natural Values Atlas (DPIPWE), and public sightings of platypuses. A total of >1800 spatially explicit records were compiled that indicate the distribution of both healthy and diseased platypus throughout Tasmania. Historic capture information and public observation records were generously made available by J. Connolly, S. Munks, P. Bethge, H. Otley, S. Nichol, and the Tasmanian Platypus Alert program involving D. Obendorf, S. Lloyd and the Tasmanian Central North Field Naturalists. Public sightings of healthy and apparently ulcerated platypuses were sought during the current study through an active community education and engagement program. This involved creating and publicising a platypus disease information website, conducting radio and television interviews, publishing newspaper and newsletter articles, presenting public talks and distributing 2000 mucormycosis information pamphlets and posters state-wide through Service Tasmania outlets. A Geographic Information System (Arc GIS 9, ESRI) was used to map this information. Differences in the level of confidence that could be attributed to disease presence were displayed in qualitative categories that acknowledge the different types of available evidence.
Catchment disease status
Catchments were classified into four qualitative disease status categories according to available evidence:
-
Currently affected. Catchments where one or more platypuses captured and examined by researchers in 2008 or 2009 had clinical signs of mucormycosis, i.e. ulcers and/or lesions consistent with those described by Munday and Peel (1983), Obendorf et al. (1993) and Connolly et al. (2000).
-
Historically affected. Catchments where one or more platypuses examined by researchers between 1982 and 2007 had clinical signs of mucormycosis. Data collected from peer-reviewed scientific papers (Munday and Peel 1983; Obendorf et al. 1993; Connolly et al. 1998; Munday et al. 1998; Stewart and Munday 2005) and unpublished pathology reports.
-
Possibly affected. Catchments where there were no confirmed records of mucormycosis in either captured or dead animals, but where apparently ulcerated platypuses were reported by the public.
-
No evidence. Catchments where there were no records of clinical signs of mucormycosis, and only healthy platypuses were reported by the public.
Live-trapping surveys
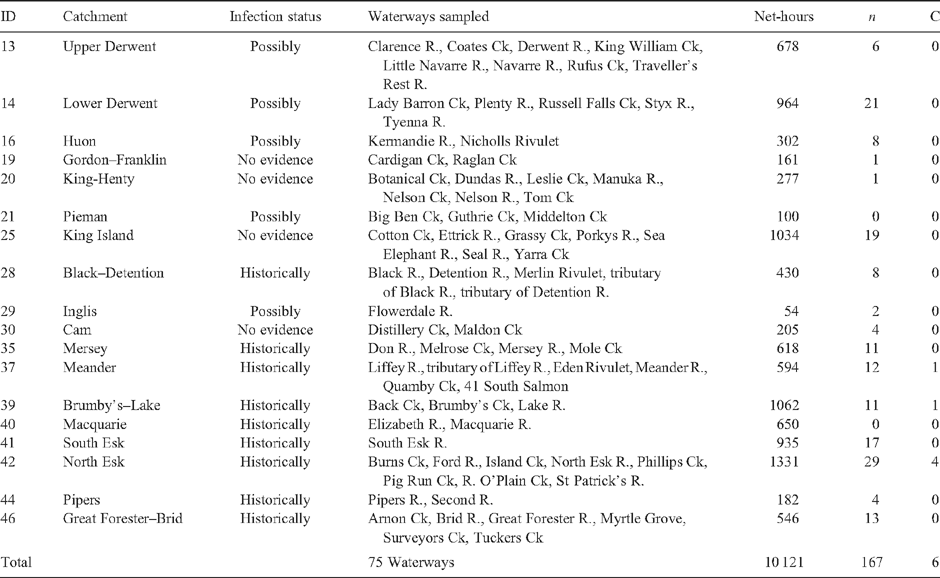
Live-trapping surveys were conducted in 18 Tasmanian river catchments and 75 waterways between January 2008 and June 2009 (Fig. 1, Table 1). The sampling strategy concentrated effort in nine historically affected catchments, five possibly affected catchments, and four catchments outside the known distribution of mucormycosis, including King Island (Table 1). Platypuses were sampled at King Island since they represent an unusually small, discrete population between Tasmania and Victoria, their disease status was unknown, and they may be particularly vulnerable to mucormycosis due to potentially low genetic diversity (K. Belov, pers. comm.). Sampling effort within catchments was spread across multiple waterways (Table 1), with nets within waterways typically set at sites kilometres apart to seek a widely representative sample from catchments. Sampling aimed to maximise captures of individuals, rather than recaptures, and avoided more than four consecutive nights of trapping at individual sites. To minimise potential variation in catch characteristics across water bodies, sampling was restricted to flowing waters (rivers, streams and creeks). The latitude and longitude of sampling sites will be published online (at www.naturalvaluesatlas.dpiw.tas.gov.au), or can be made available on request. Trapping surveys were not conducted in either lakes or dams. The individuals captured were assumed to be random samples from populations.
|
Free-ranging platypuses were primarily captured at night using purpose-built fyke nets that accounted for >90% of captures. Small and large fyke nets (with either 5-m- or 20-m-long wings, and 0.6-m- or 1.2-m-high entrances respectively) were set according to the size of rivers and prevailing flow. Fykes were typically set in pairs back to back facing up and downstream, with cod ends suspended well above water level. They were typically set two hours before sunset and were checked regularly for captures through the night. The purpose-built fyke nets are to be described in detail elsewhere, along with details of the catch rates and comparison of efficacy amongst net types, river orders and by-catch details. Unweighted and slightly weighted gill-nets (50 m long and 3 m deep) were also used at Brumby’s Creek and the Kermandie River following the techniques described by Grant and Carrick (1974, 1978). The location of each net was recorded using a hand-held GPS along with the time of setting and retrieving each net, its size, the time and identity of any platypuses captured and by-catch species trapped. We quantify sampling effort in net-hours (one net-hour = a single fyke net, or 50-m gill-net deployed for an hour).
Captured animals were individually identified with microchips (Trovan or Allflex Brands) inserted subcutaneously between the scapulae (Grant and Whittington 1991). Visual health assessments were made through a physical examination of each captured individual to determine the presence of ulcers, granulomas, wounds or other abnormalities, as previously described by Munday and Peel (1983), Obendorf et al. (1993) and Connolly et al. (2000). Individuals were considered to be clinically healthy when no external injuries or lesions were observed and there was no evidence of disease or emaciation. Additional fresh and frozen platypus carcasses were collected in response to public sightings (Table 2), and necropsies were performed on fresh specimens.

|
Disease prevalence
Disease prevalence refers to the proportion of diseased animals within a population. Here, we consider prevalence as the proportion of captured platypuses with clinical signs of mucormycosis. Large sample sizes are required to accurately estimate disease prevalence, but are logistically difficult to achieve for platypuses. Binomial exact methods enable the calculation of confidence intervals around prevalence estimates and are suited to situations where the number of animals sampled and/or the observed prevalence is low (Dohoo et al. 2003). We calculated exact 95% confidence intervals for disease prevalence from historically reported sampling results, and the catchments surveyed during the current study. Calculations were made using an exact method accessed at http://statpages.org/confint.html on 30 May 2009. A Chi-square test was used to compare historic prevalence data pooled from netting surveys conducted between 1994 and 2000 in affected catchments, and data pooled from surveys of historically affected catchments surveyed in 2008–09. Pooling data in historical and current surveys maximises sample size for robust estimates of prevalence and comparisons through time.
Detection probabilities
Field-trapping surveys across a variety of catchments permits description of the current spread of mucormycosis with greater rigor than public sightings. If one or more captured individuals were confirmed to have clinical signs of mucormycosis, then we defined a catchment as currently affected. However, failure to catch a clinically infected platypus in a catchment does not confirm the absence of the disease. We calculated probabilities of detecting animals with mucormycosis to determine the confidence that a particular area is currently disease free given the sampling effort achieved. The probability of detecting ulcerated platypuses with clinical cases of mucormycosis (termed the probability of detection) reflects the sample size (n), the prevalence of infection within the population (r), and the sensitivity of the tests (e) used to detect M. amphibiorum according to the equation:

This equation is derived from binomial statistics (e.g. Venette et al. 2002; Hayes et al. 2005), and assumes that (1) the probability of capturing healthy or diseased platypuses is proportional to their relative abundance, and (2) the disease is distributed randomly amongst animals in each catchment. The probability of detection can be modelled by varying the number of animals captured against both disease prevalence in infected populations, and the sensitivity of detecting infected animals using various criteria or diagnostic disease-testing techniques (e.g. culture of fungus, or PCR testing for M. amphibiorum in tissue samples). Alternatively, sample sizes required to achieve requisite a priori detection probabilities can also be determined. For example, to achieve detection probabilities >0.75 per catchment, at historic disease prevalence of 0.295 (Connolly et al. 1998; Stewart 2001), and assuming high sensitivity (e = 1) for correctly diagnosing captured animals with clinical signs of mucormycosis, we required sample sizes of four or more individuals per catchment.
Results
Historic distribution of platypus mucormycosis from 1982 to 2007
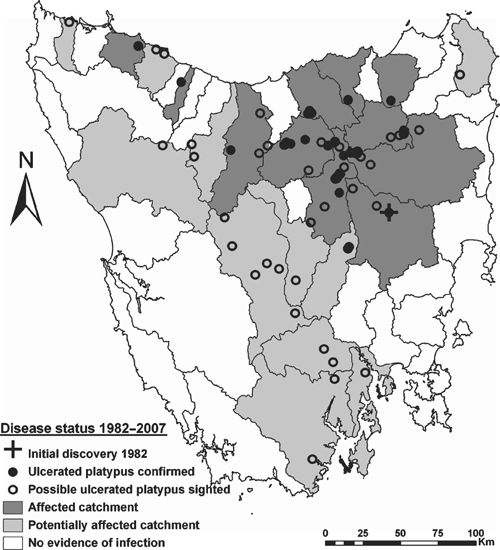
Cumulative evidence for the spatial distribution of platypus mucormycosis between 1982 and 2007 is summarised across Tasmania’s 48 river catchments in Fig. 2. Historically, 11 catchments were affected by mucormycosis, another 11 were potentially affected, and there was no evidence of infection in the remaining 26 catchments. Historically affected catchments together represent 24% of the land area of Tasmania, potentially affected catchments represent 31% and catchments with no evidence of infection represent 45%. Nine of the historically affected catchments are contiguous and centred in the north-east of the state (Fig. 2). They include the Mersey, Meander, Macquarie, Tamar, Brumby’s–Lake, Pipers, North Esk, South Esk and Great Forester–Brid catchments. Two isolated infected catchments, the Black–Detention and Emu, are in the north-west of the state (Fig. 2). Potentially affected catchments are distributed along the entire north–south axis of Tasmania, and also extend to catchments on both the east and west coasts (Fig. 2). Potentially affected catchments included the Montagu, Pieman, Inglis, Forth–Wilmot, Upper Derwent, Ouse, Huon, Lower Derwent, Clyde, Derwent Estuary–Bruny, and Musselroe–Ansons. The 26 catchments with no evidence of infected platypuses include four in the south-west where visitation rates are low, public observations rare, and trapping surveys would be required to confidently determine their disease status.
|
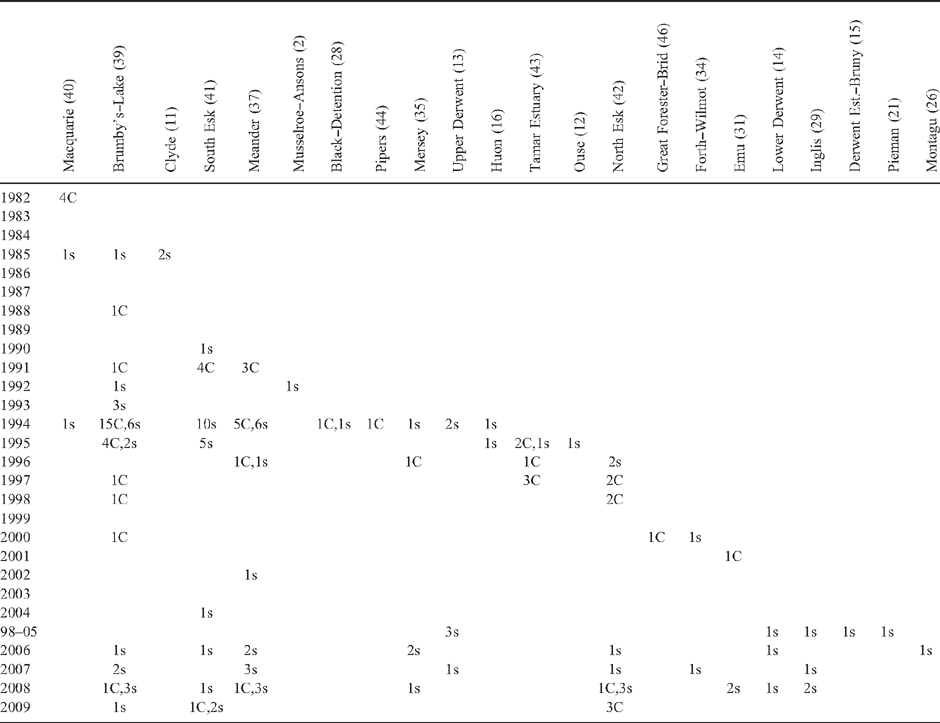
The temporal distribution of evidence for platypus mucormycosis between 1982 and 2009 is summarised in Table 3. Capture or public sighting evidence exists for platypus mucormycosis in 22 Tasmanian catchments. Documented records include 63 captured and 98 reported sightings of ulcerated platypuses over the 27-year period, >56% of both capture and sighting records were obtained in four of those years (1994–95 and 2008–09). Evidence exists for widespread mucormycosis in Tasmania through the mid 1990s (Table 3) when capture surveys were undertaken (Connolly et al. 1998; Stewart 2001). However, evidence of disease is relatively sparse, both from 1983 to 1990, and from 1998 to 2005 (Table 3), when little research activity was being undertaken. Despite lengthy periods for which no data are available, there is evidence for a gradual spread of mucormycosis across Tasmania, at an average rate of approximately one new catchment affected per year (Table 3). The Brumby’s–Lake catchment is the best surveyed and has the longest interval between confirmed mucormycosis cases (20 years), with public sightings suggesting that mucormycosis may have persisted in the catchment for at least 24 years (Table 3). There have been no records of mucormycosis for considerable periods in a large number of catchments. For instance, it has been at least 15 years since there have been any records from the Macquarie, Black–Detention or Pipers catchments, and there have been no records of mucormycosis in the last decade from eight catchments with historical evidence of the disease (Table 3).
Sampling effort in 2008–09
In 2008–09, live-capture surveys involving more than 10 100 h of netting were conducted in 18 catchments across Tasmania (Table 1). Sampling effort per catchment varied from 54 h in the Inglis to 1331 h in the North Esk (Table 1), with a mean of 562 h per catchment. Sampling effort was biased towards historically infected catchments (62% of net hours), possibly infected catchments accounted for 21%, and catchments with no evidence of infection represented 17% of effort. Platypuses were captured in eight of the nine historically affected catchments (Table 1). The exception was the Macquarie catchment, where despite 650 h of netting at multiple sites in the Elizabeth and Macquarie Rivers (Table 1), no platypuses were captured (or sighted). An additional 12 individuals were sampled from public collections made across eight catchments (Table 2). Where necropsies identified the cause of death, dog attacks and vehicles were primarily responsible, with one emaciated individual displaying clinical signs of mucormycosis (Table 2).
Distribution of platypus mucormycosis in 2008–09
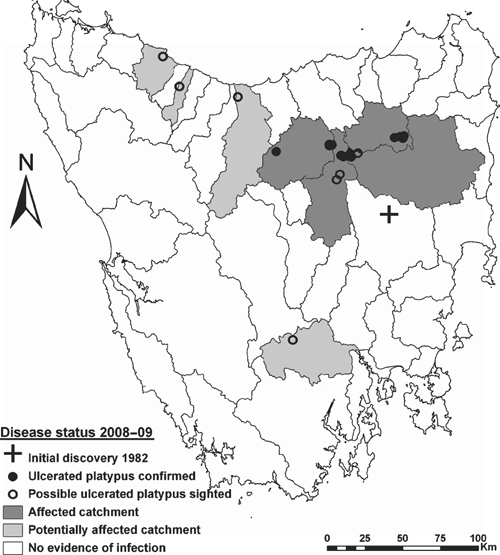
Despite extensive survey effort and a widespread public-engagement program, evidence for platypus mucormycosis in 2008–09 was limited. Six of the 167 animals captured in trapping surveys were ulcerated (Table 1), as was one of the 12 individuals obtained from the public (Table 2). In addition, we received 19 public sightings of potentially infected animals across eight catchments (Table 3). Evidence for the contemporary spatial distribution of platypus mucormycosis across Tasmanian river catchments is summarised in Fig. 3. Sampling confirmed that four contiguous catchments (Brumby’s–Lake, Meander, South Esk and North Esk) currently contain platypuses with clinical signs of mucormycosis (Fig. 3). A single ulcerated animal was captured from each of the Brumby’s–Lake, Meander and South Esk catchments, while four ulcerated individuals were obtained from the North Esk catchment (Tables 1, 2). Ulcerated animals were all from catchments with historical evidence of mucormycosis between 13 and 20 years ago (Table 3). Public observations suggest that another four catchments (Mersey, Emu, Lower Derwent and Inglis) are possibly affected by mucormycosis (Fig. 3).
|
Disease prevalence
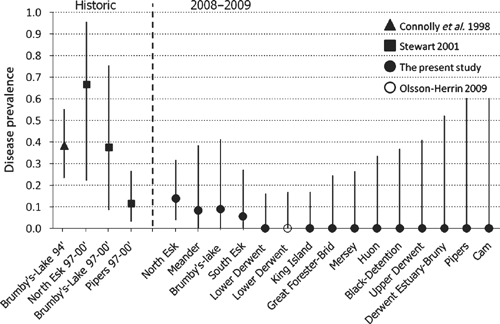
Estimates of disease prevalence from historic and 2008–09 trapping surveys are shown with 95% confidence intervals in Fig. 4. Historic prevalence estimates for infected catchments surveyed between 1994 and 2000 were high, varying from 0.11 to 0.67 (Fig. 4). Small sample sizes conferred wide confidence intervals for most historic estimates, with the exceptions being more reliable estimates of prevalence in the Brumby’s–Lake catchment in 1994, and the Pipers catchment sampled between 1997 and 2000 (Fig. 4). Disease prevalence was relatively uniform in the four currently infected catchments, varying from 0.06 in the South Esk to 0.14 in the North Esk, with moderate confidence intervals around each (Fig. 4). Although the 2008–09 sampling revealed no evidence of disease in 10 additional catchments, confidence in zero prevalence values in each catchment declines with reducing sample size (Fig. 4). For instance, in the Lower Derwent, where 21 individuals were sampled, the 95% confidence limit for disease prevalence was 0.161; however, in the Cam, where only four animals were sampled, the 95% confidence limit rose to 0.600 (Fig. 4). Pooling historic capture records in all four infected catchments where netting surveys were conducted (Brumby’s–Lake, Meander, North Esk and Pipers) revealed that 26 of 88 sampled animals suffered ulceration (Connolly et al. 1998; Stewart 2001). These pooled historic data had a combined prevalence of 0.295, a minimum confidence limit of 0.203 and a maximum of 0.402. Pooled data from 2008–09 sampling in nine historically infected catchments (Black–Detention, Brumby’s–Lake, Great Forester–Brid, Macquarie, Meander, Mersey, North Esk, Pipers and South Esk) indicated that 7 of 99 sampled animals were ulcerated, with a mean prevalence of 0.071, a minimum confidence limit of 0.029 and a maximum of 0.140. A Chi-square test of pooled historic data and pooled contemporary data from affected catchments found the four-fold decline in prevalence over time was significant (χ2 = 11.31, d.f. = 1, P = 0.0008).
|
Detection probabilities
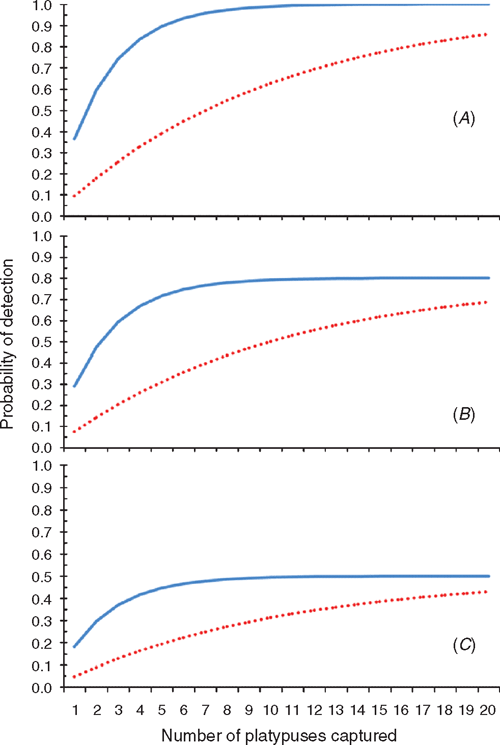
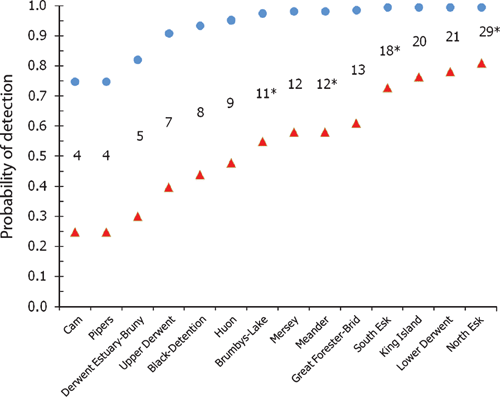
Modelled detection probabilities (Fig. 5) indicate that at the best estimate of historic disease prevalence (0.295), detection probabilities begin to reach an asymptote within a catchment after the capture of four platypuses. That is, with four individuals sampled per catchment, detection probabilities exceed 75% of the asymptote values dictated by the sensitivity of diagnostic disease testing. However at the four-fold lower contemporary disease prevalence (0.071), detection probabilities rise more slowly with increasing sample size (Fig. 5). To exceed detection probabilities of 75% at contemporary disease prevalence requires the capture of at least 19 animals per catchment (Fig. 5). Detection probabilities calculated for sampled catchments (Fig. 6) indicate that, at historic disease prevalence levels, detection probabilities for most sampled catchments were high (>0.75). This indicates that the sampling design and effort were adequate to reliably detect the disease if it was present at the mean historical prevalence values reported between 1994 and 2000. However, with prevalence now reduced to around one-quarter of its former level, detection probabilities fell considerably, and only exceeded 0.75 in three catchments where sample sizes of 19 or more platypuses were achieved (Fig. 6).
|
|
Discussion
This study provides the most comprehensive, systematic and large-scale assessment of platypus mucormycosis conducted to date. Data from previous field studies, augmented with recorded sightings from the general community and amateur field naturalists, enabled a detailed retrospective analysis of the distribution and spread of mucormycosis. Since 1982 mucormycosis appears to have spread from the Elizabeth River in the Macquarie catchment to the wider tributaries of the Tamar River, and was then detected in the Black–Detention catchment in the north-west of the state (Munday et al. 1998). Munday et al. (1998) suggested that the westward spread of the disease may have occurred via infected platypuses travelling overland between catchments. However, anthropogenic spread of the fungal pathogen M. amphibiorum in soil or water is a possibility, and the mechanisms of disease spread within and between catchments have yet to be established (Gust and Griffiths 2009). Understanding disease-transmission processes is difficult in free-ranging wildlife but important for understanding disease impact and dynamics, and for informing management decisions (Murray et al. 2009).
Munday et al. (1998) predicted a continuing spread of mucormycosis, which was observed in the subsequent decade and documented in the current study. Since 1997 additional catchments confirmed with mucormycosis include the Great Forester–Brid in north-eastern Tasmania in 2000, and the Emu in the north-west of the state in 2001. Remaining evidence for disease spread across Tasmania is restricted to unconfirmed public observations in six catchments. Increased awareness and reporting of diseased animals may account for some of the apparent pattern of spread, which appears to have progressed at roughly one additional catchment per year since the disease was first detected in 1982. The temporal and spatial distribution of mucormycosis records reflects periods and locations of intense research activity in both 1994–2000 and 2008–09, when most records were obtained. Some river catchments have very limited historical disease records, such that inferences of historic disease rely on single public observations reported over a decade ago. While public observations augment trapping survey results, their reliability is often difficult to assess.
Fundamental epidemiological information was collected on the contemporary (2008–09) distribution, persistence and prevalence of mucormycosis across Tasmania to help assess the magnitude of potential threat posed by the disease. Sampling from currently infected catchments indicates a four-fold decline in the prevalence of mucormycosis compared with pooled data from previous estimates in infected catchments surveyed with live-capture techniques between 1994 and 2000 (Connolly et al. 1998; Stewart 2001). Contemporary disease prevalence estimates are the most rigorous available to date, and include confidence intervals around estimates. The current trapping study was large-scale (18 of Tasmania’s 48 catchments were trapped), intensive (over 10 000 h of trapping was conducted), and resulted in relatively large sample sizes across catchments (179 platypuses were sampled, with up to 29 individuals captured per catchment).
A four-fold decline in the prevalence of mucormycosis over approximately a decade is an intriguing observation, with a variety of potential explanations. These include:
-
That strong selection occurred for disease resilience; previously infected animals died and the remaining platypuses were sufficiently immuno-competent to resist infection or totally recover from infection and were able to re-establish healthy, largely disease-free populations.
-
Pathogen virulence has declined or host resistance increased over the past decade.
-
An unknown environmental covariate may exist that potentially influences the transmission of the pathogen, or susceptibility of platypuses to infection, and that suitable environmental conditions for M. amphibiorum have become rarer through time. Clearer understanding of the distribution and environmental tolerances of M. amphibiorum in temperate Australia would assist investigation of this hypothesis.
-
Mucormycosis may be density dependent, and affected populations have declined in abundance to such an extent that the transmission of disease amongst individuals has been reduced. However, platypus abundance is not readily assessed (Grant and Temple-Smith 2003), and difficulties in reliably quantifying platypus abundance compromise researchers’ ability to determine impacts on populations. A lack of historic abundance estimates in Tasmania prohibits a rigorous demonstration of population decline attributable to mucormycosis, such that the ‘density dependence’ hypothesis is difficult to test.
The low number of ulcerated platypus captured (seven) in the present study does not exclude the possibility that pockets of high disease prevalence still exist in Tasmania. Many catchments could not be surveyed in the available time, and lakes and dams, unsurveyed in the present study, could still harbour infected animals. Furthermore, the current distribution of the disease is still poorly resolved within catchments, so it is also possible that pockets of high disease prevalence exist in some locations within catchments (for instance, in areas of catchments that are less readily observed by the public or trapped by researchers).
Detection probabilities were calculated to test whether sampling effort within catchments was adequate to reliably detect ulcerated platypuses if they were present. At historically reported disease prevalence, detection probabilities within surveyed catchments were generally high (>0.75), indicating that sampling of at least four platypuses per catchment was adequate to provide a reasonable chance of detecting the disease. However, with contemporary prevalence now four-fold lower, the sample size required for detection probabilities >0.75 per catchment has risen to at least 19 platypuses. For a large scale assessment, achieving this number of captures in multiple catchments is a huge logistical challenge, and may be virtually impossible in some catchments. From current catch rates we estimate that achieving such a feat across half of Tasmania’s 48 catchments requires >28 000 h of fyke net sampling. To calculate detection probabilities the sensitivity of visual inspections to detect clinical signs of mucormycosis was assumed to be high (i.e. e = 1). If this assumption is wrong, detection probabilities may be under- or overestimated. For instance, if subclinical infection exists at the time of capture, individuals may be falsely classified as healthy, true sensitivity will be <1, and reported disease prevalence and detection probabilities will be underestimated. Conversely, if observed ulcers are not attributable to mucormycosis, disease prevalence and detection probabilities will be overestimated. Development of more sophisticated disease diagnostic tests such as PCR, or high-specificity ELISA tests from sampled animals will allow assumed sensitivity values to be tested.
Determining the impacts of mucormycosis on Tasmanian platypus populations is challenging. Since their abundance is difficult to determine, population trends are generally unknown and the specific impacts of disease or environmental perturbations have been suggested and implicated, but rarely rigorously demonstrated (Gust and Griffiths 2009). The consequences of mucormycosis infection for individuals are also still poorly understood. For instance, basic natural history details of diseased individuals are unclear, including what the mortality or reproductive consequences of infection are. To date, Tasmanian platypuses have generally persisted in mucormycosis-infected locations for up to two decades. This suggests that the disease alone does not rapidly drive populations to local extinction. A possible caveat is that in the formerly affected Elizabeth and Macquarie rivers. No individuals were captured or seen despite extensive sampling effort. However, the apparent declines in platypus numbers in these areas may reflect other factors such as reduced flow rates and/or land use changes that have occurred simultaneously since the early 1980s when the disease was first detected there. The impacts of disease on demographic variables are currently being investigated and will be reported elsewhere.
A four-fold decline in the prevalence of ulcerated platypuses in infected populations suggests that the disease is much less common in 2008–09 than it was between 1994 and 2000. However, we have no sampling data from the intervening years and cannot reliably predict disease prevalence into the future from two sampling periods. With mean disease prevalence in affected catchments now reduced to 0.071, mucormycosis appears to have less impact on Tasmanian platypuses than it did a decade ago if the mortality and reproductive consequences of infection for individuals have remained equivalent through time. Future research priorities include investigating the demographic impacts of mucormycosis, developing more sensitive disease diagnostic tools to detect animals with subclinical infection, and assessing per capita disease impacts on platypus survivorship and reproduction.
Acknowledgements
This research was undertaken in accordance with Department of Primary Industries and Water animal ethics permit 16/2007-08. Netting was conducted under Inland Fisheries Services exemption permit 2007/47, and DPIW platypus collection permits were issued to both N. Gust and J. Griffiths. The authors gratefully acknowledge the field assistance of additional staff and volunteers involved in this study, including B. Brown, M. Blytheman, E. Furlan, P. Holcombe, J. Sommerfeld, R. Olsson-Herrin, S. McColl, J. McGregor and S. Zulli. We thank landowners and fisheries staff across Tasmania for granting access to waterways and the Tasmanian public for reporting sightings of ulcerated platypuses. We thank the Platypus Alert Program, particularly S. Lloyd and J. Connolly, for contributing historic public sightings of ulcerated platypuses. We thank the anonymous reviewers for their constructive comments on this manuscript. We gratefully acknowledge research funding from the Australian Government via both Natural Resource Management North and the Caring for Our Country program.
Connolly, J. H. , Obendorf, D. L. , Whittington, R. J. , and Muir, D. B. (1998). Causes of morbidity and mortality in platypus (Ornithorhynchus anatinus) from Tasmania, with particular reference to Mucor amphibiorum infection. Australian Mammalogy 20, 177–187.
Grant, T. , and Carrick, F. (1974). Capture and marking of the platypus, Ornithorhynchus anatinus in the wild. Australian Zoologist 18, 133–135.
Stewart, N. J. , and Munday, B. L. (2005). Possible differences in pathogenicity between cane toad-, frog- and platypus-derived isolates of Mucor amphibiorum, and a platypus-derived isolate of Mucor circinelloides. Medical Mycology 43, 127–132.
| Crossref | GoogleScholarGoogle Scholar | CAS | PubMed |
Whittington, R. J. , Connolly, J. H. , Obendorf, D. L. , Emmins, J. , Grant, T. R. , and Handasyde, K. A. (2002). Serological responses against the pathogenic dimorphic fungus Mucor amphibiorum in populations of platypus (Ornithorhynchus anatinus) with and without ulcerative mycotic dermatitis. Veterinary Microbiology 87, 59–71.
| Crossref | GoogleScholarGoogle Scholar | CAS | PubMed |


