

Enhancing national data to align with policy objectives: Aboriginal and Torres Strait Islander smoking prevalence at finer geographic levels
Alyson Wright A B D , Ray Lovett A , Yvette Roe C and Alice Richardson AA National Centre for Epidemiology and Population Health, Australian National University, Building 62, Mills Road, Canberra, ACT 2601, Australia. Email: raymond.lovett@anu.edu.au; alice.richardson@anu.edu.au
B Indigenous Health Division, Department of Health, MDP 14, PO Box 9848, Canberra, ACT 2601, Australia.
C Institute for Urban Indigenous Health, 23 Edgar Street, Bowen Hills, Qld 4006, Australia. Email: Yvette.Roe@iuih.org.au
D Corresponding author. Email: alyson.wright@health.gov.au
Australian Health Review 42(3) 348-355 https://doi.org/10.1071/AH16269
Submitted: 29 November 2016 Accepted: 14 March 2017 Published: 5 June 2017
Journal compilation © AHHA 2018 Open Access CC BY-NC-ND
Abstract
Objectives The aim of the study was to assess the utility of national Aboriginal survey data in a regional geospatial analysis of daily smoking prevalence for Aboriginal and Torres Strait Islander Australians and discuss the appropriateness of this analysis for policy and program impact assessment.
Methods Data from the last two Australian Bureau of Statistics (ABS) national surveys of Aboriginal and Torres Strait Islander people, the National Aboriginal and Torres Strait Islander Social Survey 2014–15 (n = 7022 adults) and the National Aboriginal and Torres Strait Islander Health Survey 2012–13 (n = 10 896 adults), were used to map the prevalence of smoking by Indigenous regions.
Results Daily smoking prevalence in 2014–15 at Indigenous regions ranges from 27.1% (95%CI 18.9–35.3) in the Toowoomba region in Queensland to 68.0% (95%CI 58.1–77.9) in the Katherine region in the Northern Territory. The confidence intervals are wide and there is no significant difference in daily smoking prevalence between the two time periods for any region.
Conclusion There are significant limitations with analysing national survey data at finer geographical scales. Given the national program for Indigenous tobacco control is a regional model, evaluation requires finer geographical analysis of smoking prevalence to inform public health progress, policy and program effects. Options to improve the data currently collected include increasing national survey sample sizes, implementing a smoking status question in census surveys, investing in current cohort studies focused on this population or implementing localised surveys.
What is known about the topic? The last geospatial analysis of Aboriginal and Torres Strait Islander smoking prevalence was undertaken in 1997. Current national survey data have not been analysed geospatially.
What does this paper add? This paper provides new insights into the use of national survey data for understanding regional patterns and prevalence levels of smoking in Aboriginal and Torres Strait Islander populations.
What are the implications for practitioners? The findings of the study suggest caution when interpreting prevalence maps and highlight the need for greater sample sizes in national survey data. The analysis is also an opportunity to assess the use of national survey data in evaluating the policy impact of programs targeted at a regional level.
Introduction
The smoking rate among Australia’s Aboriginal and Torres Strait Islander people is currently 39% for adults aged ≥15 years.1 This compares with a non-Indigenous smoking prevalence of 14.5% for adults aged ≥15 years.2,3 The higher rate of tobacco use by Aboriginal and Torres Strait Islander people is associated with an increased burden of chronic diseases and contributes to the health disparity between Indigenous and non-Indigenous Australians.4–7 In the context of excessive disease burden, reducing levels of smoking presents a significant public health priority and opportunity for health gain in this population.
In order to respond to high tobacco use and improve health outcomes, in 2008 the Council of Australian Governments established a target to halve the rate of smoking in Aboriginal and Torres Strait Islander people by 2018.8,9 This ambitious target was followed by funding specifically to develop targeted tobacco control programs for Aboriginal and Torres Strait Islander people.8,10,11 The most recent revision of the program, the Australian Government’s Tackling Indigenous Smoking program, commits A$116.8 million over 3 years (from 2015–16 to 2017–18).8 The largest proportion of this funding is assigned to delivering regional population health tobacco control interventions through community-based organisations, primarily Aboriginal community-controlled health services.12 This approach continues the preventative and primary healthcare focus at a regional level.13,14
Given there is both a regional approach to tobacco control and wide variation in smoking rates across Aboriginal and Torres Strait Islander populations, it is useful to report smoking prevalence at a finer geographic level to understand regional differences and rates of change over time. There is a decreasing trend in smoking prevalence among the Indigenous populations in urban areas, but little change in prevalence in remote areas.1,15,16 Further, the Aboriginal and Torres Strait Islander Health Performance Framework documents smoking prevalence by state and remoteness, showing that highest smoking prevalence is in the Northern Territory at 52% and in very remote areas at 56%.17 However, apart from broad jurisdictional analysis and several localised surveys indicating high smoking rates in some remote communities,18–20 we know very little about the regional epidemiology of Aboriginal and Torres Strait Islander smoking. Policy and program need to draw on national survey data to better inform the approach, in evaluation of programs, in gap identification and to track trends over time. Measuring regional differences in smoking prevalence is important in evaluating outcomes in the Australian Government’s Tackling Indigenous Smoking program.
The purpose of this study was to assess the utility of national survey data on Aboriginal and Torres Strait Islander smoking prevalence by analysing the data at a finer geographic level. In undertaking the analysis, we draw out the application of Australian Bureau of Statistics (ABS) survey data to inform Aboriginal and Torres Strait Islander tobacco control policy and program evaluation. The maps present smoking prevalence in 2012–13 and 2014–15 at the ABS Indigenous region level. We also analyse smoking prevalence results at the regional level to assess current daily smoking between regions and within regions over the two time periods. The last geospatial analysis of smoking prevalence was undertaken by Cunningham in 1997 using 1994 survey results from the ABS.21 In addition to updating these earlier maps, the present study is an opportunity to explore the merits of using national survey data for regional comparisons.
Methods
National surveys
The study used a cross-sectional and ecological study design. Data from two national ABS surveys were analysed, namely the National Aboriginal and Torres Strait Islander Health Survey (NATSIHS) 2012–1322 and the National Aboriginal and Torres Strait Islander Social Survey (NATSISS) 2014–15.23 The sample sizes were 10 896 adults in 2012–13 and 7022 adults in 2014–15.22 Both surveys used random samples selected from both non-community areas via an area-based frame and from community areas (defined as discrete Aboriginal communities), with households selected in a remote community via the list-based frame of Aboriginal communities.22,24 The ABS collected data using similar methods across both surveys, with face-to-face interviews in non-community and community households. Data were then weighted to reflect key characteristics of the total Aboriginal and Torres Strait Islander population. These weights adjust for differences between the sample and the population in terms of distribution of group characteristics, including state and remoteness, community and non-community, as well as individual characteristics such as age, sex and Torres Strait Islander identification.24
The present study was restricted to an analysis of weighted aggregated survey data because individual data at Indigenous region level are not available. Further, the use of Table Builder (ABS, Canberra, Australia) for the 2014–15 results led to several relative standard errors (RSEs) being withheld at the Indigenous regions by the ABS and we were not able to calculate confidence intervals (CIs) on these results. Although it would have been preferable to use ABS confidential unit record files via the Remote Access Data Laboratory, the Indigenous regions data item is not available through the ABS Microdata service.
The ABS advises that ‘only estimates with RSEs less than 25% are considered sufficiently reliable for most analytical purposes’.22 By calculating CIs in our analysis, we are able to show the effect of RSEs on smoking prevalence results.
Outcome
Current daily smoker for each individual was the outcome of interest. Both surveys categorised smoking status as either current daily smoker, weekly smoker, less than weekly smoker, ex-smoker or never smoked for adults, ≥15 years. For 2012–13, results were obtained directly from the ABS results.15 The results reported by the ABS included proportions and RSE. Data from the 2014–15 survey were constructed in ABS Table Builder, including weighted proportions and RSE. The RSE (where available) by Indigenous region was used to calculate the CIs to assess changes between the two surveys.
Geospatial and statistical analysis
To create maps of smoking prevalence, the prevalence results were linked with ABS Indigenous regions25 based on the 2011 Australian Statistical Geography Standard and mapped using ArcGIS (Esri, NY, USA). The ABS Indigenous regions provide finer geographical analysis that is specific for analysis of Aboriginal and Torres Strait Islander regions. To account for the large standard errors and to achieve a more accurate point of comparison, the maps used 20% intervals between current daily smoking prevalence levels (e.g. 21–40%, 41–60%, 61–80%). In total, six maps were created, three from the 2012–13 NATSIHS data and three from NATSISS 2014–15 data. The analysis of total smoking prevalence was also stratified by sex.
From these results, 95% CIs were calculated using the following formulas:


Results, including prevalence and CIs, were graphed using Microsoft (Armonk, NY, USA) Excel to assess significant changes in prevalence across the two survey periods.
Ethics approval was provided by the Human Research Ethics Committee in the Australian Government Department of Health (4/2016).
Results
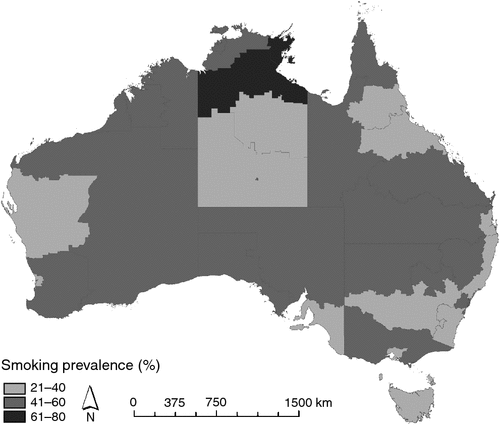
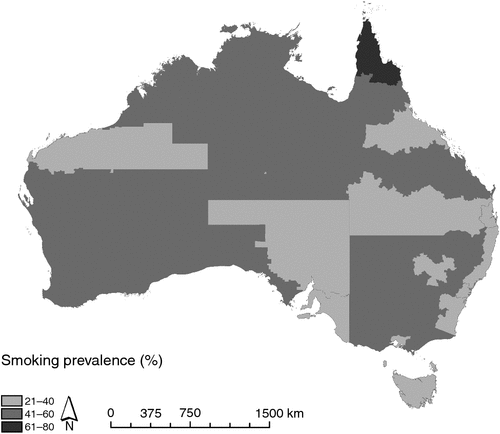
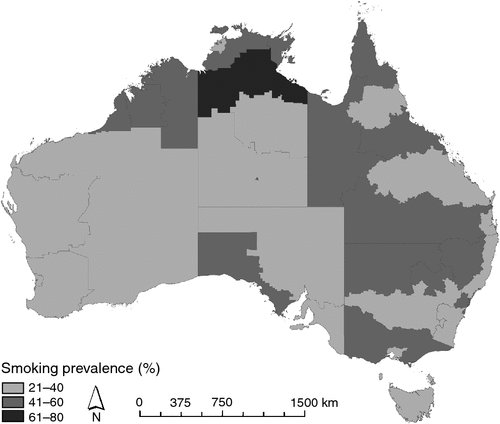
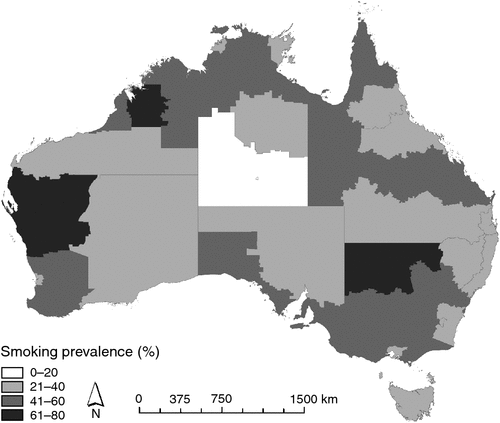
In 2012–13 the smoking prevalence for Aboriginal and Torres Strait Islander adults ranged from 28.4% (95% CI 20.8–36.0) in the Australian Capital Territory to 68% (95% CI 58.1–77.9) in the Katherine region, Northern Territory. In comparison, the 2014–15 maps show that the Cape York region, in Queensland, had the highest smoking prevalence of 62.9% (95% CI 47.5–78.3), whereas the lowest was in the Toowoomba–Roma region at 27.1% (95% CI 18.9–35.3; Figs 1, 2; Table 1).
|
|

|
Regions with the highest proportions of daily smokers are located in northern remote areas. For example, the highest rates are in remote areas of northern Australian, including, in 2012–13, the West Kimberly region (59%; 95% CI 54.1–64.1), the Katherine region (68%; 95% CI 58.1–77.9) and the Nhulunbuy region (61.5%; 95% CI 52.8–70.2) and, in 2014–15, in Cape York (62.9%; 95% CI 47.5–78.3). The lower rates of smoking were found in urban areas, including, in 2012–13, the ACT (28.4%; 95% CI 20.8–36.0) and the Melbourne region (33.7%; 95% CI 26.2–41.2) and, in 2014–15, in Toowoomba (27.1%; 95% CI 18.9–35.3) and Brisbane (32.61%; 95% CI 23.3–42.0). The maps show that smoking prevalence is generally high across all jurisdictions (and, as previously reported,3 much higher than in non-Indigenous populations), ranging from 27.1% (95% CI 18.9–35.3) in the Toowoomba–Roma region in Queensland in 2014–15 to 68.0% (95% CI 58.1–77.9) in the Katherine region in the Northern Territory in 2012–13.
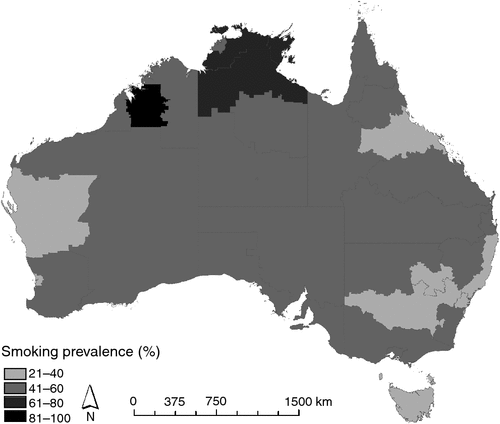
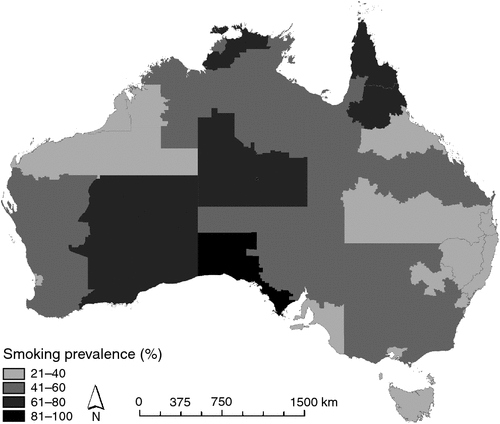
When stratified by sex, there were higher proportions of males smoking (e.g. 88.5% (95% CI 54.7–100.0) for males in the West Kimberly in 2012–13) compared with females across most regions (Table 1; Figs 3–6). The maps show a similar trend over time when stratified by sex, with women in non-remote areas smoking at higher rates than women in remote areas. However, the opposite is true for male smokers, with the highest smoking rates overall associated with males living in remote areas.
|
|
|
|
The graphs and data (Table 1; Fig. 7) present the prevalence rates and confidence intervals. Importantly, Fig. 7 demonstrates overlapping CIs, which are discussed below.

|
Discussion
Smoking prevalence results and trends over time
The high variability in smoking rates does not necessarily suggest an overall rate difference between the regions. The lack of statistical power is likely to have created inflated standard errors, which is indicated by the results in Table 1 and Fig. 7, including the large overlapping CIs.26 The results show that national survey data currently cannot be used to infer smoking prevalence change over time at the ABS Indigenous region level because of poor statistical power in sample sizes at the Indigenous region level.
Despite this, there is evidence in consistency of smoking prevalence trends observed over time. Sex is a key indicator for smoking rates, with a lower prevalence of women smoking in remote areas whereas smoking prevalence is highest for males in remote areas. The differences in smoking prevalence between males and females are consistent with 1994 results,21 suggesting that these trends are important, despite shortcomings in sample size.
Reporting improvements and suggestions
The present analysis has attempted to review the use of national survey data at the Indigenous region level to understand its value to policy and program development and evaluation of targeted Indigenous tobacco control. The analysis indicates that the small sample size greatly restricts the ability to establish changes in smoking prevalence at the regional level. Further, we were not able show differences over the two time periods, or compare between and within the Indigenous regions.
Although we can see a general trend that has continued since Cunningham’s maps,21 we would caution against using the maps in isolation. The maps used without statistics (particularly not referring to large CIs) are likely to distort population differences and regional differences when, in fact, overlapping CIs suggest any comparative differences in regions are not statistically significant.26 Using CIs is important when reviewing geospatially analysed data to increase accuracy in assessing that changes are different. We did try to reduce distortion with large intervals on the maps, but we still recommend reporting CIs when using or reviewing the maps.
Policy implications
A worthy question at this point in time would be to ask why conduct analysis at this level when it lacks statistical power? Further, survey designers may also argue that analysis was never meant to be conducted at this fine grain. However, therein lies a mismatch between the national survey data and policy and program delivery. The Australian Government’s Tackling Indigenous Smoking program is directed at regional tobacco control initiatives, so understanding regional prevalence and changes in prevalence in regions over time is important.
Policy and program requirements mean that a more fit-for-purpose sampling model is needed. A larger sample size at the region level would create greater statistical power at a level where important comparisons ought to be made. Determining regional levels of smoking matter when program resources are directed towards regional service provision and where the limited resources restrict broad national coverage.
In the case of tobacco use, the national survey data are the only available data to analyse smoking prevalence providing national coverage. It is important to use these data as a basis to understand the epidemiology of Indigenous smoking and regional differences. This could then guide the targeting of resource allocation, including targeted regional or community-based public health messaging to regions where smoking is endemic. A public health approach ultimately needs to define at-risk groups and areas, and to identify what is working, if programs are to be effective at a national scale. This is not only useful for governments, but also for those working in service delivery on the ground, particularly in community-controlled health organisations.
Options for improving data quality for regional analysis
The obvious solution is increasing sample sizes so that Indigenous region-level statistics can be assessed precisely. Critics are likely to argue that national survey sample size cannot be determined on the basis of one program area and we would tend to agree that this would be problematic. Obviously the present study has looked at application of survey data to evaluation of tobacco control. However, regional approaches to service delivery and implementation apply to many programs delivered to Aboriginal and Torres Strait Islander people and their communities, including employment, education and other health initiatives. It is therefore likely that a great number of Indigenous service delivery areas would benefit from greater statistical power and increased sample size in national surveys, enabling comparisons at the ABS Indigenous region-level over time. Further, analysis at this level may help provide evidence that population health messaging and programs with a targeted approach can be appropriate for very diverse heterogeneous populations, an issue of much contention in Aboriginal and Torres Strait Islander program delivery.27,28
We recognise that increasing sample size to ensure greater analysis at finer geographical scales is likely to be met with the groan of fiscal and budgetary constraints. Thomas,29 in his earlier analysis of national survey data at state and territory level, suggested that statistical power is unlikely to be achieved in survey data and argued for the inclusion of smoking questions in the national census. We tend to agree with Thomas’ suggestion, although note the time lag between the census every 5 years and attribution to programs outcomes would remain problematic. Hence, other opportunities that may help increase our detection of focus areas, gaps in service delivery or areas within significant rates of change may include the following:
-
Supplementary surveys. These may be particularly important in areas where there is a potential for much higher levels of smoking or in areas where there appears to be significant rates of change in smoking levels, in order to understand what may be contributing to change. Where possible, administrative data could also be drawn on, including tobacco sales.
-
Ongoing cohort study. Specifically, this could include cohort studies that have tobacco questions, including the Talking about the Smokes,30 the Longitudinal Study of Indigenous Children31 and Mayi Kuwayu longitudinal study.32
-
Release of microdata to allow for small area estimation or multilevel modelling.33 This suggestion is unlikely to need additional funding and could be expedited swiftly.
Importantly, ongoing cohort studies may be the most suitable approach, because previous research studies have shown that smaller sample sizes in cohort studies are able to replicate findings from large population health surveys with often higher levels of precision.34,35 Further, cohort studies can enhance the specificity of the results, including narrower CIs.34
Finally, if national survey data sample sizes cannot be increased to improve regional estimates, then an alternative is to supplement current data with more localised surveys in regions that appear to have high or low prevalence in smoking (e.g. 88.5% smoking prevalence in males in West Kimberley). Surveys could also be used where there is a perceived significant increase or decrease in smoking prevalence. These supplementary surveys (also referred to as sentinel surveillance) could contribute to not only understanding localised smoking prevalence and factors contributing to rate changes, but also to regional place-based evaluations of targeted interventions.
Conclusion
This study started with the aim of mapping smoking prevalence at the regional level. Although we have done this, we recommend caution in the interpretation of these results. The maps show a small number of Indigenous regions with very high smoking prevalence levels compared with others. However, the interpretability of the differences between individual regions is restricted because of wide CIs in the data. Further, our analysis within the regions over the two time periods does not show any statistically significant difference, even where there appears to be an overall rate difference in regions.
The problem primarily lies in small sample sizes and lack of statistical power at finer regional scales. Solutions to this problem can be found in either increasing sample sizes in national Aboriginal and Torres Strait Islander surveys such as NATSIHS and NATSISS, enhanced national cohort studies, inclusion of a smoking status question in the national Census (in addition to the release of microdata at the Indigenous region level to allow for small-area estimation using multilevel models) and supplementing existing data with more localised and regional surveys in targeted sites (sentinel surveillance) or administrative data on tobacco sales, where available.
Competing interests
None declared.
Acknowledgements
This work was undertaken for postgraduate requirements by Alyson Wright under the Masters of Philosophy Applied Epidemiology (MAE) at the National Centre for Epidemiology and Population Health, Australian National University. Alyson Wright was supported by a scholarship funded by the Australian Government Department of Health and project funding by the Training Programs in Epidemiology and Public Health Interventions Network. Alyson, a student, is based in the Indigenous Health Division of the Department of Health. The authors are particularly grateful to their colleagues Dr Helen Cameron (Department of Health) and Ms Sue Phillips (Australian Bureau of Statistics), who provided useful comments on a draft of the paper.
References
[1] Australian Bureau of Statistics (ABS). 4714.0 National Aboriginal and Torres Strait Islander social survey, 2014–15. Canberra: ABS; 2016.[2] Australian Bureau of Statistics (ABS). 4364.0.55.003 Australian health survey: updated results, 2011–2012. Canberra: ABS; 2013.
[3] Australian Bureau of Statistics (ABS). 4364.0.55.001 National health survey: first results, 2014–15. Canberra: ABS; 2015.
[4] Australian Institute of Health and Welfare (AIHW). Australian burden of disease study: impact and causes of illness and death in Aboriginal and Torres Strait Islander people 2011. Canberra: AIHW; 2016.
[5] Ring IT, Dixon T, Lovett RW, Al-Yaman F. Are Indigenous mortality gaps closing: how to tell, and when? Med J Aust 2016; 205 11–13.
| Are Indigenous mortality gaps closing: how to tell, and when?Crossref | GoogleScholarGoogle Scholar |
[6] Vos T, Barker B, Begg S, Stanley L, Lopez AD. Burden of disease and injury in Aboriginal and Torres Strait Islander peoples: the Indigenous health gap. Int J Epidemiol 2009; 38 470–7.
| Burden of disease and injury in Aboriginal and Torres Strait Islander peoples: the Indigenous health gap.Crossref | GoogleScholarGoogle Scholar |
[7] Vos T, Barker B, Stanley L, Lopez A. The burden of disease and injury in Aboriginal and Torres Strait Islander people 2003. Brisbane: University of Queensland; 2007.
[8] Australian Government. Joint media release: $1.6 billion COAG investment in Closing the Gap. 2008. Available at: http://www.health.gov.au/internet/ministers/publishing.nsf/Content/mr-yr08-nr-nr164.htm [verified 26 November 2016].
[9] Australian Institute of Health and Welfare (AIHW). National healthcare agreement: PB. 2014 Available from: http://meteor.aihw.gov.au/content/index.phtml/itemId/525831 [verified 26 November 2016].
[10] Australian Government. Joint media release with the Minister for Health and Ageing and the Minister for Indigenous Affairs – Rudd government tackles Indigenous smoking rates and health workforce in next down payments on Closing the Gap. Canberra: Department of Health and Ageing, Department of Indigenous Affairs; 2008. Available at: http://www.formerministers.dss.gov.au/15136/rudd-government-tackles-indigenous-smoking-rates-and-health-workforce-in-next-down-payments-on-closing-the-gap/ [verified 26 November.2016]
[11] Australian Government Department of Health. Department of Health-funded activities. Canberra: Department of Health; 2016. Available at: http://www.health.gov.au/internet/main/publishing.nsf/Content/indigenous-funding-lp [verified 26 November 2016].
[12] Australian Government Department of Health. Tackling Indigenous smoking (TIS) – regional tobacco control grants (2015–2018). 2016. Available at: http://www.health.gov.au/internet/main/publishing.nsf/Content/indigenous-tis-grants [verified 26 November 2016].
[13] Upton P, Davey R, Evans M, Mikhailovich K, Simpson L, Hacklin D. Tackling Indigenous smoking and healthy lifestyles programme review. Canberra: University of Canberra; 2014.
[14] Calma T. Tackling Indigenous smoking. Of Substance 2011; 9 28–9.
[15] Australian Bureau of Statistics (ABS). Australian Aboriginal Torres Strait Islander health survey: updated results, 2012–13. Canberra: ABS; 2013.
[16] Australian Bureau of Statistics (ABS). Tobacco smoking – 4727.0.55.006 – Australian Aboriginal and Torres Strait Islander health survey: updated results, 2012–13. Canberra: Australian Bureau of Statistics; 2013. Available at: http://www.abs.gov.au/ausstats/abs@.nsf/Lookup/by%20Subject/4727.0.55.006~2012%E2%80%9313~Main%20Features~Tobacco%20smoking~13 [verified 26 November 2016].
[17] Australian Health Ministers’ Advisory Council. Aboriginal and Torres Strait Islander health performance framework 2014 report. Canberra: Australian Government; 2015.
[18] Stevenson LC, Bohanna I, Robertson JA, Clough AR. Aboriginal people in remote communities in Arnhem Land (Northern Territory) restrict their smoking in some environments: implications for developing and implementing interventions to reduce exposure to environmental tobacco smoke. Drug Alcohol Rev 2013; 32 627–30.
| Aboriginal people in remote communities in Arnhem Land (Northern Territory) restrict their smoking in some environments: implications for developing and implementing interventions to reduce exposure to environmental tobacco smoke.Crossref | GoogleScholarGoogle Scholar |
[19] Thomas DP. Changes in smoking intensity among Aboriginal and Torres Strait Islander people, 1994–2008. Med J Aust 2012; 197 503–6.
[20] Robertson JA, Conigrave KM, Ivers RG, Hindmarsh E, Clough A. Addressing high rates of smoking in remote Aboriginal communities: new evidence for GPs. Aust Fam Phys 2013; 42 492–6.
[21] Cunningham J. Cigarette smoking among Indigenous Australians. Canberra: Australian Bureau of Statistics; 1997.
[22] Australian Bureau of Statistics. 4727.0.55.002 – Australian Aboriginal and Torres Strait Islander health survey: users’ guide, 2012–13. Canberra: Australian Government; 2013. Available at: http://www.abs.gov.au/AUSSTATS/abs@.nsf/Latestproducts/4727.0.55.002Appendix102012-13?opendocument&tabname=Notes&prodno=4727.0.55.002&issue=2012-13&num=&view= [verified 26 November 2016].
[23] Australian Bureau of Statistics. 4714.0 – National Aboriginal and Torres Strait Islander Social Survey, 2014–15. Available at: http://www.abs.gov.au/ausstats/abs@.nsf/mf/4714.0 [verified 16 November 2016].
[24] Australian Bureau of Statistics (ABS). 4706.0.30.001 – Maps and census profiles, Australian Indigenous geographical classification, 2006. Canberra: ABS; 2008. Available at: http://www.abs.gov.au/AUSSTATS/abs@.nsf/DetailsPage/4706.0.30.0012006?OpenDocument [verified 27 November 2016].
[25] Australian Bureau of Statistics (ABS). 4720.0 – National Aboriginal and Torres Strait Islander social survey: user guide, 2014–15. Canberra: ABS; 2016. Available at: http://www.abs.gov.au/ausstats/abs@.nsf/Lookup/by%20Subject/4720.0~2014-15~Main%20Features~About%20this%20Release~9999 [verified 26 November 2016].
[26] Cumming G. Understanding the new statistics. New York: Routledge; 2014.
[27] Gray D, Saggers S, Drandich M, Wallam D, Plowright P. Evaluating government health and substance abuse programs for indigenous peoples: a comparative review. Aust J Public Health 1995; 19 567–72.
| Evaluating government health and substance abuse programs for indigenous peoples: a comparative review.Crossref | GoogleScholarGoogle Scholar | 1:STN:280:DyaK283gtlWnsQ%3D%3D&md5=aa336446e6248ae911c26d6b5f7f62b8CAS |
[28] Hunt J. Engagement with Indigenous communities in key sectors. Canberra: Australian Institute of Health and Welfare; 2013.
[29] Thomas D. Smoking prevalence trends in Indigenous Australians, 1994–2004: a typical rather than an exceptional epidemic. Int J Equity Health 2009; 8 37
[30] Thomas DP, Briggs VL, Couzos S, Davey ME, Hunt JM, Panaretto KS, van der Sterren AE, Stevens M, Nicholson AK, Borland R. Research methods of Talking About The Smokes: an International Tobacco Control Policy Evaluation Project study with Aboriginal and Torres Strait Islander Australians. Med J Aust 2015; 202 S5–12.
| Research methods of Talking About The Smokes: an International Tobacco Control Policy Evaluation Project study with Aboriginal and Torres Strait Islander Australians.Crossref | GoogleScholarGoogle Scholar |
[31] Thurber K, Banks E, Banwell C. Cohort profile: footprints in time, the Australian Longitundinal Study of Indigenous Children. Int J Epidemiol 2015; 44 789–800.
| Cohort profile: footprints in time, the Australian Longitundinal Study of Indigenous Children.Crossref | GoogleScholarGoogle Scholar |
[32] Australian Institute of Aboriginal and Torres Strait Islander Studies. Mayi Kuwayu Longitundinal Study. 2016. Available at: http://aiatsis.gov.au/research/research-themes/health-and-wellbeing/mayi-kuwayu-longitudinal-study [verified 26 November 2016].
[33] Vidyattama Y, Tanton R, Biddle N. Small areas social indicators for the Indigenous population: synthetic data methodology for creating small area estimates of Indigenous disadvantage. Canberra: University of Canberra; 2013.
[34] Mealing NM, Banks E, Jorm LR, Steel DG, Clements MS, Rogers KD. Investigation of relative risk estimates from studies of the same population with contrasting response rates and designs. BMC Med Res Methodol 2010; 10 26
| Investigation of relative risk estimates from studies of the same population with contrasting response rates and designs.Crossref | GoogleScholarGoogle Scholar |
[35] Rothman KJ, Gallacher JE, Hatch EE. Why representativeness should be avoided. Int J Epidemiol 2013; 42 1012–14.
| Why representativeness should be avoided.Crossref | GoogleScholarGoogle Scholar |