Digital transformation of hospital quality and safety: real-time data for real-time action
Amy Barnett A B , Michelle Winning A B , Stephen Canaris C , Michael Cleary A C D E F , Andrew Staib A B and Clair Sullivan B G HA Princess Alexandra Hospital, 199 Ipswich Road, Woolloongabba, Brisbane, Qld 4102, Australia. Email: amy.barnett@health.qld.gov.au; michelle.winning@health.qld.gov.au; micheal.cleary@health.qld.gov.au; andrew.staib@health.qld.gov.au
B Clinical Excellence Queensland, Herston Road, Herston, Qld 4006, Australia.
C Metro South Hospital and Health Service, 199 Ipswich Road, Woolloongabba, Brisbane, Qld 4102, Australia. Email: stephen.canaris@health.qld.gov.au
D QEII Jubilee Hospital Network, Kessels Road, Mt Gravatt, Qld 4108, Australia.
E Faculty of Health and Behavioural Sciences, Medicine and Biomedical Sciences, University of Queensland, Qld 4072, Australia.
F School of Public Health. Queensland University of Technology, Ipswich Road, Woolloongabba, Brisbane, Qld 4102, Australia.
G Metro North Hospital and Health Service, Herston Road, Herston, Qld 4006, Australia.
H Corresponding author. Email: clair.sullivan@health.qld.gov.au
Australian Health Review 43(6) 656-661 https://doi.org/10.1071/AH18125
Submitted: 16 June 2018 Accepted: 29 August 2018 Published: 2 November 2018
Journal Compilation © AHHA 2019 Open Access CC BY-NC-ND
Abstract
The Australian Commission for Safety and Quality in Health Care has created the National Safety and Quality Health Service standards that all hospitals must address in order to remain accredited. This case study details the first known digitisation of the 10 national quality and safety standards mandated in a quaternary integrated digital hospital. A team of clinical informaticians, information technology experts and clinicians was assembled. Data were chosen and the data were then extracted and validated and presented (often in near real time) in an easily consumable dashboard format with appropriate governance to allow clinicians and executives to monitor the quality and safety standards across the hospital. All 10 standards were defined and extracted contemporaneously from the digital hospital for every patient, every time. This is in stark contrast with traditional retrospective point prevalence surveys. This case study details the first known fully digital accreditation in a sophisticated integrated digital hospital. Digitisation of hospital quality and safety to produce real-time data is the future of clinical redesign to improve patient care.
What is known about the topic? Healthcare delivery is complex and the ability of healthcare providers to maintain consistent standards of quality and safety is variable. Traditionally, these standards have been assessed by intermittent retrospective point-prevalence survey activity. Sophisticated digital hospitals provide the opportunity to develop data and analytics that monitor quality and safety standards across every patient, every time in near real time.
What does this paper add? This paper describes a digital hospital which has created streaming analytics to monitor live performance of quality and safety standards. The necessary skills, leadership and governance for this process are outlined and the products described.
What are the implications for practitioners? Shifting from retrospective paper-based point prevalence surveys to a digital platform has several implications. Firstly, it is an imperative to drive digital transformation of Australian hospitals. Secondly, it provides data for intervention to the hospital staff, so that issues can be addressed and improved in real-time, rather than waiting for survey results. Lastly, this new model of maintaining quality and safety also requires the development of new skills in the hospital setting including data literacy, digital clinical governance and clinical informatics.
Introduction
Delivering health care is complex, and maintaining the quality and safety of care can be challenging. It is estimated over 500 000 hospital-acquired adverse events occur every year in Australia, equivalent to approximately 6.7 events for every 100 hospitalisations.1 These errors contribute to avoidable morbidity and mortality in patient populations.1–3
The Australian Commission for Safety and Quality in Health Care has created the National Safety and Quality Health Service standards that all hospitals must address in order to remain accredited.4 These standards are endorsed by the Australian Health Minister’s Advisory Council and include safety and quality indicators such as pressure injuries, falls and cardiac arrests. Accreditation qualifies the hospital to receive funding. It is performed on a 2-yearly cycle, with accreditors examining performance across the 10 standards and assessing adequacy.4
Hospital quality and safety systems use the framework of the 10 standards to assess performance. Manual data collection and point prevalence surveys with retrospective reporting of compliance have been the traditional methodology.5 This type of activity is expensive and time-consuming. The data are also difficult to action because they are provided retrospectively and do not always reach frontline clinicians.
The index hospital recently underwent a deep digital transformation to roll out an integrated electronic medical record (ieMR).6 The advent of an integrated medical record that amassed rich clinical data linked across a patient’s healthcare journey challenged the organisation to examine traditional quality and safety monitoring and to leverage the sophisticated digital platform to improve patient care.7
The team hypothesised that the use of streaming analytics from a sophisticated digital hospital would provide data for hospital accreditation and, perhaps more importantly, provide data to clinical teams in near real time to improve patient care. The aim of this project was to deliver safety and quality data in near real time to the hospital executive and clinicians to facilitate better patient care.
Setting
This work was undertaken in a large academic quaternary hospital that had a Healthcare Information Management Society Electronic Medical Record Adoption Model Level 6 accreditation evidencing a deep and integrated digital transformation.8 The ieMR included clinical documentation, integrated vital sign monitoring and electrocardiographs, electronic physician order entry, electronic medication management and decision support.
Methods
This project was completed over an intensive 6-month period with dedicated clinical informaticians and information technology (IT) resources, as well as quarantined clinician time. Principles of scalability and sustainability underpinned the development of the analytical solution. The work aimed to be scalable by leveraging data elements that existed within the ieMR or other mandatory collections. These could be applied to multiple geographical sites and patient cohorts. Data collection was automated, where possible, to avoid additional burden to clinicians or workflow processes.
The following steps were undertaken by a team of clinical informaticians with the support of the IT department and hospital executive team.
Current state analysis
A current state analysis was completed for each of the 10 national standards. This included compliance reporting requirements for the national safety standards, mandatory reporting requirements at both state and national levels, evidence-based practice (including literature review and published clinical guidelines), cataloguing individual ieMR data elements and linked systems, current reporting and data sources within the organisation and documentation and workflow practices associated with reporting requirements.
Data item selection
A working group of subject matter experts, clinicians and clinical informaticians identified clinically relevant, evidence-based metrics that were defined, reproducible and comparable across multiple health services organisations. Data item selection was based on the following criteria: high-impact data related to high-volume and high-risk areas of patient care; information that would assist clinicians in mitigating patient risk; information that should assist in future health service planning; evidence-based outcome and process measures; intervention is possible to improve outcomes; clinically relevant and able to be easily consumed by clinical staff; and consistency and reliability of data documentation and capture.
Data extraction
Data extraction was achieved using a ‘pair programming’ approach of data analyst–clinical informatician and clinician exploring data extracts and defining elements. Data specifications relating to each individual metric were developed, including identification of each data element required and their location and data cell within the ieMR tables or other relevant database. This included identification of the clinician data entry point to match the right data to the right metric.
Once the data elements were defined, the frequency of data refresh was determined and the code written. Data specifications for each metric were translated into technical data extracts using Cerner command language (CCL) and structured query language (SQL). Some data required manual extraction and integration. The data were stored, transformed and linked in an SQL data warehouse, with automated and regular data refresh feeds scheduled.
Data validation
The data extracted were clinically validated by the working group. Clinical validation involved looking for false positives (assessing the accuracy of the data extracted) and false negatives (reviewing the patient’s chart to identify whether any omissions are present from the dataset) and ‘false negative’ sweeps of in-patient wards to ensure data extracts were complete and no patients were omitted. This was an intensive iterative process that continued until no discrepancies or omissions were identified. This process was vital to achieving clinically accurate meaningful and relevant data.
Creation of analytical products
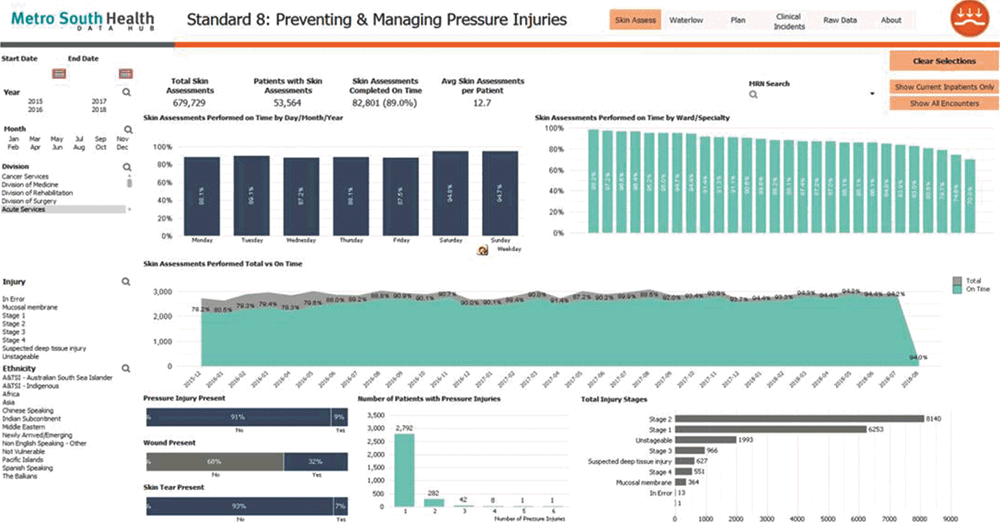
Ten national standard dashboards were developed with data displays designed to be accurate, relevant, accessible and easily consumed by the end-user for application to clinical practice.9
Visual displays of the data were built by data analysts in partnership with the clinical owners and end-user clinicians. This partnership model is based on codesign principles.10 A business intelligence tool was used to visually display data in a clinically meaningful way with logic application to support data analysis.11
Governance
Each standard within the organisation had an executive committee responsible for hospital oversight and performance. Governance of each dashboard was given to the corresponding hospital committee. The committee assumed the responsibility for monitoring the data, acting on the insights created and escalating through usual hospital governance structures. The chair of the relevant committee became the clinical owner of the work. Clinical owners were responsible for assigning appropriate access to users and defining distribution pathways for the dashboards.
Operationalising the analytics
The successful integration of clinical analytics into the hospital environment required a combination of technical and transformative support. The technical component involved translating the technical specifications of the data and analytics product, whereas the transformation component consisted of working with clinicians collaboratively to support them through the associated cultural shift, establishment of appropriate governance and transition into executive and clinical workflows.
Each dashboard was formally commissioned with clinical owners being briefed on the need for ongoing data validation, data security and the process of escalation for issues identified using the analytics. Commissioning required an implementation plan with a minimum inclusion of a defined and endorsed workflow. Staff were upskilled in digital literacy through education sessions focused on dashboard functionality. This included demonstrations of how to interrogate data for clinical insights, such as identification of high-priority case reviews.
Results
The hospital used these products in parallel with traditional Australian Council of Healthcare Standards preparations for the accreditation visit in 2017. To our knowledge, this was the first time streaming clinical analytics for the 10 safety and quality standards have been used in an Australian health facility and contributed to the successful reaccreditation of the hospital. An example of the dashboards is shown in Fig. 1.

|
The national standard dashboards enabled the index hospital to interrogate clinical data in real time in response to surveyor queries, and therefore demonstrate compliance with the standards. Key outcomes from the survey report are summarised below:12
The accessibility of patient safety data in real time and in safety focussed dashboards allows the clinicians and managers to identify safety and quality indicators and facilitate timely interventions and continuous monitoring and evaluation. (p. 6)
The transparency and timeliness of performance data facilitated by the digital transformation supports clinical decision making and timely interventions and informs committees. (p. 11)
The analytics are facilitating the development of new and innovative models of practice and are associated with increased compliance with the recommended standards. It is too early to claim large-scale improvement due to the analytics; this is expected to take some time as the insights from the data are acted upon.
Constraints
Live clinical streaming analytics is pioneering technology. We were unable to find literature detailing the process so had to develop our methods de novo. This involved investment in resources and effort. With the reworking of the current standards into a new format, some revision of the existing dashboards will be required, but most data elements will remain unchanged.
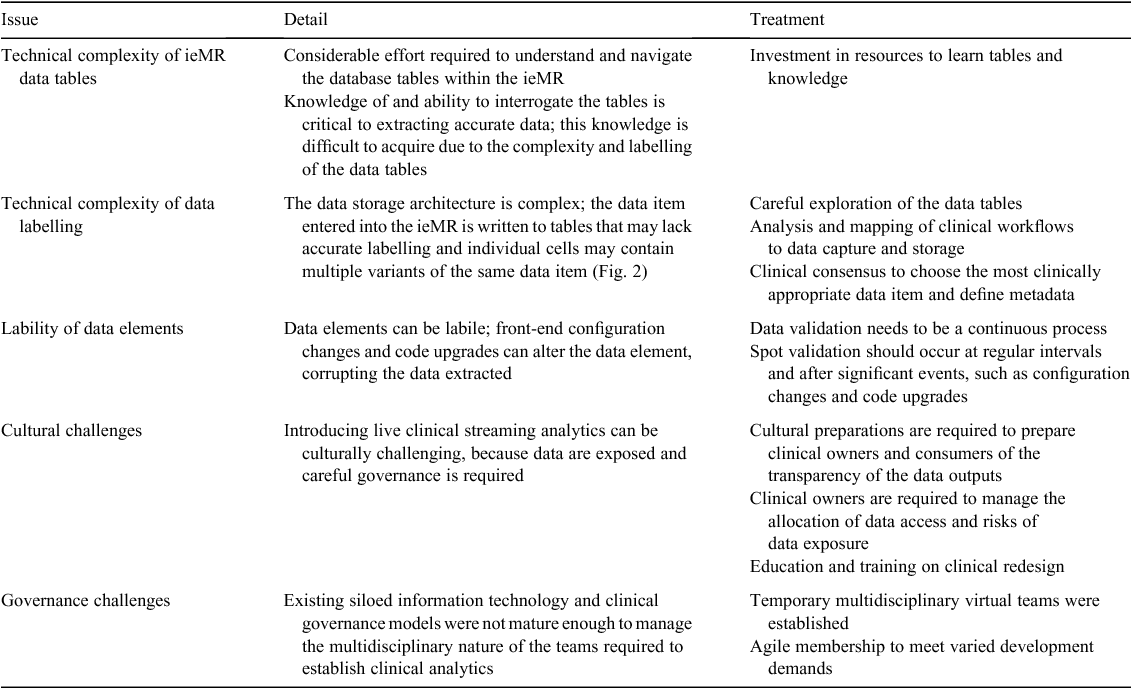
Significant challenges were encountered during this case study and the lessons learned are summarised in Table 1.

|

|
Discussion
Such sophisticated use of near real-time clinical data for accreditation is in stark contrast with traditional reporting presented to accreditors. Table 2 outlines the comparison between the two.

|
To the best of our knowledge, this is the first live streaming clinical analytics platform facilitating clinicians to improve the quality and efficiency of care across the 10 federally endorsed hospital standards.
The key to success for this project was true clinical ownership. The clinical teams validated their own data and created their data views. They took ownership of the data and were prepared to action the insights that were generated. This project may have failed if these dashboards were simply imposed upon clinicians as a performance management tool by the hospital executive, rather than provided as a quality improvement tool created by clinicians for their own use.
Clinical informaticians with a diverse skill set, including qualifications in clinical data and analytics, project management and health informatics, acted as ‘boundary spanners’ and translated between the clinicians and healthcare systems and IT.13 With an understanding of both clinical and technical requirements, this role bridged the health care and technical divide and translated clinical requirements into a format that was able to be converted into technical specifications.
Multiple technical roles within the team underpin a core part of the overall delivery of the project outputs. Developers with a niche understanding of ieMR database design and structure are vital to conducting database analysis and data extraction, integration and transformation. Data analysts with contextual awareness of the healthcare environment play a key liaison role, to understand clinical requirements and specifications, business rules and logic and translate these into the design and build of visual analytic tools. Analysts apply specific skills and effort to ensure the aesthetic design and build of the analytic outputs optimises the consumption and interrogation of the data presented. The clinical governance and effective action on insights from the data are equally challenging and under development.
The true ability to transform practice does not come from the analytic solution itself; instead, transformation occurs when the analytics are integrated into practice and used by the clinical workforce to mitigate and manage patient risk and to improve the quality, safety and efficiency of care. Without this clinical translation, the tool itself has minimal effect.
Future directions include presentation of the data to individual clinicians at the point of care and moving from the current descriptive analytics to predictive and then prescriptive analytics. The aim will be to move quality and safety improvement from the current ‘break–fix’ model to a ‘predict–prevent’ model. Improving the quality and safety of care is essential if our system is to remain sustainable, and digital platforms provide a perfect vehicle for significant data-driven improvements at scale to improve outcomes for our patients.
Competing interests
None declared.
Acknowledgements
The authors acknowledge those who contributed input and feedback, which have been invaluable to the development of these dashboards, specifically Michael Zanco and the Clinical Excellence Division of Queensland Health, E Health Queensland, Metro South Hospital and Health Service Executive and Clinicians and the Metro South Clinical Informatics Team. This case study did not receive any specific funding.
References
[1] Australian Institute of Health and Welfare (AIHW). Australia’s health 2016: safety and quality of Australian hospitals. Australia’s health series 2016; no. 15. Canberra: AIHW; 2016. Available at: https://www.aihw.gov.au/getmedia/3876a585-9a48-4553-8939-59711f1aa573/ah16-6-14- safety-quality-australian-hospitals.pdf.aspx [verified 26 May 2018].[2] Makary MA, Daniel M. Medical error-the third leading cause of death in the US. BMJ 2016; 353 i2139
| Medical error-the third leading cause of death in the US.Crossref | GoogleScholarGoogle Scholar |
[3] Braithwaite J. Changing how we think about healthcare improvement. BMJ 2018; 361 k2014
| Changing how we think about healthcare improvement.Crossref | GoogleScholarGoogle Scholar |
[4] Australian Commission on Safety and Quality in Health Care (ACSQHC). National safety and quality health service standards, September 2012. Sydney: ACSQHC; 2012. Available at: https://www.safetyandquality.gov.au/wp-content/uploads/2011/09/NSQHS-Standards-Sept-2012.pdf [verified 6 September 2018].
[5] Australian Commission on Safety and Quality in Health Care (ACSQHC). Resources to implement the NSQHS Standards (first edition). Sydney: ACSQHC. 2012 Available at: https://www.safetyandquality.gov.au/our-work/assessment-to-the-nsqhs-standards/resources-to-implement-the-nsqhs-standards/#Monitoring-tools [verified 20 September 2018].
[6] Sullivan C, Staib A, Ayre S, Daly M, Collins R, Draheim M, Ashby R. Pioneering digital disruption: Australia’s first integrated digital tertiary hospital. Med J Aust 2016; 205 386–9.
| Pioneering digital disruption: Australia’s first integrated digital tertiary hospital.Crossref | GoogleScholarGoogle Scholar |
[7] Sittig DF, Singh H. Electronic health records and national patient-safety goals. N Engl J Med 2012; 367 1854–60.
| Electronic health records and national patient-safety goals.Crossref | GoogleScholarGoogle Scholar |
[8] HiMMS Analytics Asia Pacific. Stage 6 hospitals. Singapore: HiMMS Analytics Asia Pacific; 2018. Available at: http://www.himssanalyticsasia.org/emram/stage6hospitals.asp [verified 6 September 2018].
[9] Duckett S, Jorm C. Strengthening safety statistics: how to make hospital safety data more useful. Melbourne: Grattan Institute; 2017. Available at: https://grattan.edu.au/wp-content/uploads/2017/11/893-strengthening-safety-statistics.pdf [verified 6 September 2018].
[10] Stadler JG, Donlon K, Siewert JD, Franken T, Lewis NE. Improving the efficiency and ease of healthcare analysis through use of data visualization dashboards. Big Data 2016; 4 129–35.
| Improving the efficiency and ease of healthcare analysis through use of data visualization dashboards.Crossref | GoogleScholarGoogle Scholar |
[11] Raghupathi W, Raghupathi V. Big data analytics in healthcare: promise and potential. Health Inf Sci Syst 2014; 2 1–10.
[12] The Australian Council on Healthcare Standards. ACHS EQuIpNational organisation wide survey: Princess Alexandra Hospital. Brisbane: ACHS; 2017.
[13] Dalrymple PW. Data, information, knowledge: the emerging field of health informatics. Bull Am Soc Inf Sci Technol 2011; 37 41–4.
| Data, information, knowledge: the emerging field of health informatics.Crossref | GoogleScholarGoogle Scholar |


