Automatic detection of multiple UXO-like targets using magnetic anomaly inversion and self-adaptive fuzzy c-means clustering
Gang Yin 1 2 Yingtang Zhang 1 Hongbo Fan 1 Guoquan Ren 1 Zhining Li 11 The Seventh Department, Mechanical Engineering College, No. 97, Hepingxilu Road, Shijiazhuang 050003, China.
2 Corresponding author. Email: gang.gang88@163.com
Exploration Geophysics 48(1) 67-75 https://doi.org/10.1071/EG14126
Submitted: 2 January 2015 Accepted: 3 November 2015 Published: 11 December 2015
Abstract
We have developed a method for automatically detecting UXO-like targets based on magnetic anomaly inversion and self-adaptive fuzzy c-means clustering. Magnetic anomaly inversion methods are used to estimate the initial locations of multiple UXO-like sources. Although these initial locations have some errors with respect to the real positions, they form dense clouds around the actual positions of the magnetic sources. Then we use the self-adaptive fuzzy c-means clustering algorithm to cluster these initial locations. The estimated number of cluster centroids represents the number of targets and the cluster centroids are regarded as the locations of magnetic targets. Effectiveness of the method has been demonstrated using synthetic datasets. Computational results show that the proposed method can be applied to the case of several UXO-like targets that are randomly scattered within in a confined, shallow subsurface, volume. A field test was carried out to test the validity of the proposed method and the experimental results show that the prearranged magnets can be detected unambiguously and located precisely.
Key words: inversion, magnetic gradient tensor, magnetometry, multiple dipole sources.
Introduction
Detection, localisation and classification (DLC) of unexploded ordnance (UXO) over large contaminated areas is an important and challenging task in military and non-military sites worldwide (Li et al., 2013). Low false-alarm rates and a high probability of detection can be achieved through the inversion of static magnetic data when there is only an isolated UXO target (Billings and Herrmann, 2003). Detection becomes a laborious and time-consuming process for UXO cleanup when there are many UXO and/or when the UXO are at significantly different depths (Billings and Herrmann, 2003), due to interference between anomalies from neighbouring targets, and geological and instrumental noise.
Hansen and Simmonds (1993) proposed multiple-source Werner deconvolution for the 2D inverse problem of magnetic targets. Hansen and Suciu (2002) generalised the Euler deconvolution method to the multiple source case and implemented an algorithm for 3D magnetic bodies. Because the multiple-source Euler deconvolution method requires higher-order derivatives of the magnetic field, Hansen (2005) proposed use of 3D multiple-source Werner deconvolution, which requires only first-order derivatives. In principle these methods can be adapted to detect UXO targets. However, a major drawback of these algorithms is that the number of magnetic targets needs to be defined before the actual computation and this is not well defined in real applications. Mikhailov et al. (2003) presented a technique for selecting the best Euler solutions on the basis of a topological and geometrical approach to outline the lateral extent of causative bodies and provide more reliable estimates of their depth. Ugalde and Morris (2010) used a kernel density distribution algorithm to filter uncorrelated Euler solutions and a fuzzy c-means clustering algorithm was used to obtain the centres of clusters to estimate the geologic strike of the anomalous sources. Although the method was designed to determine geologic strike, it can potentially be adapted for UXO detection and discrimination.
For the inversion problem of multiple UXO targets, Billings and Herrmann (2003) proposed an automated detection algorithm to estimate both the position and scale of dipole peaks utilising the multi-resolution properties of wavelets. Davis et al. (2010) developed the extended Euler deconvolution for the automatic detection of putative UXO anomalies, and used the inversion results within different sliding windows to estimate locations and structural index (SI). The estimated SI is used to distinguish source types. These two different methods can provide good detection and discrimination.
In this paper, we propose an alternative technique that is based on magnetic anomaly inversion and self-adaptive fuzzy c-means clustering (SAFCM). In the magnetic anomaly inversion stage, we obtain approximate locations instead of aiming for exact inversion results. Although these initial locations have some scatter about actual source locations, they form dense clouds around the real position of each magnetic source. Then SAFCM is proposed to cluster these approximate solutions, according to the horizontal coordinates of the initially estimated locations, to definitively determine the number of magnetic sources. Finally, each cluster centroid provides an accurate horizontal location for the corresponding magnetic target.
Magnetic anomaly inversions
When there are many magnetic sources in the field site and they are at significantly different depths, obtaining accurate and precise locations using magnetic anomaly inversion is a laborious and time-consuming process (Billings and Herrmann, 2003). For this reason, we divide this problem into two steps. The first step of our detection method inverts magnetic vector and gradient tensor data for the approximate locations of magnetic sources. The following stage identifies the clusters, to determine the number of sources, and calculates more accurate locations for the source associated with each cluster. Of course, to obtain good results, we recommend using the best and most appropriate algorithm for the first stage. Although we only investigate two different inversion methods in this paper, other magnetic anomaly inversion methods can also be used for the first stage.
Euler deconvolution
Euler deconvolution has become a standard tool to help interpretation of potential field data in terms of depth and geological structure. The method was developed by Thompson (1982) to interpret 2D potential field anomalies and extended by Reid et al. (1990) to be used on grid-based data. After that, the Euler approach was applied to 3D grids (Silva and Barbosa, 2003), and to gravity gradient tensor measurements (Zhang et al., 2000). Nara et al. (2006) derived a set of linear equations, essentially equivalent to the Euler deconvolution method, that relate dipole location to components of the magnetic field vector and elements of the corresponding magnetic gradient tensor at a single measurement point. It is commonly accepted that a magnetic source may be considered as a magnetic dipole if the distance between the source centre and the measurement point is at least 2.5 times larger than the largest dimension of the source. In most cases UXO-like targets satisfy this criterion, so the Nara method is applicable for localisation of such targets.
As shown by Nara et al. (2006), for a point dipole source the anomalous magnetic field vector B = [BxByBz ]T and the anomalous magnetic gradient tensor G at measurement point r1 = (x1, y1, z1)T are related by

where r0 = (x0, y0, z0)T is the position of the magnetic dipole.
From Equation 1, we can calculate the position of the magnetic dipole relative to the known measurement point. Although the existing implementation of the Nara method (Nara et al., 2006) is limited to a single source at a single measurement point, we tested its generalisation to the case of multiple dipoles.
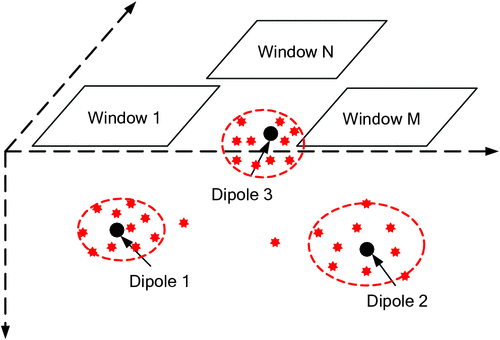
The Window-Nara method of this paper applies Equation 1 to groups of neighbouring data points, within a sliding window (see Figure 1). If n measurement points lie within the sliding window, the Window-Nara method generates the following overdetermined matrix equation:
|

where G1, ···, Gn denote the measured magnetic gradient tensor and B1, ···, Bn denote the measured magnetic field vectors in the sliding window, and (xi, yi, zi), i = 1, ···, n denote the coordinates of measurement points.
Equation 2 can be solved for the unknown coordinates (x0, y0, z0) using the least-squares method. As shown in Figure 1, measurements inside Window 1 are dominated by the effects of Dipole 1 relative to the other dipoles, due to the inverse distance cubed fall-off of the field and the 1/r4 fall-off of the gradient. The estimated (x0, y0, z0) is therefore taken to be the approximate position of Dipole 1. In a similar way, inversion of the measured data within the Window M yields an approximate position of Dipole 2. Moving the sliding window, we can obtain many groups of estimated locations which are shown as red dots in Figure 1. These estimated locations cluster in the vicinity of each magnetic dipole even when they do not group densely about the dipoles. Then we can estimate the accurate locations of magnetic dipoles by clustering these initial results in the following context.
Eigenvalue analysis
As an alternative to the Window-Nara method, eigenvalue analysis of the measured magnetic gradient tensor can be used in the detection of multiple UXO-like sources.
The magnetic gradient tensor is a symmetric real matrix, hence there are three real eigenvalues with corresponding eigenvectors that are mutually orthogonal (Pedersen and Rasmussen (1990)). The eigenvalues are independent of the orientation of the reference frame, so they are rotational invariants of the magnetic gradient tensor. In the 1970s, Wynn and Frahm (Wynn et al., 1975; Wynn, 1999) developed a method to determine both the direction to the dipole source and the magnetic moment vector, normalised by dividing by r4, from the eigenvalues and eigenvectors of the magnetic gradient tensor measured at a single point. Wilson (1985) derived an essentially equivalent algorithm, which is summarised in a more accessible publication by Schmidt et al. (2004). The Wynn-Frahm algorithm is outlined below, following the treatment given by Gamey (2008). Choose two eigenvalues λi and λj such that they have the following relationship:

Calculate the following intermediate variables:

The unit source-sensor displacement vector is then one of the four column vectors that comprise the 3 × 4 matrix given by

where V is a 3 × 3 matrix, the columns of which are eigenvectors of G.
Define the following variables:

For each of the four possible source-sensor directions defined by Equation 5, the unit vector along the magnetic moment direction is then the corresponding column vector within the 3 × 4 matrix given by

According to Equations 5 and 7, there is an inherent 4-fold ambiguity in solutions for direction to the dipole and orientation of its moment from eigenvalue analysis of magnetic gradient tensor. In practice, at least two ‘ghost’ solutions can be ruled out a priori (Clark, 2012). For example, if the magnetic source is known to lie below the sensor, the two ‘ghost’ solutions that are above the sensor can be eliminated. Furthermore, ‘ghost’ solutions obtained from different measurement locations are inconsistent, whereas correctly chosen solutions from different measurement points agree with one another, to a reasonable approximation, and can be identified on this basis. An approximate measurement of the anomalous field vector (or even simply the sign of its components) is sufficient to reject the ‘ghost’ solutions and remove ambiguity.
The Wynn-Frahm algorithm gives the direction to source and orientation of its moment. We propose a supplemental equation based on rotational invariants to calculate the distance to the source and the magnitude of its moment. The magnitude of the anomalous magnetic field vector and tensor magnitude of magnetic gradient tensor generated by a magnetic dipole can be calculated according the following equations (Wynn, 1999).

where |B| is the magnitude of the anomalous magnetic field vector, CT is the tensor magnitude, |·| stands for the Pythagorean norm, μ0 is the permeability of free space, R denotes the distance between the dipole source and the measurement point, and M denotes the magnitude of its magnetic moment. φ denotes the angle between the dipole moment vector and displacement vector which can be calculated as follows from the eigenvalues of the magnetic gradient tensor (Clark, 2012).

where λ2 is the intermediate eigenvalue (i.e. λ1 ≥ λ2 ≥ λ3), which has the smallest absolute value, since the eigenvalues sum to zero.
According to the measured magnitude of anomalous magnetic field vector and magnetic gradient tensor, R and M can be calculated from |B| and |G| using the eigenvalue analysis and Equation 8. Multiplying R and M by the unit vectors obtained from Equations 5 and 7 yields the location of the magnetic dipole and its magnetic moment vector. Although there is an inherent 4-fold ambiguity in obtaining solutions for dipole location and magnetic moment, this ambiguity can be resolved fairly easily in several ways (Clark, 2012) and the true solution is identifiable.
Of course, the aforementioned localisation method is designed for an isolated dipole source. We generalise it to the detection of multiple magnetic sources by using a sliding window. The positions estimated by eigenvalue analysis method will tend to cluster around magnetic sources when multiple magnetic sources exist in the detection area.
Vector measurements are relatively sensitive to orientation and these lead to the location errors for the Window-Nara method. Comparatively speaking, estimated locations based on the eigenvalue analysis method are more robust if we do not compensate accurately for variations of sensor orientation, because of the eigenvalue analysis method only uses the magnetic gradient tensor, as well as the field vector in the estimation of R and M. The reason that we propose two methods in this paper is to improve the robustness and reliability of the inversion results based on information redundancy.
Cluster analysis of solutions of magnetic anomaly inversion
Estimated locations based on the Window-Nara method and the eigenvalue analysis method cluster approximately in the vicinity of magnetic sources when multiple magnetic sources exist in the detection area. As shown in Figure 1, the centroid of each cluster can be used to estimate the location of magnetic sources.
Cluster analysis has been playing an important role in solving many problems and cluster number is the most important parameter (de Mantaras and Valverde, 1988). The clustering results may deviate from the true structure of the given datasets if the pre-defined cluster number is incorrect. So, the cluster number cannot be given in advance in real applications and it should be the optimal number found by the algorithm automatically.
Calculation of the optimal cluster number belongs to the problem of clustering validity. Many validity measures, for determining the most appropriate number of clusters, have been suggested in the literature. Some measures are based on partition index and partition entropy (Li and Mukaidino, 1995; Windham, 1982), while some are based on partition matrix and data (Xie and Beni, 1991). In this paper, based on the geometrical definition of clustering algorithm, we seek a criterion that maximises the inter-cluster distances, while minimising the intra-cluster distances. Accordingly, we choose the ratio of inter-cluster distances and the intra-cluster distances as the criterion of clustering validity. Then we define a new validity function to achieve SAFCM algorithm to cluster the initial locations.
Suppose that the estimated locations based on Window-Nara or eigenvalue analysis method are X = {xj, j = 1, ···, n}. The centroid of the complete solution set is defined as follows:

where c represents the number of clusters to be explored, m(1 < m < ∞) is the fuzzy weighting exponent whose value is set equal to 2, following Bezdek (1981), and uij denotes the membership degree of the jth sample belonging to the ith cluster centre. The initialisation of uij and its detailed updating process follow the procedure of Xie and Beni (1991).
The validity function is defined as follows:

where  denotes the coordinates of the ith cluster centroid.
In Equation 11, the numerator represents the weighted sum of the squared distances between individual cluster centroids and the overall centroids of the solution set, and the denominator represents the weighted sum of squared distances between individual solutions and each of the cluster centroids. c is the best cluster number when L(c) reaches its maximum value. Choosing initial values c = 2, L(c) = 0, and a termination threshold ε > 0 of the iterative process we can estimate the best cluster number by an iterative process described by Bezdek (1981) and Xie and Beni (1991).
Simulations
We tested the proposed method, using synthetic data generated from eight dipoles with random locations, orientations, depths and dipole moments. The depths ranged from 0.4 to 0.8 m, with dipole inclinations ranging between –90°and 90°, declination between –180°and 180°, and dipole moment varying between 10 and 20 Am2. The background geomagnetic field was assumed to be 5 × 10⁴ nT with inclination 55° and declination angle –5°. The magnetic field vectors and magnetic gradient tensor were calculated at 0.1 m grid spacing.
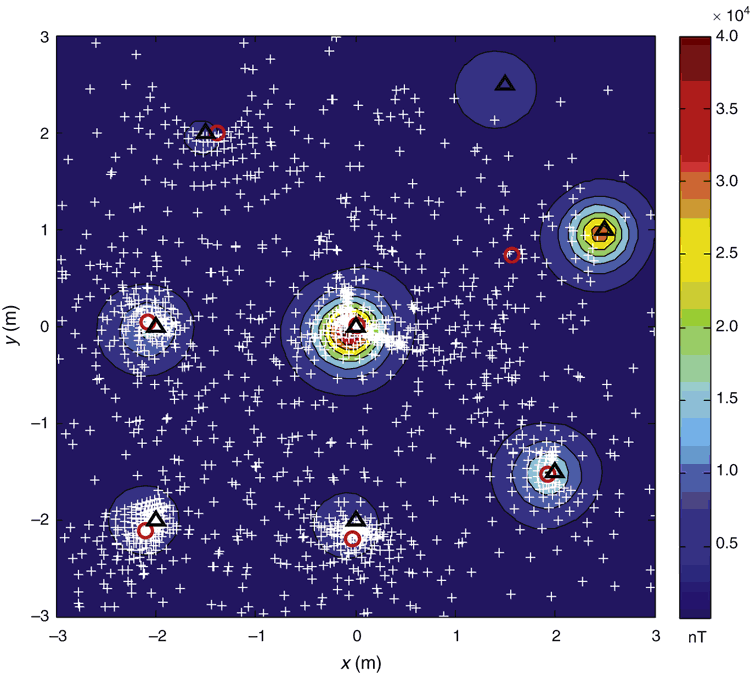
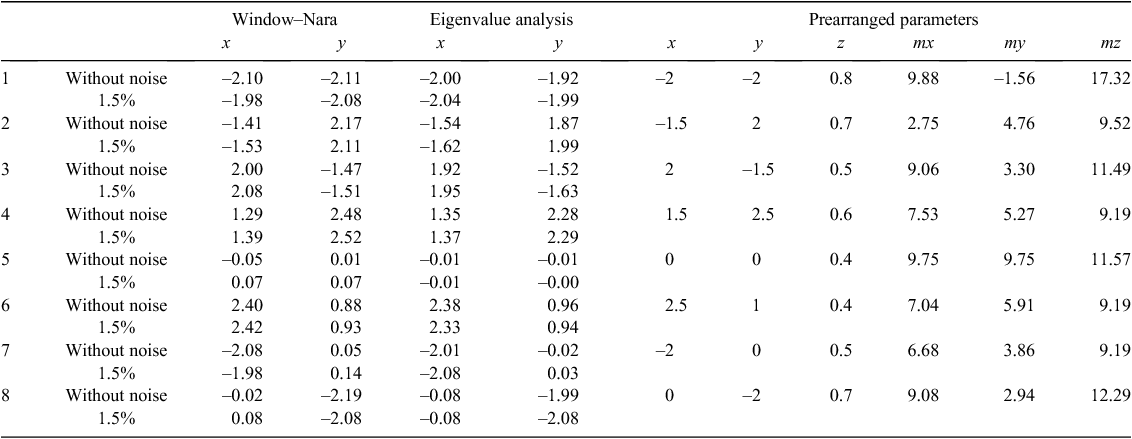
Figure 2 shows the solutions generated by applying the Window-Nara method to the synthetic dataset using a sliding window with 3 × 3 grid points. The inversion results show that solutions cluster around the causative sources. Since the potential field data is measured on a grid over the x-y plane, resolution of the x-y positions is better than the depth resolution. Unlike the cluster analysis of Ugalde and Morris (2010), which uses three dimensional coordinates, we only use x-y coordinates to cluster the locations. We obtained eight cluster centroids based on the SAFCM method and these are consistent with the prearranged number of dipole sources. Thus, we have detected all of the magnetic dipoles and the estimated positions are shown in Table 1. Although the proposed method is mainly used to calculate the horizontal positions, it can also be helpful to estimate depths. Combining the horizontal position and magnetic gradient tensor at some known measurement points, we can establish equations of magnetic moment and depth which can be estimated by solving the equations. Of course, due to the rapid fall-off rates of the magnetic field and gradient, the estimated depth and magnetic moment have larger errors than the horizontal positions.
|
We also applied the eigenvalue analysis method to the synthetic dataset. The detailed inversion results are shown in Figure 3 and Table 1. Figure 3 shows that the estimated initial positions of magnetic targets based on the eigenvalue analysis method are more numerous that those obtained using the Window-Nara method. This is because the eigenvalue analysis method is calculated based on the point-by-point analysis of magnetic gradient tensor, which produces ghost solutions as well as valid solutions. Again we obtained eight cluster centroids using the SAFCM method and these are also consistent with the prearranged number of dipole sources.
To simulate a more realistic case, we added Gaussian noise to the theoretical magnetic field vector and magnetic gradient tensor. The standard deviation of the Gaussian noise is the 1.5% of the maximum amplitude of the noise-free data. Then the estimated positions of magnetic dipoles are shown in Table 1. The simulation results show that the proposed method is robust in the presence of random noise.
The synthetic datasets have successfully demonstrated the proposed method for automatic picking of UXO-like anomalies. All of the targets have been detected. Because of the overlapping signals from neighbouring sources, there are some deviations between the true positions and estimated positions. According to Table 1, the maximum horizontal location error using the Window-Nara method is 21.1 cm. For the eigenvalue analysis method the maximum error is 26.6 cm.
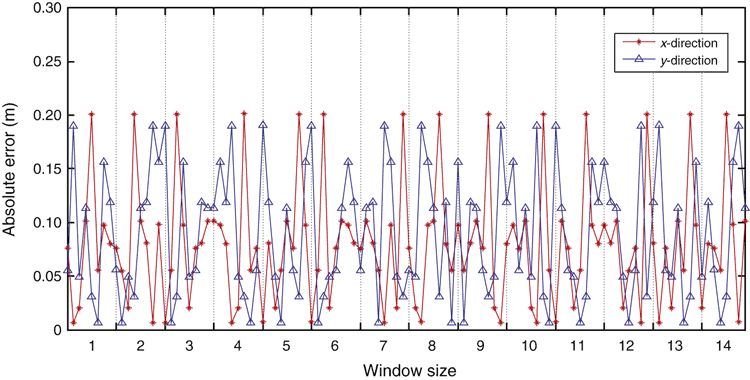
The estimated locations based on both magnetic anomaly inversion methods are affected by the grid spacing. In addition, the Window-Nara method is affected by the size of the sliding window. When the window width increases from 1 to 14, the Window-Nara method can detect all the existing eight dipoles and the location errors are shown in Figure 4. The horizontal axis denotes the window width of the sliding window. For each window width, there are eight points which denote the detected eight dipoles. Different values of eight points denote the estimated errors relative to the real positions and these errors appear to be random. The maximum difference is 20.1 cm in the x direction and the maximum difference in the y direction is 19.1 cm. When the width of the sliding window is increased to 15, only seven dipoles are shown in Figure 5. The top right dipole is missed. We note that the missed dipole is near a strong positive anomaly. This tends to mask the source of the weak anomaly because the Window-Nara method assumes only one source per window. So we need to select appropriate window sizes to observe different magnetic targets.
|
Application to real data
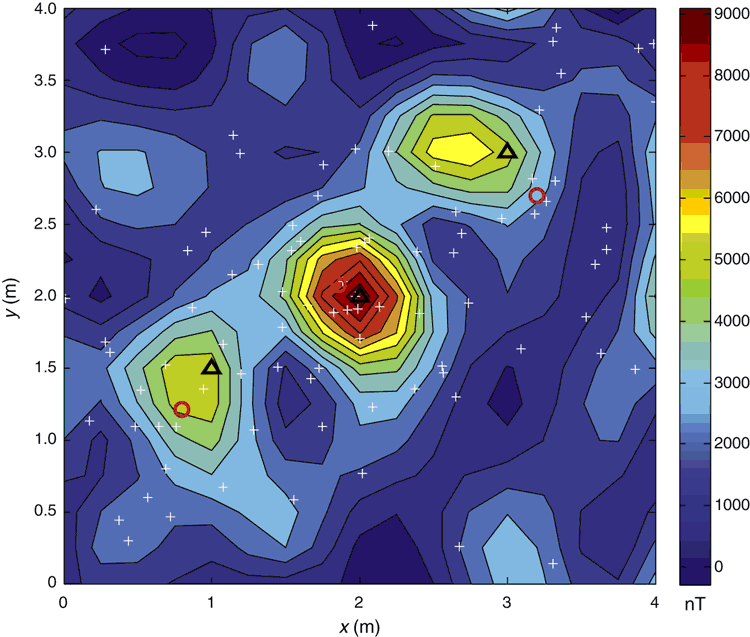
The reliability of detection will be strongly influenced by the both geological noise and measurement noise. The method was tested in a field trial with multiple UXO-like sources. The field test was carried out in Shijiazhuang, China, and the study area included three magnets which were placed on the ground. Strength of magnetic moments of the magnets are ~1–3 Am2. A cross magnetic gradient tensor system consisting of four fluxgate magnetometers (Yin et al., 2014) was used to measure magnetic vector and tensor components. Note that we did not install an inertial measurement unit to compensate for variations in orientation of the magnetic gradient tensor system. Figure 6 shows the experimental area and magnetometers array. Measurements were made over an area of 4 m × 4 m, the magnetic gradient tensor system had an observation height of 0.38 m above the ground surface and the spacing was 0.5 m along the measurement lines. Because the measured grid was not dense enough, we interpolated the data with a grid interval of 0.25 m. Then the inversion process was performed on a window of 17 × 17 grid points and the detection results based on the proposed method are shown in Figure 7 and Figure 8, and the actual and estimated positions are shown in Table 2.

|
According to the experimental results, we know that both proposed methods can achieve detection of magnetic targets. However, estimated errors of Window-Nara method are bigger than errors of the eigenvalue analysis method, due to errors in alignment of the measurement system, which introduces substantial errors in the measured vector components. The eigenvalue analysis method uses only the gradient tensor to estimate the unit source-sensor displacement vector and the unit magnetic moment direction, and the gradient tensor is much less sensitive to orientation errors than the field vector. Thus eigenvalue analysis gives more robust location estimates than the Window-Nara method.
This experiment shows that the proposed method has potential for the automatic picking of UXO-like anomalies for large datasets without human interaction. The trial detected all three prearranged magnets with acceptably small errors in estimated locations.
Conclusions
We have developed a method for automatically detecting multiple dipole-like sources using magnetic anomaly inversion and SAFCM without human interaction. The magnetic anomaly inversion focuses on the calculation of the approximate locations of the magnetic targets. Then self-adaptive FCM is used to obtain the number of the magnetic targets and the accurate locations.
Analysis of synthetic data showed that all of the dipole sources can be detected if the signal-to-noise ratio is sufficiently high. The estimated horizontal locations agreed well with the true locations. In a practical test of the proposed method, a set of three magnets was successfully analysed, with acceptably small location errors.
Acknowledgements
We thank Professor Zhiyong Shi for helpful discussions on the geomagnetic field measurement, and we acknowledge the assistance of the associate editors and the reviewers in improving the paper.
References
Bezdek, J. C., 1981, Pattern recognition with fuzzy objective function algorithms: Plenum Press.Billings, S. D., and Herrmann, F., 2003, Automatic detection of position and depth of potential UXO using continuous wavelet transforms: Proceedings of the SPIE Technical Conference on Detection and Remediation Technology for Mines and Minelike Targets, 1012–1022.
Clark, D. A., 2012, New methods for interpretation of magnetic vector and gradient tensor data I: eigenvector analysis and the normalized source strength: Exploration Geophysics, 43, 267–282
Davis, K., Li, Y., and Nabighian, M. N., 2010, Automatic detection of UXO magnetic anomalies using extended Euler deconvolution: Geophysics, 75, G13–G20
| Automatic detection of UXO magnetic anomalies using extended Euler deconvolution:Crossref | GoogleScholarGoogle Scholar |
de Mantaras, R. L. A., and Valverde, L., 1988, New results in fuzzy clustering based on the concept of indistinguishability relation: IEEE Transactions on Pattern Analysis and Machine Intelligence, 10, 754–757
| New results in fuzzy clustering based on the concept of indistinguishability relation:Crossref | GoogleScholarGoogle Scholar |
Gamey, T. J., 2008, Development and evaluation of an airborne superconducting quantum interference device-based magnetic gradiometer tensor system for detection, characterization and mapping of unexploded ordnance: SERDP Project MM-1316.
Hansen, R. O., 2005, 3D multiple-source Werner deconvolution for magnetic data: Geophysics, 70, L45–L51
| 3D multiple-source Werner deconvolution for magnetic data:Crossref | GoogleScholarGoogle Scholar |
Hansen, R. O., and Simmonds, M., 1993, Multiple-source Werner deconvolution: Geophysics, 58, 1792–1800
| Multiple-source Werner deconvolution:Crossref | GoogleScholarGoogle Scholar |
Hansen, R. O., and Suciu, L., 2002, Multiple-source Euler deconvolution: Geophysics, 67, 525–535
| Multiple-source Euler deconvolution:Crossref | GoogleScholarGoogle Scholar |
Li, R. P., and Mukaidino, M., 1995, A maximum entropy approach to fuzzy clustering: IEEE Transactions on Fuzzy Systems, 3, 227–232
Li, Y., Devriese, S. G. R., Krahenbuhl, R. A., and Davis, K., 2013, Enhancement of magnetic data by stable downward continuation for UXO application: IEEE Transactions on Geoscience and Remote Sensing, 51, 3605–3614
| Enhancement of magnetic data by stable downward continuation for UXO application:Crossref | GoogleScholarGoogle Scholar |
Mikhailov, V., Galdeano, A., Diament, M., Gvishiani, A., Agayan, S., Bogoutdinov, S., Graeva, E., and Sailhac, P., 2003, Application of artificial intelligence for Euler solutions clustering: Geophysics, 68, 168–180
| Application of artificial intelligence for Euler solutions clustering:Crossref | GoogleScholarGoogle Scholar |
Nara, T., Suzuki, S., and Ando, S., 2006, A closed-form formula for magnetic dipole localization by measurement of its magnetic field and spatial gradients: IEEE Transactions on Magnetics, 42, 3291–3293
| A closed-form formula for magnetic dipole localization by measurement of its magnetic field and spatial gradients:Crossref | GoogleScholarGoogle Scholar |
Pedersen, L. B., and Rasmussen, T. M., 1990, The gradient tensor of potential field anomalies: some implications on data collection and data processing of maps: Geophysics, 55, 1558–1566
| The gradient tensor of potential field anomalies: some implications on data collection and data processing of maps:Crossref | GoogleScholarGoogle Scholar |
Reid, A. B., Allsop, J. M., Granser, H., Millett, A. J., and Somerton, I. W., 1990, Magnetic interpretation in three dimensions using Euler deconvolution: Geophysics, 55, 80–91
| Magnetic interpretation in three dimensions using Euler deconvolution:Crossref | GoogleScholarGoogle Scholar |
Schmidt, P., Clark, D. A., Leslie, K. E., Bick, M., Tilbrook, D. L., and Foley, C., 2004, GETMAG- a SQUID magnetic tensor gradiometer for mineral and oil exploration: Exploration Geophysics, 35, 297–305
| GETMAG- a SQUID magnetic tensor gradiometer for mineral and oil exploration:Crossref | GoogleScholarGoogle Scholar |
Silva, J. B. C., and Barbosa, V. C. F., 2003, 3D Euler deconvolution: theoretical basis for automatically selecting good solutions: Geophysics, 68, 1962–1968
| 3D Euler deconvolution: theoretical basis for automatically selecting good solutions:Crossref | GoogleScholarGoogle Scholar |
Thompson, D. T., 1982, EULDP-new technique for making computer-assisted depth estimates from magnetic data: Geophysics, 47, 31–37
| EULDP-new technique for making computer-assisted depth estimates from magnetic data:Crossref | GoogleScholarGoogle Scholar |
Ugalde, H, and Morris, W. A., 2010, Cluster analysis of Euler deconvolution solutions: new filtering techniques and geologic strike determination: Geophysics, 75, L61–L70
| Cluster analysis of Euler deconvolution solutions: new filtering techniques and geologic strike determination:Crossref | GoogleScholarGoogle Scholar |
Wilson, H., 1985, Analysis of the magnetic gradient tensor: Defence Research Establishment Pacific, Canada, Technical Memorandum, 85–13, 47.
Windham, M. P., 1982, Clustering validity for fuzzy c-means clustering algorithms: IEEE Transactions on Pattern Analysis and Machine Intelligence, 4, 354–357
Wynn, W. M., 1999, Detection, localization, and characterization of static magnetic-dipole sources, in C. E. Baum, ed., Detection and identification of visually obscured targets: Taylor & Francis, 337–374.
Wynn, W. M., Frahm, C. P., Carroll, P. J., Clark, R. H., Wellhoner, J., and Wynn, M. J., 1975, Advanced super-conducting gradiometer/magnetometer arrays and a novel signal processing technique: IEEE Transactions on Magnetics, 11, 701–707
| Advanced super-conducting gradiometer/magnetometer arrays and a novel signal processing technique:Crossref | GoogleScholarGoogle Scholar |
Xie, X. L., and Beni, G., 1991, A validity measure for fuzzy clustering: IEEE Transactions on Pattern Analysis and Machine Intelligence, 13, 841–847
| A validity measure for fuzzy clustering:Crossref | GoogleScholarGoogle Scholar |
Yin, G., Zhang, Y., Fan, H., Zhang, G., and Ren, G., 2014, Linear calibration method of magnetic gradient tensor system: Measurement, 56, 8–18
| Linear calibration method of magnetic gradient tensor system:Crossref | GoogleScholarGoogle Scholar |
Zhang, C., Mushayandebvu, M. F., Reid, A. B., Fairhead, J. D., and Odegard, M. E., 2000, Euler deconvolution of gravity tensor gradient data: Geophysics, 65, 512–520
| Euler deconvolution of gravity tensor gradient data:Crossref | GoogleScholarGoogle Scholar |


 indicates real positions of magnetic dipoles, and the
  indicates estimated positions based on Window-Nara method and SAFCM.

