

Rates of sexual partner acquisition from nationally representative surveys: variation between countries and by age, sex, wealth, partner and HIV status
Clara Calvert A B # , Rachel Scott A # , Melissa Palmer A , Albert Dube C , Milly Marston A , Kaye Wellings D and Emma Slaymaker A *
A
B
C
D
Handling Editor: Martin Holt
Abstract
Knowing levels and determinants of partnership acquisition will help inform interventions that try to reduce transmission of sexually transmitted infections (STIs) including HIV.
We used population-based, cross-sectional data from 47 Demographic and Health Surveys to calculate rates of partner acquisition among men and women (15–49 years), and identified socio-demographic correlates for partner acquisition. Partner acquisition rates were estimated as the total number of acquisitions divided by the person-time in the period covered by the survey. For each survey and by sex, we estimated age-specific partner acquisition rates and used age-adjusted piecewise exponential survival models to explore whether there was any association between wealth, HIV status and partner status with partner acquisition rates.
Across countries, the median partner acquisition rates were 30/100 person-years for men (interquartile range 21–45) and 13/100 person-years for women (interquartile range 6–18). There were substantial variations in partner acquisition rates by age. Associations between wealth and partner acquisition rates varied across countries. People with a cohabiting partner were less likely to acquire a new one, and this effect was stronger for women than men and varied substantially between countries. Women living with HIV had higher partner acquisition rates than HIV-negative women but this association was less apparent for men. At a population level, partner acquisition rates were correlated with HIV incidence.
Partner acquisition rates are variable and are associated with important correlates of STIs and thus could be used to identify groups at high risk of STIs.
Keywords: Africa, Central America, Eastern Europe, epidemiology, HIV, sexual behaviour, sexual partners, South America, South Asia, STI.
Introduction
There is a substantial burden of sexually transmitted infections (STIs), which is largely concentrated in low- and middle-income countries. Worldwide, this includes 376 million new cases of curable STIs (chlamydia, gonorrhoea, trichomoniasis, and syphilis) annually,1 417 million prevalent infections of herpes simplex virus, type 2 (HSV-2),2 and, in 2022, 1.3 million new HIV infections and 630 000 HIV-related deaths.3 There have been substantial reductions in HIV infections in recent years, attributable to roll out of interventions including antiretroviral treatment (ART), voluntary medical male circumcision and pre-exposure prophylaxis.4–6 Despite this, the target of the UN General Assembly’s 2016 Political Declaration on Ending AIDS to reduce new HIV infections to fewer than 500 000 by 2020 was not achieved and countries are not on track to reach zero infections by 2030. Progress in reducing new infections of other STIs has stagnated in much of the world where there is continued reliance on syndromic management guidelines developed in the 1980s.1,7
Mathematical modelling has shown that stratifying prevention interventions by behaviour offers gains in both efficiency and infections prevented,8 but requires a metric that captures a group of individuals who are high risk. Structural and individual-level risk factors have been identified for HIV and other STIs, but it has not proved straightforward to use these to identify groups who would most benefit from interventions in terms of finding a balance between specificity and sensitivity. For example, interventions targeted at sex workers might omit those who do not yet identify as sex workers, while those targeted at all young women may redundantly deliver interventions to many young women who were never at risk. Mathematical models have been widely used to understand drivers of STI transmission and to assess the potential impact of interventions.9 These models typically incorporate parameters to describe the rates and patterns of contacts between people who are susceptible to STIs and those who are infected with, or infectious for, STIs.9–13 However, despite the acknowledged importance of rates of partner acquisition in determining the spread of STIs and HIV through populations, few studies have attempted to systematically quantify levels of partner change and assess how they differ between and within populations.14
Existing empirical studies have generally relied on relatively simple measures; for example, the number of people who have had a new partner in a given period of time (which disregards multiple acquisitions) or the number of people with more than one partner.15,16 We hypothesise that new partnerships may have a more important effect on STI transmission than multiple partnerships for behavioural, network and biological reasons. Behaviour is likely to differ between new and established partnerships due to differences in emotional connection, power balance, communication and ability to negotiate. The position in the sexual network is different for people who have a new partner than for those with an existing partner since, on average, they are more closely connected to others in the network at the start of the partnership. In a situation where everyone in the population was serially and mutually monogamous, the start of a partnership is the point in time when the partner has most recently had sex with another person. If this gap is smaller than the period of infectiousness, then there is a risk of STI transmission.17 Furthermore, for HIV, there may be a biological reason if alloimmunity to sexual partners protects against acquisition of infection. In South African couples, class 2 human leukocyte antigen antibodies (which are triggered by sexual contact) were associated with reduced odds of HIV seroconversion in exposed individuals.18 Therefore, at the start of a partnership, the levels of these antibodies may be lower.
Rates of new partnership formation have not been systematically estimated and compared between populations and the most recent review of global data on partnerships was in 2006.19 Measuring the incidence of new partnerships alongside the prevalence of recent partnerships could provide a more complete picture of population-level partnership dynamics. In our study, we used data from Demographic and Health Surveys (DHS) to conduct an updated review of the variation in the number of sexual partnerships reported by men and women in different countries. We calculated partner acquisition rates (PAR) to focus on the newest partnerships. We sought to compare PAR by characteristics that may be used to target STI prevention interventions: sex, age, wealth, current partner status and HIV status. To explore the utility of PAR as a means to identify groups at high risk of STIs, we assessed how they correlate with HIV incidence estimates at the population-level.
Materials and methods
We conducted secondary analyses of cross-sectional, nationally representative household surveys conducted by DHS since 2010 and estimated, for men and women, the rates at which new sexual partners were acquired and characteristics associated with variation in those rates.
Data sources
We obtained individual-level data from 60 low- and middle-income countries encompassing all DHS surveys conducted since 2010 that had collected data on sexual behaviour and where the individual-level data were available in December 2022. We retained the 47 surveys with sexual partnership history data for the 12 months preceding the interview. We used data from the most recent survey conducted since 2010 to estimate PAR.
All surveys used a stratified, clustered sample of households drawn from existing sampling frames to obtain a nationally representative sample of the population. Within each sampled household, men and women aged 15–49 years who had slept in the household the night before the survey were eligible for inclusion. All eligible women and a sample of eligible men were asked to participate in a face-to-face interview conducted by experienced interviewers. In India 2019 and Kenya 2014, the partnership histories were collected from women in only a sub-sample of households (15% and 50%, respectively). In two countries, Philippines and Tajikistan, data were collected only for women. In some surveys, the upper age limit was higher but we have restricted this analysis to 15–49-year-olds. Detailed methods for each survey and the questionnaires used are given in each survey’s final report which are available from DHS.20,21
For population-level comparisons with HIV incidence, we obtained from UNAIDS the most recent annual estimates for the incidence rate per 1000 men and women aged 15–49 years. For men and women, separately, we matched each country’s sexual behaviour estimate with the incidence estimate for the same year as the survey.
Outcome: partner acquisition rates
Acquisitions were defined as first sex with a given partner during the 12 months prior to the survey, which was reported by the respondent for each partner. A respondent could experience multiple outcomes within this period. Respondents were asked about the three most recent sexual partners during the past 12 months. Respondents were asked when they last had sexual intercourse (this partner being identified as the most recent). They were subsequently asked a series of further questions about this partner including their relationship to them (whether they were a spouse, live-in partner, boyfriend/girlfriend not living with respondent, casual acquaintance, client/sex worker or other type of partner) and how long ago they first had sex with them. They were then asked if apart from this person they had had sex with any other person in the past 12 months, and the same data were collected for up to three recent (within the past 12 months) partners. Respondents were asked how many people in total they had had sex with in the past 12 months.
Most respondents remained at risk throughout the 12-month period prior to the survey, unless there was nonsensical data (e.g. such as an acquisition reported after last sex with the partner) whereby person time following the last correctly reported acquisition was dropped from the analysis. If a respondent reported two partners in the 12 months preceding the survey, for example, and first sex with both partners took place within the 12 months, they would contribute two partners to the numerator and 1 year person-time to the denominator for the PAR. Data were available on the number of partners in the past year and this was used to explore how many individuals had partners that were not captured in the partnership history, and to assess the potential impact of not censoring the follow-up time for these individuals. In the DHS, data on gender or sexuality of partners is not collected.
Covariates: socio-demographic characteristics, partner and HIV status
Our socio-demographic exposures of interest were age (from 15 to 49 years, in 1-year increments), sex (man or woman), and wealth (poorest, poor, middle, rich, richest), all of which have been associated with the risk of STIs in some settings. Wealth was calculated according to standard procedures applied by DHS using data on household assets, construction and services to construct a wealth index.22
Given different trends between settings in the association between being married/cohabiting and the risk of STIs, we were also interested in the extent to which already having a partner and whether that partner was cohabiting or not was associated with the rate of new partner acquisition.23,24 Partner status was a time-varying covariate defined as having no partner, a non-cohabiting partner, a cohabiting partner or both types of partner and was derived from the partner history information reported in the survey. We used the start and end dates of all reported partnerships to determine the number and type ongoing at entry to the period of observation 12 months before the survey date. We adjusted the number and mix of partnerships each time a partnership ended or a new partnership began. For example, if an individual reported two partnerships, one of which was a cohabiting partner that started 11 months before the survey date and continued until the survey date and the second which was a non-cohabiting partner that started at 5 months before the survey date and continued until 4 months before the survey, their person time would be divided into the following episodes: (1) Month 1, no partner; (2) Month 2–7, a cohabiting partner; (3) Month 8, both types of partner; and (4) Month 9–12, a cohabiting partner.
Data on HIV status, which was considered as a proxy for STI transmission risk, was collected only in a subset of countries (see Supplementary Table S1). Therefore, in analyses including HIV status, we used a different set of DHS surveys that included all surveys containing the necessary information to calculate PAR and HIV status (N = 22 countries). In some countries, this meant using the penultimate survey. Since HIV prevalence varies substantially across regions, we categorised countries as eastern and southern Africa, western and central Africa, and elsewhere (Table S1).
Analysis
All analyses were done separately for men and women and by survey. We summarised the total number of partner acquisitions and person-years (py) at risk and estimated survey, sex and age-specific incidence rates with jack-knife confidence intervals (CIs). We calculated the cumulative hazard between ages 15 years and 50 years to estimate a synthetic summary measure of lifetime partner acquisition: the Total Partner Acquisition Rate (TPAR). The TPAR is analogous to the Total Fertility Rate; it represents the total number of lifetime partners a person would have if they experienced the prevailing age-specific PAR throughout their adult life and provides a convenient way to compare populations.
We explored correlates of acquisition rates by fitting piecewise exponential survival models. Specifically, we fitted separate piecewise exponential survival models with PAR as the outcome for the following exposures of interest: wealth; partner status; and HIV status. Each of these models was adjusted for age. We additionally fitted a series of linear regression models to explore, at survey level, the ecological association between exposures of interest and HIV incidence in African regions. The exposures were looked at in separate models and were the PAR (both for the entire population and for the HIV negative population) and the proportions of survey participants who had in the past year: a new partner, multiple partners, been sexually active, had sex with a spouse (i.e. were married), and had first sex before age 15 years. We allowed the coefficients to vary by sex and region.
Analyses were done using Stata 17 and accounted for the complex survey design, including the estimation of robust standard errors for the rates. DHS provide sampling weights in each dataset, as the probability of selection of each household into the surveys is not equal, and this needs to be accounted for in the analysis.25 We used the individual weights from the men and women’s datasets for all estimations, except those involving HIV where HIV sampling weights were used.
Results
Description of data
Table 1 provides details on the number of respondents in each survey, py available for analysis, and numbers and rates of partner acquisitions.
| Country and year of survey | Weighted count of respondents included in analysis | Person-years | Acquisitions | PAR and 95% CI | Total number of survey respondents | Number of respondents with 4+ partners A | Number of respondents with missing data B | |
|---|---|---|---|---|---|---|---|---|
| Men | ||||||||
| Albania 2017 | 4565 | 4562 | 1266 | 27.74 (25.00–30.93) | 4529 | 0 | 0 | |
| Angola 2015 | 5422 | 5421 | 2422 | 44.67 (41.00–48.73) | 5377 | 88 | 0 | |
| Armenia 2016 | 2741 | 2741 | 606 | 22.10 (19.39–25.32) | 2755 | 3 | 14 | |
| Benin 2018 | 6727 | 6727 | 1957 | 29.09 (27.18–31.16) | 6731 | 140 | 0 | |
| Burkina Faso 2010 | 6477 | 6399 | 1314 | 20.53 (18.67–22.65) | 6500 | 31 | 25 | |
| Burundi 2016 | 6687 | 6687 | 564 | 8.43 (7.55–9.45) | 6697 | 1 | 0 | |
| Cambodia 2014 | 5187 | 5131 | 417 | 8.13 (7.11–9.35) | 5190 | 5 | 4 | |
| Cameroon 2011 C | 6434 | 6405 | 3102 | 48.43 (45.25–51.90) | 6450 | 306 | 16 | |
| Cameroon 2018 | 6126 | 6126 | 2588 | 42.24 (39.16–45.62) | 6063 | 194 | 0 | |
| Chad 2015 | 4704 | 4675 | 790 | 16.89 (15.22–18.81) | 4701 | 30 | 14 | |
| Colombia 2015 | 27 291 | 27 281 | 12 768 | 46.80 (44.97–48.71) | 27 480 | 1160 | 1331 | |
| Comoros 2012 | 1827 | 1826 | 567 | 31.05 (27.61–35.03) | 1999 | 9 | 146 | |
| Congo 2011 | 4702 | 4699 | 2889 | 61.48 (58.06–65.14) | 4663 | 133 | 7 | |
| Côte d’Ivoire 2012 | 4627 | 4612 | 2213 | 47.98 (44.40–51.98) | 4622 | 237 | 10 | |
| DR Congo 2013 | 7754 | 7729 | 3330 | 43.08 (40.16–46.27) | 7702 | 214 | 2 | |
| Dominican Rep. 2013 | 9000 | 8997 | 5491 | 61.03 (58.43–63.78) | 8913 | 536 | 16 | |
| East Timor 2016 | 4072 | 4072 | 867 | 21.30 (19.28–23.59) | 4059 | 7 | 2 | |
| Ethiopia 2016 | 11 606 | 11 606 | 1333 | 11.49 (10.30–12.85) | 11 578 | 6 | 0 | |
| Gabon 2012 | 4935 | 4933 | 3166 | 64.18 (60.16–68.54) | 4995 | 151 | 88 | |
| Gambia 2013 C | 3470 | 3448 | 507 | 14.70 (12.77–16.97) | 3522 | 5 | 124 | |
| Gambia 2020 | 4255 | 4255 | 899 | 21.12 (18.99–23.56) | 4201 | 26 | 0 | |
| Ghana 2014 | 3868 | 3861 | 1166 | 30.21 (27.45–33.35) | 3855 | 50 | 1 | |
| Guatemala 2015 | 9852 | 9809 | 2124 | 21.66 (20.30–23.14) | 9822 | 101 | 24 | |
| Guinea 2012 C | 3351 | 3313 | 1063 | 32.09 (29.09–35.51) | 3321 | 28 | 2 | |
| Guinea 2018 | 3612 | 3612 | 911 | 25.23 (22.88–27.89) | 3577 | 17 | 0 | |
| Haiti 2012 C | 8413 | 8412 | 4705 | 55.93 (53.07–59.01) | 8376 | 410 | 21 | |
| Haiti 2017 | 8183 | 8183 | 4641 | 56.72 (53.77–59.89) | 8073 | 478 | 0 | |
| India 2015 C | 97 895 | 97 161 | 30 125 | 31.01 (30.28–31.75) | 103 519 | 57 | 6114 | |
| India 2019 | 87 232 | 86 400 | 21 259 | 24.61 (23.81–25.43) | 93 267 | 22 | 6600 | |
| Kenya 2014 | 12 038 | 12 029 | 3610 | 30.01 (28.30–31.87) | 12 009 | 87 | 8 | |
| Kyrgyzstan 2012 | 2403 | 2397 | 753 | 31.42 (27.37–36.28) | 2413 | 43 | 10 | |
| Lesotho 2014 | 2620 | 2618 | 1492 | 56.99 (53.09–61.29) | 2626 | 84 | 39 | |
| Liberia 2013 C | 4107 | 4106 | 1653 | 40.25 (37.32–43.45) | 4118 | 49 | 20 | |
| Liberia 2019 | 3821 | 3821 | 1762 | 46.10 (42.26–50.41) | 3760 | 101 | 0 | |
| Madagascar 2021 | 8027 | 8027 | 4025 | 50.15 (47.00–53.57) | 8019 | 257 | 0 | |
| Malawi 2015 | 7128 | 7128 | 2471 | 34.67 (32.81–36.66) | 7138 | 60 | 0 | |
| Mali 2012 | 3492 | 3485 | 807 | 23.16 (21.03–25.56) | 3816 | 17 | 316 | |
| Mozambique 2015 | 4722 | 4708 | 2175 | 46.20 (42.74–50.04) | 4733 | 42 | 2 | |
| Namibia 2013 | 3985 | 3984 | 1654 | 41.52 (38.94–44.35) | 3950 | 21 | 30 | |
| Nepal 2016 | 4063 | 4063 | 529 | 13.01 (11.73–14.49) | 4063 | 9 | 0 | |
| Niger 2012 | 3341 | 3328 | 217 | 6.52 (5.39–7.97) | 3421 | 9 | 50 | |
| Nigeria 2018 | 11 868 | 11 868 | 3629 | 30.57 (28.89–32.38) | 11 845 | 73 | 0 | |
| Papua New Guinea 2016 | 7253 | 7252 | 1881 | 25.94 (23.05–29.35) | 7333 | 46 | 85 | |
| Rwanda 2015 C | 5572 | 5564 | 725 | 13.03 (11.79–14.45) | 5585 | 3 | 4 | |
| Rwanda 2020 | 5846 | 5846 | 901 | 15.42 (14.20–16.78) | 5833 | 17 | 0 | |
| Senegal 2011 C | 4408 | 4399 | 748 | 17.01 (15.34–18.90) | 4414 | 21 | 8 | |
| Senegal 2016 | 3159 | 3146 | 396 | 12.59 (10.58–15.18) | 3164 | 4 | 0 | |
| Sierra Leone 2013 | 6478 | 6469 | 2285 | 35.33 (33.04–37.82) | 6577 | 108 | 122 | |
| South Africa 2016 | 3197 | 3197 | 1468 | 45.93 (42.89–49.25) | 3179 | 38 | 3 | |
| Togo 2014 | 4015 | 4009 | 1047 | 26.11 (24.21–28.21) | 4006 | 57 | 3 | |
| Uganda 2016 | 5037 | 5037 | 1845 | 36.63 (34.54–38.90) | 5043 | 97 | 0 | |
| Zambia 2018 | 11 177 | 11 177 | 3880 | 34.72 (32.92–36.62) | 11 104 | 119 | 0 | |
| Zimbabwe 2010 D | 7034 | 7028 | 2050 | 29.17 (27.54–30.92) | 7104 | 58 | 84 | |
| Women | ||||||||
| Albania 2017 | 10 970 | 10 969 | 558 | 5.09 (4.50–5.77) | 10 860 | 0 | 0 | |
| Angola 2015 | 14 379 | 14 379 | 2620 | 18.22 (16.90–19.66) | 14 379 | 2 | 0 | |
| Armenia 2016 | 6108 | 6108 | 252 | 4.13 (3.61–4.75) | 6116 | 0 | 10 | |
| Benin 2018 | 15 928 | 15 928 | 1854 | 11.64 (10.99–12.34) | 15 928 | 11 | 0 | |
| Burkina Faso 2010 | 16 982 | 16 981 | 994 | 5.85 (5.25–6.55) | 17 081 | 1 | 98 | |
| Burundi 2016 | 17 269 | 17 269 | 872 | 5.05 (4.66–5.48) | 17 269 | 3 | 0 | |
| Cambodia 2014 | 17 569 | 17 566 | 660 | 3.76 (3.43–4.12) | 17 578 | 1 | 9 | |
| Cameroon 2011 C | 15 383 | 15 339 | 2699 | 17.59 (16.48–18.80) | 15 421 | 31 | 41 | |
| Cameroon 2018 | 13 608 | 13 608 | 2471 | 18.16 (16.84–19.60) | 13 527 | 34 | 6 | |
| Chad 2015 | 17 634 | 17 609 | 761 | 4.32 (3.89–4.82) | 17 719 | 1 | 96 | |
| Colombia 2015 | 35 846 | 35 836 | 7055 | 19.69 (18.85–20.57) | 35 979 | 93 | 555 | |
| Comoros 2012 | 4743 | 4743 | 420 | 8.85 (7.67–10.25) | 5329 | 1 | 522 | |
| Congo 2011 | 10 709 | 10 703 | 2063 | 19.27 (17.90–20.78) | 10 817 | 10 | 50 | |
| Côte d’Ivoire 2012 | 10 025 | 10 010 | 1688 | 16.87 (15.28–18.69) | 10 060 | 6 | 25 | |
| DR Congo 2013 | 18 808 | 18 794 | 2684 | 14.28 (13.24–15.43) | 18 827 | 34 | 18 | |
| Dominican Rep 2013 | 9359 | 9358 | 1885 | 20.14 (18.76–21.66) | 9372 | 35 | 10 | |
| East Timor 2016 | 12 607 | 12 606 | 1621 | 12.86 (11.62–14.27) | 12 607 | 2 | 0 | |
| Ethiopia 2016 | 15 683 | 15 683 | 1206 | 7.69 (6.93–8.55) | 15 683 | 3 | 0 | |
| Gabon 2012 | 8046 | 8046 | 2540 | 31.57 (29.23–34.18) | 8422 | 31 | 234 | |
| Gambia 2013 C | 10 218 | 10 198 | 406 | 3.98 (3.46–4.61) | 10 233 | 0 | 16 | |
| Gambia 2020 | 11 865 | 11 865 | 841 | 7.09 (6.48–7.78) | 11 865 | 0 | 0 | |
| Ghana 2014 | 9394 | 9393 | 1285 | 13.67 (12.59–14.88) | 9396 | 7 | 3 | |
| Guatemala 2015 | 25 910 | 25 905 | 1591 | 6.14 (5.74–6.57) | 25 914 | 10 | 6 | |
| Guinea 2012 C | 9130 | 9126 | 862 | 9.44 (8.27–10.84) | 9142 | 15 | 10 | |
| Guinea 2018 | 10 874 | 10 874 | 1475 | 13.56 (12.38–14.89) | 10 874 | 0 | 0 | |
| Haiti 2012 C | 14 228 | 14 228 | 2138 | 15.03 (14.09–16.05) | 14 287 | 8 | 40 | |
| Haiti 2017 | 14 371 | 14 371 | 2281 | 15.88 (14.84–17.01) | 14 371 | 8 | 0 | |
| India 2015 C | 111 841 | 111 751 | 14 615 | 13.08 (12.58–13.60) | 122 351 | 0 | 10 309 | |
| India 2019 | 102 960 | 102 923 | 9434 | 9.17 (8.75–9.61) | 108 785 | 0 | 6346 | |
| Kenya 2014 | 31 062 | 31 057 | 1715 | 5.52 (5.11–5.98) | 31 079 | 7 | 17 | |
| Kyrgyzstan 2012 | 8205 | 8195 | 412 | 5.02 (4.39–5.78) | 8208 | 0 | 4 | |
| Lesotho 2014 | 6456 | 6452 | 1303 | 20.20 (18.92–21.59) | 6621 | 4 | 137 | |
| Liberia 2013 C | 9197 | 9196 | 1995 | 21.70 (19.91–23.75) | 9239 | 25 | 51 | |
| Liberia 2019 | 8065 | 8065 | 1884 | 23.36 (21.24–25.79) | 8065 | 13 | 0 | |
| Madagascar 2021 | 18 867 | 18 867 | 3543 | 18.78 (17.72–19.91) | 18 869 | 24 | 2 | |
| Malawi 2015 | 24 562 | 24 562 | 3723 | 15.16 (14.48–15.88) | 24 562 | 7 | 0 | |
| Mali 2012 | 9204 | 9198 | 1215 | 13.21 (11.08–15.90) | 10 424 | 3 | 1212 | |
| Mozambique 2015 | 6912 | 6893 | 1366 | 19.82 (18.25–21.56) | 6946 | 4 | 3 | |
| Namibia 2013 | 9095 | 9081 | 1832 | 20.18 (18.83–21.66) | 9176 | 1 | 77 | |
| Nepal 2016 | 12 862 | 12 862 | 741 | 5.76 (5.31–6.26) | 12 862 | 0 | 0 | |
| Niger 2012 | 11 019 | 11 018 | 420 | 3.81 (3.41–4.28) | 11 160 | 0 | 143 | |
| Nigeria 2018 | 41 821 | 41 821 | 4176 | 9.98 (9.47–10.53) | 41 821 | 28 | 0 | |
| Papua New Guinea 2016 | 14 972 | 14 963 | 1494 | 9.98 (9.01–11.09) | 15 198 | 2 | 227 | |
| Philippines 2017 E | 25 074 | 25 065 | 1335 | 5.33 (4.87–5.83) | 25 074 | 0 | 0 | |
| Rwanda 2015 C | 13 474 | 13 471 | 951 | 7.06 (6.53–7.64) | 13 497 | 9 | 18 | |
| Rwanda 2020 | 14 634 | 14 634 | 1456 | 9.95 (9.29–10.67) | 14 634 | 15 | 0 | |
| Senegal 2011 C | 15 688 | 15 684 | 889 | 5.67 (5.18–6.21) | 15 688 | 0 | 0 | |
| Senegal 2016 | 8865 | 8864 | 609 | 6.87 (6.11–7.72) | 8865 | 0 | 0 | |
| Sierra Leone 2013 | 16 188 | 16 186 | 2592 | 16.01 (14.73–17.43) | 16 658 | 22 | 421 | |
| South Africa 2016 | 8503 | 8503 | 2337 | 27.49 (25.92–29.18) | 8514 | 3 | 11 | |
| Tajikistan 2017 E | 10 718 | 10 716 | 1030 | 9.61 (8.82–10.49) | 10 718 | 0 | 0 | |
| Togo 2014 | 9470 | 9469 | 925 | 9.77 (8.97–10.67) | 9480 | 2 | 10 | |
| Uganda 2016 | 18 504 | 18 504 | 2837 | 15.33 (14.58–16.14) | 18 506 | 12 | 3 | |
| Zambia 2018 | 13 683 | 13 683 | 2363 | 17.27 (16.24–18.39) | 13 683 | 4 | 0 | |
| Zimbabwe 2015 D | 9902 | 9897 | 1356 | 13.70 (12.65–14.86) | 9955 | 6 | 51 | |
Overall, 1 131 983 people aged 15–49 years (weighted counts were 362 153 men and 753 834 women) from 47 countries were included. The person-time available for analysis was 360 961 py for men and 753 834 for women. This was slightly lower than the number of participants due to omission of data from people who had incoherent data in their partner history, such as an acquisition after last sex with the partner. Men reported 114 424 partner acquisitions and women reported 89 772 acquisitions. Data from surveys in 12 countries (Afghanistan, Bangladesh, Egypt, Indonesia, Jordan, Pakistan, Peru, Maldives, Myanmar, Tanzania, Turkey, and Yemen) were not used because they did not include the relevant questions. Data from Zimbabwe 2015 men’s survey and from the Honduras 2012 survey were excluded as the data on the start date of partnerships was not available. A total of 5365 respondents reported more than three partners in the past year, and information was not collected for 24 025 partners, an average of 4.5 unobserved partners per person with minimal impacts on the PAR we calculated in our analysis (Supplementary Results and Table S2).
Partner acquisition rates
The PAR for men had a median across surveys of 30 per 100 py and varied from 7/100 py in Niger to 64/100 py in Gabon with an interquartile range (IQR) of 21 to 45 (Table 1). For women, the median PAR was 13/100 py and ranged from 4/100 py in Cambodia to 32/100 py in Gabon with an IQR of 6–18. In all surveys, the rate reported was higher for men than women (Fig. 1).
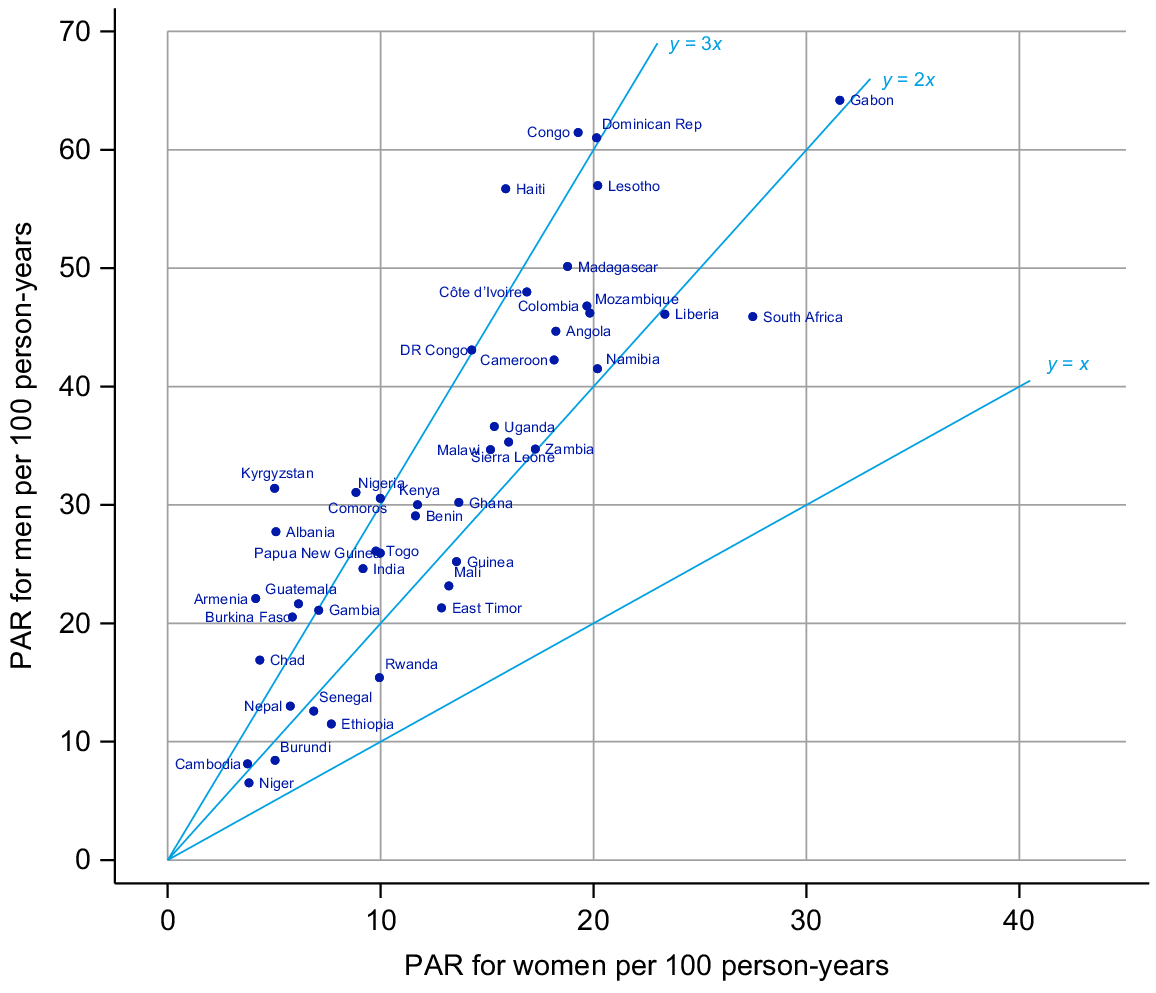
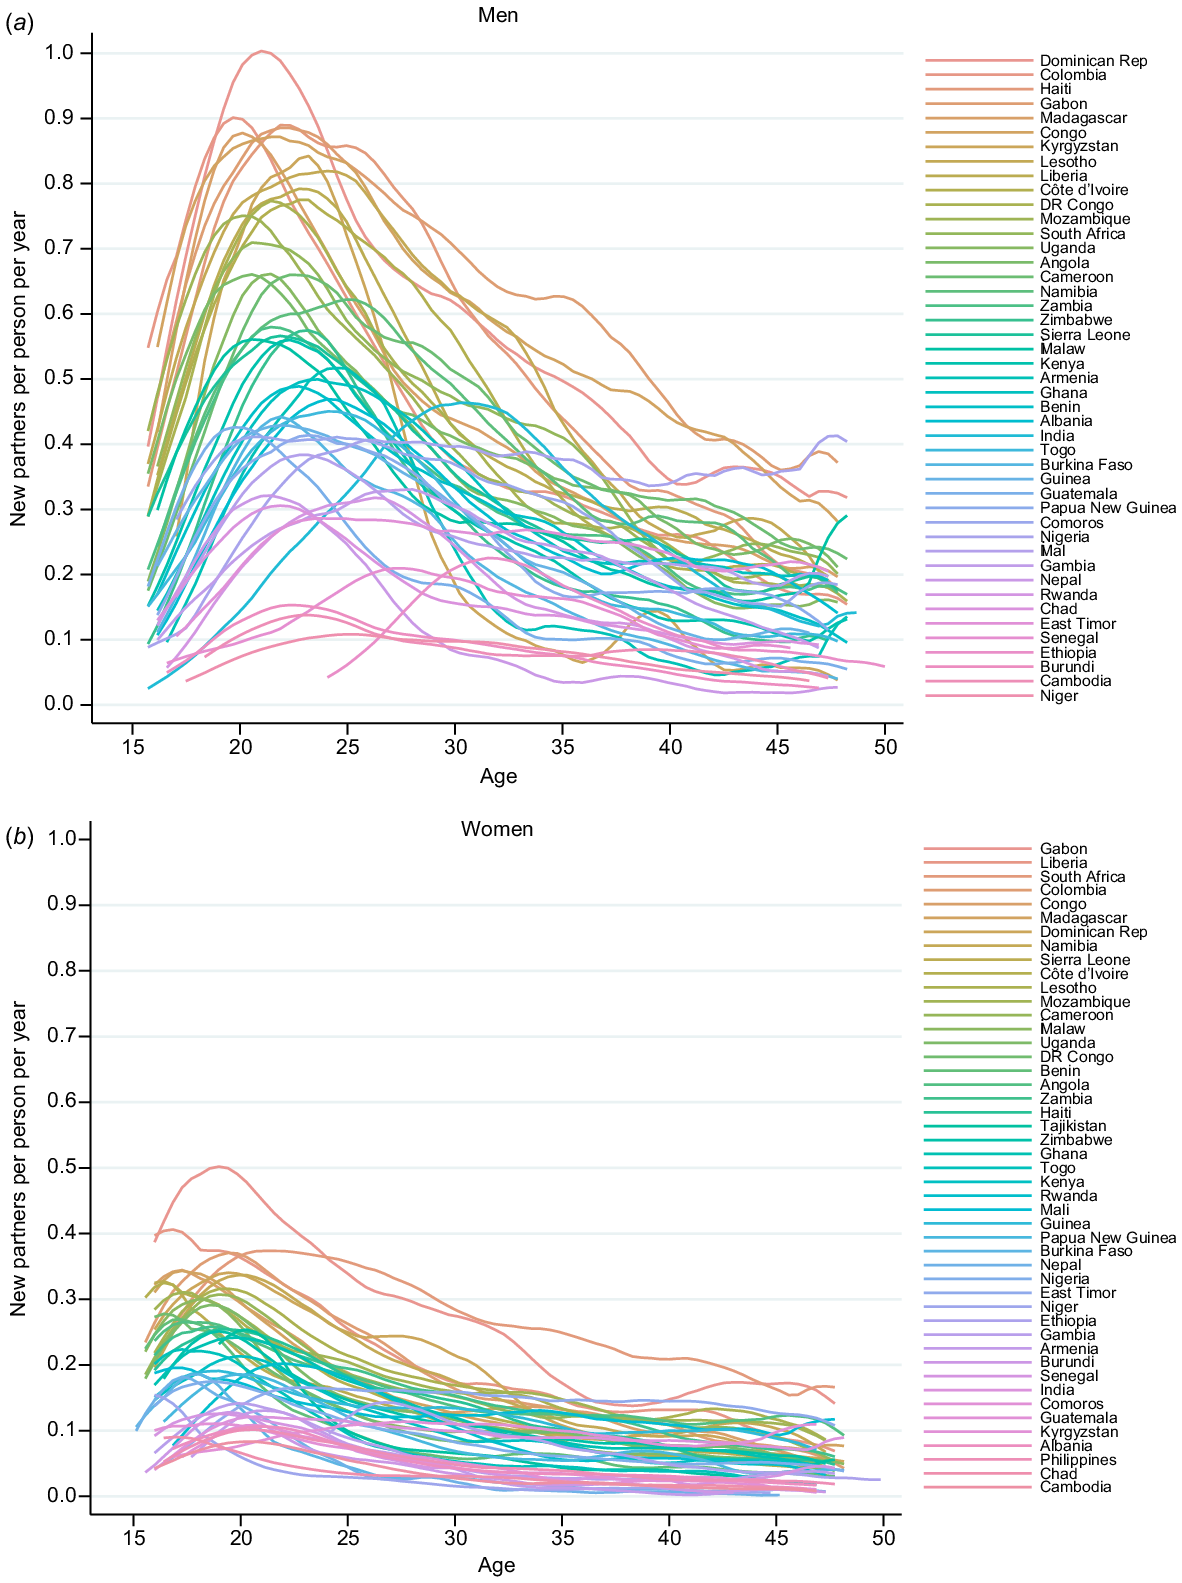
Fig. 2 shows the age-specific PAR for men and women. The PAR peaked for men in their early 20s and then declines in all settings. Across all settings, the peak was both much lower and slightly earlier in women (late teens).
Age-specific partner acquisition rates (per person per year) by country for (a) men and (b) women using data from the most recently conducted survey in each country.
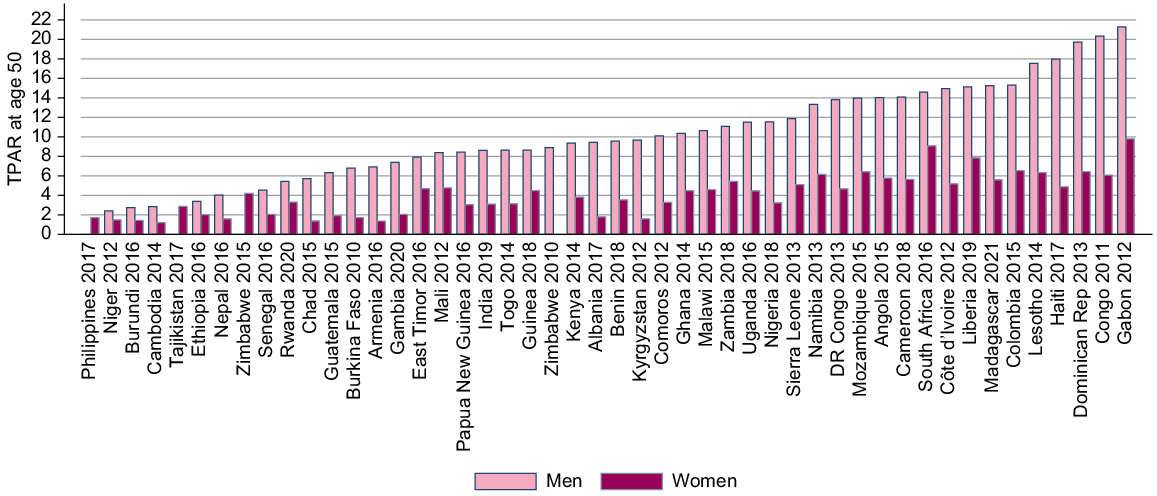
Our synthetic measures of partner acquisition (TPAR) are in Fig. 3. For men, the lowest TPAR was 2.4, reported in Niger, and the highest was 21 reported in Gabon. Women in Cambodia had the lowest TPAR with 1.2 partners by age 50 years. The highest TPAR for women was 9.0, in Gabon. There was little correlation at the national level between the TPAR for men and women.
Variation in partner acquisition rates by wealth
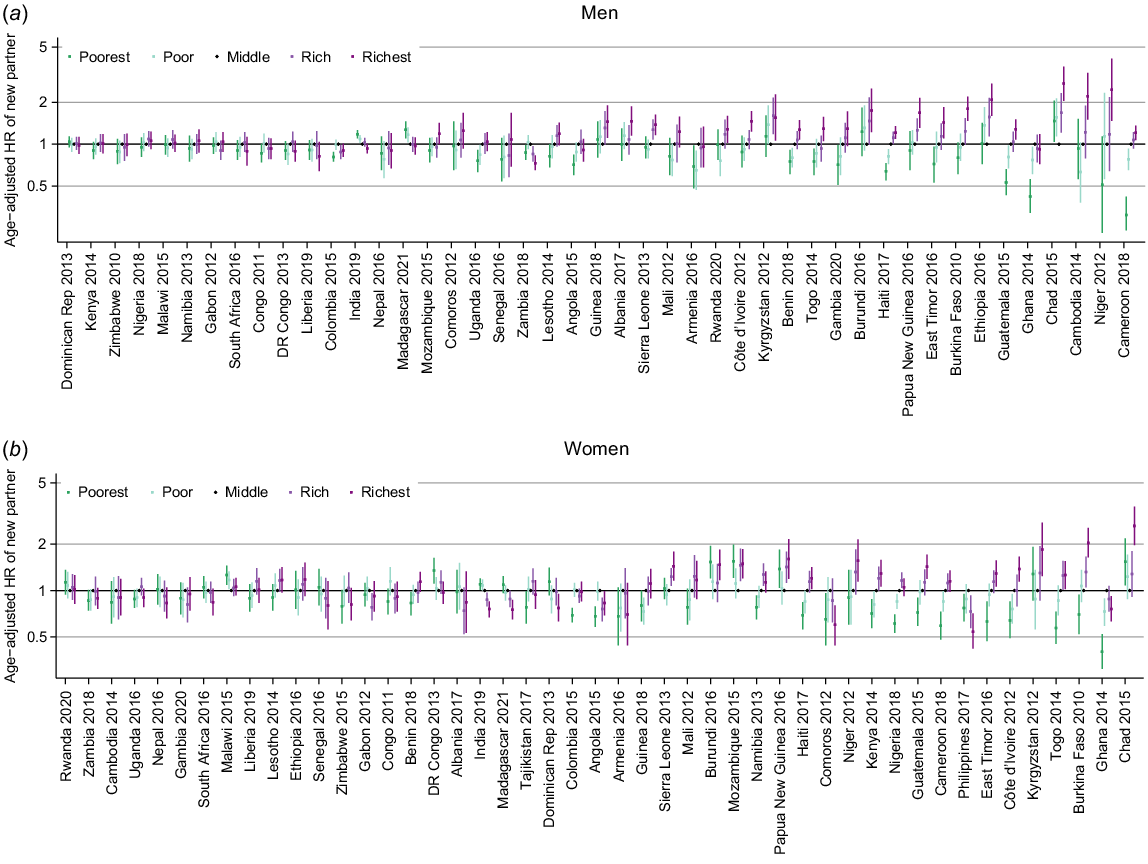
The age-adjusted hazard ratios (HR) for partner acquisition by household wealth quintile for men and women in each survey showed some clear trends with wealth (Fig. 4; estimates in Tables S3 and S4) although in 16 countries there was no pattern of association for either men or women.
Age-adjusted hazard ratio (HR) for new partner acquisition by wealth quintile (baseline group = middle) for (a) men and (b) women stratified by survey.
The most common pattern was an upwards trend in PAR with increasing wealth, where the richest had the highest rates of partner acquisition. This was seen for both sexes in 10 countries (Benin, Burkina Faso, Cameroon, Cote d’Ivoire, East Timor, Guatemala, Haiti, Niger, Sierra Leone and Togo), for women only in three countries (Kenya, Namibia and Nigeria) and for men only in Cambodia, Gambia and, with less certainty, Papua New Guinea and Uganda. This was the dominant pattern of association in western African countries.
There was considerable variation across the remaining surveys. In India and Madagascar, the pattern was reversed with the highest rates observed among the poorest quintile. Elsewhere there was not a linear trend but a pattern of association such that the richest and poorest have higher rates compared to the middle quintile (Burundi and Chad), or the inverse with highest rates in the middle quintile (Angola, Armenia, Colombia, Ghana, Zambia). In 10 countries, the patterns of association were seen only for one sex.
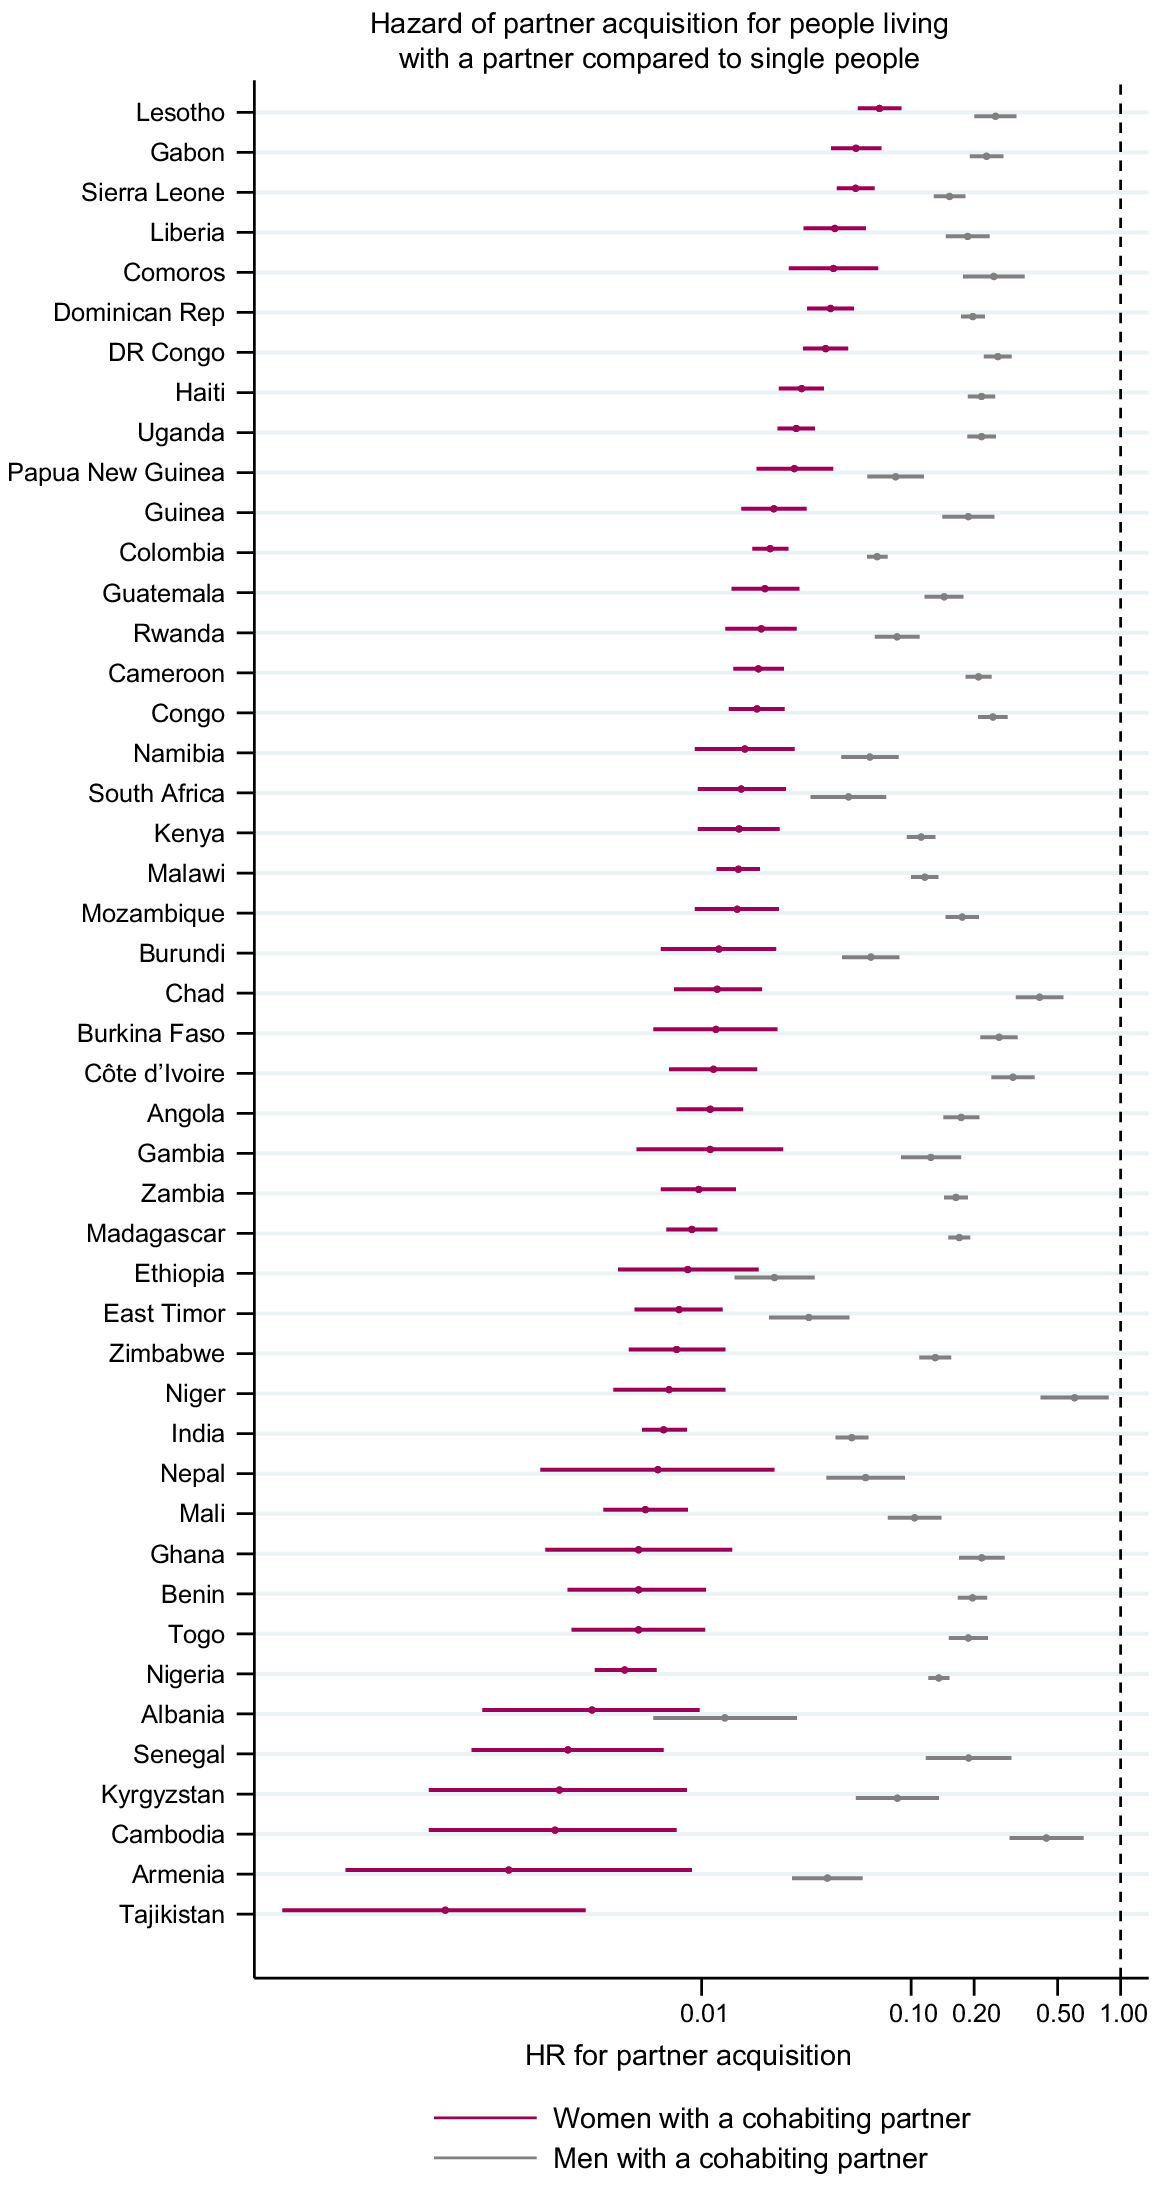
Variation in partner acquisition rates by partner status at the time of acquisition
Fig. 5 shows the HR for acquiring a new partner comparing those who are already cohabiting with at least one partner with people who do not have a partner (estimates in Tables S5 and S6). Everywhere, the hazards of acquiring a new partner were lower for people already in a cohabiting partnership. The HRs for men ranged from 0.01 (95% CI 0.006–0.029) in Albania 2017 to 0.60 (95% CI 0.42–0.88) in Niger and for women from 0 in the Philippines to 0.09 (95% CI 0.06–0.15) in Kenya. The HR for women was consistently lower than that for men, but the degree of the difference varied between surveys.
Age-adjusted hazard ratio (HR) for partner acquisition among people already cohabiting with a partner compared to single people. Estimates from Zimbabwe are from 2010 for men and 2015 for women. There are no estimates for the Philippines because only single women reported acquiring a new partner.
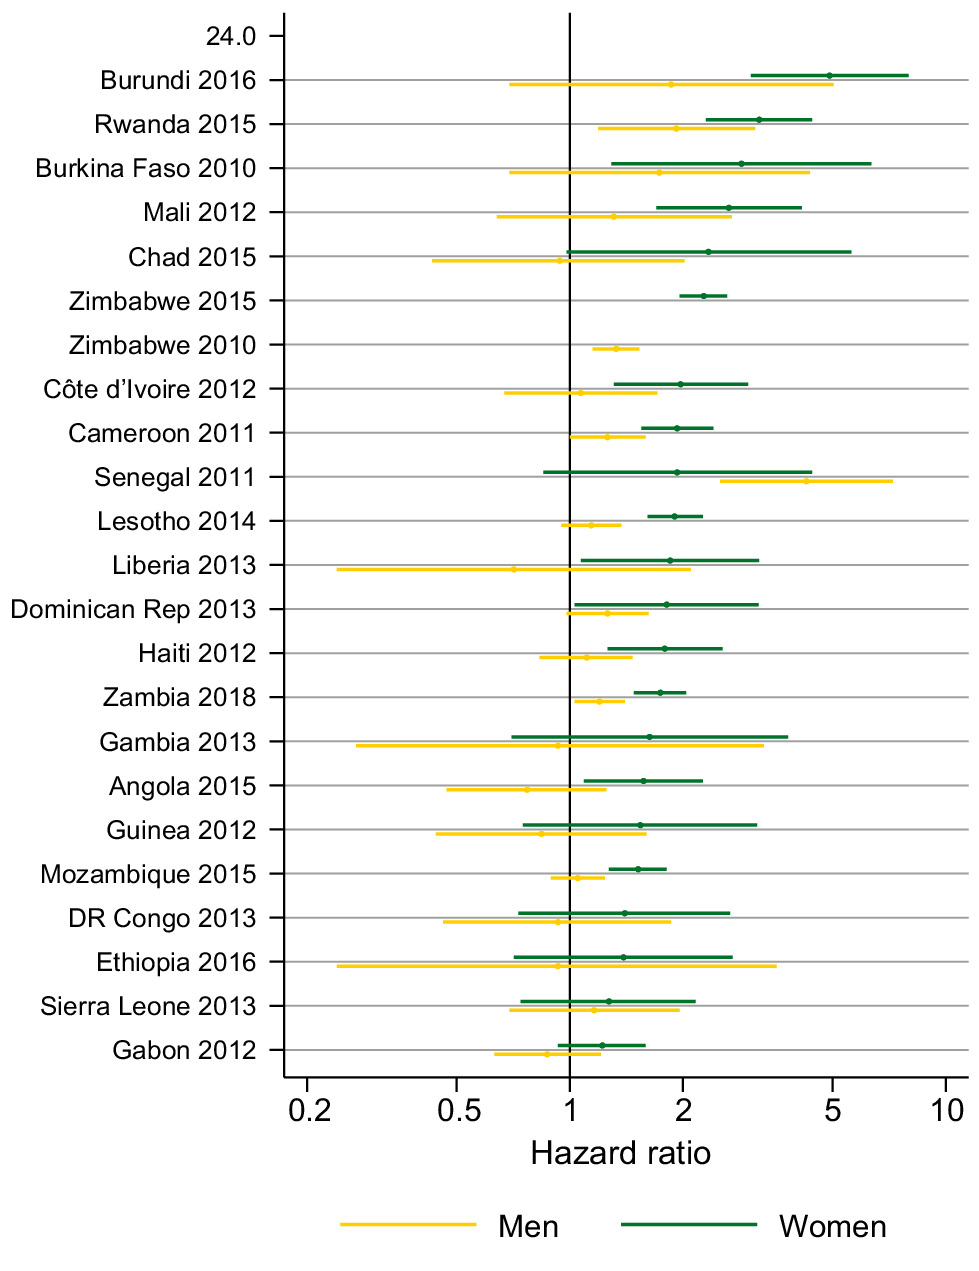
Variation in partner acquisition rates by HIV status
Fig. 6 shows the age-adjusted HR for partner acquisition by HIV status for men and women in 24 surveys (estimates in Tables S7 and S8). For women in all surveys, except India in 2015, the HR indicated a higher PAR among women living with HIV compared to HIV-negative women. For example, women living with HIV had over twice the rate of partner acquisition compared with women without HIV in Zimbabwe (HR = 2.27; 95% CI = 1.96–2.62). In Chad, Ethiopia, DR Congo, Gabon, Gambia, Guinea, India, Senegal and Sierra Leone the CIs included one but in the other 14 surveys they do not. There was not such a clear pattern for men. In only three surveys (Rwanda, Senegal and Zimbabwe), the CIs did not include one and men living with HIV had a higher PAR than men without HIV.
Age-adjusted hazard ratio for partner acquisition among people living with HIV compared to people who are HIV negative. CI missing for the India 2019 estimate because only two acquisitions were reported by women living with HIV.
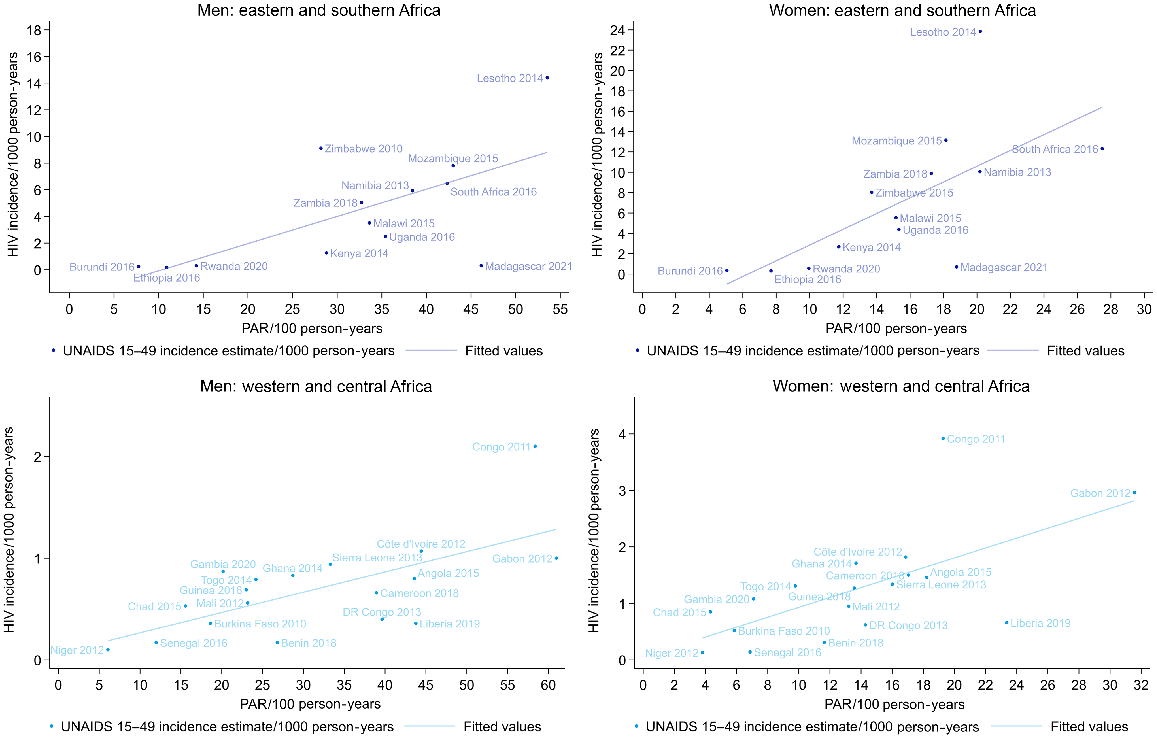
There were no UNAIDS estimates available on HIV incidence for Comoros and Nigeria, but for the other 31 countries with data on PAR and on HIV incidence in Africa, the PAR was positively correlated with HIV incidence among both men and women (Fig. 7; Table S9). In western and central Africa, the coefficients were 0.09 (95% CI 0.01–0.17) for men and 0.27 (95% CI 0.11–0.47) for women (i.e. in western and central Africa there was a 0.09% increase in the HIV incidence with each one unit increase in the PAR for men). In eastern and southern Africa, the coefficients were 0.36 (95% CI 0.26–0.46) for men and 1.17 (95% CI 0.95–1.40) for women. A similar association was seen with the percentage of the population who had a new partner, and for the percentage sexually active. For multiple partners, an association was only evident in eastern and southern Africa (Table S9).
Discussion
We present updated estimates of partnerships among men and women and the first cross-national estimates of rates of partner acquisition. We show a wide range of estimates for men and women and interesting trends across countries. We see substantial variations between countries in the PAR, with no clear geographical patterns. We consistently see higher PAR among men and accordingly the TPAR are consistently lower for women than men. PAR were highest for young people and people who were single or who had only a non-cohabiting partner(s). Women living with HIV had higher PAR, identifying a group who are both vulnerable to STIs and potentially important for onwards transmission, but the patterns by HIV status were more variable among men. The patterns of PAR by age, sex and HIV are generally consistent with differences observed in other reported sexual behaviour by these characteristics.26–28
Some of the differences between and within countries in the levels and correlates of PAR are likely to reflect differences in the broader social and demographic context. Acquisition of sexual partners is a social activity and therefore influenced by social norms, gender roles and opportunities to encounter new partners. For example, in contexts where gendered social norms associate masculinity with greater numbers of sexual partners,29 PAR among men, and the gap between men’s and women’s PAR, would be expected to be higher. The demographic context can influence the national PAR through compositional differences between populations, even where the PAR for population subgroups are similar across countries. At national level, the PAR is determined both by the relative size of the subgroups and the PAR for each group. The size of the groups will depend on the age structure and other factors, such as age at first marriage and divorce rates, which vary by country.28,30
We found widespread, but not universal, associations between wealth and PAR. The variations shown in these data lend further evidence to the contextual factors shaping behaviours and the way these vary by setting. The finding that PAR varies according to socio-demographic characteristics and HIV status demonstrates the importance of accurate parameterisation of partnership dynamics in models of HIV and other STIs to fully capture the differences between sexes and populations and thereby provide the best strategic information to model users.
Risk relating to partnerships, at both the individual and population-level, has usually been described by focusing on multiple partners, rather than new partners (i.e. prevalent rather than incident partners). The two measures are correlated, since multiple new partner acquisitions in a period of time are necessary for someone to have multiple partners. We believe they provide different, complementary information. We have shown a linear correlation between measures of new partner acquisition and national-level HIV incidence in western and central Africa as well as in eastern and southern Africa, whereas the proportion with more than one partner was correlated only in eastern and central Africa. While there could be other explanations for that association, rather than a causal link between numbers of new partnerships and HIV infection, it does suggest that PAR may be a more discriminatory measure than multiple partnerships in identifying populations with high levels of STI risk.
The strengths of the study include the use of nationally representative data available across many low- and middle-income countries. The data come from standardised enquiries conducted by highly experienced survey teams using comparable methods and validated questions and so provide excellent data for cross-survey comparisons.31 PAR captures information about people who had multiple new partners which is not accounted for by the simpler measure of the proportion who had a new partner. Complex data manipulation is required to prepare the data for survival analysis and to estimate the PAR from the DHS standard recode. However, this approach permits analyses of partnership acquisition with a time-varying exposure, such as looking at partner status as a determinant of new partner acquisition.
There are limitations to our analysis. First, we have looked only at one aspect of partnerships dynamics, acquisition, because the DHS data do not permit estimation of the rates of partnership dissolution. The longevity of partnerships and the rate at which they dissolve is important, because the ending of a partnership is often a significant life-event that affects wellbeing, sexual and reproductive behaviour, and that has a direct effect on the likelihood of partner acquisition. Second, the data may be subject to some biases. Self-reported data are subject to reporting bias,26,32 and the partner history can be onerous for respondents and interviewers, potentially affecting data quality. These issues could lead to an underestimation of partner acquisition if respondent or interviewer fatigue, or a social desirability bias, leads to the omission of some partners. Sex differences in the reporting of sexual partnerships arise because of differences in the ages of partners19 and differences in estimation strategies33 as well as differences in social desirability biases.26 Women are likely to under-report their numbers of sexual partners26,33 and this could bias our comparisons of PAR if the extent to which women under-report varies in such a way as to distort the associations with other variables. However, we were principally interested in relative rather than absolute PAR, and a bias that applies to all women would have no effect on this. If under-reporting varies between countries and by, for example, wealth, then differential under-reporting could explain our varied findings with respect to PAR and wealth in different countries.
Third, the partner history asked about a maximum of three partners in the past 12 months. In each survey, a small proportion of people (<1% of female respondents and a median of 1% of male respondents) reported more than three partners in the past year, and therefore, we may not have complete data on all acquisitions. The bias introduced is likely under-enumeration of short-term partners from further back in time and would underestimate PAR but our sensitivity analysis suggests the impact of this is negligible. Fourth, these household based surveys may miss certain groups of people who have very high numbers of partners, such as sex workers, although the effect of this is likely to be minimal for general population estimates because generally these are a small group. Lastly, there were two key limitations to our analysis looking at the individual level association between HIV and PAR: (1) we cannot show that partner acquisition preceded HIV infection; and (2) we rely on HIV status at the time of the survey and assume that this did not change in the 12 months preceding the survey. Given the incidence rates in these populations, we assume that the vast majority of infections would have been acquired more than 12 months before the survey and therefore precede our period of observation.
Simple screening tools to identify individuals in the general population at high risk of STIs, particularly HIV, remain elusive and hard to translate between settings.34 Despite its limitations, PAR provides a metric that can be used to flag groups of people among whom STI transmission might be higher. PAR is unambiguous to define, does not describe a stigmatised behaviour, describes a quantifiable behaviour, and shows considerable variation in the rates (i.e. there is good discriminatory power). Unlike other behavioural factors that have not been found to be associated with HIV at both individual and population level,35 we find PAR to be associated with HIV prevalence at the individual-level and HIV incidence at the population level (and to provide a more consistent association than number of partners). PAR can provide valuable population-level information to forewarn of increasing infection risk and so identify populations for targeted interventions. At individual-level, PAR can be used to refine risk scoring to reflect the additional exposure that results from the behaviour of other people in the population. In populations where there is a lot of risky behaviour, infections can spread faster than in populations with lower levels of risk behaviour.
In summary, this is the first time PAR have been estimated, for men and women in 47 countries using high-quality comparable data and we observe substantial variation in PAR. This variation highlights the need for accurate local data for modelling and planning STI interventions and services since generic estimates of partnership formation are unlikely to be appropriate. The association between HIV and PAR in women at the individual-level and both sexes at the population-level suggests this metric can help identify subgroups in the population that may be linked to STI transmission. This suggests that PAR data, alongside data on dissolution rates, can better describe partnership dynamics in mathematical models of STI transmission and could help explain differences in transmission patterns between population groups. We also propose that new partnerships should be incorporated into risk assessment tools at both the population and individual-levels; at the level of the individual to identify who might need immediate STI prevention interventions, and at the population-level to identify groups where services and interventions need to be strengthened to identify people at high risk of STIs before incidence rates rise.
Data availability
The data used in this study are available upon request from the DHS at https://dhsprogram.com/data/new-user-registration.cfm.
Declaration of funding
CC, ES and MM received salary support from the Bill and Melinda Gates Foundation (OPP1164897) to develop the analysis. ES, RS, MM and MP received salary support from UNDP/UNFPA/UNICEF/WHO/World Bank Special Programme of Research, Development and Research Training in Human Reproduction for compiling and analysing the data used in this report.
Acknowledgements
The authors thank Michelle Morrison at BMGF for thoughtful and insightful responses to these analyses.
References
1 Rowley J, Vander Hoorn S, Korenromp E, et al. Chlamydia, gonorrhoea, trichomoniasis and syphilis: global prevalence and incidence estimates, 2016. Bull World Health Organ 2019; 97(8): 548-562.
| Crossref | Google Scholar | PubMed |
2 Looker KJ, Magaret AS, Turner KME, et al. Global estimates of prevalent and incident herpes simplex virus type 2 infections in 2012. PLoS ONE 2015; 10(1): e114989.
| Crossref | Google Scholar | PubMed |
3 UNAIDS. Global HIV & AIDS statistics – fact sheet. 2023. Available at https://www.unaids.org/en/resources/fact-sheet [accessed 13 September 2023]
6 Grabowski MK, Serwadda DM, Gray RH, et al. HIV prevention efforts and incidence of HIV in Uganda. N Engl J Med 2017; 377(22): 2154-2166.
| Crossref | Google Scholar | PubMed |
8 Howes A, Risher KA, Nguyen VK, et al. Spatio-temporal estimates of HIV risk group proportions for adolescent girls and young women across 13 priority countries in sub-Saharan Africa. PLOS. Global Public Health 2023; 3(4): e0001731.
| Crossref | Google Scholar | PubMed |
9 Anderson RM, Garnett GP. Mathematical models of the transmission and control of sexually transmitted diseases. Sexually Transmitted Diseases 2000; 27(10): 636-643.
| Crossref | Google Scholar | PubMed |
10 Garnett GP, Anderson RM. Balancing sexual partnerships in an age and activity stratified model of HIV transmission in heterosexual populations. IMA J Math Appl Med Biol 1994; 11(3): 161-192.
| Crossref | Google Scholar |
11 Anderson RM, Gupta S, Ng W. The significance of sexual partner contact networks for the transmission dynamics of HIV. J Acquir Immune Defic Syndr 1990; 3(4): 417-429.
| Google Scholar |
12 Rao DW, Wheatley MM, Goodreau SM, et al. Partnership dynamics in mathematical models and implications for representation of sexually transmitted infections: a review. Ann Epidemiol 2021; 59: 72-80.
| Crossref | Google Scholar | PubMed |
13 Anderson RM, Medley GF, May RM, et al. A preliminary study of the transmission dynamics of the human immunodeficiency virus (HIV), the causative agent of AIDS. IMA J Math Appl Med Biol 1986; 3(4): 229-263.
| Crossref | Google Scholar |
14 Nsubuga RN, White RG, Mayanja BN, et al. Estimation of the HIV basic reproduction number in rural South West Uganda: 1991–2008. PLoS ONE 2014; 9(1): e83778.
| Crossref | Google Scholar |
15 Holmes CB, Kilonzo N, Zhao J, et al. Strengthening measurement and performance of HIV prevention programmes. Lancet HIV 2021; 8(5): e306-e310.
| Crossref | Google Scholar | PubMed |
16 Genberg BL, Kulich M, Kawichai S, et al. HIV risk behaviors in sub-Saharan Africa and Northern Thailand: baseline behavioral data from project accept. J Acquir Immune Defic Syndr 2008; 49(3): 309-319.
| Crossref | Google Scholar | PubMed |
17 Mercer CH, Jones KG, Geary RS, et al. Association of timing of sexual partnerships and perceptions of partners’ concurrency with reporting of sexually transmitted infection diagnosis. JAMA Network Open 2018; 1(8): e185957.
| Crossref | Google Scholar | PubMed |
18 Suchard MS, Martinson N, Malfeld S, et al. Alloimmunity to class 2 human leucocyte antigens may reduce HIV-1 acquisition – a nested case-control study in HIV-1 serodiscordant couples. Front Immunol 2022; 13: 813412.
| Crossref | Google Scholar | PubMed |
19 Wellings K, Collumbien M, Slaymaker E, et al. Sexual behaviour in context: a global perspective. Lancet 2006; 368(9548): 1706-1728.
| Crossref | Google Scholar | PubMed |
20 The DHS Program. Search. 2023. Available at https://dhsprogram.com/search/ [accessed 17 January 2023]
21 The DHS Program. DHS Model Questionnaire – Phase 7 (English, French). 2015. Available at https://dhsprogram.com/publications/publication-dhsq7-dhs-questionnaires-and-manuals.cfm [accessed 17 January 2023]
22 The DHS Program. Wealth index construction. 2019. Available at https://dhsprogram.com/topics/wealth-index/Wealth-Index-Construction.cfm [accessed 17 January 2022]
23 Nyemba DC, Medina-Marino A, Peters RPH, et al. Prevalence, incidence and associated risk factors of STIs during pregnancy in South Africa. Sex Transm Infect 2021; 97(5): 375-381.
| Crossref | Google Scholar | PubMed |
24 Ginindza TG, Stefan CD, Tsoka-Gwegweni JM, et al. Prevalence and risk factors associated with sexually transmitted infections (STIs) among women of reproductive age in Swaziland. Infect Agent Cancer 2017; 12(1): 29.
| Crossref | Google Scholar |
25 Croft TN, Marshall AMJ, Allen CK, et al. Guide to DHS statistics. ICF: Rockville, MD, USA; 2018. Available at https://dhsprogram.com/pubs/pdf/DHSG1/Guide_to_DHS_Statistics_DHS-7_v2.pdf
26 Nnko S, Boerma JT, Urassa M, et al. Secretive females or swaggering males?: an assessment of the quality of sexual partnership reporting in rural Tanzania. Soc Sci Med 2004; 59(2): 299-310.
| Crossref | Google Scholar | PubMed |
27 Marston M, Slaymaker E, Cremin I, et al. Trends in marriage and time spent single in sub-Saharan Africa: a comparative analysis of six population-based cohort studies and nine Demographic and Health Surveys. Sex Transm Infect 2009; 85(Suppl 1): i64-i71.
| Crossref | Google Scholar |
28 Wellings K, Collumbien M, Slaymaker E, et al. Sexual behaviour in context: a global perspective. Lancet 2006; 368(9548): 1706-1728.
| Crossref | Google Scholar |
29 Closson K, Hatcher A, Sikweyiya Y, et al. Gender role conflict and sexual health and relationship practices amongst young men living in urban informal settlements in South Africa. Cult Health Sex 2020; 22(1): 31-47.
| Crossref | Google Scholar | PubMed |
30 Pezzulo C, Hornby GM, Sorichetta A, et al. Sub-national mapping of population pyramids and dependency ratios in Africa and Asia. Sci Data 2017; 4(1): 170089.
| Crossref | Google Scholar |
31 Aicken CRH, Gray M, Clifton S, et al. Improving questions on sexual partnerships: lessons learned from cognitive interviews for Britain’s third National Survey of Sexual Attitudes and Lifestyles (“Natsal-3”). Arch Sex Behav 2013; 42(2): 173-185.
| Crossref | Google Scholar | PubMed |
32 Fenton KA, Johnson AM, McManus S, et al. Measuring sexual behaviour: methodological challenges in survey research. Sex Transm Infect 2001; 77(2): 84-92.
| Crossref | Google Scholar | PubMed |
33 Mitchell KR, Mercer CH, Prah P, et al. Why do men report more opposite-sex sexual partners than women? Analysis of the gender discrepancy in a British National Probability Survey. J Sex Res 2019; 56(1): 1-8.
| Crossref | Google Scholar | PubMed |
34 Jia KM, Eilerts H, Edun O, et al. Risk scores for predicting HIV incidence among adult heterosexual populations in sub-Saharan Africa: a systematic review and meta-analysis. J Int AIDS Soc 2022; 25(1): e25861.
| Crossref | Google Scholar | PubMed |
35 Auvert B, Buvé A, Ferry B, et al. Ecological and individual level analysis of risk factors for HIV infection in four urban populations in sub-Saharan Africa with different levels of HIV infection. AIDS 2001; 15: S15-S30.
| Crossref | Google Scholar | PubMed |