

Pregnancy scanning of sheep in southern Australia. 1. Scanning for litter size was profitable across all modelled regions, times of lambing and genotypes
John M. Young A , David J. Brown B and Forbes D. Brien C *
A
B
C
Abstract
Pregnancy scanning allows ewes to be separately managed by litter size class to: (1) meet recommended condition score targets to enhance survival and progeny productivity, (2) prioritise allocation of multiple-bearing ewes to smaller mobs or more sheltered lambing paddocks, and (3) select replacement ewes based on birth type. However, 70% of Australian sheep producers are not scanning for litter size.
To establish the profitability of pregnancy scanning in southern Australia, to build a stronger business case to address the key perception by non-adopters that the case is weak.
The profitability of pregnancy scanning was modelled, across three regions (long, medium and short growing seasons in southern Australia), three different genotypes (Merino, Merino × terminal and a maternal flock) and three lambing times (autumn, winter and spring) using the Australian Farm Optimisation Model. A simpler gross margin analysis was used to include the summer rainfall regions.
Implementing optimal ewe nutritional management, paddock allocation and replacement strategies based on litter size was profitable in all the scenarios of region, genotype, time of lambing and price tested. The increase in profitability in the winter rainfall zone averaged across the scenarios tested was A$5.75/ewe scanned. In the summer rainfall zone, the average increase in profit was A$4.44/ewe scanned. Profitability was sensitive to sheep meat prices, but not sensitive to wool and supplement prices, nor overall reproductive rate.
There is a strong business case for pregnancy scanning ewes for litter size via: (1) selling of non-pregnant ewes (A$1.75/ewe), (2) better allocation of feed based on litter size (A$2.00/ewe), (3) allocating multiple-bearing ewes to the best lambing paddocks and/or reducing mob size to enhance lamb survival (A$1.00/ewe), and (4) accounting for birth type when selecting breeding replacements (A$1.00/ewe).
Pregnancy scanning for litter size is a relatively low-cost, high-profit and vital tool for improving reproductive rate, lamb and ewe survival rates, and lamb growth rates. Our findings extend previous, more limited studies, in terms of their reach across different regions, genotypes and production systems.
Keywords: AFO, Australian Farm Optimisation model, breeds, fecundity, genotypes, lambing dates, litter size, pregnancy scanning, profit, sheep.
Introduction
Pregnancy scanning in mid-gestation using trans-abdominal ultrasonography (Fowler and Wilkins 1984) is an enabling technology for improving management of ewes and their lambs based on detected pregnancy status and litter size. Improvements in twin lamb survival of 14% have been demonstrated between twin-bearing Merino ewes lambing in a condition score of 3.2 compared with those in an average condition score of 2.2 (Behrendt et al. 2011). Separation by litter size also allows the implementation of further management techniques, including reduced mob size and the provision of more sheltered paddocks for ewes bearing multiples. Both these techniques have been demonstrated to improve twin and triplet lamb survival (Lockwood et al. 2019; Masters et al. 2023; Lockwood et al. 2023) and increase profitability (Young et al. 2014; Lockwood et al. 2020; Young et al. 2025).
Culling empty ewes and retaining better performing ewes longer in the flock should also lead to improvements in net reproduction rate, because the repeatability of fertility, fecundity and lamb rearing ability are well above zero (Lee et al. 2009; Hebart et al. 2010; Kleemann et al. 2016). The extent of improvement of net reproduction rate from ewe culling and retention strategies has been estimated to be between 2% and 6% by Lee et al. (2014). In support of Lee et al. (2014), improvements in overall net reproductive rate in this range have also been reported in an empirical study of three Merino resource flocks (Hatcher et al. 2018). There are also other benefits from pregnancy scanning that are either difficult to quantify or occur only occasionally, which reduces their economic importance. These include the ability to be more proactive about animal welfare, through better understanding of both ewe and lamb losses; providing a focus for improvement of reproductive management; generating the ability to prepare the lambing feed budget in advance ;and earlier detection of any reproductive failure, that enables more rapid identification and re-mating of empty ewes.
Three surveys of Australian sheep producers have documented that approximately 40–50% of respondents scan their flocks (Howard and Beattie 2018; SSF 2022), and approximately 30% scan for fetal numbers (Howard and Beattie 2018; SSF 2022, 2024). These results indicate that approximately 70% of Australian sheep producers cannot optimise management of ewe nutrition; effectively allocate paddocks at lambing; and select replacement ewes based on reproduction, as they are not scanning ewe flocks for fetal numbers. In contrast, adoption of pregnancy scanning in New Zealand is much higher, at 70.9%, with most scanning for fetal numbers (Corner-Thomas et al. 2015). The lower adoption in Australia could be due to conflicting messages in industry about the profitability of pregnancy scanning. A survey of producers in Western Australia showed that producers were approximately equally divided on its value (Elliott et al. 2011). In the survey by Howard and Beattie (2018), the most common reason sheep producers gave for not pregnancy scanning was that they could ‘see no benefit’ (31% of respondents).
Some previous economic studies have suggested pregnancy scanning can help increase profitability (Bowman et al. 1989; Young et al. 2016), whereas others suggest the cost of scanning is not recouped from management that can be implemented (Holmes and Sackett 2008; McGrath et al. 2016). It is clear that a comprehensive business case, expanding on Young et al. (2016), to include a range of regions, genotypes and times of lambing will greatly assist the clarification of the business case for pregnancy scanning. This paper presents a comprehensive economic analysis of the benefits of pregnancy scanning sheep, across three regions in the winter rainfall zone of southern Australia, three genotypes and three different times of lambing (the ‘winter rainfall analysis’). In addition, a supplementary study for the summer rainfall region was undertaken using a gross margin approach (the ‘summer rainfall analysis’). A previous account of the study described in this paper is given in Brien et al. (2023).
Materials and methods
For definition purposes, we refer to animals that are scanned with no detectable fetuses as ‘empty’ rather than ‘dry’ to differentiate ewes that are identified with no udder development after lambing. Ewes that are scanned with two or more fetuses are termed ‘multiples’. Management changes that are facilitated by pregnancy scanning and that are included in this analysis are: (1) sale of empty ewes to remove low reproductive rate animals and, if sold at scanning, reduce flock feed demand; (2) preferential retention of older ewes with a record of conceiving twins; (3) differential nutrition of empty, single- and multiple-bearing ewes during late pregnancy to target nutrition to the most responsive class of ewe with respect to: (a) improving perinatal ewe or lamb survival by increasing nutrition to multiple-bearing ewes to reduce mortality due to starvation and mis-mothering; (b) reducing nutrition to single-bearing ewes to reduce mortality due to dystocia; and (c) altering wool production of the progeny during their lifetime; (4) differential nutrition during lactation and post-weaning to target growth of lambs and weaners to maximise sale value from limited paddock feed and supplement; (5) differential allocation of limited shelter resources and better lambing paddocks between single- and multiple-bearing ewes to increase average lamb survival; and (6) altering management and selection decisions for replacement young ewes based on birth-type.
Calculating the profitability of pregnancy scanning also requires accounting for the costs of pregnancy scanning. The costs include the cost of contractors, labour and use of infrastructure in the scanning operation, and any change in stock numbers or supplementary feeding required to meet altered nutritional targets. The complexity of the calculations required to represent the reallocation of feed and the production impacts of pregnancy scanning suggest that a modelling framework was desirable.
Winter rainfall analysis
The winter rainfall analysis was conducted with the deterministic steady-state equilibrium mode of the Australian Farm Optimisation model (AFO; Young et al. 2023, 2024). AFO is a major upgrade on the MIDAS model, which has been used extensively in Australia (Abadi and Pannell 1991; Monjardino et al. 2010; Young et al. 2011). The model calculates the profitability of the whole flock based on the productivity of each class of stock (including clean fleece weight, fibre diameter, liveweight, weaning rate and mortality), commodity prices and the farm carrying capacity calculated in the detailed feed budget. As an optimising model, it calculates the optimum stocking rate, nutrition profile, pasture grazing intensity, and rate of grain feeding that will maximise profitability and optimise productivity of the animals in the flock. The model accounts for changes in age structure and the change in ewe energy requirements that result from increasing lamb survival or altering the number of ewes pregnant or lactating with singles or twins. Furthermore, the model can optimise time of sale within year, accounting for feed requirements, growth profile and carcase specifications. Sale or retention of ewes scanned empty was also optimised with sale options at scanning and shearing. Sale of the empty ewes increased reproduction rate in subsequent age groups.
AFO includes the ability to compare and optimise within-year nutritional management of each animal class. This capacity to optimise the feed allocation and optimise the nutrition profile for empty, single- and multiple-bearing ewes was useful for this analysis, because a major driver of the profitability of pregnancy scanning is the differential management of the nutrition of the ewes based on pregnancy status and litter size (Young et al. 2016). A simulation model was used to populate the production parameters for the decision variables that represent the nutrition profile options included for each class of sheep in the mathematical programming model. The simulation model estimates the impact of nutrition on animal growth rate, wool production, reproduction, mortality, energy requirements and voluntary feed intake using relationships described in the literature (Freer et al. 2012; Behrendt et al. 2019) or derived from research projects (AN Thompson and G Kearney, pers. comm.).
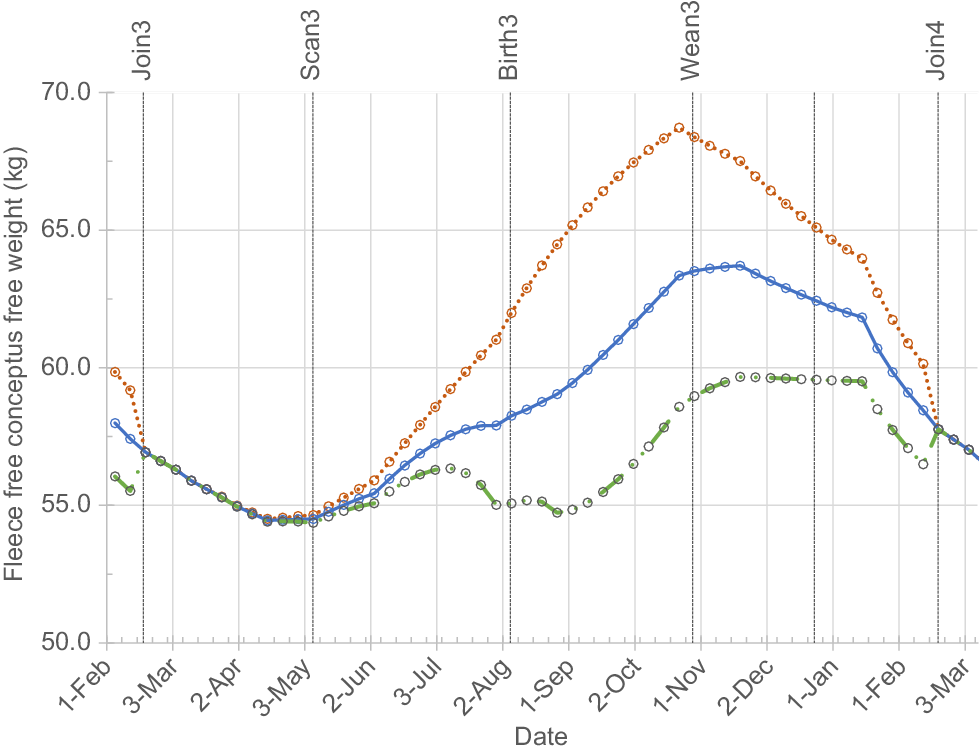
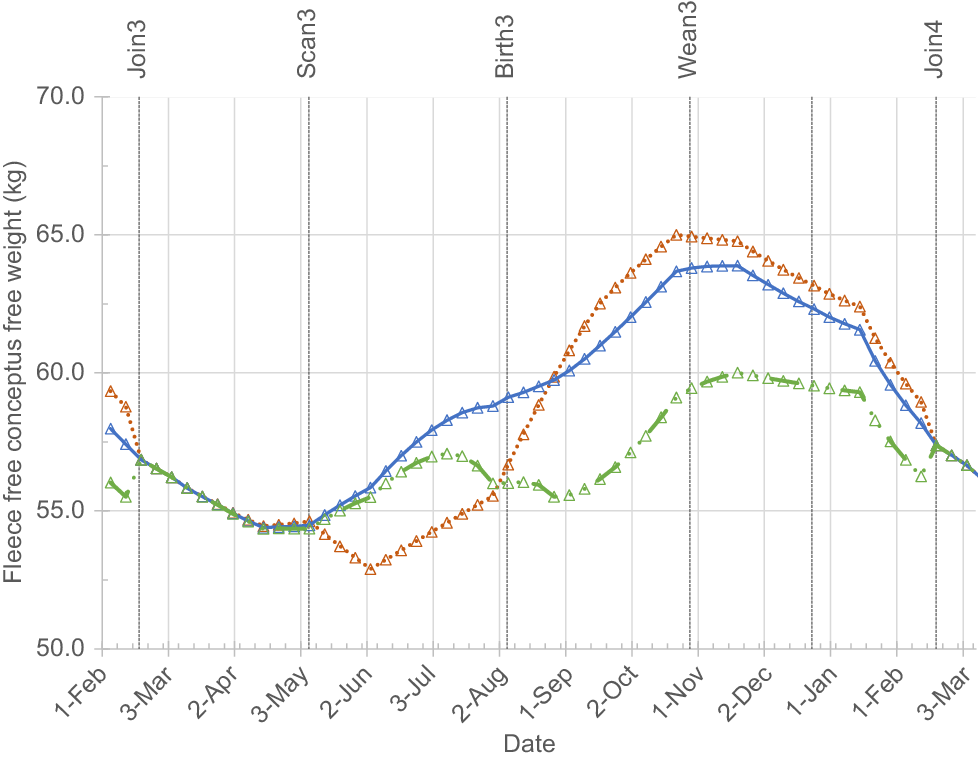
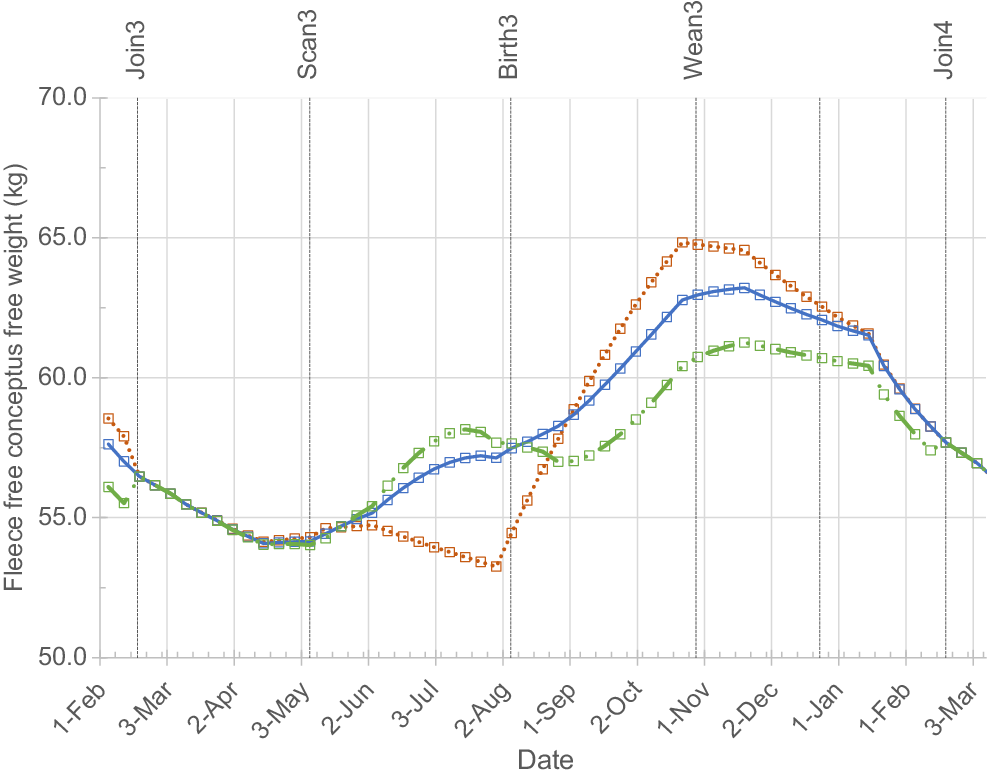
Valuing differential feeding of empty, single- and multiple-bearing ewes requires identifying the optimum nutrition profiles for ewes carrying different numbers of fetuses. The nutrition profiles for the empty, single- and multiple-bearing ewes for each level of scanning (not scanned, pregnancy status only or multiple) were optimised for the standard price scenario prior to the main economic analysis. The resulting feed requirement and production levels were used in all the sensitivity testing. The pre-optimisation of the feed supply profiles compared 81 or 243 different nutrition profiles for each animal class each year. This accounts for the combinations of lower, standard and higher nutrition profiles for the duration of each of three or four ‘feed variation’ periods during the year. Previous testing has shown that it was computationally more efficient to use the above process iteratively than compare more combinations of feed levels and ‘feed variation’ periods in a single model solution. For this analysis, eight iterations comparing a total of approximately 1300 nutrition profiles were conducted using the optimum feed supply from the previous iteration with different combinations of ‘feed variation’ periods and with different ranges between the low- and high-nutrition options. The ‘feed variation’ periods included in all eight iterations were between joining, scanning and lambing; additional periods utilised in some iterations were weaning, and two options in the period between weaning and the following joining. In the period prior to scanning, the ewes with different numbers of fetuses are managed together and the weights diverge slightly due to differences in energy requirements. After scanning, the ewe nutrition profiles are optimised for the groups that are identified by scanning. If ewes are not scanned (Fig. 1), then the empty ewes gain weight relative to the single-bearing ewes during late pregnancy and the twin-bearing ewes lose weight. If the ewes are scanned for pregnancy status (Fig. 2), then the nutrition level of the empty ewes was reduced at scanning. If the ewes are scanned for multiples (Fig. 3), then the single- and multiple-bearing ewes can be differentially fed after scanning. The ewes that conceived in different cycles were managed as a single mob, and the value that could be achieved from fetal aging was not quantified in this analysis.
Example of optimum profile for 3-year-old Merino ewes, empty (…), single-bearing (__) and twin-bearing ewes (_ ..) from the medium rainfall region (Geological Survey of Western Australia) with spring lambing if the flock was unscanned and there was no differential management.
Example of optimum profile for 3-year-old Merino ewes, empty (…), single-bearing (__) and twin-bearing ewes (_ ..) from the medium rainfall region (Geological Survey of Western Australia) with spring lambing if the flock was scanned for pregnancy status, and the non-pregnant ewes were identified and differentially managed from scanning to the following joining.
Example of optimum profile for 3-year-old Merino ewes, empty (…), single-bearing (__) and twin-bearing ewes (_ ..) from the medium rainfall region (Geological Survey of Western Australia) with spring lambing if the flock was scanned for multiples, and the empty, single- and multiple-bearing ewes were differentially managed from scanning to the following joining.
Three regional versions of the AFO model were used, each representing a different length growing season (the regions are discussed later). A total of approximately 3200 scenarios were tested in the winter rainfall analysis being combinations of region, genotype, time of lambing and prices with sensitivity analyses of flock reproductive rate, sale strategy of empty ewes, sale strategy of older ewes, the benefit from differential allocation of lambing paddocks and the prediction equations used for lamb survival. The scenarios and sensitivity analyses are described below and summarised in Table 1.
| Management | Benefits | Winter rainfall | Summer rainfall | |
|---|---|---|---|---|
| Sale of empty ewes | Reduce feed demand | ✓ | ✓ | |
| Increase subsequent reproductive rate (RR) | ✓ | ✓ | ||
| Receive premium price | ✓ | ✓ | ||
| Retain older ewes | Increase subsequent RR | ✓ | ✗ | |
| Differential nutrition | Increase lamb survival | ✓ | ✓ | |
| Reduce ewe mortality | ✓ | ✓ | ||
| Increase progeny wool value | ✓ | ✓ | ||
| Differential paddock allocation | Increase lamb survival | ✓ | ✓ | |
| Management of replacements | Sale value, lifetime production | ✓ | ✗ | |
| Analysis assumptions | ||||
| Feed budget methodology | MJ of ME in 10 feed periods | DSE/hd in the feed limiting period | ||
| Scenarios represented | ||||
| Regions | 3 | 1 | ||
| Genotypes and time of lambing | 9 | 5 | ||
| Prices | 7 | 6 | ||
| Sensitivity analyses | ||||
| Sale strategy of empty ewes | 4 | 2 | ||
| Sale strategy of older ewes | 2 | – | ||
| Sale strategy of wethers | – | 2 | ||
| Reproductive rate | 5 | 4 | ||
| RR increase if empties sold | 5 | – | ||
| Paddock allocation benefits | 4 | – | ||
| Prediction equations | 2 | – | ||
Including the management strategies and benefits included (✓) or excluded (✗), important analysis assumptions and the number of scenarios and sensitivity levels tested. DSE, dry sheep equivalent.
Summer rainfall analysis
The summer rainfall analysis was conducted using an Excel-based gross margin approach, because there was not a calibrated version of AFO for this region. The important production drivers identified in the winter rainfall analysis were incorporated in the gross margin. It was necessary to estimate the impact of the alternative management on the amount of grain feeding required and the stocking rate of the ewes with different pregnancy outcomes. These assumptions were informed by a survey of producers in the region that were already pregnancy scanning their flocks. A total of 195 scenarios were tested in the summer rainfall analysis selected from five scenarios of breed and time of lambing, six price scenarios, four scenarios for fertility, two scenarios for sale strategy of empty ewes and two scenarios for sale age of wethers (Table 1).
Production assumptions
The two main sources of data to quantify the impact of potential management changes were the relationships used in the GrazPlan suite of models (Freer et al. 2012) and the relationships developed from data collected in the LifetimeWool Project (LTW; Oldham et al. 2011; Thompson et al. 2011), and other subsequent unpublished analyses of the dataset. Where possible the assumptions made in the modelling analysis and the gross margin analysis were aligned; however, this was not always possible because of limitations in the gross margin framework. The important production assumptions to calculate the profitability of pregnancy scanning include the following, and it is mentioned where there are differences between the two modelling approaches:
For the detailed modelling, this has been done using the equations from the Australian Feeding Standards (Freer et al. 2007) and as updated in Freer et al. (2012). For the gross margin analysis, the feed budget was based on varying the dry sheep equivalent per head for the different animal classes based on the estimated energy requirement of the ewes during the feed-limiting period of the year.
This was predicted from relative size, relative condition and day of joining using equation 122 of Freer et al. (2012). The relationships predict a large increase in the proportion of empty ewes with early mating (especially in the long growing season environment), which was associated with lambing in April.
Two sources were compared for the relationship describing lamb mortality and the connection with level of ewe nutrition and the chill index at lambing associated with region and paddock allocation. (1) Standard: reanalysis of the data collected in the LTW project (Oldham et al. 2011). The method for estimating lamb survival developed in the LTW project was a two-step process. First, calculating lamb birthweight from the ewe liveweight profile, sex of the lamb and birth type. Then calculating transformed lamb survival from birthweight, birth type, sex, chill index and feed on offer at lambing, which was then back transformed. (2) Alternative: equation 128–130 in the GrazPlan suite of models (Freer et al. 2012). These relationships calculate a transformed mortality index from ewe body condition at lambing, birth type and chill index. The mortality index was back transformed to mortality. The GrazPlan equations predict less difference between the survival level of single and twin born lambs associated with changes in dam nutrition and chill level at lambing. The summer rainfall analysis used the GrazPlan relationships, because the inputs for the GrazPlan relationship are less onerous.
Dystocia. If using the GrazPlan equations to predict peri-natal lamb mortality, then dystocia was represented in the winter rainfall analysis using equation 127 of Freer et al. (2012). Dystocia was not explicitly represented if using the LTW relationships, because the quadratic functional form represents increasing mortality with high birthweight.
The effect of altering paddock allocation to reduce twin lamb mortality due to chill was based on calculations using the lamb survival equations described above. The assumption was that there was a range of chill index of 100 kJ/m2.h between the less exposed and more exposed lambing paddocks (McCaskill et al. 2010). It was assumed that 50% of the paddocks were less exposed and 50% were more exposed. If the ewes have been scanned for litter size, they can be differentially allocated to lambing paddocks to increase average lamb survival. The multiple-bearing ewes can displace single-bearing ewes in the sheltered paddocks until either there are no multiple-bearing ewes in the exposed paddocks or no single-bearing ewes in the sheltered paddocks. Therefore, at either very low or very high reproductive rate, the numbers reallocated are reduced and the resulting benefits are low.
The impact on lamb survival from altering mob size at lambing was based on Lockwood et al. (2020). This was tested as an alternative to allocating ewes to lambing paddocks based on chill index. It was assumed that there was no variation in chill index across paddocks, but that multiple-bearing ewes were differentially allocated to the smaller paddocks.
The impact of nutrition on the fleece production of the ewes was based on the wool production relationships from the GrazPlan suite of models, but only including the impact of energy intake and not including protein (equations 77, 78, 80 and 81). It was not included in the gross margin analysis.
The impact of birth type/rear type and dam nutrition on the production of wool (fleece weight and fibre diameter) of the progeny during their lifetime was estimated using the relationships from the LTW project (Thompson et al. 2011). Progeny from ewes that achieved higher condition score targets during pregnancy had higher fleece weights and lower fibre diameter. This contributed to changing the optimum nutrition profile for ewes during pregnancy (Young et al. 2011).
Ewe mortality around the time of lambing was estimated in the LTW project from absolute condition score of the ewe at the point of lambing, and this has been used in both the winter and summer rainfall analyses. The GrazPlan models estimate mortality of multiple-bearing ewes due to pregnancy toxaemia in the last 6 weeks of gestation from maternal liveweight loss over this period, and these relationships have also been used in this analysis.
The weaner survival relationships used in AFO was a combination of the relationships derived by Campbell (2006) based on weight at weaning and post-weaning liveweight change, and equation 125 from Freer et al. (2012). This was not included in the gross margin analysis.
Relationships for the response in subsequent flock reproductive rate from culling once- or twice-empty ewes (the ‘passengers’), or from retaining 50% of the 5.5-year-old ewes with the highest net reproductive rate until 6.5 years old (the ‘performers’) were derived from the ‘Passenger vs performers’ empirical research project (Hatcher et al. 2018), which analysed data from three Australian Merino research flocks.
The findings in an allied study (Brien et al. 2023) were included, which showed that there was an 85% rather than 100% agreement between scanning and the lambing outcome for litter size. The adjustment used in the gross margin analysis was the average reduction in the value of scanning (A$/ewe) estimated in the detailed modelling.
Genotypes examined
Three genotype systems were examined in the analysis:
‘Merino-Merino’ – Merino ewes mated to Merino rams. The production system was a self-replacing flock comprising a medium wool genotype (20 μm) in the winter rainfall analysis, and a fine wool genotype (16.9 μm) in the summer rainfall analysis. Surplus young ewes and all wethers are sold off shears after the hogget shearing at approximately 18 months of age. Young ewes are first mated to lamb at 2 years of age. Old ewes (culled for age) are sold off shears at 5.5 or 6.5 years of age (whichever was most profitable).
‘Merino-terminal’ – A self-replacing flock based on the same ewe genotype as the ‘Merino’ flock. Ewes surplus to requirements for replacing the pure-bred Merino flock are mated to terminal sires to produce first cross prime lambs, and are sold off shears at 6.5 years of age. All crossbred lambs are sold when they achieve 45 kg, the timing varies with birth type/rear type and dam parity, but was approximately 6 months of age.
‘Maternal’ – a self-replacing flock based on a maternal composite genotype. Surplus young ewes and all wethers are sold as lambs. All of the young ewes that are retained are mated at between 7 and 8.5 months of age, depending on time of lambing; in the earlier mated flocks the ewe lambs are mated older. Old ewes (culled for age) are sold off shears at 5.5 or 6.5 years of age (whichever was most profitable).
Regions and times of lambing examined
Three times of lambing were examined in each of the four regions; although in the gross margin analysis, not all lambing times were investigated for all the flocks. The regions included and the date of commencement of lambing from a 5-week joining period examined in the analysis were:
Winter rainfall south-west Victoria. A 600–650 mm winter rainfall zone in the Hamilton region in south-west Victoria with a 9-month growing season, with 100% pasture enterprises. The times of commencement of lambing in this region were 15 April, 1 June and 5 August.
Winter rainfall Great Southern in Western Australia (WA). A 500–600 mm winter rainfall zone in the Darkan region in WA with a 6-month growing season, typically 40–50% of the farm in crop. The times of commencement of lambing in this region were 15 May, 18 June and 23 July.
Winter rainfall Cereal Sheep zone. A 350–400 mm winter rainfall zone in the Cunderdin region in WA with a 4.5 month growing season, typically 70–80% of the farm in crop. The times of commencement of lambing in this region were 15 May, 18 June and 23 July.
Summer rainfall Northern Tablelands. An approximately 800 mm summer rainfall region of New South Wales that is dominated by Merino fine wool production, with an 8-month growing season for its predominantly native pasture-base. The times of commencement of lambing in this region were 1 August, 1 September and 20 September, which represents the spread in the producers that were surveyed.
Cost and price assumptions
The cost of scanning includes both the cost of the contractor, and the labour and infrastructure costs associated with mustering and running the ewes through the scanning crate. The contract cost for scanning was based on the charge rate of a large industry contractor being A$0.50/ewe if scanning for pregnancy status and A$0.75/ewe if scanning for multiples, both plus approximately A$0.02/ewe for travel. The cost of labour for mustering, yard work, and repairs and maintenance to infrastructure, if all labour was provided by casual labour, varied between A$0.31/ewe if scanning for pregnancy status, and up to A$0.40/ewe if scanning for multiples with the increase due to the lower throughput.
The price scenarios examined were based on the percentiles of the nominal output prices received over the period 2004–2020. The values that varied were the 21-μm price guide (Mecardo 2023), the premium for fine wool (Mecardo 2022, based on the price of other fibre diameters relative to 21 μm), meat prices (Mecardo 2023) and grain prices (Mecardo 2023). The baseline prices used (Table 2) are the 70th percentile nominal prices for meat and wool, and the 50th percentile nominal prices for grain and the premium for fine wool over the period 2004–2020. The higher percentile used for meat and wool reflects those prices having been trending up over the period prior to conducting this analysis. Seven price scenarios were tested, each commodity was varied with the other commodities at the standard level: wool prices in the 50th, 70th and 80th percentile, meat in the 50th, 70th and 90th percentile, and grain in the 20th, 50th and 80th percentiles. A sensitivity analysis was not conducted on the premium for fine wool.
| Commodity | Units | Baseline price (A$) | Low (A$) | High (A$) | |
|---|---|---|---|---|---|
| Wool | |||||
| 16 μ | c/kg clean (fleece) | 1894 | 1603 | 2433 | |
| 18 μ | c/kg clean (fleece) | 1515 | 1280 | 1875 | |
| 20 μ | c/kg clean (fleece) | 1290 | 1090 | 1425 | |
| 22 μ | c/kg clean (fleece) | 1235 | 1050 | 1305 | |
| Meat | |||||
| Lamb A | c/kg dressed weight | 565 | 465 | 670 | |
| Mutton B | c/kg dressed weight | 385 | 285 | 490 | |
| Breeders C | A$/hd | 120 | 100 | 140 | |
| Wethers D | A$/hd | 102 | 85 | 120 | |
Modelling of the base case (winter rainfall zone)
The optimised base case farms not utilising pregnancy scanning for the nine winter rainfall farm scenarios of region and genotype are described in Table 3. The management optimised includes land use, livestock nutrition profile, stocking rate, grain feeding and flock age structure. The farms vary in productivity and profitability. Profit per hectare, proportion of the farm in pasture, stocking rate and reproductive rate increased with length of the growing season. Lamb survival and clean fleece weight followed the opposite trend being higher, or in the case of the maternals, unchanged in the shorter growing season environments.
| Factor | Unit | Merino-Merino | Merino-Terminal | Maternal | |||||||
|---|---|---|---|---|---|---|---|---|---|---|---|
| Long | Med. | Short | Long | Med. | Short | Long | Med. | Short | |||
| Financial | |||||||||||
| Farm profit | A$/ha | 341 | 324 | 167 | 413 | 354 | 176 | 345 | 239 | 161 | |
| Land use | |||||||||||
| Area of pasture | % | 100% | 56% | 30% | 100% | 60% | 32% | 100% | 47% | 32% | |
| Stock management | |||||||||||
| Time of lambing | Spr. | Spr. | Spr. | Spr. | Spr. | Spr. | Spr. | Spr. | Aut. | ||
| Stocking rate | DSE/ha | 16.5 | 11.2 | 7.1 | 17.0 | 12.3 | 7.7 | 15.8 | 9.5 | 6.1 | |
| Supplement fed | kg/DSE | 21.8 | 11.0 | 11.8 | 17.3 | 9.0 | 13.5 | 31.2 | 25.0 | 5.1 | |
| Production | |||||||||||
| Reproductive rate | Ave % | 128% | 125% | 118% | 130% | 125% | 118% | 165% | 151% | 124% | |
| Lamb survival | Singles% | 81% | 88% | 94% | 81% | 88% | 94% | 88% | 90% | 92% | |
| Twins% | 56% | 68% | 81% | 59% | 70% | 82% | 72% | 75% | 75% | ||
| Number of lambs weaned.ewe joined (flock ave.) | % | 81% | 93% | 99% | 84% | 94% | 100% | 117% | 115% | 97% | |
| Clean fleece weight (adult ewes) | kg/hd | 3.4 | 3.6 | 4.0 | 3.5 | 3.6 | 3.9 | 3.1 | 3.2 | 3.1 | |
| Fibre diameter (adult ewes) | μ | 17.6 | 19.0 | 19.8 | 17.6 | 19.0 | 19.8 | 34.2 | 33.8 | 34.0 | |
The scenarios presented are the time of lambing that had the highest profitability for each flock type in the long growing season environment (south-west Victoria), medium growing season environment (Great Southern of WA) and the short growing season environment (cereal sheep zone). Extra details, covering all scenarios of region, flock and time of lambing, are available in Tables S1, S2 and S3 of the supplementary material.
Sensitivity analysis assumptions: winter rainfall
Sensitivity analysis was conducted to test the robustness of the findings. For each of the 189 region by flock by time of lambing by price scenarios in the winter rainfall analysis, a number of levels were examined for each of:
Flock reproductive rate. Five levels: One was the standard level as predicted by the GrazPlan relationships, the others were scaled ±15% and ±30% from the expected value.
Reproduction rate increase expected from culling the ‘passengers’. Five levels: One level was the standard the others were scaled ±25 and ±50% from the standard.
Paddock allocation benefits. Five levels: One level was the standard, which was based on an average chill of 850 kJ/m2.h and two higher levels of 1000 and 1200 kJ/m2.h. The fourth level was replacing the effect of chill with the benefits expected from differential allocation of ewes based on optimum mob size.
Lamb survival prediction equations. Two levels: the LTW prediction equations were the standard, and compared with the GrazPlan lamb survival equations. For this sensitivity analysis, the calculated chill index varied by ±10%.
Sale strategy for empty ewes (passengers). Four levels: The standard was optimising management, the alternatives were forced retention, sale of all empty ewes (once empty) and sale of twice empty ewes.
Sale strategy of older ewes (performers). Two levels: The standard was optimising the sale age (5.5 years old or 6.5 years old), the alternative was forcing sale of 50% of the 5.5-year-old ewes.
Results
The value of scanning
Pregnancy scanning for multiples increased profit by an average of A$5.75/ewe scanned in the winter rainfall analysis, and A$4.44/ewe scanned in the summer rainfall analysis (Tables 4 and 5). This represents approximately a 400% return on the expenditure for contract costs and the extra on-farm labour associated with the scanning operation. Scanning for multiples increased profit in all 3400 scenarios examined across region, breed, time of lambing, reproductive rate sensitivity, price scenario and prediction equations. If scanning was 100% accurate in predicting the lambing outcome, then the value of scanning for multiples in the winter rainfall analysis increased to A$6.30/ewe scanned.
| Region and Flock | Time of lambing | |||
|---|---|---|---|---|
| Autumn | Winter | Spring | ||
| (A$/ewe) | (A$/ewe) | (A$/ewe) | ||
| Winter rainfall: long growing season | ||||
| Merino | 7.20 | 10.60 | 3.80 | |
| Merino-terminal | 6.40 | 8.80 | 6.00 | |
| Maternal | 7.50 | 8.80 | 5.40 | |
| Winter rainfall: medium growing season | ||||
| Merino | 7.80 | 2.80 | 5.50 | |
| Merino-terminal | 9.80 | 5.20 | 3.70 | |
| Maternal | 5.80 | 4.20 | ||
| Winter rainfall: short growing season | ||||
| Merino | 4.60 | 4.60 | 1.20 | |
| Merino-terminal | 5.20 | 4.70 | 1.90 | |
| Maternal | 8.40 | 3.50 | 6.50 | |
| Average | 7.00 | 6.10 | 4.25 | |
| Overall average | 5.75 | |||
Estimated for 85% agreement between scanning results and lambing outcome.
| Region and flock | Time of lambing | |||
|---|---|---|---|---|
| 1 Aug | 1 Sep | 20 Sep | ||
| (A$/ewe) | (A$/ewe) | (A$/ewe) | ||
| Summer rainfall region | ||||
| Merino | 3.85 | |||
| Merino-terminal | 7.52 | 7.06 | ||
| Maternal | 2.01 | 1.74 | ||
| Overall average | 4.44 | |||
Estimated for 85% agreement between scanning results and lambing outcome.
Scanning for pregnancy status
Scanning for pregnancy status only and altering the management of the empty ewes increases profit in all flocks that were scanning prior to the main feed deficit (Table 6). The increase in profit for flocks lambing prior to the feed deficit ranged from A$2/ewe for Merinos in the short growing season environment up to A$8.50/ewe for the maternal flock in the short growing season environment. Scanning for pregnancy status was not profitable in some regions/flocks if the scanning occurred after the main feed deficit. In these cases, which were both Merinos, the reproduction and feed benefits achieved were less than the cost outlay for scanning and the reduction in the wool production potential of the flock.
| Length of growing season/time of lambing | Value | Optimum sale strategy of empty ewes | Contribution of the Component A | |||
|---|---|---|---|---|---|---|
| (A$/ewe) | (A$/empty) | Passengers (A$/ewe) | Nutrition B (A$/ewe) | |||
| Long growing season – Merino | ||||||
| Autumn | 5.30 | 21.10 | Twice-empty | 4.30 | 1.80 | |
| Winter | 4.40 | 33.20 | Once-empty | 3.80 | 1.20 | |
| Spring | 0.90 | 8.90 | Once-empty | 1.30 | 0.00 | |
| Long growing season – maternals C | ||||||
| Autumn | 7.10 | 26.60 | Twice-empty | 13.00 | 0.20 | |
| Winter | 7.20 | 67.10 | Once-empty | 11.40 | 0.40 | |
| Spring | 2.80 | 30.60 | Once-empty | 8.40 | 0.40 | |
| Medium growing season – Merino | ||||||
| Autumn | 6.10 | 35.40 | Once-empty | 2.70 | ||
| Winter | −1.40 | −10.10 | Twice-empty | 0.20 | −0.70 | |
| Spring | 1.50 | 11.30 | Twice-empty | 0.40 | 2.50 | |
| Medium growing season – maternals | ||||||
| Autumn | 2.60 | 21.00 | Once-empty | −2.40 | ||
| Winter | Once-empty | 8.60 | −7.60 | |||
| Spring | 0.40 | 3.90 | Once-empty | 4.80 | −2.80 | |
| Short growing season – Merino | ||||||
| Autumn | 2.00 | 10.10 | Once-empty | 3.70 | 1.60 | |
| Winter | 0.80 | 5.40 | Twice-empty | 0.30 | −0.30 | |
| Spring | −0.20 | −1.50 | Twice-empty | 0.60 | −0.10 | |
| Short growing season – maternals | ||||||
| Autumn | 8.50 | 62.40 | Once-empty | 11.70 | −0.30 | |
| Winter | 4.80 | 60.30 | Once-empty | 7.90 | 1.50 | |
| Spring | 3.30 | 39.00 | Once-empty | 4.60 | 0.10 | |
| Overall average | 3.30 | 25.00 | ||||
Assuming 100% agreement between scanning and lambing.
Selling the passenger ewes to increase reproductive rate and reduce flock feed demand was the major contributor to the profitability of scanning for pregnancy status (Table 6). Altering the nutrition of the empty ewes that are retained was a minor contributor, being half or one-third of the value of managing the passengers when selling twice-empty ewes and much less when selling all the empty ewes (once-empty).
It was optimal to sell once-empty ewes for the flocks that were scanning just prior to the main feed deficit provided that the weaning percentage was sufficient for the flock to remain self-replacing when all empty ewes were sold, for flocks not meeting these criteria it was optimal to sell twice-empty ewes. In most of the scenarios, the empty ewes were sold at scanning (Table 7), although for the spring lambing flocks, there was very little difference in profit with time of sale. Retaining empty ewes was the most profitable management for the Merino-terminal sire flocks (results not shown). For maternals, identifying the empty ewes contributes most of the total value of scanning (Table 6), due to the gain in reproduction rate achieved from culling the once-empty ewes.
| Time of lambing | Optimum management | Proportion of empty ewes sold A | Benefit of selling due to reproductive rate B | ||
|---|---|---|---|---|---|
| At shearing | At scanning | ||||
| Long growing season – Merino | |||||
| Autumn | Twice-empty | 0 | 59% | 14% | |
| Winter | Once-empty | 0 | 100% | 15% | |
| Spring | Once-empty | 0 | 100% | 42% | |
| Long growing season – maternals | |||||
| Autumn | Twice-empty | 0 | 51% | 15% | |
| Winter | Once-empty | 0 | 100% | 11% | |
| Spring | Once-empty | 0 | 100% | 22% | |
| Medium growing season – Merino | |||||
| Autumn | Once-empty | 0 | 100% | 34% | |
| Winter | Twice-empty | 0 | 21% | 416% | |
| Spring | Twice-empty | 6% | 15% | 268% | |
| Medium growing season – maternals | |||||
| Autumn | Once-empty | 0 | 100% | 144% | |
| Winter | Once-empty | 0 | 100% | 19% | |
| Spring | Once-empty | 0 | 100% | 39% | |
| Short growing season – Merino | |||||
| Autumn | Once-empty | 0 | 100% | 115% | |
| Winter | Twice-empty | 0 | 25% | 373% | |
| Spring | Twice-empty | 6% | 15% | 176% | |
| Short growing season – maternals | |||||
| Autumn | Once-empty | 0 | 100% | 11% | |
| Winter | Once-empty | 0 | 100% | 33% | |
| Spring | Once-empty | 0 | 100% | 56% | |
Scanning for multiples
The additional value of identifying multiples above scanning for pregnancy status ranged from A$0.30/ewe up to A$10.80/ewe and averaged A$4/ewe scanned (Table 8). This equates to an additional value of A$9.25/ewe scanned with multiples. Paddock allocation at lambing, differential nutrition of singles and multiples, and improved management of replacement progeny contribute approximately equally to the extra benefit of scanning for multiples compared with scanning for pregnancy status only (Table 8). The relative contribution does vary with the region, flock and time of lambing scenario. For the earlier lambing flocks, scanning for pregnancy status was the major contributor to the total value of scanning, and the increment due to scanning multiples was small. The smaller addition from scanning for multiples was a combination of a lower value per multiple-bearing ewe and reduced number of multiple-bearing ewes due to the seasonality of reproduction.
| Time of lambing | Increase in value | Optimum sale strategy of empty ewes and culled-for-age ewes | Contribution of components A | |||||
|---|---|---|---|---|---|---|---|---|
| $/ewe | $/multiple | Performers | Progeny Management | Nutrition | Paddock allocation | |||
| Long growing season – Merino | ||||||||
| Autumn | 1.50 | 6.90 | Twice-empty | −0.30 | 0.20 | 0.80 | 1.00 | |
| Winter | 5.10 | 14.90 | Once-empty | −0.10 | 2.80 | 3.50 | 1.80 | |
| Spring | 2.70 | 7.10 | Once-empty and performers | 0.10 | 1.50 | 1.80 | 1.70 | |
| Long growing season – maternals B | ||||||||
| Autumn | 0.30 | 1.50 | Twice-empty | −1.00 | −0.20 | 0.00 | 0.30 | |
| Winter | 1.60 | 2.70 | Once-empty and performers | 0.30 | 0.00 | 0.10 | 1.60 | |
| Spring | 3.00 | 4.10 | Once-empty | −0.10 | 0.00 | 0.40 | 2.70 | |
| Medium growing season – Merino | ||||||||
| Autumn | 3.10 | 8.90 | Once-empty and performers | 0.20 | 1.90 | 1.90 | 2.60 | |
| Winter | 6.00 | 15.70 | Twice-empty | −0.40 | 1.70 | 1.80 | 2.50 | |
| Spring | 4.30 | 11.20 | Twice-empty | −0.10 | 0.80 | 4.50 | 2.00 | |
| Medium growing season – maternals | ||||||||
| Autumn | 1.30 | 3.00 | Once-empty | −1.80 | 0.70 | 1.00 | 3.10 | |
| Winter | 10.80 | 16.90 | Once-empty and performers | 1.10 | 5.50 | 6.90 | 1.70 | |
| Spring | 10.00 | 16.50 | Once-empty | −2.40 | 4.30 | 4.50 | 3.60 | |
| Short growing season – Merino | ||||||||
| Autumn | 2.80 | 8.90 | Twice-empty and performers | 0.40 | −0.60 | −0.20 | 1.50 | |
| Winter | 4.90 | 13.70 | Twice-empty | −0.10 | 2.40 | 2.30 | 1.80 | |
| Spring | 2.30 | 6.70 | Twice-empty and performers | 0.50 | 1.30 | 1.30 | 2.30 | |
| Short growing season – maternals | ||||||||
| Autumn | 1.90 | 5.70 | Once-empty and performers | 0.30 | −0.70 | −0.60 | 1.00 | |
| Winter | Once-empty and performers | 0.20 | −3.50 | −2.80 | 1.30 | |||
| Spring | 6.10 | 12.60 | Once-empty and performers | 0.30 | 2.90 | 2.90 | 1.40 | |
| Average | 4.00 | 9.25 | −0.20 | 1.45 | 1.95 | 1.90 | ||
The contribution from differential nutrition was equally split between increasing nutrition of multiple-bearing ewes and reducing nutrition of single-bearing ewes. Retaining the most reproductive ewes (the performers) for an extra year adds very little to the value of identifying multiples.
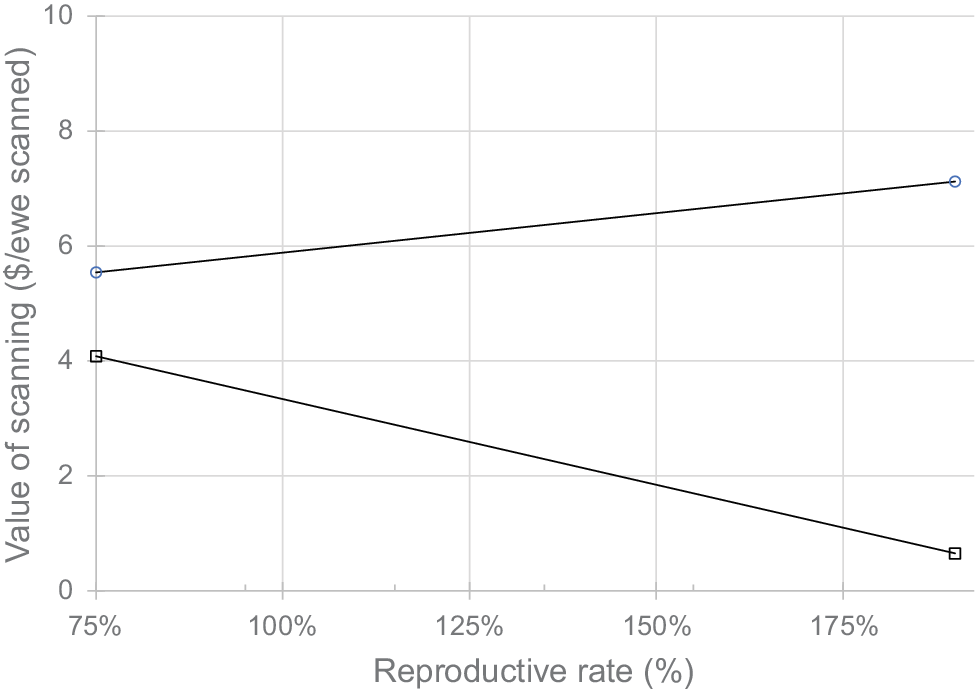
Sensitivity to reproductive rate
Varying reproductive rate had little impact on the increase in profit from scanning for multiples when averaged across the 27 core scenarios (Fig. 4). The range in the total value of scanning was between A$5.20 and A$6.75 per ewe scanned for a range in reproductive rate between 75% and 180%. At the low end of the range of reproductive rate examined, 90% of the benefit can be captured by scanning for pregnancy status only and altering the management of the empty ewes. However, at the high end of the range, only 10% was captured by scanning for pregnancy status only, with the remaining benefit due to differential management of the multiple-bearing ewes.
Change in profit (A$/ewe scanned) at a range of reproductive rate from scanning for multiples compared with not scanning (○); and scanning for pregnancy status only compared with not scanning (□). Values are the average across the 27 core scenarios examined for the three regions, three flocks and the three times of lambing. Details of the sensitivity for each of the 27 core scenarios is available in Figs S1 and S2 of the supplementary material.
Sensitivity to chill
Up to a threshold, environments or years with a higher chill index increase the value of scanning for multiples which enables allocating the multiple-bearing ewes to lamb in the more sheltered paddocks (Fig. 5). Beyond the threshold, further increase reduces the value of differential allocation of paddocks to the multiple-bearing ewes. This threshold was 1000 kJ/m2.h for Merinos and >1200 kJ/m2.h for maternals.
Impact of varying the average chill (kJ m−2.h) at lambing on the value of pregnancy scanning Merino (○) or maternal (□) flocks as affected by the gains in lamb survival due to allocation of the lambing paddocks. Values are the average across the 18 Merino scenarios and nine maternal scenarios examined for the three regions, the two Merino genotypes and the three times of lambing.
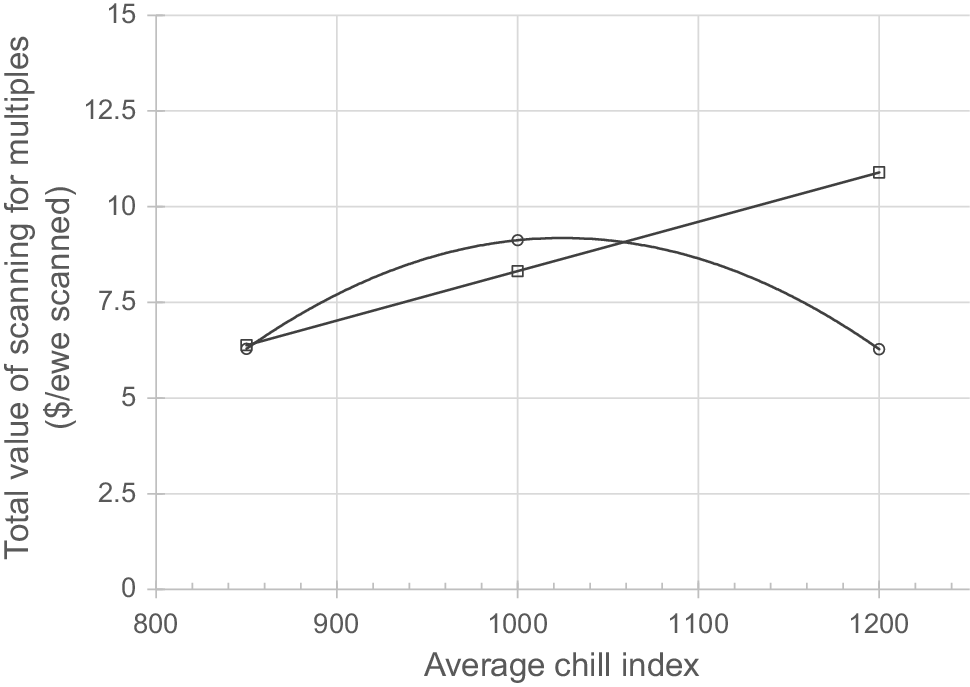
The value of scanning Merino ewes estimated using the GrazPlan relationships was approximately A$1.70/ewe scanned lower than the value using the Lifetime Wool relationships. The difference was very similar for the Merino mated to a terminal sire; however, for the maternal flock, there was little difference between the results of the two prediction equations.
Sensitivity to prices received
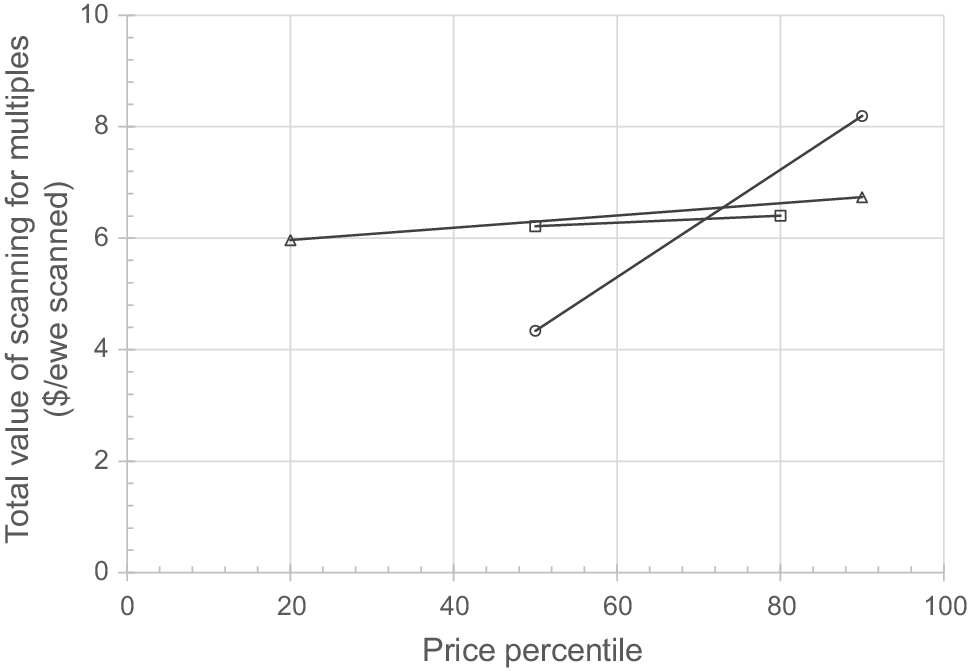
Changing wool prices and grain prices across the price percentile range examined had no consistent effect on the value of scanning, and the average effect was no change (Fig. 6). This was because adopting scanning has little effect on the total quantity of wool produced, and there was not a consistent effect on the total quantity of supplement fed. In contrast, the value of scanning was sensitive to the price of meat, because the quantity of lamb produced was increased. A 10% change in lamb price was associated with a 15% change in the value of scanning.
Impact of altering meat price (○), wool price (□) and grain price (Δ) on the value of scanning for multiples averaged for all 27 scenarios of region, flock and time of lambing. A change from the 50th percentile to the 90th percentile represents a change in the lamb price from 465 c/kg up to 670 c/kg. Details of the sensitivity for each of the 27 core scenarios is available in Figs S3, S4 and S5 of the supplementary material.
Discussion
Pregnancy scanning for multiples, and implementing optimal nutritional management, optimal management of empty ewes, optimal paddock allocation and altering the selection of replacement ewes based on litter size, increased profit for all genotypes, in all regions at all times of lambing over the full range of reproductive rates and prices examined in this analysis. The average increase in profit from scanning for multiples (assuming 85% scanning accuracy) was A$5.75 per ewe scanned in the winter rainfall analysis, and A$4.44 per ewe scanned in the summer rainfall analysis. This analysis, with 3200 winter rainfall and 200 summer rainfall scenarios, was more comprehensive than any prior analysis into the profitability of pregnancy scanning. The benefit from pregnancy scanning accrued from a range of sources, and the contribution of each varied with region, flock and time of lambing. Previous analyses (Bowman et al. 1989; Holmes and Sackett 2008; McGrath et al. 2016; Young et al. 2016) evaluated some, but not all, the components that contribute to the profitability of scanning, and this helps explain the variation in messages associated with the profitability of scanning. This analysis showed that pregnancy scanning is an important strategy for improving profitability in the sheep-meat and wool industries.
The variation in the value of scanning across regions aligned with the timing of scanning relative to the main feed shortage. The maximum value from scanning was achieved for flocks scanned just prior to the main feed deficit of each year. This improves the ability to manage the sale of empty ewes and the nutrition of the retained ewes during the feed shortage. This finding is consistent with the only previous study (Bowman et al. 1989) that evaluated more than one time of lambing. In our analysis, the most profitable timing was June lambing in the long growing season winter rainfall environment, May lambing in the medium and short growing season winter rainfall environments, and early September lambing in the summer rainfall region. Scanning the later lambing ewes was occurring at the end of the main feed deficit in each region, which reduced the value that can be achieved from alternative management of the empty ewes. Therefore, the main benefit for the later lambing flocks was from differential management of the multiple-bearing ewes. The lower value of scanning associated with later lambing does not imply lower profit, in fact, often the later lambing flocks were the most profitable.
In most scenarios examined, scanning only for pregnancy status was profitable; however, it was almost always more profitable to scan for multiples. On average, across the winter and summer rainfall regions, scanning for pregnancy status was only half as valuable as scanning for multiples. The source of the extra benefits of scanning for multiples above just scanning for pregnancy status varied across the scenarios tested, but averaged across regions and flocks, were equally contributed by: (1) differential nutrition of singles and multiples. (2) improved allocation of paddocks at lambing. and (3) improved capacity to manage the replacement progeny from knowing birth type. These results suggest that scanning only for pregnancy status is a good starting point for farmers who are gaining experience with scanning, but that it should be used as a stepping-stone to scanning for multiples.
The AFO-based modelling analysis conducted for the winter rainfall region was more rigorous than the Excel-based gross margin analysis conducted for the summer rainfall region. In the AFO modelling, it was possible to include more production detail and better represent the feed budget. Therefore, we have greater confidence in the results from the AFO modelling analysis than the Excel-based gross margin analysis. However, the close agreement between the summer and winter analyses indicate that the detailed findings of the winter rainfall analysis are representative for the summer rainfall region. As a result, the focus of the remaining discussion is on the results from the detailed modelling.
The management changes (e.g. culling empty ewes, altering nutrition or allocation of lambing paddocks) that contributed to the increase in profit varied with time of lambing, the reproductive rate of the flock, genotype, the environment, sale strategy and scanning type option. This has four implications for industry and future analyses: (1) it is important to include all the management changes facilitated by pregnancy scanning when doing economic evaluations; (2) because of the broad range of benefits, the profitability of pregnancy scanning is less sensitive to changes in any single factor; (3) it will be a challenge to package a message for industry that can accurately portray the variation within industry while still being understandable and demonstrating the overall benefit of scanning; and (4) individual farmers would benefit from knowing the key contributors in their particular scenario, so that they can focus effort and expenditure on the key management practices. The variation between the scenarios tested justify developing a computer-based decision support tool that can help individual farmers prioritise the management practices enabled by scanning. In the absence of this individualised information, the recommendation would be to adopt all the practices that are enabled by scanning.
To capture the potential benefits of scanning requires utilising the information generated by scanning to optimise management. Identifying the optimal management changes was facilitated by the optimisation modelling approach, which provides some confidence that the full suite of management changes has been identified and valued. The following four paragraphs summarise the optimal management adjustments.
If ewes were not differentially fed during pregnancy, the empty ewes were 3–5 kg heavier than the single-bearing ewes at lambing, and the twin-bearing ewes were 3–5 kg lighter than the single-bearing ewes. If empty ewes were identified and not sold, then the optimal management was for empty ewes to lose weight after scanning. The amount of weight (maternal bodyweight) loss depended on the severity of the feed shortage, and the empty ewes were up to 10 kg lighter than the single-bearing ewes at lambing. If the multiples were also identified, it was optimal to increase the feed supply so the twin-bearing ewes were 2–3 kg heavier than the single-bearing ewes at lambing. There was variation in the optimum profile depending on the scenario of region, flock and time of lambing, which adds detail to the optimal profiles identified by Young et al. (2011, 2016). This variation presents an opportunity for further work to increase farmer profit through more comprehensive recommendations for target condition score (CS) profiles.
Adjusting the management of ewes scanned empty was an important component of the total profitability of scanning. Selling once-empty ewes at scanning was most profitable for maternal ewe flocks and Merino flocks that were scanning prior to the main feed deficit, provided the flock weaning percentage was sufficient to allow the flock to be self-replacing, otherwise, selling twice-empty ewes was optimal. Time of sale (at scanning or shearing) was less important for the flocks selling twice-empty ewes, and the most profitable decision depended on the amount of wool on the ewes at scanning versus the value that was realised for that wool if the ewe was sold. Retaining empty ewes was the most profitable management for the Merino-terminal sire flocks, because selling empty ewes reduced the number of surplus ewes mated to the terminal sires. The variation in the optimal management supports the development of a computer-based decision support tool.
Identifying and managing the performers had a low value, increasing profit in some scenarios and reducing it for others. This conclusion contrasts with Lee et al. (2014), however, those authors focused on the impact on net reproductive rate, and did not quantify the reduction in clean fleece weight, the increase in mortality and the reduction in sale price expected for the ewes retained. This variation in conclusion deserves further attention given the adoption of electronic ID and the focus this allows on whole of life reproductive outcomes. This is especially true for the maternal genotypes for which no data were available.
Differential nutrition of single- and multiple-bearing ewes improved lamb survival, progeny wool production, fleece value of the ewes, and ewe mortality. On average, improved lamb survival accounted for 55% of the total value, and progeny wool accounted for 40%. Inclusion of the impact of ewe nutrition on progeny fleece value explained some of the difference in results when compared with McGrath et al. (2016), because that study used the AusFarm model, which does not include the LTW effect on progeny wool production (Thompson et al. 2011). Ewe fleece value and ewe mortality were inconsistent in their effect, and average close to zero. The small and inconsistent effect of dam mortality was not expected, particularly for the maternal flocks. This may be due to the predictions of dam mortality due to pregnancy toxaemia and dystocia being less responsive to ewe nutrition profile than suggested by anecdotal evidence (J. Trompf, pers. comm.). Improving the empirical relationships used in the modelling would require databases with mortality data and liveweight or condition score profile for maternal type ewes that have a range of feeding treatments during mid and late pregnancy.
The total value of scanning was not sensitive to the reproductive rate of the flock, provided that the flock’s weaning percentage was sufficient to remain self-replacing when ‘twice-empty ewes’ were sold. As reproductive rate increased, the reduction in the value of managing the reduced number of empty ewes was offset by the increase in value of managing the extra multiple-bearing ewes. This finding contrasts with previous studies (Bowman et al. 1989; Young et al. 2016), and occurs because this study included a broader cross section of benefits achieved from scanning for multiples, demonstrating that it is important to evaluate and implement all the management options that are enabled as a result of scanning.
The additional value of scanning for multiples above scanning for pregnancy status only, being A$4.00/ewe scanned or A$9.25/multiple-bearing ewe, approximates the cost of errors associated with misidentifying a multiple-bearing ewe as a single-bearing ewe. This is because misidentifying a multiple-bearing ewe as a single-bearing ewe is similar to not attempting to identify the multiple-bearing ewe. A 10-percentage point reduction in errors would increase profit by an average of A$0.40/ewe scanned. Therefore, if improving accuracy is as simple as scanners increasing time spent per animal, this value provides an upper limit on the cost justified for a reduction in throughput. The value indicates that although improving scanning accuracy will increase profitability, at current levels of accuracy scanning is still profitable.
Conclusions
This analysis showed a strong economic case for adopting pregnancy scanning of ewes, provided that the information generated was used to optimise management of nutrition, allocation of lambing paddocks, and culling and retention decisions. This is a strong message for advisors, consultants and farmers; however, previous farm surveys have shown farmers are divided about the business case for pregnancy scanning. This analysis demonstrates that the benefits of pregnancy scanning accrue from a range of decisions that are enabled by scanning and, therefore, decisions made with a narrow focus are likely to be incorrect. Previous analyses in the grey literature (unpublished reports, newsletters and industry presentations) that have concluded that pregnancy scanning was not profitable have ignored the benefits of differential management of nutrition, which was identified as an important contributor to the value of scanning for multiples. Correct calculation is dependent on inclusion of the biology elucidated in the LifetimeWool project that related lamb survival and progeny lifetime performance to maternal nutrition while in utero. Given the contribution of this biology to the value of scanning, it is necessary for this to be included in subsequent analyses of the business case for scanning, otherwise there will be a continuation of mixed messages delivered to the farming community.
Data availability
All data used in this paper are publicly available. The mode/code used for this paper can be licensed to others on request.
Conflicts of interest
Forbes Brien is an Associate Editor of Animal Production Science but was not involved in the peer review or any decision-making process for this paper. The authors have no further conflicts of interest to declare.
Declaration of funding
This study was supported by Meat and Livestock Australia and Australian Wool Innovation through the funding of project L.LSM.0021 ‘Increasing lambing percentages through better use of pregnancy scanning technology’.
Acknowledgements
We acknowledge the assistance of other members of the L.LSM.0021 project management team, namely Gordon Refshauge, Sue Hatcher, Kim Bunter, Hamish Dickson, Kiro Petrovski, Michelle Cousins, Anne Collins and Tara Graetz.
References
Abadi GKA, Pannell DJ (1991) Economic trade-off between pasture production and crop weed control. Agricultural Systems 36(1), 1-15.
| Crossref | Google Scholar |
Behrendt R, Van Burgel AJ, Bailey A, Barber P, Curnow M, Gordon DJ, Edwards JEH, Oldham CM, Thompson AN (2011) On-farm paddock-scale comparisons across southern Australia confirm that increasing the nutrition of Merino ewes improves their production and the lifetime performance of their progeny. Animal Production Science 51(9), 805-812.
| Crossref | Google Scholar |
Behrendt R, Hocking Edwards JE, Gordon D, Hyder M, Kelly M, Cameron F, Byron J, Raeside M, Kearney G, Thompson AN (2019) Offering maternal composite ewes higher levels of nutrition from mid-pregnancy to lambing results in predictable increases in birthweight, survival and weaning weight of their lambs. Animal Production Science 59(10), 1906-1922.
| Crossref | Google Scholar |
Bowman PJ, Fowler DG, Wysel DA, White DH (1989) Evaluation of a new technology when applied to sheep production systems: Part II–real-time ultrasonic-scanning of ewes in mid-pregnancy. Agricultural Systems 29(4), 287-323.
| Crossref | Google Scholar |
Brien FD, Refshauge G, Hatcher S, Bunter KL, Dickson H, Young J, Petrovski K, Collins A, Cousins M, Graetz, T (2023) Increasing lamb percentages through better use of pregnancy scanning technology. Final Report to Meat Livestock Australia for L.LSM.0021. Available at https://www.mla.com.au/contentassets/a1760e8d3cb04e48b2746214e4d49739/increasing-lambing-percentages-through-better-use-of-pregnancy-scanning-technology---l.lsm.0021---final-report.pdf [verified 7 February 2025]
Corner-Thomas RA, Kenyon PR, Morris ST, Ridler AL, Hickson RE, Greer AW, Logan CM, Blair HT (2015) Influence of demographic factors on the use of farm management tools by New Zealand farmers. New Zealand Journal of Agricultural Research 58(4), 412-422.
| Crossref | Google Scholar |
Elliott J, Sneddon J, Lee JA, Blache D (2011) Producers have a positive attitude toward improving lamb survival rates but may be influenced by enterprise factors and perceptions of control. Livestock Science 140(1–3), 103-110.
| Crossref | Google Scholar |
Fowler DG, Wilkins JF (1984) Diagnosis of pregnancy and number of foetuses in sheep by real-time ultrasonic imaging. I. Effects of number of foetuses, stage of gestation, operator and breed of ewe on accuracy of diagnosis. Livestock Production Science 11(4), 437-450.
| Crossref | Google Scholar |
Freer M, Moore AD, Donnelly JR (2012) The GRAZPLAN animal biology model for sheep and cattle and the GrazFeed decision support tool. CSIRO Plant Industry Technical Paper. Available at https://grazplan.csiro.au/wp-content/uploads/2007/08/TechPaperMay12.pdf [verified 7 February 2025]
Hatcher S, Dominik S, Richards JS, Young J, Smith J, Tearle R, Brien FD, Hermann N (2018) Ewe culling and retention strategies to increase reproductive rates in Merino sheep. Animal Production Science 58(8), 1545-1551.
| Crossref | Google Scholar |
Hebart ML, Brien FD, Jaensch KS, Smith DH, Walkom SF, Grimson RJ (2010) Genetics of reproductive efficiency: a study of Merino resource flocks in South Australia. In ‘Proceedings of the 9th world congress on genetics applied to livestock production’, held 1–6 August, 2010 Leipzig, Germany. (German Society of Animal Science) Communication 0685.
Holmes P, Sackett D (2008) Pregnancy scanning ewes. On Farm 113, 11-14.
| Google Scholar |
Howard K, Beattie L (2018) A national producer survey of sheep and cattle husbandry practices. Project E.AWW.1501 Final Report to MLA. Available at https://www.mla.com.au/contentassets/c6b8854d3bb6421aab1a94baf9496b9a/e.aww.1501_final_report_-_sheep.pdf [verified 7 February 2025]
Kleemann DO, Walker SK, Ponzoni RW, Gifford DR, Walkley JRW, Smith DH, Grimson RJ, Jaensch KS, Walkom SF, Brien FD (2016) Effect of previous reproductive performance on current reproductive rate in South Australian Merino ewes. Animal Production Science 56(4), 716-725.
| Crossref | Google Scholar |
Lee GJ, Atkins KD, Sladek MA (2009) Heterogeneity of lifetime reproductive performance, its components and associations with wool production and liveweight of Merino ewes. Animal Production Science 49(7), 624-629.
| Crossref | Google Scholar |
Lee GJ, Sladek MA, Hatcher S, Richards JS (2014) Using partial records to identify productive older ewes to retain in the breeding flock to increase the flock net reproduction rate. Animal Production Science 54(10), 1631-1634.
| Crossref | Google Scholar |
Lockwood A, Hancock S, Kearney G, Thompson A (2019) Reducing mob size increases the survival of twin-born Merino lambs when feed-on-offer from pasture is limited and ewes are supplementary fed during lambing. Small Ruminant Research 173, 65-69.
| Crossref | Google Scholar |
Lockwood A, Trompf J, Hancock S, Kubeil L, Thompson A, Young J (2020) Factors influencing the optimum mob size of ewes at lambing and the economic benefit of lambing ewes in smaller mobs to increase lamb survival across southern Australia. Agricultural Systems 184, 102916.
| Crossref | Google Scholar |
Lockwood A, Allington T, Blumer SE, Boshoff J, Clarke BE, Hancock SN, Kearney GA, Kenyon PR, Krog J, Kubeil LJ, Refshauge G, Trompf JP, Thompson AN (2023) Decreasing mob size at lambing increases the survival of triplet lambs born on farms across southern Australia. Animals 13(12), 1936.
| Crossref | Google Scholar | PubMed |
Masters DG, Blache D, Lockwood AL, Maloney SK, Norman HC, Refshauge G, Hancock SN (2023) Shelter and shade for grazing sheep: implications for animal welfare and production and for landscape health. Animal Production Science 63(7), 623-644.
| Crossref | Google Scholar |
McGrath S, Virgona J, Allworth B (2016) The cost of hitting lifetime ewe targets in scanned and unscanned Merino flocks – a simulation using a dynamic model, AusFarm. Available at https://researchoutput.csu.edu.au/en/publications/the-cost-of-hitting-lifetime-ewe-targets-in-scanned-and-unscanned [verified on 20 August 2021]
Mecardo (2022) Merino fleece micron premiums and discounts. 1 Nov 2022. Available at https://mecardo.com.au/merino-fleece-micron-premiums-discounts/ [verified on 7 February 2025]
Mecardo (2023) Percentiles – April 2023. 14 Apr 2023. Available at https://mecardo.com.au/percentiles-april-2023/ [verified on 7 February 2025]
Monjardino M, Revell D, Pannell DJ (2010) The potential contribution of forage shrubs to economic returns and environmental management in Australian dryland agricultural systems. Agricultural Systems 103(4), 187-197.
| Crossref | Google Scholar |
Oldham CM, Thompson AN, Ferguson MB, Gordon DJ, Kearney GA, Paganoni BL (2011) The birthweight and survival of Merino lambs can be predicted from the profile of liveweight change of their mothers during pregnancy. Animal Production Science 51(9), 776-783.
| Crossref | Google Scholar |
SSF (2022) Sheep sustainability framework: on-farm insights from the National Producer Survey – October 2022. Available at https://www.sheepsustainabilityframework.com.au/globalassets/sheep-sustainability/media/ssf-on-farm-insights-report-web-25oct2022.pdf [verified on 7 July 2023]
SSF (2024) Sheep sustainability framework. Annual Report 2024. Available at https://www.sheepsustainabilityframework.com.au/globalassets/sheep-sustainability/media/240731-ssf-2024-annual-report---web.pdf [verified on 24 January 2024]
Thompson AN, Ferguson MB, Gordon DJ, Kearney GA, Oldham CM, Paganoni BL (2011) Improving the nutrition of Merino ewes during pregnancy increases the fleece weight and reduces the fibre diameter of their progeny’s wool during their lifetime and these effects can be predicted from the ewe’s liveweight profile. Animal Production Science 51(9), 794-804.
| Crossref | Google Scholar |
Young JM, Thompson AN, Curnow M, Oldham CM (2011) Whole-farm profit and the optimum maternal liveweight profile of Merino ewe flocks lambing in winter and spring are influenced by the effects of ewe nutrition on the progeny’s survival and lifetime wool production. Animal Production Science 51(9), 821-833.
| Crossref | Google Scholar |
Young JM, Saul G, Behrendt R, Byrne F, McCaskill M, Kearney GA, Thompson AN (2014) The economic benefits of providing shelter to reduce the mortality of twin lambs in south-western Victoria. Animal Production Science 54(6), 773-782.
| Crossref | Google Scholar |
Young JM, Behrendt R, Curnow M, Oldham CM, Thompson AN (2016) Economic value of pregnancy scanning and optimum nutritional management of dry, single- and twin-bearing Merino ewes. Animal Production Science 56(4), 669-678.
| Crossref | Google Scholar |
Young M, Young J, Kingwell RS, Vercoe PE (2023) Improved whole-farm planning for mixed-enterprise Systems in Australia using a four-stage stochastic model with recourse. Australian Farm Business Management Journal 20, 37-54.
| Google Scholar |
Young M, Young J, Kingwell RS, Vercoe PE (2024) Identifying high-value tactical livestock decisions on a mixed enterprise farm in a variable environment. Animal Production Science 64, AN23407.
| Crossref | Google Scholar |
Young JM, Kenyon PR, Kubeil LJ, Thompson AN, Trompf J, Lockwood A (2025) The economic optimum mob size at lambing for triplet-bearing Maternal and Merino ewes across southern Australia. Animal Production Science 65(2), AN24334.
| Crossref | Google Scholar |