

Phenotypic and genotypic variation in Australian native Sorghum species along aridity clines
Harry Myrans A * , Jack R. McCausland A , Scott N. Johnson B and Roslyn M. Gleadow A
A
B
Abstract
Wild sorghum taxa (Sorghum Moench) cover much of the northern Australian landscape and harbour potentially useful traits for crop improvement. Specialised metabolites such as phenolics, silicon and cyanogenic glucosides (which are toxic to grazing animals) are present in Sorghum and have been associated with drought tolerance. However, these taxa remain poorly studied, especially regarding intraspecific variation.
To investigate the intraspecific diversity of wild sorghums growing along aridity clines, including morphology, biochemistry and genotype. We hypothesised that genotypic and phenotypic diversity would co-vary with niche diversity.
Multiple accessions of Sorghum plumosum, S. stipoideum and S. timorense were grown under common conditions for 10 weeks. Concentrations of cyanogenic glucosides, phenolics and silicon were measured alongside five morphological traits. Accessions were genotyped using single-nucleotide polymorphisms.
Several traits varied significantly within species, but no trait consistently co-varied with aridity across species. In S. timorense, there appeared to be genotypic differentiation among accessions, but this was not translated into phenotypic differences, which was likely to be due to similarities in climate.
Our results challenge assumptions that phenotypic and genotypic diversity correlate with niche diversity and support the hypothesis that mature Australian wild sorghums store most of their cyanogenic glucosides in their roots.
Wild sorghums harbour advantageous traits for crop improvement, such as niche diversity and low toxicity. Future wild sorghum research must acknowledge intraspecific diversity, and as many populations as possible should be conserved, because genetic diversity is not necessarily discernible from phenotype or provenance alone.
Keywords: Australia, crop wild relatives, cyanogenesis, cyanogenic glucosides, DArTseq, dhurrin, silicon, sorghum.
Introduction
Sorghum (Sorghum bicolor [L.] Moench) is one of the world’s top five grain crops. Its grain is eaten by approximately 500 million people, and it is also grown for animal feed, forage and biofuel. Therefore, there is a pressing need to increase sorghum’s tolerance to drought and heat, disease resistance, and improve its nutritional quality. Sorghum’s crop wild relatives, undomesticated species belonging to all subgenera of Sorghum Moench, are a potential source of such traits.
Traditional use of wild Sorghum taxa for food supply by Aboriginal peoples of Australia points to their long recognition of usefulness (Arndt 1961; Pascoe 2014). Australian Sorghum species have attracted interest from researchers and crop breeders as a tertiary gene pool for crop improvement (Ananda et al. 2020; Myrans et al. 2020). However, little is known about them. Lazarides et al. (1991) conducted a comprehensive ecological survey; however, since then, much of the research into wild sorghums has focused on single accessions within species (e.g. Cowan et al. 2020; Myrans et al. 2021; Cowan et al. 2022; Myrans and Gleadow 2022). This is largely due to the difficulty of obtaining seed from the remote areas in which they are found. Whereas the single-accession approach quickly screens traits across a broad range of Sorghum species, examination of intraspecific diversity and local adaptation is needed to give a more complete understanding of the true diversity in the genus and inform research and conservation decisions.
Of the 22 known wild Sorghum taxa, 17 are native to Australia, dominating the understorey across large parts of the north of the country. Their populations span diverse climatic regions, but most are adapted to hot, monsoonal areas with poor soil nutrition (Lazarides et al. 1991; Myrans et al. 2020). Water stress and fire frequently threaten many of these populations, likely serving as strong selection pressures for local adaptation (Andrew and Mott 1983; Bowman et al. 2010). Cowan et al. (2020) identified several wild sorghum taxa whose drought tolerance appeared to be greater than that of domesticated sorghum, emphasising the potential value in examining the traits conferring adaptation to aridity in the genus. Knowledge of these traits is also important for conservation efforts in parts of northern Australia affected by climate change and associated increases in aridity (Dai 2013).
One intriguing trait that might co-vary with aridity is cyanogenic glucoside (CNglc) production and regulation. CNglcs are nitrogen-containing secondary metabolites that can be catabolised to release toxic hydrogen cyanide (HCN) during herbivory. A plant’s CNglc concentration can be quantified by measuring HCN potential, the total amount of HCN produced by hydrolysing all CNglcs present in the tissue. HCN potentials above 600 μg g−1 can be considered dangerous to cattle (Boyd et al. 1938; Hunt and Taylor 1976), whereas other animals can be adversely affected by lower HCN potentials (Gleadow and Woodrow 2002; Kumari et al. 2021). Kooyers et al. (2014) reported that the frequency of Trifolium repens plants that are able to produce CNglcs is typically higher in warmer locations – a pattern that has emerged independently in different regions. However, such patterns have not yet been tested for in Sorghum.
Although CNglcs remain useful in defence against herbivory, the major roles of CNglcs in wild sorghums are unresolved. When mature, wild sorghums typically have very low HCN potential in their leaves (<10 μg g−1), and higher HCN potential in their roots (0–750 μg g−1) (Myrans and Gleadow 2022). The storage of CNglcs at such low concentrations, and away from the tissues most vulnerable to herbivore damage, makes wild sorghums attractive sources of genes for improving forage sorghums, which often have toxic leaf HCN potentials (Cowan et al. 2020). It also brings into question the effectiveness of CNglcs as a defence in wild sorghums. It has been hypothesised that CNglcs have multiple roles in plants, including in the storage of nitrogen (Møller 2010; Gleadow and Møller 2014; Bjarnholt et al. 2018). Screening the intraspecific diversity of HCN potential in wild sorghums will give further insight into the roles of CNglcs in wild sorghums and whether these differ with aridity.
Other biochemical traits that can co-vary with aridity are phenolics and silicon (Katz 2019; Carvalho et al. 2022). Phenolics are organic secondary metabolites containing at least one aromatic ring and hydroxyl group. They can be effective at mitigating stressors such as herbivores, pathogens, reactive oxygen species and extreme temperatures (Lattanzio et al. 2012). Plant silicon is mainly considered to augment physical defence through deposition in structures such as phytoliths and trichomes (Hartley et al. 2015), but may also play roles in more complex chemical-defence pathways (Islam et al. 2022; Thorne et al. 2023), and mitigate other stressors including drought and salinity (Liu et al. 2015; Coskun et al. 2019).
Morphological traits, such as biomass, relative growth rate, specific leaf area, number of tillers and root:shoot ratio, also commonly vary with aridity (Linhart 1974; Bull-Herenu and Arroyo 2009). Typically, relative growth rate, specific leaf area and tillering would be expected to be lower in plants adapted to more arid environments, whereas root:shoot ratio would be expected to be higher. Collectively, these traits confer a more conservative, resource-efficient growth strategy, which is often vital for increasing survival in low-resource arid environments (Coley et al. 1985). Accession genotypes were compared using large numbers of single-nucleotide polymorphisms (SNPs). We expect species with wider distributions and more niche diversity to contain the most intraspecific diversity, both phenotypically and genotypically.
Three Australian wild Sorghum species (Sorghum plumosum [R.Br.] P.Beauv., Sorghum stipoideum [Ewart & Jean White] C.A.Gardner & C.E.Hubb. and Sorghum timorense [Kunth] Büse) were chosen for this study. Sorghum plumosum is perennial, whereas S. stipoideum and S. timorense are annual. According to Lazarides et al. (1991), S. timorense is widely distributed but restricted to heavy-textured soils in alluvial floodplains and cracking clay plains, whereas S. plumosum and S. stipoideum can grow on a diverse range of soil types while also being widespread. The estimated extent of occurrence is much larger for S. plumosum (7 559 371 km2) than for S. timorense (4 475 649 km2) or S. stipoideum (3 111 011 km2) (Myrans et al. 2020). Sorghum plumosum’s perennial life history also means that, unlike the other two species, it is adapted to survive through the entire dry season.
The aim of this study was to quantify phenotypic and genotypic variation within S. plumosum, S. stipoideum and S. timorense, and determine which phenotypic traits might confer adaptation to aridity. To do this, we grew 18 accessions of the three study species in a common greenhouse environment, measured biochemical and morphological traits, and screened their genotypic similarity. The accessions were originally collected from provenances of varied aridity levels in northern Australia. This design was chosen because cline studies are a key step in identifying traits and genes associated with local adaptation without the confounding effects of differing growth environments (Bull-Herenu and Arroyo 2009; Carvalho et al. 2022). The following three hypotheses were tested: (1) within species, HCN potential would increase with aridity of accession provenances; (2) S. plumosum would contain the most phenotypic and genotypic variation among accessions; and (3) phenotypes would be more similar within species than among accessions of different species from similar environments.
Materials and methods
Plant material and growth conditions
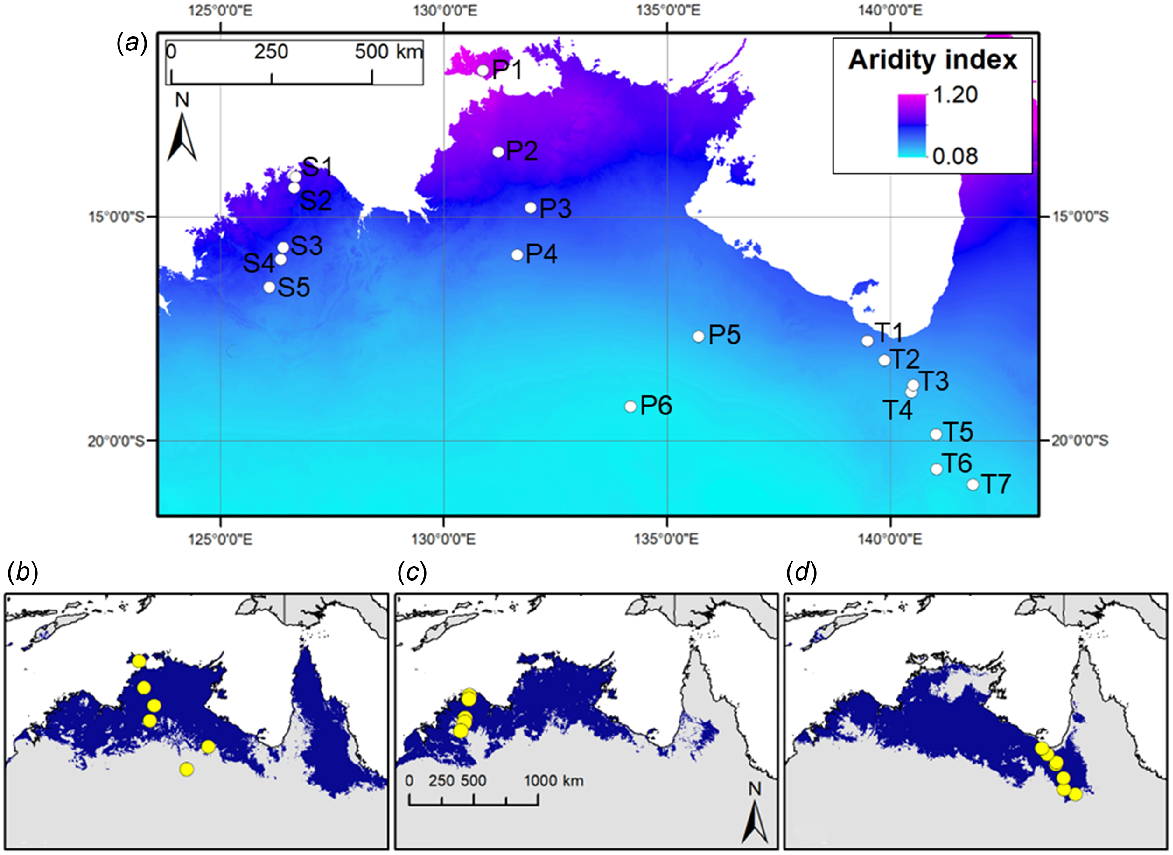
Six S. plumosum accessions, five S. stipoideum accessions and seven S. timorense accessions were germinated and grown for 10 weeks. Accessions were chosen on the basis of their collection sites occurring along aridity clines in northern Australia (Table 1). Within species, accessions were ordered numerically (P1–P6, S1–S5 and T1–T7) on the basis of increasing aridity of their collection sites (Fig. 1). The S. plumosum accessions ranged in aridity index from 0.109 to 0.920, the S. stipoideum accessions from 0.358 to 0.589, and the S. timorense accessions from 0.128 to 0.296.
| Species | Accession | Accession name | Latitude | Longitude | Temperature (°C) A | Annual rainfall (mm) A | Aridity index B | Soil type | |
|---|---|---|---|---|---|---|---|---|---|
| S. plumosum | P1 | JC2246 | −11.7278 | 130.8722 | 26.74 | 1689 | 0.920 | Sandy loam | |
| P2 | JC2114 | −13.5453 | 131.2220 | 26.99 | 1302 | 0.676 | Sandy loam | ||
| P3 | JC2053 | −14.7922 | 131.9427 | 27.31 | 936 | 0.454 | Clay loam | ||
| P4 | JC2010 | −15.8483 | 131.6403 | 27.29 | 857 | 0.315 | Sandy loam | ||
| P5 | JC2199 | −17.6768 | 135.7017 | 26.11 | 593 | 0.198 | Clay loam | ||
| P6 | JC2306 | −19.2485 | 134.1803 | 25.96 | 411 | 0.109 | N/A | ||
| S. stipoideum | S1 | JC2356 | −14.1025 | 126.7097 | 27.62 | 1125 | 0.589 | Sand | |
| S2 | JC2355 | −14.3545 | 126.6492 | 27.56 | 1215 | 0.567 | Gravel | ||
| S3 | JC2350 | −15.6808 | 126.4032 | 25.84 | 986 | 0.451 | Sandy loam | ||
| S4 | JC2349 | −15.9515 | 126.3493 | 25.64 | 937 | 0.420 | Sandy loam | ||
| S5 | JC2347 | −16.5725 | 126.0928 | 25.70 | 849 | 0.358 | Gravel | ||
| S. timorense | T1 | JC2164 | −17.7817 | 139.4787 | 26.82 | 865 | 0.296 | Clay | |
| T2 | JC2159 | −18.2123 | 139.8640 | 26.85 | 604 | 0.242 | Clay | ||
| T3 | JC2156 | −18.7697 | 140.5072 | 26.51 | 626 | 0.213 | Clay | ||
| T4 | JC2157 | −18.9243 | 140.4565 | 26.66 | 611 | 0.201 | Clay | ||
| T5 | JC2209 | −19.8732 | 141.0175 | 26.27 | 496 | 0.160 | Clay | ||
| T6 | JC2303 | −20.6457 | 141.0265 | 25.77 | 418 | 0.134 | Clay | ||
| T7 | JC2206 | −20.9922 | 141.8368 | 25.39 | 437 | 0.128 | Clay loam |
(a) Mean annual aridity index (Williams et al. 2010) map of northern Australia, with collection sites of the 18 study accessions pinpointed with white circles. Accessions are labelled according to Table 1. High aridity indices (magenta) indicate less arid areas, whereas low aridity indices (cyan) indicate more arid areas. (b–d) Collection sites of the study accessions (yellow circles) are superimposed on the respective modelled distributions (blue) of (b) S. plumosum, (c) S. stipoideum and (d) S. timorense (Myrans et al. 2020).
Seeds were provided by the Australian Grains Genebank (Horsham, Vic., Australia) and were collected by the Australian Tropical Crops Genetic Resource Centre. All plants (n = 251) were grown under controlled greenhouse conditions at Monash University (−37.91, 145.14) between September and December 2020, with a mean temperature of 31.35 ± 0.09°C/21.46 ± 0.03°C, day/night, and a mean photoperiod of 13.7 h. Supplementary light was provided using sodium lamps for 13 h per day (MK-1 Just-a-shade, Ablite, NSW, Australia).
Seeds were germinated in a constant-temperature cabinet, following Cowan et al. (2020). Once the coleoptile and radicle had emerged, plants were transferred to the greenhouse and planted in seedling trays containing Debco seed-raising substrate (Evergreen Garden Care, NSW, Australia) and perlite (1:1, v/v ratio) for 1.5 weeks. Seedlings were then transplanted into 1.9 L pots containing Debco seed-raising substrate, perlite and coarse sand (2:2:1, v/v ratio). Plants were grown for a further 8 weeks and watered three times per week, namely twice with 250 mL water, once with 250 mL Thrive all-purpose soluble fertiliser (Yates, Vic., Australia) with an N:P:K ratio of 25:5:8.8 (v/v ratio). Pot positions were randomised and rotated weekly to minimise microenvironment effects. At 10 weeks post-germination, plants were harvested and separated into roots, sheaths and leaves and dried in ovens at 50°C for 72 h.
So as to confirm that stress was not a factor in any phenotypic differences, Fv/Fm, a useful indicator of plant stress, was measured on the youngest fully unfurled leaf using a MINI-PAM Photosynthesis Yield Analyser (Heinz Walz GmbH, Effeltrich, Germany) 7 weeks post-germination (n = 6). Mean Fv/Fm values were similar across all accessions, ranging between 0.78 and 0.82, indicating that all accessions were healthy and approaching the optimal Fv/Fm of 0.83 (Maxwell and Johnson 2000) (Supplementary Table S1).
Morphological parameters
Plant morphology was quantified by counting tillers, measuring total leaf area, and determining the biomass of leaves, sheaths and roots of each plant. Total leaf area was measured using a LI-3000 portable area meter and a LI-3050A belt conveyor (LI-COR Biosciences, NE, USA). Senesced leaves were included in total biomass measurements, but not in leaf-area measurements or chemical analysis. Specific leaf area (SLA; cm2 g−1) and root:shoot ratio were calculated using the following equations:
Relative growth rate (RGR; g g−1 day−1) was calculated using the equation:
where W is whole-plant biomass, and t is time. W1 was measured at the start of the experiment (t1), at the seed stage, with the mean W1 for the accession used in every RGR calculation for that accession. W2 was obtained by measuring the biomass of the entire plant at the end of the treatment period (t2).
Chemical analysis
HCN potential was measured through colorimetric assay in 96-well microtiter plates, by using the evolved cyanide method, following Gleadow et al. (2012). Briefly, 10 mg of dried, ground tissue was mixed with 300 μL of β-glucosidase solution to catabolise all its CNglcs and release HCN. The HCN reacted with 200 μL of 1 M sodium hydroxide solution to form sodium cyanide, the concentration of which was then measured through mixing 50 μL with 125 μL of 2 M acetic acid, 125 μL of succinimide reagent and 50 μL of barbituric acid dissolved in pyridine before incubating at room temperature for 15 min. Absorbance was then measured at 590 nm (FLUOstar Galaxy, BMG Labtechnologies, Vic., Australia).
Phenolic concentration was also measured through colorimetric assay in 96-well microtiter plates, by using a Folin–Ciocalteu method adapted from Ainsworth and Gillespie (2007) and Bärlocher and Graça (2020). Phenolics were extracted from 10 mg of dried, ground tissue into 1 mL of 70% acetone solution. 20 μL of sample was then mixed with 20 μL distilled water, 20 μL dilute Folin–Ciocalteu reagent and 200 μL of 2% sodium carbonate in 0.1 M sodium hydroxide solution, before being incubated at room temperature for 2 h. Absorbance was then measured at 760 nm (FLUOstar Galaxy, BMG Labtechnologies, Vic., Australia). Gallic acid (91215, Sigma-Aldrich, MO, USA) was used as the standard.
Silicon concentration ([Si]) was measured in leaf, sheath and root tissue by using 80 mg dried, ground tissue through X-ray fluorescence spectrometry (Epsilon-3x, PANalytical, Netherlands), following Reidinger et al. (2012) and Hiltpold et al. (2016), at the Hawkesbury Institute for the Environment, Western Sydney University (NSW, Australia). Silicon was calibrated against a certified plant reference material of known silicon concentration (NCS ZC73018 Citrus leaves, China National Institute for Iron and Steel). Plant silicon concentration (plant [Si], %) was calculated using the following equation:
Statistical analysis
Within species, variation in phenotypic traits among accessions was analysed using one-way ANOVAs. Where significant variation was found, post hoc comparisons were made using Tukey’s tests. Covariance of traits with aridity was analysed using linear regression, by using aridity index as the explanatory variable and the mean trait value for each accession as the response variable. Slope and R2 were calculated to give the direction and strength of relationships. Linear regression results are presented in Table S2. For all analyses, P < 0.05 signified statistical significance. Where raw data were not normally distributed, data were log-transformed to reduce skewness. ANOVA and linear regression analyses were performed using GraphPad Prism ver. 9.0.2 (GraphPad Software, San Diego, CA, USA).
Similarity between suites of phenotypic traits among accessions was analysed using principal-component analysis followed by K-means cluster analysis in R ver. 4.0.0 (R Core Team 2020), using accession means for specific leaf area, herbivory tolerance traits, and the most biologically relevant chemical defence metrics collected (plant silicon concentration, root HCN potential and leaf phenolic concentration). Mean trait values were transformed to z-scores (mean = 0, s.d. = 1) and the silhouette method was used to determine the optimal number of clusters (six) on the basis of having the highest average silhouette width (Kaufman and Rousseeuw 2009).
Genetic analysis
Genotypes were compared using SNPs obtained through DArTseq™ (Jaccoud et al. 2001; Kilian et al. 2012). Leaf samples were collected from five plants of each study accession and freeze dried. Samples were sent to Diversity Arrays Technology Pty Ltd (Bruce, ACT, Australia) for DNA extraction and genotyping. The raw data comprised 169 228 codominant, genome-wide, biallelic SNPs. Data filtering was performed using the R package ‘DARTR’ (ver. 2.9.7) (Gruber et al. 2018), following a method adapted from Gruber et al. (2019). First, we removed loci with less than 99% reproducibility. Then we removed monomorphic loci and loci with call rates below 95%. Last, we removed all but one SNP locus from each sequenced fragment. Our final dataset, which was used for analysis, contained 10 159 SNP loci with 1.64% missing data. We analysed population structure by running a principal-coordinate analysis (PCoA) in DARTR, as well as estimating pairwise FST (Weir and Cockerham 1984) in the R package ‘HIERFSTAT’ (Goudet 2005).
Results
Biochemical variation among accessions
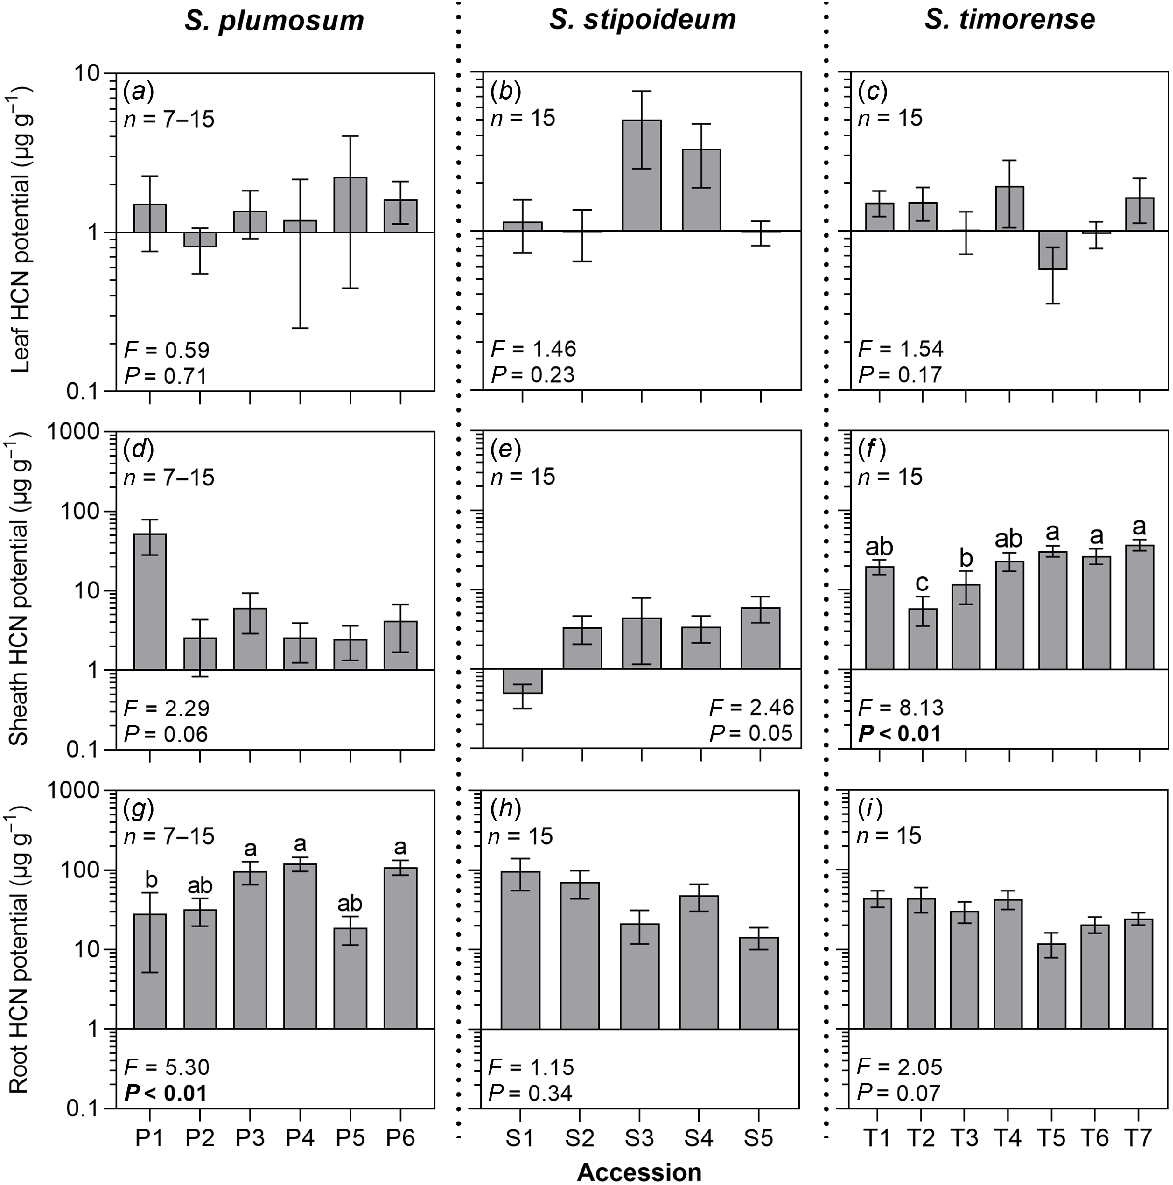
In all study accessions, excepting P1, T5, T6 and T7, mean HCN potential was higher in the roots than in the leaves or sheaths. Within accessions, mean HCN potential often varied among different organs across several orders of magnitude. For example, in S. plumosum accession P4, mean leaf, sheath and root HCN potentials were 1.20 μg g−1, 2.59 μg g−1 and 119.91 μg g−1 respectively. Mean leaf HCN potential ranged from 0.57 μg g−1 in T5 to 5.03 μg g−1 in S3; mean sheath HCN potential ranged from 0.48 μg g−1 in S1 to 53.23 μg g−1 in P1; and mean root HCN potential ranged from 11.96 μg g−1 in T5 to 119.91 μg g−1 in P4 (Fig. 2). Root HCN potential significantly varied among S. plumosum accessions, but there was no significant co-variation between this trait and aridity. There was no significant variation in root HCN potential among accessions of S. stipoideum or S. timorense (Table S2).
HCN potential (HCNp) in the (a–c) leaves, (d–f) sheaths, and (g–i) roots in six S. plumosum accessions, five S. stipoideum accessions and seven S. timorense accessions. Plants were grown for 10 weeks in standardised greenhouse conditions. Data were analysed by one-way ANOVA using log-transformed data. F- and P-values are presented, with significant P-values in bold. Columns with different letters are significantly (P < 0.05) different. Values are means ± s.e.
Leaves had higher concentrations of phenolics than did the sheaths or roots in all study accessions, ranging from 13.72 mg g−1 in S1 to 32.38 mg g−1 in P1 (Table S3). Leaf phenolic concentration significantly varied among accessions in all three study species (Fig. 3). However, the relationship between aridity and phenolic concentration was inconsistent across organs and species, with significant positive correlations found in the roots of S. plumosum and leaves of S. stipoideum, and a significant negative correlation found in the sheaths of S. timorense (Table S2).
(a–c) Leaf phenolic concentrations and (d–f) plant silicon concentrations in 18 accessions of three wild Sorghum species grown for 10 weeks in a common garden. Accessions are labelled according to Table 1. Data were analysed by one-way ANOVA. F- and P-values are presented, with significant P-values in bold. Columns with different letters are significantly (P < 0.05) different. Values are means ± s.e.
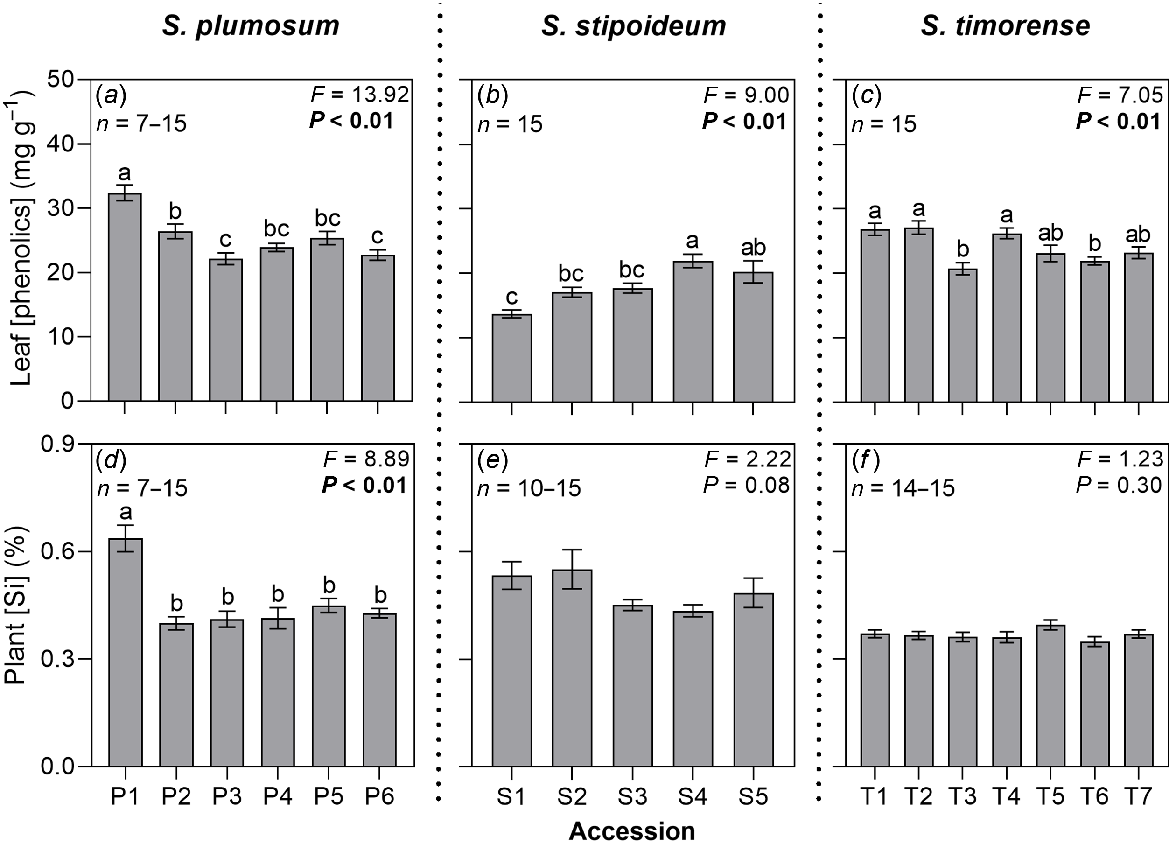
Mean plant silicon concentration ranged from 0.35% in T6 to 0.64% in P1 (Fig. 3, Table S4). Plant silicon concentration significantly varied among S. plumosum accessions. Low-aridity accession P1 had the highest concentration, but there was no significant variation among the remaining accessions or significant linear correlation with aridity. In S. stipoideum, plant silicon concentration significantly decreased as aridity increased (Table S2). There was no significant difference in plant silicon concentration among accessions of S. timorense.
Morphological variation among accessions
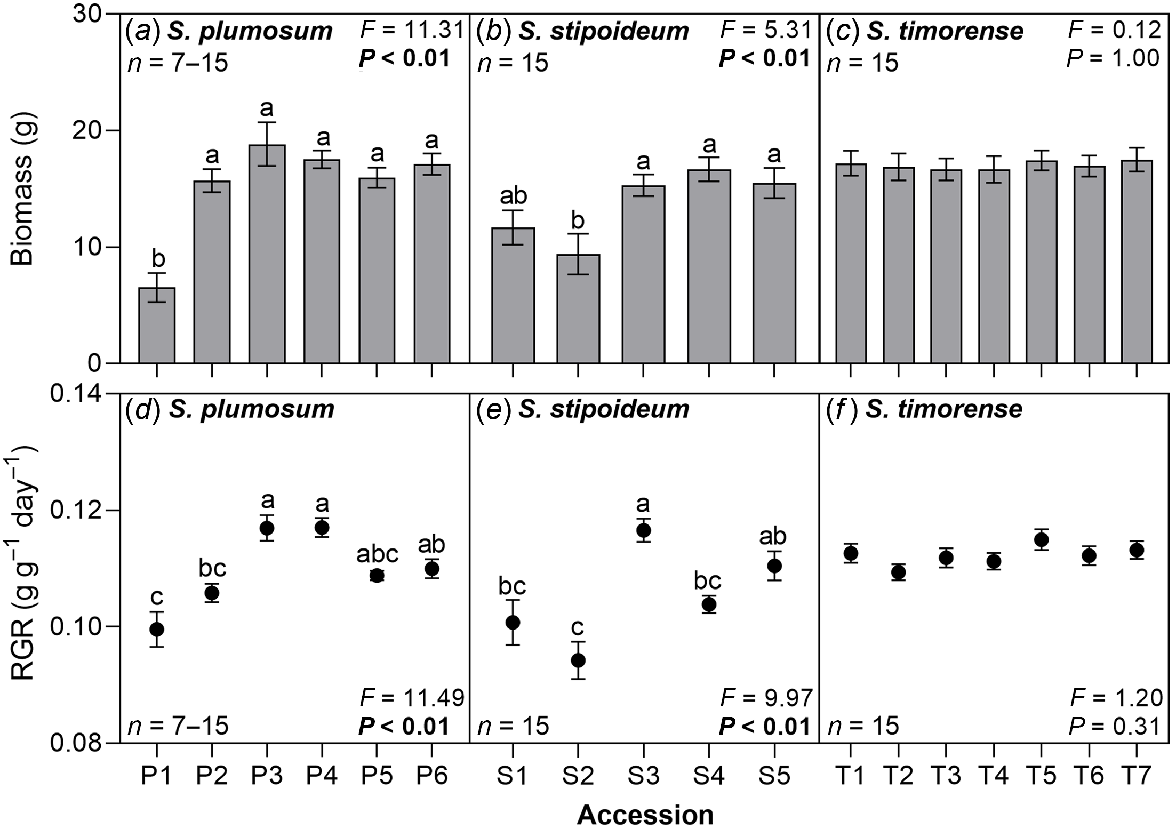
Mean biomass ranged from 6.5 g in P1 to 18.8 g in P3. Mean relative growth rate ranged from 0.094 g g−1 day−1 in S2 to 0.117 g g−1 day−1 in P4. Both biomass and relative growth rate significantly varied among accessions in S. plumosum and S. stipoideum, but neither significantly co-varied with aridity. No significant variation in either trait was found in S. timorense (Fig. 4).
(a–c) Whole plant biomass and (d–f) relative growth rate (RGR) in 18 accessions of three wild Sorghum species grown for 10 weeks in a common garden. Accessions are labelled according to Table 1. Data were analysed by one-way ANOVA. F- and P-values are presented, with significant P-values in bold. Columns or points with different letters are significantly (P < 0.05) different. Values are means ± s.e.
Mean specific leaf area ranged from 83.5 cm2 g−1 P4 to 197.4 cm2 g−1 in T7. Specific leaf area significantly varied among S. plumosum accessions, but there was no significant co-variation with aridity. There was no significant variation in specific leaf area among accessions of S. stipoideum or S. timorense. Mean number of tillers was generally high, ranging from 23.6 in P3 to 95.4 in S1. Significant variation in number of tillers was found among accessions in all three study species. However, this trait did not significantly co-vary with aridity in S. plumosum or S. stipoideum. In S. timorense, significant positive correlation was found (Table S2). Mean root:shoot ratio ranged from 0.11 in T7 to 0.32 in P6. Significant variation in root:shoot ratio was found among accessions in S. plumosum and S. timorense, but not S. stipoideum. In S. plumosum, root:shoot ratio had a significant positive correlation with aridity, whereas in S. timorense a significant negative correlation was found (Table 2, Table S2).
| Species | Accession | SLA (cm2 g−1) | Number of tillers | Root:shoot ratio | |
|---|---|---|---|---|---|
| S. plumosum | P1 | 150.0 ± 17.2a | 52.1 ± 7.7ab | 0.14 ± 0.02c | |
| P2 | 112.5 ± 12.4ab | 56.8 ± 6.6a | 0.24 ± 0.01ab | ||
| P3 | 125.2 ± 8.0ab | 23.6 ± 1.7c | 0.19 ± 0.02bc | ||
| P4 | 83.5 ± 8.3b | 33.5 ± 3.5bc | 0.27 ± 0.01ab | ||
| P5 | 146.2 ± 11.6a | 35.3 ± 1.6bc | 0.31 ± 0.03ab | ||
| P6 | 103.9 ± 8.6ab | 32.3 ± 2.2c | 0.32 ± 0.03a | ||
| F | 4.85 | 8.22 | 8.13 | ||
| P | <0.01 | <0.01 | <0.01 | ||
| S. stipoideum | S1 | 180.4 ± 16.1 | 95.4 ± 16.9a | 0.18 ± 0.02 | |
| S2 | 134.2 ± 11.9 | 56.1 ± 11.6ab | 0.13 ± 0.01 | ||
| S3 | 164.3 ± 16.1 | 53.8 ± 7.7ab | 0.14 ± 0.01 | ||
| S4 | 146.1 ± 12.3 | 39.7 ± 5.3b | 0.18 ± 0.02 | ||
| S5 | 188.0 ± 28.5 | 58.2 ± 8.8ab | 0.15 ± 0.02 | ||
| F | 1.84 | 3.67 | 2.10 | ||
| P | 0.12 | 0.01 | 0.09 | ||
| S. timorense | T1 | 174.9 ± 11.4 | 28.0 ± 2.9d | 0.19 ± 0.01a | |
| T2 | 175.8 ± 16.6 | 32.5 ± 5.3cd | 0.21 ± 0.02a | ||
| T3 | 174.8 ± 22.4 | 44.7 ± 3.6bcd | 0.21 ± 0.02a | ||
| T4 | 178.9 ± 20.5 | 32.1 ± 4.4cd | 0.18 ± 0.02a | ||
| T5 | 187.0 ± 22.9 | 53.5 ± 6.2ab | 0.14 ± 0.01ab | ||
| T6 | 170.6 ± 15.2 | 48.0 ± 4.6abc | 0.17 ± 0.02ab | ||
| T7 | 197.4 ± 14.8 | 67.1 ± 3.7a | 0.11 ± 0.01b | ||
| F | 0.26 | 9.58 | 7.36* | ||
| P | 0.95 | <0.01 | <0.01 |
Accessions are labelled according to Table 1. Values are means ± s.e.
For all accessions, n = 10–15, except for P1 (n = 9), P2 (n = 11–12), P3 (n = 11–13) and P5 (n = 7). Asterisks after F-values depict ANOVAs for which data were log-transformed.
Values within a column and within a species followed by the same letter are not signficantly different at P = 0.05.
Variation in suites of phenotypic traits among accessions
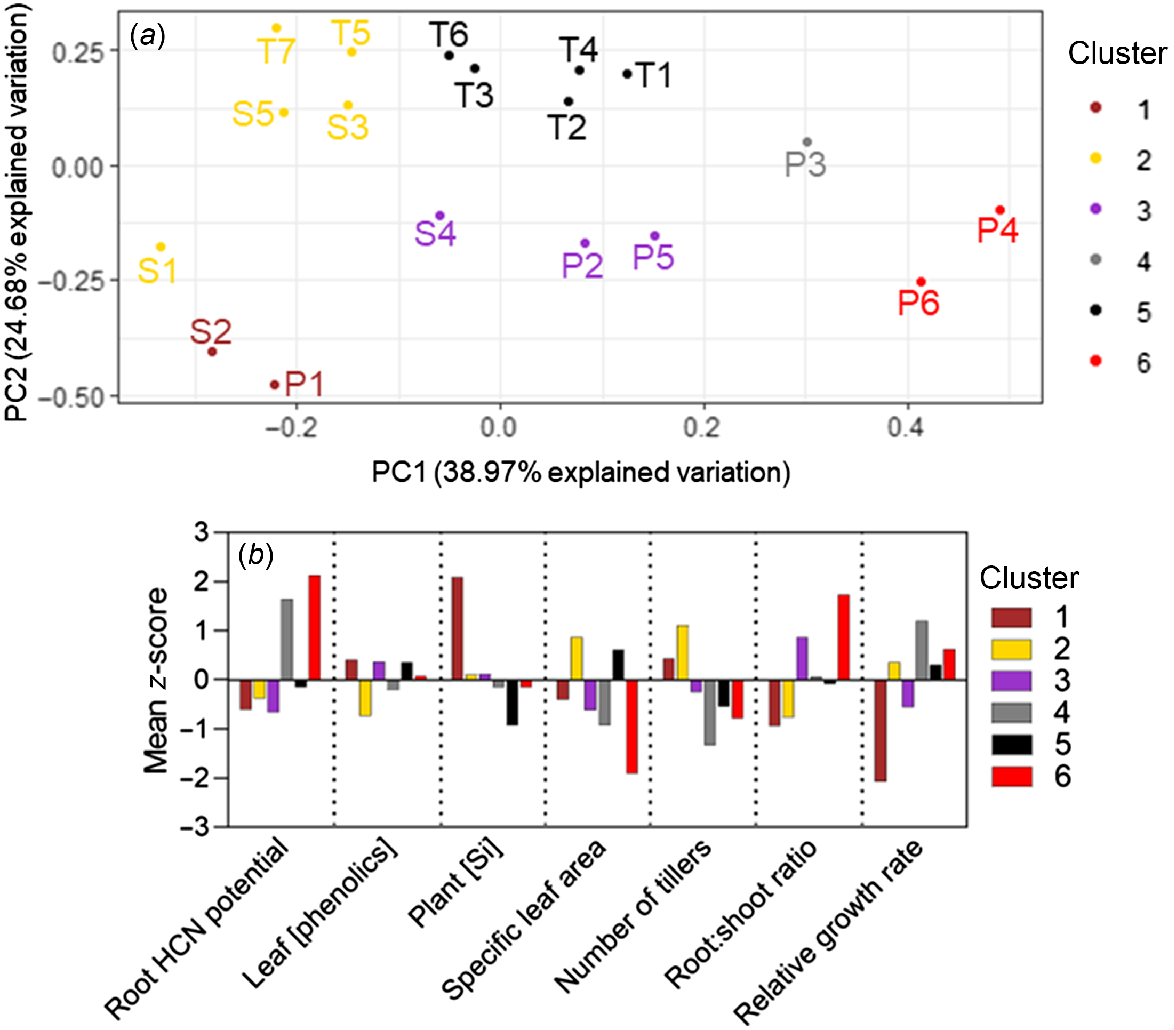
The K-means cluster analysis separated the 18 study accessions into six clusters according to phenotype. No species had all its accessions grouped into a single cluster, and three clusters contained accessions of multiple species (Fig. 5). Clusters 2 and 5 collectively contained every S. timorense accession and were both characterised by not varying greatly from the mean for any parameter, compared with other clusters. Cluster 6 contained the high-aridity S. plumosum accessions P4 and P6 and was characterised by high root HCN potentials and root:shoot ratios, and low specific leaf areas and numbers of tillers. Low-aridity accessions P1 and S2 formed Cluster 1, characterised by high silicon and low relative growth rates. Cluster 4 contained only accession P3, characterised by a high root HCN potential, and a low number of tillers and specific leaf area. Cluster 3 contained the remainder of the S. plumosum and S. stipoideum accessions. Like in Clusters 2 and 5, the mean z-scores in Cluster 3 did not vary greatly from the overall mean for any parameter (Fig. 5).
K-means cluster analysis of seven phenotypic traits from 18 accessions of three wild Sorghum species grown for 10 weeks in a common garden. (a) Cluster analysis results plotted on the first two principal-component (PC) axes and coloured according to cluster. Accessions are labelled according to Table 1. (b) Bar graph showing clusters’ mean z-scores for each trait.
Genotypic variation among accessions
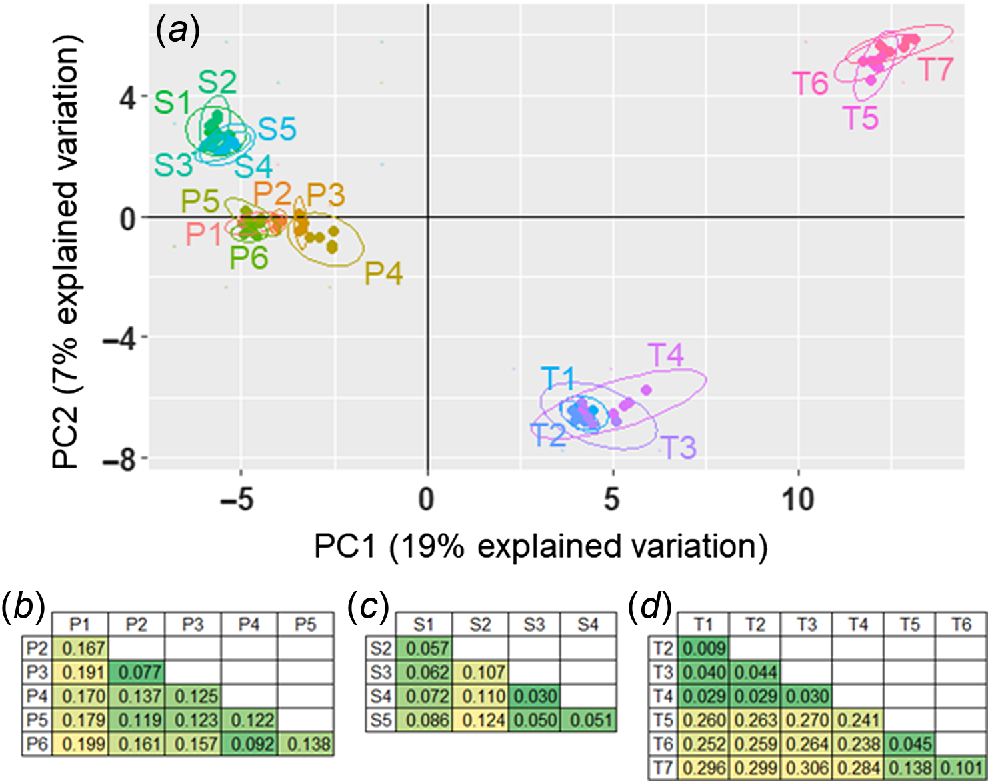
The genotype PCoA separated the 18 accessions into four major clusters across the first two principal components; all S. stipoideum accessions formed one cluster; all S. plumosum accessions formed one cluster; accessions T1–4 formed a cluster; and accessions T5–7 formed the final cluster (Fig. 6a). Across the third and fourth principal components, the S. timorense accessions split into the same clusters, but S1 and S2 formed a separate cluster from the other S. stipoideum accessions, and P1 separated from the S. plumosum cluster (Supplementary Fig. S1). The pairwise FST comparisons showed similar patterns. Every S. plumosum accession’s highest FST comparison arose when compared with P1 (Fig. 6b). Similarly, all S. stipoideum accessions other than S1 gave their highest FST value when compared with S2 (Fig. 6c). In S. timorense, there were low FST values when comparing any two accessions within the T1–4 and T5–7 clusters, and high FST values when comparing any two accessions from different clusters (Fig. 6d).
(a) Principal-coordinates analysis of single nucleotide polymorphisms from 18 accessions of three wild Sorghum species, plotted on the first two principal-component (PC) axes. Accessions are colour coded and encompassed by ellipses. (b–d) Pairwise FST comparisons among study accessions within (b) S. plumosum, (c) S. stipoideum and (d) S. timorense. Numbers are in colour-coded cells, with greener and yellower shades signalling lower and higher FST values respectively. Accessions are labelled according to Table 1.
Discussion
Morphological variation
Several morphological traits varied intraspecifically, but it was difficult to identify consistent trends between these traits and aridity. In general, plants had large numbers of tillers (ranging from 23.6 to 95.4), consistent with the finding of Lazarides et al. (1965) where unburnt S. plumosum populations had up to 60 tillers per plant in the wild. Number of tillers significantly increased with aridity in S. timorense, but not in the other two species. Root:shoot ratio decreased as aridity increased in S. timorense, but in S. plumosum it increased with aridity.
Although morphological variation has been found among accessions from different provenances in other grass species (Guo et al. 2017), this variation can become more visible when accessions are grown in a range of environmental conditions. For example, Quiroga et al. (2013) grew two accessions of Trichloris crinita in drought and well-watered conditions, finding that morphology did not significantly differ between accessions when grown under well-watered conditions, but did differ when grown under drought conditions. The next steps in quantifying local adaptations in wild sorghums should therefore include assessments of plasticity, such as surveys of wild plants, reciprocal transplant experiments, and growth of accessions in multiple conditions.
Cyanogenic glucoside storage consistent with role in nitrogen metabolism
In 14 of the 18 study accessions, mean HCN potential was higher in roots than in aboveground organs, mirroring patterns found in other wild sorghum species (Cowan et al. 2020; Myrans et al. 2021). CNglcs being stored away from the organs most vulnerable to herbivore attack, and at low concentrations, suggests that defence might not be the primary function of CNglcs in these species, at least when mature. The consistency of low aboveground HCN potentials in Australian wild sorghums, regardless of treatment or provenance (Cowan et al. 2020; Myrans et al. 2021), highlights their potential utility in development of safer forage sorghum suited to a range of environments.
It has been proposed that CNglcs could serve as a store of reduced nitrogen on top of their defensive role (Møller 2010), and storage of CNglcs in the roots would reduce nitrogen loss in the event of herbivory or fire. The nitrogen stored in these CNglcs could then be remobilised for use in compensatory growth following biomass losses (Selmar et al. 1988; Zagrobelny et al. 2008). It is also possible that root CNglcs could defend these plants against root herbivores such as nematodes (Curto et al. 2012; Moore and Johnson 2017). However, it is unclear whether their HCN potentials are high enough to hinder root herbivores, especially given that many non-ephemeral herbivores in Australia’s arid zones are highly specialised and can tolerate the chemical defences of their prey plants (Smith and Morton 1990).
While root HCN potential significantly varied among S. plumosum accessions, there was again no clear relationship between this trait and aridity. There was no significant variation in root HCN potential among accessions of S. stipoideum or S. timorense. These results contrast those of Kooyers et al. (2014), who found that the likelihood of CNglc production in T. repens grown in standardised conditions was significantly higher in accessions from more arid provenances. In T. repens, CNglc production is a binary trait controlled by one gene, whereas in wild sorghums it is a complex trait controlled by many genes and the environment. HCN potential is therefore a more plastic trait in wild sorghums, making relationships between HCN potential and environmental conditions harder to characterise.
More targeted research into CNglc functions in wild sorghums is needed before we can outline the selection pressures that are likely to be acting on HCN potential (Gleadow et al. 2021). One possibility is to measure HCN potential in plants grown under a range of temperatures or watering regimes so as to quantify the interactive effects of genotype and the environment and assess the plasticity of accessions grown within and outside their optimal environmental conditions.
Concentrations of phenolics and silicon
It was unexpected that the relationship between phenolic concentrations and aridity would vary among species. In the roots of S. plumosum and leaves of S. stipoideum, phenolic concentrations increased with aridity, whereas in the sheaths of S. timorense, phenolic concentration decreased as aridity increased, with no significant relationships detected in other organs. In contrast, Carvalho et al. (2022) found that arid-adapted Arctotheca calendula populations had consistently higher leaf phenolic concentrations, and proposed that this could mitigate heat and drought stress. Our result further highlighted the difficulty of predicting plant defence traits on the basis of environmental parameters alone. Like CNglcs, phenolics are thought to play multiple roles in plant metabolism, including defence against herbivores and stress mitigation (Lattanzio et al. 2012). These multiple roles can confound relationships with the environment, making trends difficult to identify.
Plant silicon concentration significantly varied among accessions in S. plumosum, with its low-aridity accession, P1, having the highest concentration. In S. stipoideum, plant silicon concentration significantly decreased with an increasing aridity. High silicon concentrations might be especially beneficial as a defence in tropical, rainy environments, where there are typically higher concentrations of insect herbivores (Ryalls et al. 2018). Plant silicon concentrations in this study were comparable to those found previously in both domesticated and wild Sorghum taxa (Simpson et al. 2017; Myrans et al. 2021).
Aridity, phenotype and genotype did not consistently covary
Of the 10 phenotypic traits we tested, S. plumosum showed significant intraspecific variation in eight, S. stipoideum in four, and S. timorense in four, supporting our expectation that S. plumosum would display the most phenotypic variation of the study species. This result could have stemmed from S. plumosum covering a broader distribution than the other study species (Myrans et al. 2020). Despite this, significant linear relationships between traits and aridity were not common in S. plumosum, and were no more common than in the other two study species, implying that other abiotic and biotic factors might be more important than aridity for S. plumosum’s high phenotypic diversity. Further research into the study accessions would also allow us to better estimate the aridity of provenances during their growing seasons, rather than using an annual average.
No species had all its accessions grouped into a single cluster in the K-means cluster analysis, and the three largest clusters all contained accessions of multiple species. This suggests that not all accessions within species had the same suites of phenotypic traits and could indicate some intraspecific local adaptation. Moreover, there were occasionally more similarities between accessions from different species than within a species. Evidence of phenotypic similarity not necessarily reflecting genetic relatedness has also been found in Asclepias L., implying the occurrence of convergent evolution (Agrawal and Fishbein 2006).
Sorghum timorense was the only study species to be split over two clusters across the first two principal components of the genotype PCoA, and it had the greatest differences in FST values among accessions. These results suggest that there is greater genotypic variation among study accessions in S. timorense than among those of the other two species, and implies the existence of a partial reproductive barrier between accessions T1–4 and T5–7. The finding was surprising considering that S. timorense is considered the most habitat-specific of the study species (Lazarides et al. 1991), and that T6 was separated from T5 and T7 in the phenotype cluster analysis despite their similar genotypes.
The cause of the restricted gene flow between accessions T1–4 and T5–7 is not yet known, with no obvious geographical barriers between the groups, and no immediately evident differences in soil type (Table 1), geology or hydrology (Boone et al. 2022). More extensive genotyping across the species’ range may help us better understand its genetic differentiation. The relative phenotypic similarity of T6 to T1–4 could have resulted from the habitat and soil similarity across S. timorense’s range, preventing phenotypic differentiation from being necessary.
The disequilibrium between genotypic and niche diversity in our study accessions challenges broader assumptions often used in conservation, such as that made by Myrans et al. (2020), that broader geographic distributions confer greater phenotypic and genotypic diversity in wild species. One potential explanation is that restricted gene flow is crucial for the creation of local adaptation (Kawecki and Ebert 2004), meaning that the largely contiguous distributions of S. plumosum and S. stipoideum might allow sufficient gene flow to prevent sizeable local adaptation, as evidenced by their relative genetic similarity among accessions. Going forward, investigation into phenotypic and genotypic differentiation of S. plumosum and S. timorense populations in Indonesian islands, compared with those in mainland Australia, could provide further information on the role of gene flow restriction in differentiation in wild sorghums.
Conclusions
With respect to our hypotheses, we found that (1) there was variation in root HCN potential within S. plumosum, but no clear trend between this trait and aridity; (2) S. plumosum contained the most phenotypic variation, but S. timorense contained the most genotypic variation; and (3) there was evidence of accessions of different species from similar environments being more phenotypically similar than accessions of the same species. Although two of our hypotheses were partially supported by our results, none was fully supported, demonstrating the complexity of the relationships among phenotype, genotype and the environment. There was evidence of local adaptation, with phenotypic traits varying interspecifically, although aridity did not appear to be the strongest selection pressure on this variation. In the case of S. timorense, there appeared to be genotypic differentiation as a result of underlying geology, but this was not translated into phenotypic differences, possibly as a result of similar soils and climatic conditions at all collection sites.
Our findings represent important progress in determining the roles of, and selection pressures acting on, cyanogenic glucoside production in wild sorghums. They also demonstrated the need to consider intraspecific diversity in all future wild sorghum research, because it adds a fundamental, but often overlooked, complexity to species’ adaptation to the environment. Finally, our results highlighted the importance of conserving maximal genetic diversity of wild species, some of which might not be immediately obvious on the basis of phenotype or provenance alone.
Data availability
The data that support this study will be shared upon reasonable request to the corresponding author.
Declaration of funding
This research was funded by the Australian Research Council Discovery Project DP210103010 to Roslyn M. Gleadow, Birger L. Møller and Robert J. Henry. Harry Myrans was supported by a Monash University Research Training Stipend and a Tim Healey Memorial Scholarship from the AW Howard Memorial Trust.
Acknowledgements
The authors thank Sally Norton of the Australian Grains Genebank for providing the seeds used in this study, Cecilia Blomstedt, Rhiannon Rowe and Georgia Douglas Minniti for technical assistance, and Robert Henry for useful discussions. This research was funded by the Australian Research Council Discovery Project DP210103010.
References
Agrawal AA, Fishbein M (2006) Plant defense syndromes. Ecology 87, S132-S149.
| Crossref | Google Scholar |
Ainsworth EA, Gillespie KM (2007) Estimation of total phenolic content and other oxidation substrates in plant tissues using Folin–Ciocalteu reagent. Nature Protocols 2, 875-877.
| Crossref | Google Scholar |
Ananda GKS, Myrans H, Norton SL, Gleadow R, Furtado A, Henry RJ (2020) Wild sorghum as a promising resource for crop improvement. Frontiers in Plant Science 11, 1108.
| Crossref | Google Scholar |
Andrew MH, Mott JJ (1983) Annuals with transient seed banks: the population biology of indigenous Sorghum species of tropical north-west Australia. Australian Journal of Ecology 8, 265-276.
| Crossref | Google Scholar |
Arndt W (1961) Indigenous Sorghum as food and in myth: the Tagoman Tribe. Oceania 32, 109-112.
| Crossref | Google Scholar |
Bjarnholt N, Neilson EHJ, Crocoll C, Jørgensen K, Motawia MS, Olsen CE, Dixon DP, Edwards R, Møller BL (2018) Glutathione transferases catalyze recycling of auto-toxic cyanogenic glucosides in sorghum. The Plant Journal 94, 1109-1125.
| Crossref | Google Scholar | PubMed |
Boone SC, Dalton H, Prent A, et al. (2022) AusGeochem: an open platform for geochemical data preservation, dissemination and synthesis. Geostandards and Geoanalytical Research 46, 245-259.
| Crossref | Google Scholar |
Bowman DMJS, Brown GK, Braby MF, et al. (2010) Biogeography of the Australian monsoon tropics. Journal of Biogeography 37, 201-216.
| Crossref | Google Scholar |
Boyd FT, Aamodt OS, Bohstedt G, Truog E (1938) Sudan grass management for control of cyanide poisoning. Agronomy Journal 30, 569-582.
| Crossref | Google Scholar |
Bull-Herenu K, Arroyo MTK (2009) Phenological and morphological differentiation in annual Chaetanthera moenchioides (Asteraceae) over an aridity gradient. Plant Systematics and Evolution 278, 159-167.
| Crossref | Google Scholar |
Carvalho C, Davis R, Connallon T, Gleadow RM, Moore JL, Uesugi A (2022) Multivariate selection mediated by aridity predicts divergence of drought-resistant traits along natural aridity gradients of an invasive weed. New Phytologist 234, 1088-1100.
| Crossref | Google Scholar | PubMed |
Coley PD, Bryant JP, Chapin FS (1985) Resource availability and plant antiherbivore defense. Science 230, 895-899.
| Crossref | Google Scholar | PubMed |
Coskun D, Deshmukh R, Sonah H, Menzies JG, Reynolds O, Ma JF, Kronzucker HJ, Bélanger RR (2019) The controversies of silicon’s role in plant biology. New Phytologist 221, 67-85.
| Crossref | Google Scholar | PubMed |
Cowan MF, Blomstedt CK, Norton SL, Henry RJ, Møller BL, Gleadow R (2020) Crop wild relatives as a genetic resource for generating low-cyanide, drought-tolerant Sorghum. Environmental and Experimental Botany 169, 103884.
| Crossref | Google Scholar |
Cowan M, Møller BL, Norton S, Knudsen C, Crocoll C, Furtado A, Henry R, Blomstedt C, Gleadow RM (2022) Cyanogenesis in the Sorghum genus: from genotype to phenotype. Genes 13, 140.
| Crossref | Google Scholar | PubMed |
Curto G, Dallavalle E, De Nicola GR, Lazzeri L (2012) Evaluation of the activity of dhurrin and sorghum towards Meloidogyne incognita. Nematology 14, 759-769.
| Crossref | Google Scholar |
Dai A (2013) Increasing drought under global warming in observations and models. Nature Climate Change 3, 52-58.
| Crossref | Google Scholar |
Fick SE, Hijmans RJ (2017) WorldClim 2: new 1-km spatial resolution climate surfaces for global land areas. International Journal of Climatology 37, 4302-4315.
| Crossref | Google Scholar |
Gleadow RM, Møller BL (2014) Cyanogenic glycosides: synthesis, physiology, and phenotypic plasticity. Annual Review of Plant Biology 65, 155-185.
| Crossref | Google Scholar | PubMed |
Gleadow RM, Woodrow IE (2002) Mini-review: constraints on effectiveness of cyanogenic glycosides in herbivore defense. Journal of Chemical Ecology 28, 1301-1313.
| Crossref | Google Scholar | PubMed |
Gleadow RM, Møldrup ME, O’Donnell NH, Stuart PN (2012) Drying and processing protocols affect the quantification of cyanogenic glucosides in forage sorghum. Journal of the Science of Food and Agriculture 92, 2234-2238.
| Crossref | Google Scholar | PubMed |
Gleadow RM, McKinley BA, Blomstedt CK, Lamb AC, Møller BL, Mullet JE (2021) Regulation of dhurrin pathway gene expression during Sorghum bicolor development. Planta 254, 119.
| Crossref | Google Scholar | PubMed |
Goudet J (2005) Hierfstat, a package for R to compute and test hierarchical F-statistics. Molecular Ecology Notes 5, 184-186.
| Crossref | Google Scholar |
Gruber B, Unmack PJ, Berry OF, Georges A (2018) dartR: an r package to facilitate analysis of SNP data generated from reduced representation genome sequencing. Molecular Ecology Resources 18, 691-699.
| Crossref | Google Scholar | PubMed |
Gruber B, Unmack P, Berry O, Georges A (2019) Introduction to dartR. Available at https://rdrr.io/cran/dartR/f/inst/doc/dartRTutorials.pdf
Guo C, Ma L, Yuan S, Wang R (2017) Morphological, physiological and anatomical traits of plant functional types in temperate grasslands along a large-scale aridity gradient in northeastern China. Scientific Reports 7, 40900.
| Crossref | Google Scholar |
Hartley SE, Fitt RN, McLarnon EL, Wade RN (2015) Defending the leaf surface: intra-and inter-specific differences in silicon deposition in grasses in response to damage and silicon supply. Frontiers in Plant Science 6, 35.
| Crossref | Google Scholar | PubMed |
Hiltpold I, Demarta L, Johnson S, Moore B, Power S, Mitchell C (2016) Silicon and other essential element composition in roots using X-ray fluorescence spectroscopy: a high throughput approach. In ‘Invertebrate Ecology of Australasian Grasslands. Proceedings of the Ninth ACGIE’. (Ed. S Johnson) pp. 191–196. (Western Sydney University: Hawkesbury, NSW, Australia)
Hunt BJ, Taylor AO (1976) Hydrogen cyanide production by field-grown sorghums. New Zealand Journal of Experimental Agriculture 4, 191-194.
| Crossref | Google Scholar |
Islam T, Moore BD, Johnson SN (2022) Silicon suppresses a ubiquitous mite herbivore and promotes natural enemy attraction by altering plant volatile blends. Journal of Pest Science 95, 423-434.
| Crossref | Google Scholar |
Jaccoud D, Peng K, Feinstein D, Kilian A (2001) Diversity arrays: a solid state technology for sequence information independent genotyping. Nucleic Acids Research 29, e25.
| Crossref | Google Scholar |
Katz O (2019) Silicon content is a plant functional trait: implications in a changing world. Flora 254, 88-94.
| Crossref | Google Scholar |
Kawecki TJ, Ebert D (2004) Conceptual issues in local adaptation. Ecology Letters 7, 1225-1241.
| Crossref | Google Scholar |
Kooyers NJ, Gage LR, Al-Lozi A, Olsen KM (2014) Aridity shapes cyanogenesis cline evolution in white clover (Trifolium repens L.). Molecular Ecology 23, 1053-1070.
| Crossref | Google Scholar | PubMed |
Kumari A, Goyal M, Kumar R, Sohu RS (2021) Morphophysiological and biochemical attributes influence intra-genotypic preference of shoot fly [Atherigona soccata (Rondani)] among sorghum genotypes. Protoplasma 258, 87-102.
| Crossref | Google Scholar | PubMed |
Lazarides M, Hacker JB, Andrew MH (1991) Taxonomy, cytology and ecology of indigenous Australian sorghums (Sorghum Moench: Andropogoneae: Poaceae). Australian Systematic Botany 4, 591-635.
| Crossref | Google Scholar |
Linhart YB (1974) Intra-population differentiation in annual plants I. Veronica peregrina L. raised under non-competitive conditions. Evolution 28, 232-243.
| Google Scholar | PubMed |
Liu P, Yin L, Wang S, Zhang M, Deng X, Zhang S, Tanaka K (2015) Enhanced root hydraulic conductance by aquaporin regulation accounts for silicon alleviated salt-induced osmotic stress in Sorghum bicolor L. Environmental and Experimental Botany 111, 42-51.
| Crossref | Google Scholar |
Maxwell K, Johnson GN (2000) Chlorophyll fluorescence: a practical guide. Journal of Experimental Botany 51, 659-668.
| Crossref | Google Scholar | PubMed |
Møller BL (2010) Functional diversifications of cyanogenic glucosides. Current Opinion in Plant Biology 13, 337-346.
| Crossref | Google Scholar |
Moore BD, Johnson SN (2017) Get tough, get toxic, or get a bodyguard: identifying candidate traits conferring belowground resistance to herbivores in grasses. Frontiers in Plant Science 7, 1925.
| Crossref | Google Scholar | PubMed |
Myrans H, Gleadow RM (2022) Regulation of cyanogenic glucosides in wild and domesticated Eusorghum taxa. Plant Biology 24, 1084-1088.
| Crossref | Google Scholar | PubMed |
Myrans H, Diaz MV, Khoury CK, Carver D, Henry RJ, Gleadow R (2020) Modelled distributions and conservation priorities of wild sorghums (Sorghum Moench). Diversity and Distributions 26, 1727-1740.
| Crossref | Google Scholar |
Myrans H, Vandegeer RK, Henry RJ, Gleadow RM (2021) Nitrogen availability and allocation in sorghum and its wild relatives: divergent roles for cyanogenic glucosides. Journal of Plant Physiology 258–259, 153393.
| Crossref | Google Scholar | PubMed |
Quiroga RE, Fernández RJ, Golluscio RA, Blanco LJ (2013) Differential water-use strategies and drought resistance in Trichloris crinita plants from contrasting aridity origins. Plant Ecology 214, 1027-1035.
| Crossref | Google Scholar |
Reidinger S, Ramsey MH, Hartley SE (2012) Rapid and accurate analyses of silicon and phosphorus in plants using a portable X-ray fluorescence spectrometer. New Phytologist 195, 699-706.
| Crossref | Google Scholar | PubMed |
Ryalls JMW, Moore BD, Johnson SN (2018) Silicon uptake by a pasture grass experiencing simulated grazing is greatest under elevated precipitation. BMC Ecology 18, 53.
| Crossref | Google Scholar |
Selmar D, Lieberei R, Biehl B (1988) Mobilization and utilization of cyanogenic glycosides: the linustatin pathway. Plant Physiology 86, 711-716.
| Crossref | Google Scholar |
Simpson KJ, Wade RN, Rees M, Osborne CP, Hartley SE (2017) Still armed after domestication? Impacts of domestication and agronomic selection on silicon defences in cereals. Functional Ecology 31, 2108-2117.
| Crossref | Google Scholar |
Smith DMS, Morton SR (1990) A framework for the ecology of arid Australia. Journal of Arid Environments 18, 255-278.
| Crossref | Google Scholar |
Thorne SJ, Maathuis FJ, Hartley SE (2023) Induction of silicon defences in wheat landraces is local, not systemic, and driven by mobilization of soluble silicon to damaged leaves. Journal of Experimental Botany 74, 5363-5373.
| Crossref | Google Scholar |
Weir BS, Cockerham CC (1984) Estimating F-statistics for the analysis of population structure. Evolution 38, 1358-1370.
| Crossref | Google Scholar |
Williams K, De Vries R, Stein J, Storey R (2010) 0.01 degree stack of climate layers for continental analysis of biodiversity pattern, version 1.0. v2. CSIRO Data Collection. Available at https://doi.org/10.25919/5c0efa88cd454
Zagrobelny M, Bak S, Møller BL (2008) Cyanogenesis in plants and arthropods. Phytochemistry 69, 1457-1468.
| Crossref | Google Scholar | PubMed |