
Potential connections between atmospheric rivers in China and Australia
Lin Xu A , Huqiang Zhang B F , Weiwei He C , Chengzhi Ye A , Aurel Moise B D and José M. Rodríguez EA Hunan Meteorological Service, Changsha, Hunan, China.
B Bureau of Meteorology, GPO Box 1289k, Melbourne, Vic. 3001, Australia.
C Spic Energy Techonology & Engineering Company, Shanghai, China.
D Centre for Climate Research Singapore, Meteorological Service Singapore, Singapore.
E Met Office, FitzRoy Road, Exeter, Devon, EX1 3PB, United Kingdom.
F Corresponding author. Email: Huqiang.Zhang@bom.gov.au
Journal of Southern Hemisphere Earth Systems Science 70(1) 36-53 https://doi.org/10.1071/ES19027
Submitted: 30 April 2019 Accepted: 22 January 2020 Published: 17 September 2020
Journal Compilation © BoM 2020 Open Access CC BY-NC-ND
Abstract
Results from a collaborative project between the Australian Bureau of Meteorology and China Meteorological Administration found that atmospheric rivers (ARs) can occur simultaneously in East Asia and Australia. Furthermore, ARs and the Northwest Cloud Band in the Australia region tend to reach their peaks during austral cool season (May–August). At the same time that the Asian summer monsoon develops and its meridional moisture transport and AR activities intensify. This has prompted us to explore potential connections of ARs in the two regions. In this study, we firstly analysed two ARs and their mechanism that occurred in China and Australia in June 2016, which caused significant rainfall in both countries. We then explored the atmospheric circulation background for such AR connections. From this case study, we show that ARs originating from the tropical Indian and Pacific oceans can become bifurcated through Indo-Pacific inter-basin interactions. The position of the bifurcation appears to depend on the location and intensity of Western Pacific Subtropical High (WPSH), the subtropical high in the Australian region and the middle-latitude storm track migration in the southern hemisphere. Moreover, by analysing bifurcated AR events from the past two decades, we show that they are more likely to occur during boreal summer months. Most of the bifurcations occurred in the boreal summer following the decaying phase of an El Niño in its preceding winter, due to a delayed El Niño Southern Oscillation influence on the WPSH and a subtropical high in the Australian region. Our research further demonstrates the value of applying AR analysis in improving our understanding of the weather and climate in the Australia–Asian monsoon region.
Keywords: atmospheric river; bifurcation; atmospheric circulation anomalies, El Niño, extreme rainfall, Northwest Cloud Band, Western Pacific Subtropical High.
1 Introduction
The Australia–Asian (A–A) monsoon is an important part of the global monsoon system and provides a link between climate in the Asian region with that in Australia (Zhang and Zhang 2010; He 2015; Zhang and Moise 2016; Zhang et al. 2017; Yang et al. 2019). Numerous studies have demonstrated that precipitation in the A–A monsoon region is the direct product of moisture transport from tropic warm oceans into the extratropics (Huang et al. 1998; Simmons et al. 1999; Ding 2004; Zhou and Yu 2005; Li and Zeng 2005; Chen and Huang 2007; Zhang 2010; Chen and Guan 2016). In the East Asia region, it is well-known that the Asian summer monsoon (roughly from May to September) has three favorable channels for tropical atmospheric moisture being transported into the region: (i) the southwesterly flow from the Bay of Bengal and tropical Eastern Indian Ocean, (ii) the cross-equatorial flow from the South China Sea, and (iii) the southeasterly flow from the western flank of the Western Pacific Subtropical High (WPSH) (Chen et al. 1991; Chang 2004; Ding 2004; Wang 2006; Chen et al. 2020; Ye et al. 2020). When the Asian monsoon receives its heavy rainfall during the boreal warm season, the Australian region in the southern hemisphere experiences its cool season (austral winter). During this period, tropical Australia also experiences its dry season, with most rainfall occuring in the southwestern and southeastern parts of the continent (Nicholls et al. 2012; Risbey et al. 2013). Understanding the moisture source for supporting rainfall during this period has also drawn significant attention in the last decade. Although the middle-latitude storm track and its variations have played a significant role in explaining rainfall interannual variations and recent rainfall trends in southwest Australia (Frederiksen and Frederiksen 2007), studies have also highlighted the importance of tropical sea surface temperatures (SSTs) of the Indian and Pacific oceans in generating rainfall either through wave propagation (Cai et al. 2012) or through water vapour transport (Ummenhofer et al. 2011; Gao and Sun 2016).
Therefore, to better understand the A–A monsoon system and its influence on the rainfall variations in the region, it is of paramount importance to study detailed characteristics of atmospheric moisture transport associated with A–A monsoon dynamics. This was clearly highlighted in a comprehensive review by Stan et al. (2017) on research needed for advancing our understanding and forecasting of tropical–extratropical teleconnections. In particular, they pointed out the challenge for better understanding the role of dynamical interactions that impact midtropospheric moisture. As reviewed by Ye et al. (2020), the atmospheric river (AR) concept has started to draw significant attention in the scientific community in recent years for diagnosing moisture transport in the A–A region (Hirota et al. 2016; Yang et al. 2017). An AR is a long, narrow and transient belt-shaped channel of strong water vapour transport in the lower atmosphere, usually originating from tropical oceans and closely associated with low level jet ahead of the cold front of an extratropical cyclone (American Meteorological Society 2019). ARs are responsible for most of the atmospheric water vapour meridional transport (Zhu and Newell 1998; Gimeno et al. 2014); therefore they can play an important role in understanding rainfall variations in the A–A region, where the climate is renowned for its significant meridional water vapour transport from the tropics to the subtropics. Stan et al. (2017) further classified ARs as a category of high-impact weather events, since they are characterised by highly focused streams of precipitable water that are associated with extreme precipitation along the U.S. West Coast and other locations. Most of the AR studies published so far have focused on North America and western Europe (Dettinger 2013; Kim et al. 2013; Rivera et al. 2014; Rutz et al. 2014; Lavers and Villarini 2015; Warner et al. 2015; Gao et al. 2016; Brands et al. 2017), with only limited studies reporting AR results from the A–A region (Yue and Li 2015, 2016; Sun et al. 2018; Chen et al. 2020) and their contribution to strong precipitation in the monsoon climate (Dettinger 2013; Kim et al. 2013; Rutz et al. 2014; Warner et al. 2015).
As part of an Australian Bureau of Meteorology (BoM) and China Meteorological Administration (CMA) bilateral project on AR analyses in the A–A monsoon region (Ye et al. 2020), Wu et al. (2020) reported climatological characteristics of the ARs reaching China and Australia based on manual detections from a 30-year AR database. They documented AR mean climatologies, seasonality, interannual variations and potential drivers in East Asia and Australia. Results from that dataset showed that ARs in China occurred more frequently in boreal summer (May–August). This is also the peak season of ARs in most of the Australian region, but it is their cool season. Such an AR seasonality in the Australian region agrees well with the well-known feature of the Australian Northwest Cloud Band (NWCB), which has its peak in the austral cool season too (Tapp and Barrell 1984; Wright 1997; Telcik and Pattiaratchi 2014). The NWCB is a long and narrow band seen in satellite weather images (typically extending over 2500 km and existing for two to four days), and it has a strong similarity to the AR phenomenon. Its formation is attributed to tropical–extratropical interactions (Wright 1997). Frederiksen and Balgovind (1994) and Frederiksen and Frederiksen (1996) further linked it with SST gradients in the Indian Ocean, which produce an enhanced influx of warm tropical air from the northwest of Australia towards the continent. Furthermore, from the AR dataset developed in this project (Ye et al. 2020), Wu et al. (2020) found ARs can occur simultaneously in both regions. All these results raise several important questions: (i) why do the ARs in China and Australia tend to occur during the same period but in different seasons? (ii) is there any connection between ARs in the two regions? (iii) what are the underlying processes leading to their potential connections? These questions became the focus of this study.
In this paper, we start with a detailed case study to reveal the synoptic features of two ARs occurring simultaneously in China and Australia and discuss the characteristics of these ARs. Following that, through statistical analysis of ARs with bifurcation features in the A–A region during the last 20 years, we investigate the underlying processes leading to such results. Accordingly, the paper is structured as following. In Section 2 we introduce the analytical method and dataset used in this analysis. Section 3 provides results from the analysis of two ARs that caused strong precipitation in China and Australia during 17–22 June 2016. In Section 4, we assess the climatic background and underlying processes that link the ARs in China and Australia. Finally, in Section 5, we summarise the main conclusions from this study and discuss weaknesses in the current analysis and some potential future work.
2 Data and analytical methods
In this analysis, conventional meteorological variables, including zonal and meridional wind components, geopotential height, atmospheric specific humidity and temperature, came from the Japanese 55-year Reanalysis (JRA-55) data (Ebita et al. 2011) for the period of 1998 to 2017. These are 6-hourly fields with a horizontal resolution of 1.25° × 1.25°. In the rainfall analysis, we used global daily precipitation data from the GPCP (Global Precipitation Climatology Project) dataset developed by the Climate Prediction Center (Xie et al. 2007). The rainfall data are at 0.5° × 0.5° resolution (https://water.weather.gov/precip/download.php).
In the analysis, to explore the moisture sources of ARs occurring in the A–A region, we used the backward Hybrid Single Particle Lagrangian Integrated Trajectory (HYSPLIT) 4 model developed by Air Resources Laboratory of NOAA (Draxler and Hess 1998). The datasets used in driving the backward trajectory model were from the NCEP 6-hourly global analysis data, with a horizontal resolution of 2.5° × 2.5° (Saha et al. 2014).
Given the importance of tropical SSTs in modulating the A–A monsoon climate and in determining the distribution and intensity of tropical moisture sources (e.g. Frederiksen and Frederiksen 1996), the HadISST dataset (Rayner et al. 2003) from the UK Hadley Center at 1° × 1° resolution (https://www.metoffice.gov.uk/hadobs/hadisst) was used to study the impacts of tropical SST anomalies on the characteristics of moisture transport in the A–A region. We used several key climate indices, including the Niño 3.4 and Indian Ocean Dipole (IOD), provided by the China National Climate Center (https://cmdp.ncc-cma.net/Monitoring/cn_index_130.php), for diagnosing underlying drivers governing AR variations in the region.
The definition and detection of ARs in this study were the same as those introduced by Ye et al. (2020). An AR is defined in terms of vertically Integrated Vapour Transport (IVT) in kg m−1 s−1:
Here, g is gravitational acceleration, q is specific humidity, V is horizontal wind vector, p is atmospheric pressure, and psfc and ptop represent atmospheric pressure values at the surface and top of the atmosphere, respectively. In practical application, it is generally integrated to 300 hPa (close to the tropopause).
Our study focuses on the simultaneous occurrences of ARs in both Australia and East Asia, which we term ‘AR bifurcation’. In these cases, initial atmospheric moisture transport confined within the tropical Indo-Pacific basin split into two separate branches, propagating in different directions, with one towards East Asia and the other towards Australia. The bifurcating AR events in this study needed to satisfy three conditions. Firstly, they needed to meet the AR criteria (Ye et al. 2020), which is a long and narrow corridor of strong IVT, bound by the positions of IVT = 250 kg m−1 s−1, with a maximum IVT ≥ 500 kg m−1 s−1, a minimum length ≥ 1500 km and a length/width ratio ≥ 2; secondly, the location where AR bifurcation occurred needed to be within the Indian–Pacific basin; and thirdly, the bifurcated ARs needed to land simultaneously in East Asia (mainly China) and in the Australian continent and produce precipitation over both regions. There were 21 bifurcated AR events in 1998–2017, and based on these 21 cases, we have assessed the climatic background for their occurrence, as will be discussed in Section 4.
3 Bifurcated ARs in the A–A region: a case study
In this study, we first conducted a detailed synoptic case analysis. Note that although Chen et al. (2020) already reported an AR case study under this bilateral project, the focuses are different. Chen et al. (2020) mainly compared details of AR structures and characteristics of moisture transport in the A–A region associated with ARs, whereas our analysis focused on exploring the connections between ARs in these two regions. We chose the period of 17–23 June 2016 as our case study for a number of reasons. Firstly, during this period, a pair of ARs occurred in China and Australia and brought heavy precipitation in both regions. Secondly, as aforementioned in the Introduction section, results from Wu et al. (2020) found that ARs in China tended to peak during the boreal summer season, whereas ARs in Australia tended to peak during the same time but in its cool season. Therefore, choosing the June 2016 boreal summer (austral winter) case further allowed us to investigate why ARs tend to share the same seasonality in Australia and China.
During 17–23 June 2016, both China and Australia experienced significant precipitation (Fig. 1a). Heavy rainfall in China was mainly concentrated in the middle and lower reaches of the Yangtze River. More than 100 mm of daily precipitation was received in western Jiangsu, northeastern Anhui and northwestern Hunan provinces. This heavy rainstorm caused severe flooding and considerable economic losses, with many fatalities and injuries (Cao and Zhang 2016). At the same time, heavy rainfall occurred in the western and eastern parts of Australia. During the early period of this event, heavy rainfall occurred in Brisbane and nearby regions, where over 100 mm of rainfall was received on 19 June. This triggered flash floods in the states of Queensland and New South Wales. Later, significant rainfall was received in the western part of the continent from the Pilbara region down to the south of the Great Victoria Desert and South Australia. Although the rainfall intensity was weaker in the western and southern regions than in the eastern part of Australia and in China, the rainfall received from this single event accounted for over 1/3 of the whole seasonal rainfall totals for June-July-August in these dry regions in the states of Western Australia and South Australia (Fig. 1b).
|
When examining 6-hourly IVT evolution during 17–23 June 2016 in the A–A region throughout this event, we noticed strong IVTs in both East Asia and Australia (not shown). We further separated their evolution roughly into two stages: (i) from 17 to 19 June and (ii) from 20 to 23 June. Fig. 2 shows the IVT derived from the JRA55 reanalysis for the two stages. The first stage is characterised by strong IVT through easterly trade winds in the western Pacific, which divided into two branches around 150°E on the 18 June (Fig. 2a). As shown by the red arrows, one branch bypassed the south side of the WPSH and then moved northeastward through the South China Sea into the Yangtze and Huai rivers. It converged with water vapour from the Indian Ocean through the Indochina Peninsula by onshore monsoonal flow to then feed over eastern China. The shape and magnitude of this IVT branch in the East Asian region meet the AR criteria from Guan and Waliser (2015) and Ye et al. (2020). This inland AR contributed to heavy precipitation along the Yangtze River Basin. The second branch turned southward along the subtropical high in the Coral Sea and Southwest Pacific, forming a north–south AR over the eastern coast of the Australian continent in Queensland and New South Wales. The maximum value of IVT was between 750 and 900 kg m−1 s−1 (Fig. 2a), which contributed to heavy precipitation in the region during 17–19 June. Note that during this first stage, a strong IVT belt was evident in the southern Indian Ocean (west of the Australian continent), but it had not yet reached the Australian continent. Meanwhile the moisture transport associated with the Somali jet was largely confined in the Bay of Bengal region through a monsoon depression. Therefore, we do not classify these patterns in the Indian Ocean as an AR bifurcation at this stage.

|
The second stage started on 20 June, when meridional water vapour transport in the Indian Ocean was strengthened and moved eastward. Near 95°E, the IVT belt split into two branches on the 21 June (Fig. 2b). One branch propagated northeastward through the Bay of Bengal and joined water vapour carried over by the WPSH in the western Pacific Ocean. This strong IVT belt further enhanced the inland rainfall over eastern China and produced heavy precipitation in the Anhui Province on 20 June and Jiangsu Province on the 21 June. The other branch propagated southeastward into the west of Western Australia. It was further strengthened during its development and formed a northwest–southeast AR across the continent. Meanwhile, the AR along the eastern coast of Australia moved southeastward into the Tasman Sea and southwest Pacific (Fig. 2b), and the precipitation in eastern Australia weakened significantly. The trans-Australia AR moved out of Australia on 23 June. During this process, significant precipitation was observed for four days in western and southern parts of Australia from 20 to 23 June 2016.
The main differences between these two stages were that at stage one, ARs in the Indian Ocean and in the Western Pacific were separate entities, whereas at stage two, the branches of moisture transport in the Asian region (one in the Bay and Bengal and the other in the western Pacific Ocean) merged to form a strong AR in the East Asian region. At the same time, an AR landed in the Australian continent by strong moisture input from the tropical Indian Ocean. These two stages demonstrate the linkage and interactions between atmospheric moisture transport in the Indian and Pacific basins, which will be discussed further.
Fig. 3 further displays detailed synoptic features and large-scale circulation background causing such AR bifurcations. Fig. 3a shows the results for the first stage at 00 UTC 19 June 2016. It includes low tropospheric circulation patterns represented by 850 hPa streamlines and the position of the WPSH and its southern hemispheric counterpart in the Coral Sea and Southwest Pacific. Our particular attention to the WPSH in this analysis is due to the fact that it plays a critical role in determining the orientation and intensity of moisture transport in the East Asian summer monsoon (Chen et al. 1991; Chang 2004; Wang et al. 2013), as also found by the case study of Chen et al. (2020) in this project. At stage one, the WPSH was strong, and its westward ridge point was near 100°E, which is much more westward than its climatological position (around 130°E as shown in Fig. 4a). Meanwhile, its subtropical high counterpart in the southern hemisphere occurred in the Coral Sea and southwest Pacific, with its 500 hPa west edge located around 130°E. As a result, the atmospheric circulation patterns associated with these subtropical highs were favourable for the warm and wet tropical air being transported out of the equatorial western Pacific towards China and eastern Australia. At 850 hPa, the branch transported towards East Asia was further enhanced by the southwesterly monsoon flow that led to the formation of a long and narrow band of moisture transport (meeting the AR criteria) over East Asia, as seen in Fig. 2a. Meanwhile, the northerly flow into the eastern Australian coast associated with the subtropical high in the Coral Sea region was further strengthened by a low-pressure system occupying the eastern part of the Australian continent and an anticyclonic system located over north Tasman Sea. This helped to produce a long and narrow band of strong north–south water vapour on the eastern coast of Australia and form the AR shown in Fig. 2a. Considering that both ARs originated from the easterly trade winds in the equatorial western Pacific, with one branch turning clockwise into East Asia and the other turning anticlockwise into the Australian region, we called this an AR bifurcation in western Pacific. Note that at that stage, a strong subtropical high (known as the Mascarene High) was centered around 40°S, 70°E in the southern Indian Ocean west of the Australian continent and a deep trough approached towards the southwest of the Australian continent.
|

|
The circulation patterns for the second stage are illustrated by results at 00 UTC 21 in Fig. 3b. The 850 hPa streamline and the area with geopotential height above 588 geopotential decameter (gpdm) at 500 hPa, show that the subtropical WPSH in the northern hemisphere slightly weakened, retreated eastward and was maintained near 110°E, whereas the subtropical high in the Coral Sea and southwest Pacific region extended more westward to 120°E (Fig. 4b). At this stage, southwesterly monsoon flowed from the Indian Ocean to the west of the WPSH strengthened. This helped to maintain a strong southwest–northeastward moisture transport from the tropics to the subtropics in East Asia. In the southern hemisphere, the subtropical high in the southern Indian Ocean moved eastward and penetrated the southern part of the Australian continent. At the same time, a low system was positioned in the eastern tropical Indian Ocean to the northwest of the Australian continent. This low system, together with the westward extension of the subtropical ridge (STR) over northeast Australia and the further inland penetration of the middle-latitude trough in the south, helped to form a strong moisture transport channel from the northwest to southeast across the western part of the continent (Fig. 2b). The channel’s geometry and intensity satisfied the AR requirement and was therefore classified as an AR event in the Australian continent. At the second stage, the low-pressure system seen at the first stage in the eastern part of the Australian continent moved southeastward out of the continent, and the anticyclonic system in the Tasman Sea moved further southeastward. Consequently, the AR in the eastern coast of Australia disappeared at stage 2. In summary, this stage was characterised by the southeastward penetration of tropical moisture from tropical Indian Ocean into the Australian continent through an AR in its west. Meanwhile, a strong moisture transport occurred northeastward from the Bay of Bengal across the Indochina Peninsula into the East Asian region. We therefore classified this case as an AR bifurcation in the Indian Ocean.
It should be pointed out that ARs appear as a corridor of strong horizontal water vapour transport, but they do not necessarily represent true trajectories of water vapour formation (Bao et al. 2006; Knippertz and Wernli 2010; Dacre et al. 2015). Nevertheless, different moisture sources supporting ARs are important for determining the rainfall efficiency of these moisture transport belts, with warm and moist air from the tropics being more productive for heavy rainfall generation. Therefore, we used the HYSPLIT model developed by NOAA (Draxler and Hess 1998) for air mass trajectory analysis of the ARs in this case study. In the model, the height of airflow trajectory varies with location and time and therefore reflects the three-dimensional variations of airflow in the process of transportation.
In this analysis, the initial particle domains used to conduct such backward tracking were selected over the areas where heavy rainfall occurred. The trajectory analysis started at 7 × 5 grid points uniformly distributed across the selected domain (with 6° in longitude and 4° in latitude) and performed at three initial heights of 500, 1500 and 3000 m. Five-day backward trajectories are simulated from 00 UTC and 12 UTC for 21 June 2019. In total, there were 210 trajectories corresponding to 35 starting points at three levels and at two start times. The cluster analysis method was then used to group these large number of trajectories into dominant pathways to reflect the main channels of moisture transport associated with the system.
The water vapour contribution rate of different pathways was further calculated by the following formula:

where Qa is the contribution rate of each pathway, Qi and Qj are the water vapour flux at each trajectory that belongs to that pathway, m indicates the number of trajectories contained in the pathway/cluster and n is the total number of trajectories.
The initial particle domain selected for the case in China was over 30–34°N, 116–122°E where heavy rainfall occurred. Three dominant water vapour pathways were identified by the cluster analysis of 210 trajectories (Fig. 5a). The first one is the Bay of Bengal pathway (pathway A), where air particles mainly came from the Somali and Indian Ocean cross-equatorial jets. They entered the rainstorm area through the Bay of Bengal and southwestern China. The second one is the South China Sea pathway (pathway B), which carried air masses from the cross-equatorial flow in the eastern Indian Ocean and transported them to the rainstorm area via the South China Sea. The third one is the Pacific pathway (pathway C). It carried air masses though the northeast trade winds from the western Pacific Ocean and then turned northeast towards the rainstorm area. These three pathways are similar to the AR pathways found in Chen et al. (2020) and are consistent with the three moisture channels in the East Asian monsoon region documented in other studies (Ye et al. 2020). Fig. 5b further shows that the height of the trajectories was mostly below 850 hPa. After approaching the inland regions and the region where rainfall occurred, the altitude of these trajectories increased due to the influence of topography and interactions with cold air from the north.

|
Table 1 shows that for the AR over China, the number of trajectories from pathway A and B was much higher than that from pathway C. Pathways A and B together accounted for about 90% of the total water vapour flux carried by this AR, whereas the contribution by pathway C was only 10%. Note that the three channels were all warm and humid (pseudo-equivalent potential temperature, θse is large) because they all originated from tropical oceans.

|
The initial particle domain used for of the backward trajectory analysis for the Australian AR case on 21 June 2019 was over 26–22°S and 114–120°E where significant rainfall occurred (see ). Again, the trajectory analysis started at 7×5 grid points uniformly distributed across the selected domain and performed at three initial heights of 500, 1500 and 3000 m. Five-day backward trajectories were simulated from 00 UTC and 12 UTC for 21 June 2019. The total 210 trajectories were grouped into three dominant water vapour pathways by cluster analysis (Fig. 5c). Air particles in pathway A from the eastern Indian Ocean appeared to be one of the dominant pathways for moisture transport associated with the AR in this region. It accounted for over 36% of the total trajectories and contributed to over 47% of the total water vapour by the AR (Table 1). Although air masses from pathway B originated from the northwest inland region, they obtained a large amount of moisture when passing over the ocean surface into northwest of Australia. This pathway also played an important role in feeding moisture into the AR and contributed about 1/3 of the total water vapour transport. Pathway C represents the influence of the middle-latitude trough, with much cooler air particles brought into the AR system, as shown in Fig. 2b. Table 1 further shows that the AR in the Australian region was less warm and moist than the counterpart in China during the Asian summer monsoon, with a much lower θse. This partly explains why the rainfall intensity associated with Australian AR is weaker. This was also reported by Chen et al. (2020). In addition, Fig. 5d shows that pathway A largely remained at a height of around 850–800 hPa, whereas pathway B experienced a significant uplift from around 900 to 800 hPa when it reached the region with rainfall occurrence through the interaction with the middle-latitude front.
Combining the trajectory analyses over China and Australia, as shown in Fig. 3, the eastern part of the Indian Ocean was an important moisture source for both ARs occurring in East Asia and the western part of the Australian continent. The eastern part of the Indian Ocean was also the region where AR bifurcation occurred, with one branch travelling northeastward toward East Asia and the other southeastward across the western part of the Australian continent. In the following section, we will explain the likely underlying background processes leading to such AR bifurcations in the Indo-Pacific region.
4 Climatological background of bifurcated AR events in the A–A region
4.1 Connections between the WPSH and subtropical high in the Australian region
As pointed out in the Introduction, the main purpose of this study was to explore connections of AR activities in the A–A region. From the case analysis in Section 3, we showed that the positions and intensities of WPSH and the subtropical high in the southern hemisphere are important for simultaneous occurrence of ARs in the two regions. Therefore, to investigate the large-scale climatic background for the occurrence of such bifurcated ARs, we firstly explore connections between these subtropical highs in both hemispheres.
Variations of the WPSH have been extensively investigated in East Asian monsoon studies (Chen et al. 1991; Chang 2004; Wang 2006; Wang et al. 2013). But, studies on the formation and variations of the subtropical high influencing the Australian region in the southern hemisphere only started to increase in recent years (Drosdowsky 2005; Williams and Stone 2009; Cai et al. 2011; Timbal and Drosdowsky 2013), following an early study by Pittock (1971). Most of these studies showed the influence of the location and intensity of the STR in the region on winter rainfall variations in Australia (e.g. Cai et al. 2011; Timbal and Drosdowsky 2013). They also discussed the impacts of ENSO, IOD and the Southern Annular Mode (SAM) on the interannual variations of the STR. Nevertheless, there is a lack of assessment of potential connections between the STR in the Australian region and variations of the WPSH. Given the importance of these two systems in shaping AR activities in the A–A region, as revealed in our case study, we focused on assessing such connections.
Firstly, subtropical highs in the A–A region have remarkable seasonal cycles. Fig. 6a and b show the averaged positions of a subtropical high in the region represented by monthly mean sea level pressure (MSLP) data. Results in March and August were chosen because Williams and Stone (2009) showed that during these two months, the ridge of the subtropical high in eastern Australia has its most southward and northward migration, respectively. During the austral summer season, the northern part of the Australian continent is occupied by its summer monsoon, and the ridge of Australian subtropical high is located around 38–40°S. The middle-latitude storm track is located further poleward, south of the subtropical high. Due to such a synoptic setup, a large part of the southern portion of the Australian continent experiences its dry season of the year, and the storm track and its weather disturbances find it difficult to reach the continent. While in the austral winter season, with the retreat of the Australian monsoon and the development of the Asian summer monsoon in the north, the STR influencing the Australian region moves equatorward, and the ridge of the high system is now located around 30°S. During this period, its middle-latitude storm track moves northward and its middle-latitude weather systems easily penetrate the Australian continent, interacting with the subtropical and tropical systems and delivering significant rainfall in the southern part of the continent. Such a seasonal migration of the subtropical high in the Australian region is clearly demonstrated by Fig. 6c, which shows the seasonal cycle of MSLP averaged over the longitudinal range of 110–155°E for the Australian continent.

|
A remarkable feature shown in Fig. 6c and d is that such a north–south migration of the subtropical high in the Australian region is not only closely connected with the north–southward movement of the subtropical high in the Coral Sea and Southwest Pacific, but also the WPSH in the northern hemisphere. While we can expect to see such in-phase variations over the Australian continent and over the Coral Sea and southwest Pacific region, it is revealing that the seasonal variations of the subtropical high in the Australian region are also closely linked to the seasonal variations of the WPSH. During the boreal summer season, the WPSH moves northward along with the development of the Asian monsoon and the northward movement of the Intertropical Convergence Zone in the central Pacific. This is also the time when the Australian subtropical high moves northward further into the Australian continent. As discussed in Section 3, the formation of ARs in the Asian monsoon region were very closely linked to the position and intensity of the WPSH. At the same time, the formation of ARs in the Australian region and its NWCB required the interactions of the middle-latitude cyclonic systems with the subtropical high in the Australian continent (Frederiksen and Balgovind 1994; Wright 1997). Therefore, such a close connection between the subtropical highs in the western Pacific and in the Australian region appears to be a key factor for the in-phase AR seasonal variations in the two regions.
The WPSH has remarkable interannual variations in its east–west and north–south positions (Chen et al. 1991; Wang 2006; Wang et al. 2013). Based on the calculations of standard deviations of summer WPSH over 1979–2016, we found (not shown) two regions with significant year-to-year variations: (i) over 35–55°N, 150–200°E, and (ii) over 15–25°N, 115–150°E. Accordingly, we have created two indices by averaging MSLP over these two regions to represent the WPSH interannual variations. The north index is the averaged MSLP over 35–55°N, 150–220°E and the west index is the averaged MSLP over 15–25°N, 115–150°E. The former represents variations of the northward extension of WPSH and the latter represents the variations of WPSH westward extension. The domain of the west index is the same one used in Wang et al. (2013) in their WPSH studies. Fig. 7 shows the correlations between the WPSH north and west indices with the MSLP in the A–A region in May, June and July. There were two reasons for choosing these months. Firstly, the WPSH influencing the East Asian monsoon has significant stepwise movement, which lead to its rainfall’s northward migrations. Therefore, we could better assess monthly WPSH variations during the course of the Asian summer monsoon development. Secondly, May–July is also the period during which the STR in the Australian region retreats sharply towards the continent, as shown in Fig. 6c. It is also the peak season for the NCWB occurrence in the Australian region, as discussed in Ye et al. (2020) and Wu et al. (2020). From Fig. 7a, c, e, we can see some notable correlations between the northward extension of the WPSH and the pressure patterns in the Australian region. The signal is particularly strong in July when the WPSH has its northward jump in the western Pacific (Chen et al. 1991; Wang 2006). Results suggest that during the years when the WPSH is located more poleward, the maritime continent and warm pool region and tropical Indian Ocean tend to have low-pressure anomalies, which would favour stronger tropical convections. Although discussing the causality between the two is out of the scope of this study, there are studies that show the influence of tropic deep convections on the northward migration of the WPSH (e.g. Liu et al. 2001; Sui et al. 2007; Li et al. 2009; Raghavan et al. 2012; Zheng et al. 2016).

|
In contrast to the results seen in Fig. 7a, c, e, there is a consistent signal showing the connection between the westward extension of the WPSH and the intensity of subtropical high in the Coral Sea and southwest Pacific region (Fig. 7b, d, f). When the WPSH is located further westward in the tropical western Pacific, there is also an enhanced subtropical high in the Coral Sea to the east of the Australian continent. As shown in Section 3, and in the analysis of Chen et al. (2020), the westward extension of the WPSH is favourable for the moisture transport from the tropics into the East Asian monsoon region and the formation of ARs embedded within the monsoonal onshore flow. In addition, the case study in Section 3 and the analysis of Chen et al. (2020) underlined the importance of the subtropical high in eastern Australia and over the Coral Sea for forming ARs over the Australian continent. Although the analysis of Chen et al. (2020) already underlined the importance of the WPSH and Australian subtropical high for ARs in these two regions, Fig. 7 further suggests that the close connection between WPSH positions and the subtropical high over the Coral Sea and southwest Pacific is an important factor in explaining the AR bifurcation in the A–A region.
Based on the results in Fig. 7, we believe the westward extension of WPSH and its close linkage with its southern hemispheric counterpart in the Coral Sea and southwest Pacific are critical for the occurrence of AR bifurcations. To further examine such a mechanism, in Fig. 8 we show linear correlations between the monthly WPSH west index and the monthly IVT, calculated from the ERA-Interim data, for 1979–2016 for the months from May to July. From these results, we can clearly see that when the west index of WPSH is high, it corresponds to a much more enhanced moisture transport through the southwesterly Asian summer monsoon flow into the East Asian region and an enhanced moisture transport from the west flank of the WPSH. Both lead to a long and narrow belt of strong moisture transport with an AR structure in the East Asian region. At the same time, the penetration of warm and moist air from tropics into the Australian continent becomes more evident. This feature becomes much clearer in June and July as a strengthened transport band from the northwest towards the southeast. This pattern is very similar to the ARs occurring over the Australian region. Therefore, more westward extension of WPSH and enhanced subtropical high in the Coral Sea and southwest Pacific region favour the simultaneous occurrence of ARs in East Asia and Australia in the boreal summer (austral winter).
|
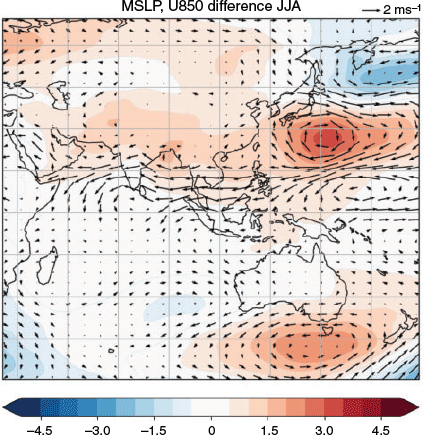
Nevertheless, such correlation analyses in Figs 7 and 8 cannot answer the causality of the close variations between the two subtropical highs. In this study, we have analysed a set of UK Met Office Unified Model (UM) “nudging” experiments to help us better understand such connections. Nudging, or Newtonian relaxation, is a simple form of data assimilation that adjusts dynamical variables of free running global climate models using meteorological re-analysis data to give a realistic representation of the atmosphere at a given time (Dalvi 2014). The variables in the UM that can be currently nudged are horizontal wind components and potential temperature (U and V). The nudging code in the UM carries out two main operations: (i) bringing the analysis data onto the model grid as well as time; and (ii) relaxing the model dynamical variables to this data. Milton (2018) used such experiments to study the source of errors in the UM simulations through a series of nudging experiments over a range of domains (https://code.metoffice.gov.uk/trac/gmed/wiki/PEGs/NudgingGA7). In one of their nudging experiments, a 20-year (1988–2007) UM version (known as GA7N96) was conducted using a 6-hourly nudging of the model wind and temperature fields to ERA-Interim over a large WPSH domain (160–240°E, 15–50°N). By contrasting the model differences between its default run and the nudged run, one can estimate the impacts of the model performance over the WPSH on the climate outside that domain. Fig. 9 shows the averaged June-July-August MSLP (colour) and 850 hPa horizontal wind (vector) differences between this nudge experiment and its default run for a 20-year model integration. From this figure one can clearly see that when the model is dynamically and thermodynamically constrained over the WPSH through wind and temperature nudging, there are significant responses from the subtropical high in the southern hemisphere too. Not only can the model simulate a much stronger WPSH than its default run (not shown), but it also simulates a much stronger subtropical high in the Australian region. Although the experiment was not particularly designed to explore the influence of WPSH on the AR bifurcation in the Indo-Pacific region (and there was not enough model data available to us to diagnose ARs in these experiments), results presented in Fig. 9 do support our notion that these two high systems are closely connected, and the UM nudging results tend to suggest the WPSH likely plays a dominant role in affecting atmospheric circulation in the region.
|
4.2 Possible influence of tropical SSTs on the occurrence of AR bifurcation
Following the June 2016 case study, we conducted a survey of the ARs in the A–A region with bifurcation features from the past 20 years (1998–2017). This allowed us to identify the climatic background for the occurrence of AR bifurcation in the Indo-Pacific region. Again, AR bifurcation is defined as such that two ARs occurred simultaneously in China/East Asia and over the Australia continent and both produced significant rainfall in these regions. As shown in Table 2, for the 20-year period, we found 21 bifurcated AR events, and there are several notable features in these results.

|
Firstly, the occurrence of such AR bifurcations had a strong seasonality, and they were more likely to occur in June–July. Of the 21 cases, 18 occurred in June and July, two cases in August and one case in May. This is consistent with the results discussed above that such AR bifurcations were caused by the northward and westward migrations of the WPSH and the retreat of the Australian STR into the Australian continent during the boreal summer season.
Secondly, out of the 21 bifurcation cases, 16 ARs in the Australian region had a northwest–southeast spatial orientation. Meanwhile, 19 of them had a southwest–northeast shape in the East Asian region. Such an orientation in the Australian region is in good agreement with the observational results (Wright 1997) that the frequency of NWCBs has its peak in the austral winter (boreal summer). This is also consistent with the AR climatology documented in Wu et al. (2020).
Finally, for the 21 AR bifurcation cases, 16 of them occurred during the boreal summer following an El Niño event peaking in the boreal winter. Thus, such AR activities are more likely to occur in the ENSO decaying phase. This prompted us to further examine possible drivers that could play a role in producing AR bifurcations in the A–A region using the ENSO Niño 3.4, IOD index data from China National Climate Center webpage https://cmdp.ncc-cma.net/Monitoring/cn_index_130.php and the Madden-Julian Oscillation (MJO) phase index from the BoM (http://www.bom.gov.au/climate/mjo/). As shown in Table 2, of all the key drivers, the delayed ENSO impacts stand out: 16 out of the 21 cases occurred in the boreal summer following a peak El Nino in the preceding winter. Of the 21 cases, 11 occurred during the IOD negative phases, suggesting only weak influence of IOD on the AR bifurcation. Furthermore, the results suggested that the MJO had little impact, with no clear phases favouring the AR bifurcation in the region. Note that, as highlighted in the review by Stan et al. (2017), we acknowledge the importance of MJO in influencing the tropical–extratropical interactions and modulating the AR activities on intraseasonal time scales, but this particular AR bifurcation phenomena was not affected by MJO, based on our analysis.
There are sound reasons for such ENSO results, as several studies have found that the WPSH is stronger during the summer following the peak of an El Niño event in the boreal winter (Wang and Wang 2000; Xie et al. 2009; Paek et al. 2016). These studies proposed several possible mechanisms to understand why ENSO, which peaks in boreal winter, can still impact the WPSH activities in the following summer. One of them is attributed to ENSO-induced SST anomalies in the western North Pacific following an ENSO event (Wang and Wang 2000) after which, through local air–sea interactions, they produce a delayed impact on the WPSH intensity and locations during the following summer.
To further investigate such delayed ENSO impacts on the atmospheric moisture transport, we calculated linear correlations between 850 hPa circulation with ENSO Niño 3.4 and IOD indices. There were several reasons for calculating both ENSO and IOD correlations. Firstly, it is widely acknowledged that both ENSO and IOD act as the main climate drivers influencing the Asian monsoon and Australian climate (Wang 2006; Zhang and Moise 2016). Furthermore, research from Ummenhofer et al. (2011) emphasised the impacts of IOD on the Australian winter rainfall through moisture transport from the tropical Indian Ocean into the Australian continent. To try to separate the ENSO and IOD impacts, we applied partial correlation analysis. Suppose pr1 is the partial correlation coefficient of the ENSO index and zonal wind component, the expression of this partial correction calculation is:

where rY1 is the correlation coefficient of the ENSO index and zonal wind component, r12 is the correlation coefficient of ENSO and IOD index, and rY2 is the correlation coefficient of the IOD index and the zonal wind component.
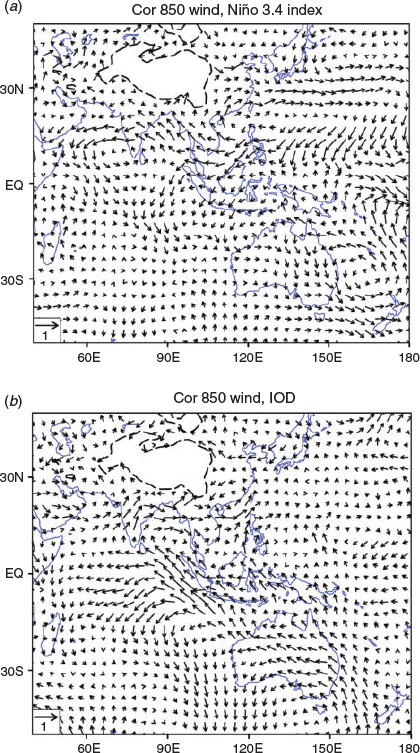
Fig. 10a shows the partial correlation analysis between Niño 3.4 index in December-January-February (DJF) with 850 hPa wind in June and July when most of the AR bifurcations occurred in our analysis. As pointed out by Paek et al. (2016), from the correlation pattern we can clearly see that during the El Niño decaying phase in the boreal summer (with El Niño being matured in preceding boreal winter), the WPSH tended to be stronger and with more westward extension. This is reflected in Fig. 10a as an anticyclonic circulation pattern in the western Pacific Ocean. At the same time, in the southern hemisphere, anomalous anticyclonic circulation in the Coral Sea, Tasman Sea and eastern Australia was evident. Furthermore, there was an enhanced onshore flow from the tropical eastern Indian Ocean and Java–Sumatra region into the Australian continent. All these patterns agree well with the correlation analysis between the WPSH west index and the circulation patterns shown in Fig. 8. These results confirm that: (i) the variations of the WPSH and its close connection with the subtropical high in the Australian and nearby region are important factors contributing to the AR bifurcation in the region; and (ii) the strong ENSO signal in the AR bifurcation cases is due to the delayed ENSO impacts on the subtropical highs in the A–A region.
|
In addition, Fig. 10b shows the partial correlations between June–July IOD and the 850 hPa circulation in June–July. As found in Ummenhofer et al. (2011), positive IOD (with warmer SSTs in the western Indian Ocean and cooler SSTs in the tropical eastern Indian Ocean northwest of the Australian continent) in the boreal summer (austral winter) season can lead to much reduced moisture transport from the Indian Ocean into the Australian continent. This is represented as anomalous southeast–northwestward flow across the Australian continent. This is why, in the negative IOD years with warmer tropical eastern Indian Ocean, Australia tends to experience more NWCB and more rainfall in its south (Ummenhofer et al. 2011). However, in this correlation result, we could not see significant responses from the subtropical high in the western Pacific, Coral Sea and southwest Pacific. Therefore, IOD favours the NWCB and AR occurrence in the Australian region, but it does not necessarily result in more ARs in the Asian summer monsoon region. Therefore, for the AR bifurcation analysis, we only see a weak IOD signal as in Table 2.
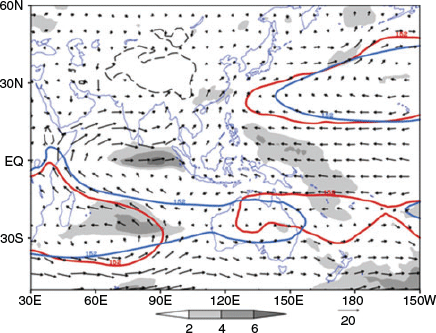
Finally, we conducted composite analysis of the 21 AR bifurcation cases for the 20-year period. Fig. 11 shows the averaged 850 hPa wind circulation anomalies for the 21 cases. The positions of the WPSH and subtropical highs in the southern hemisphere are represented as the 152 gpdm contour lines of 850 hPa geopotential height for these cases and against their climatological positions. Again, these results demonstrated that when AR bifurcation occurred in the A–A region, the WPSH extended much more westward. At the same time, we saw an enhanced and more westward extension of the subtropical high in the Coral Sea and southwest Pacific. To the west of the Australian continent, the south Indian Ocean subtropical high (Mascarenes High) retreated to the west, and there was an enhanced middle-latitude trough intrusion into the southwestern part of the Australian continent. All of these patterns are in a good agreement with the results from the case analysis, the analysis of connections between the WPSH and subtropical highs in the southern hemisphere and the analysis of ENSO delayed impacts on these subtropical highs. Such results further consolidate the process we have identified.
|
5 Conclusion and discussions
Results from Wu et al. (2020), a collaborative research project on AR analysis in the A–A region (Ye et al. 2020), showed that the peak time of the AR occurrence in the East Asian region was in its boreal summer, which was also the peak season of ARs occurring in the Australian region but it was their winter time. This has prompted us to investigate whether there are any potential connections between the AR activities in these two regions. In this study, we focused on analysing cases where ARs exist in both Asian and Australian regions at the same time. We call this ‘AR bifurcation’, as we have found that such patterns reflect the split of tropical moisture export towards the extratropics in two directions towards both hemispheres.
Firstly, we conducted a detailed synoptic analysis of a case study in 17–23 June 2016 when strong precipitation occurred in China and Australia that linked to an AR in each region. In this case study, we demonstrated that AR bifurcation can occur in the equatorial western Pacific region and in the tropical Indian Ocean, depending on the synoptic patterns dominating the region. During the first stage of the event, the WPSH was strong and extended more westward than its climatological position. In the meanwhile, the subtropical high in the southern hemisphere over the Coral Sea and southwest Pacific was strong too. Such a setup was favourable for tropical moisture being transported into the East Asia monsoon region through is the anticyclonic flow in the west flank of WPSH and lead to the formation of an AR within the southwesterly Asian monsoon flow. At the same time, the enhanced subtropical high on the Coral Sea region was met by a low-pressure system over the eastern part of the Australian continent. Their combined effect was a long and narrow band of moisture transport into the east coast of the Australian continent that formed an AR in this region. These two ARs represented the bifurcation of the AR in the western Pacific Ocean. During the second stage, associated with eastward movement of a tropical convection system in the maritime continent, the southwesterly monsoon flow from the Bay of Bengal was enhanced, and the WPSH retreated slightly eastward but maintained its strength. The combined effect of these two processes was that the AR that developed during the first stage was retained in the region. For the southern hemisphere, the low-pressure system in the Australian region moved out of the continent, and there was an enhanced subtropical high extending further westward toward the eastern part of the Australian continent. At the same time, a deep trough in its middle latitudes penetrated the southern part of the continent and interacted with the subtropical high in its east. This setup helped to form a northwest–southeast band of strong moisture transport in the western part of Australia. Consequently, during the second stage, the AR bifurcation appeared to occur in the Indian Ocean, where one AR formed northeastward into the Asian region and the other southeastward into the Australian region.
In the case analysis, we used the HYSPLIT model developed by NOAA (Draxler and Hess 1998) to do the backward trajectory analysis of the air mass forming the two ARs in China and Australia. Results showed that the eastern part of the Indian Ocean was an important moisture source for both ARs in East Asia and the western part of the Australian continent. It was also the region where AR bifurcation occurred, with one branch travelling northeastward towards East Asia and the other southeastward across the western part of the Australian continent.
Following the case study, we further conducted a survey of AR activities in the A–A region for 1998–2017. For the 20-year period, we identified 21 AR bifurcation cases in the region. Most of them occurred in June–July, and most of them occurred in the boreal summer following an El Niño event in its previous winter.
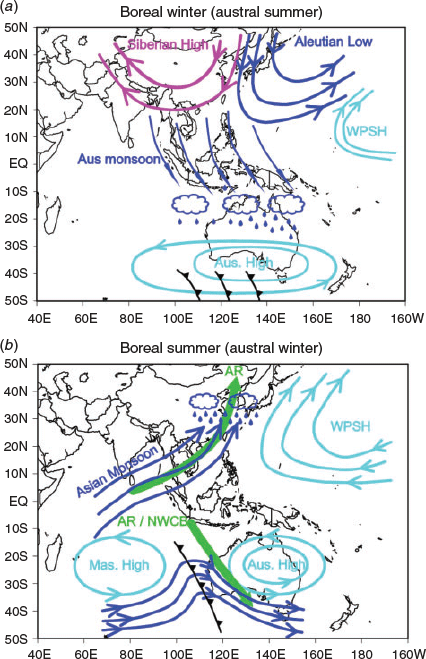
Based on the case study, we further studied the underlying reasons for such AR bifurcation. We found that the close connection between the WPSH and subtropical high in the Coral Sea and Australian continent was the key process leading to the AR bifurcations and the in-phase AR seasonal variations in the two regions. As illustrated by a schematic diagram in Fig. 12, in the boreal winter and austral summer, the WPSH is weak, located more eastward and at lower latitudes in the Pacific Ocean. The weather in East Asia is dominated by the Aleutian Low and Siberian High, and the prevailing northerly wind does not favour AR formation in the East Asian region. At the same time, tropical Australia is dominated by its summer monsoon and the subtropical high influencing the region is located further poleward, and the averaged ridge location is around 38–40°S. This is not favourable for the middle-latitude storm track and its weather systems reaching the Australian continent. With such a circulation pattern, it is difficult to form ARs within the Australian continent. In contrast, during the boreal summer, an enhanced WPSH is located more westward and moves more northward too. The WPSH position is critical for the formation of the East Asian summer monsoon and its moisture transport (Chen et al. 1991; Chang 2004; Wang 2006). At the same time, the subtropical high in the Australian region moves northward and the ridge of the high system retreats to around 30°S. Meanwhile, the storm track moves northward towards the continent. As a result, more middle-latitude weather systems can penetrate further into the southern part of the continent, interact with subtropical high system in its northeast and are favourable for the formation of a long and narrow band of moisture transport band over the continent. Such a mechanism not only explains why the ARs in the A–A region tend to peak in the same period but different seasons, but also helps to understand the AR bifurcations in the regions.
|
We then analysed a set of UK Met Office UM nudging experiments by relaxing the model horizontal wind and air temperature towards ERA-Interim reanalysis (with 6-hourly nudging) over a large WPSH domain. A strengthened WPSH in the model nudging experiment was accompanied by an enhanced subtropical high in the Australian region. Therefore, results from the nudging experiments supported the mechanism we proposed in this study by using the close connection between the two high systems in explaining the same peak period of ARs in both Australia and East Asia during the boreal summer (austral winter). In addition, the nudging experiment suggested the WPSH likely played a dominant role in shaping the atmospheric circulation in the Indo-Pacific region.
We investigated how ENSO produced a delayed influence on the AR bifurcation in the A–A region. Using simple partial correlation analysis, we demonstrated that ENSO-delayed impacts on the AR bifurcation in the region was due to its impacts on the WPSH and subtropical high in the southern hemisphere during the boreal summer period. Several previous studies (Wang and Wang 2000; Paek et al. 2016) showed that WPSH tends to be stronger in the boreal summer following an El Niño peaking in the previous winter. Our analysis showed that positive SST warning in the central-east Pacific (Niño 3.4) in the preceding winter is beneficial to the westward extension and strengthening of the two subtropical high-pressure systems in the northern and southern hemispheres. Under such a circulation pattern, the ARs in the A–A region are prone to bifurcation.
We must acknowledge that there are several significant weaknesses in this analysis. Firstly, we used the close connections between WPSH and subtropical high influencing the Australian region to explain why AR bifurcated in the A–A region and the peak period of the AR occurrence in the East Asian and Australian region is always in the boreal summertime. We used the UM nudging experiments to support our claims. However, due to limited model data availability for the AR analysis, we have not been able to directly analyse ARs in these model nudging experiments to examine the mechanism proposed in this study. In a future study, we plan to conduct more specific model experiments to address this issue. Secondly, as summarised by Frederiksen and Lin (2013) and Stan et al. (2017), there are many important factors that have a strong influence on tropical–extratropical weather and climate through its global teleconnections. Subtropical highs over the western Pacific and Australian regions could also be influenced by many other factors, such as the SAM (Hendon et al. 2007; Lim et al. 2016), Arctic Oscillation (Qin et al. 2017), the SSTs over tropical Atlantic or local areas (Wang et al. 2005; Chen et al. 2015) and the Indian Ocean (Xie et al. 2009; Huang et al. 2010; Kosaka et al. 2013). These were not considered in our analysis but need to be considered in our future studies. Furthermore, although the factors mentioned above may affect AR bifurcation events, the relationship between these factors is not clear and needs further research. Thirdly, our study only showed that ENSO and the subtropical highs provide suitable climatological backgrounds of bifurcated AR events, but there is still a lack of good understanding of what other factors are contributing to these events listed in our study. While our results suggested limited impacts from the MJO, we need to explore other important factors, as highlighted in Stan et al. (2017), which govern the tropical–extratropical teleconnections. Finally, due to a number of reasons, we were only able to conduct a detailed AR bifurcation survey for a 20-year period in this two-year project. Results would have been further strengthened if a longer period dataset was analysed. This will be further pursued in our future collaborations.
Conflicts of interest
The authors declare that they have no conflicts of interest.
Acknowledgements
This study is part of the collaborative project between the Australian Bureau of Meteorology (BoM) and China Meteorological Administrations (CMA) on atmospheric rivers. We acknowledge discussions with Dr Ruping Mo (Environment and Climate Change Canada), Drs Gill Martin and Penli Wu (UK Met Office) on this study. The authors thank the constructive comments from Dr Lixin Qi and Ms Jingjing Chen during the internal review process. Further comments from Dr Tony Hirst and two anonymous reviewers are fully acknowledged for helping us further improve the quality of this study. This research is supported by a BoM–CMA collaborative project (JWG–16 4.1), National Key R and D Program of China (2018YFC1507200) and Key Scientific Research Project of Hunan Meteorological Bureau (XQKJ16A001, XQKJ17D001).
References
American Meteorological Society (2019). Atmospheric River. In ‘Glossary of Meteorology’. Available at http://glossary.ametsoc.org/wiki/Atmospheric_river.Bao, J.-W., Michelson, S. A., Neiman, P. J., Ralph, F. M., and Wilczak, J. M. (2006). Interpretation of enhanced integrated water vapour bands associated with extratropical cyclones: Their formation and connection to tropical moisture. Mon. Wea. Rev. 134, 1063–1080.
| Interpretation of enhanced integrated water vapour bands associated with extratropical cyclones: Their formation and connection to tropical moisture.Crossref | GoogleScholarGoogle Scholar |
Brands, S., Gutiérrez, J. M., and San-Martín, D. (2017). Twentieth-century atmospheric river activity along the west coasts of Europe and North America: algorithm formulation, reanalysis uncertainty and links to atmospheric circulation patterns. Climate Dyn. 48, 2771–2795.
| Twentieth-century atmospheric river activity along the west coasts of Europe and North America: algorithm formulation, reanalysis uncertainty and links to atmospheric circulation patterns.Crossref | GoogleScholarGoogle Scholar |
Cai, W., Van Rensch, P., and Cowan, T. (2011). Influence of global-scale variability on the subtropical ridge over southeast Australia. J. Climate 24, 6035–6053.
| Influence of global-scale variability on the subtropical ridge over southeast Australia.Crossref | GoogleScholarGoogle Scholar |
Cai, W., Van Rensch, P., Cowan, T., and Hendon, H. H. (2012). An asymmetry in the IOD and ENSO teleconnection pathway and its impact on Australian climate. J. Climate 25, 6318–6329.
| An asymmetry in the IOD and ENSO teleconnection pathway and its impact on Australian climate.Crossref | GoogleScholarGoogle Scholar |
Cao, Y. C., and Zhang, T. (2016). Analysis of the June 2016 Atmospheric Circulation and Weather. Meteorol. Mon. 42, 1154–1160.
| Analysis of the June 2016 Atmospheric Circulation and Weather.Crossref | GoogleScholarGoogle Scholar |
Chang, C. P. (2004). East Asian Monsoon. (World Scientific Publishing: Singapore.) 564pp
Chen, J. L., and Huang, R. H. (2007). The Comparison of Climatological Characteristics among Asian and Australian Monsoon Subsystems. Part II: Water Vapour Transport by Summer Monsoon. Chin. J. Atmos. Sci. 31, 766–778.
| The Comparison of Climatological Characteristics among Asian and Australian Monsoon Subsystems. Part II: Water Vapour Transport by Summer Monsoon.Crossref | GoogleScholarGoogle Scholar |
Chen, W., and Guan, Z. Y. (2016). Impacts of the super El Niño event in 2015/16 on Australian summer monsoon circulation and precipitation anomalies. Trans. Atmos. Sci. 39, 801–812.
| Impacts of the super El Niño event in 2015/16 on Australian summer monsoon circulation and precipitation anomalies.Crossref | GoogleScholarGoogle Scholar |
Chen L. X., Zhu Q. G., and Luo H. B. (1991). East Asian Monsoon. (China Meteorological Press: Beijing.) 362pp. [In Chinese.]
Chen, W., Lee, J.-Y., Lu, R., Dong, B., and Ha, K.-J. (2015). Intensified impact of tropical Atlantic SST on the western North Pacific summer climate under a weakened Atlantic thermohaline circulation. Climate Dyn. 45, 2033–2046.
| Intensified impact of tropical Atlantic SST on the western North Pacific summer climate under a weakened Atlantic thermohaline circulation.Crossref | GoogleScholarGoogle Scholar |
Chen, J., Zhang, H., Ye, C., Chen, H., and Mo, R. (2020). Case studies of atmospheric rivers over China and Australia: new insight into their rainfall generation. J. South. Hemisph. Earth Syst. Sci. , .
| Case studies of atmospheric rivers over China and Australia: new insight into their rainfall generation.Crossref | GoogleScholarGoogle Scholar |
Dacre, H. F., Clark, P. A., Martinez-Alvarado, O., Stringer, M. A., and Lavers, D. A. (2015). How do atmospheric rivers form? Bull. Amer. Meteor. Soc. 96, 1243–1255.
| How do atmospheric rivers form?Crossref | GoogleScholarGoogle Scholar |
Dalvi, M. (2014) Nudging the Unified Model. Unified Model Documentation Paper 083. Met Office, United Kingdom. Available at https://www.ukca.ac.uk/images/1/16/Umdp_083_Nudging_um92.pdf
Dettinger, M. D. (2013). Atmospheric rivers as drought busters on the U.S. West Coast. J. Hydrometeor. 14, 1721–1732.
| Atmospheric rivers as drought busters on the U.S. West Coast.Crossref | GoogleScholarGoogle Scholar |
Ding, Y. (2004). Seasonal march of the East-Asian summer monsoon. In ‘East Asian Monsoon’. (Ed. C.-P. Chang.) pp. 3–53. (World Scientific Publishing: Singapore.)
Draxler, R. R., and Hess, G. D. (1998). An overview of the HYSPLIT_4 modeling system for trajectories, dispersion and deposition. Aust. Meteorol. Mag. 47, 295–308.
Drosdowsky, W. (2005). The latitude of the subtropical ridge over eastern Australia: the l index revisited. J. Climatol. 25, 1291–1299.
| The latitude of the subtropical ridge over eastern Australia: the l index revisited.Crossref | GoogleScholarGoogle Scholar |
Ebita, A., Kobayashi, S., Ota, Y., Moriya, M., Kumabe, R., and Onogi, K. (2011). The Japanese 55-year reanalysis “JRA-55”: an interim report. SOLA 7, 149–152.
| The Japanese 55-year reanalysis “JRA-55”: an interim report.Crossref | GoogleScholarGoogle Scholar |
Frederiksen, C. S., and Balgovind, R. C. (1994). The influence of the Indian Ocean/Indonesian SST gradient on the Australian winter rainfall and circulation in an atmospheric GCM. Quart. J. Roy. Meteor. Soc. 120, 923–952.
| The influence of the Indian Ocean/Indonesian SST gradient on the Australian winter rainfall and circulation in an atmospheric GCM.Crossref | GoogleScholarGoogle Scholar |
Frederiksen, C. S., and Frederiksen, J. S. (1996). A theoretical model of Australian Northwest Cloudband disturbances and Southern Hemisphere storm tracks: The role of SST anomalies. J. Atmos. Sci. 53, 1410–1432.
| A theoretical model of Australian Northwest Cloudband disturbances and Southern Hemisphere storm tracks: The role of SST anomalies.Crossref | GoogleScholarGoogle Scholar |
Frederiksen, J. S., and Frederiksen, C. S. (2007). Interdecadal changes in southern hemisphere winter storm track modes. Tellus A 59, 19.
| Interdecadal changes in southern hemisphere winter storm track modes.Crossref | GoogleScholarGoogle Scholar |
Frederiksen, J. S., and Lin, H. (2013). Tropical-Extratropical Interactions of Intraseasonal Oscillations. J. Atmos. Sci. 70, 3180–3197.
| Tropical-Extratropical Interactions of Intraseasonal Oscillations.Crossref | GoogleScholarGoogle Scholar |
Gao, Q., and Sun, Y. (2016). Changes in water vapour transport during the meiyu season after 2000 and their relationship with the Indian Ocean SST and Pacific-Japan pattern. Dynam. Atmos. Ocean 76, 141–153.
| Changes in water vapour transport during the meiyu season after 2000 and their relationship with the Indian Ocean SST and Pacific-Japan pattern.Crossref | GoogleScholarGoogle Scholar |
Gao, Y., Lu, J., and Leung, L. R. (2016). Uncertainties in projecting future changes in atmospheric rivers and their impacts on heavy precipitation over Europe. J. Climate 29, 1–38.
| Uncertainties in projecting future changes in atmospheric rivers and their impacts on heavy precipitation over Europe.Crossref | GoogleScholarGoogle Scholar |
Gimeno, L., Nieto, R., Vázquez, M., et al. (2014). Atmospheric rivers: a mini-review. Front. Earth Sci. 2, 1–6.
| Atmospheric rivers: a mini-review.Crossref | GoogleScholarGoogle Scholar |
Guan, B., and Waliser, D. E. (2015). Detection of atmospheric rivers: Evaluation and application of an algorithm for global studies. J. Geophys. Res. Atmos. 120, 12514–12535.
| Detection of atmospheric rivers: Evaluation and application of an algorithm for global studies.Crossref | GoogleScholarGoogle Scholar |
He, S. P. (2015). Potential connection between the Australian summer monsoon circulation and summer precipitation over central China. Atmos. Ocean. Sci. Lett. 8, 120–126.
| Potential connection between the Australian summer monsoon circulation and summer precipitation over central China.Crossref | GoogleScholarGoogle Scholar |
Hendon, H. H., Thompson, D. J., and Wheeler, M. C. (2007). Australian Rainfall and Surface Temperature Variations Associated with the Southern Hemisphere Annular Mode. J. Climate 20, 2452–2467.
| Australian Rainfall and Surface Temperature Variations Associated with the Southern Hemisphere Annular Mode.Crossref | GoogleScholarGoogle Scholar |
Hirota, N., Takayabu, Y. N., Kato, M., and Arakane, S. (2016). Roles of an atmospheric river and a cutoff low in the extreme precipitation event in Hiroshima on 19 August 2014. Mon. Wea. Rev. 144, 1145–1160.
| Roles of an atmospheric river and a cutoff low in the extreme precipitation event in Hiroshima on 19 August 2014.Crossref | GoogleScholarGoogle Scholar |
Huang, R. H., Zhang, Z. Z., Huang, G., and Ren, B. H. (1998). Characteristics of the Water Vapour Transport in East Asian Monsoon Region and its Difference from that in South Asian Monsoon Region in Summer. Chin. J. Atmos. Sci. 22, 460–469.
Huang, G., Hu, K. M., and Xie, S. P. (2010). Strengthening of tropical Indian Ocean teleconnection to the northwest Pacific since the mid–1970s: An atmospheric GCM study. J. Climate 23, 5294–5304.
| Strengthening of tropical Indian Ocean teleconnection to the northwest Pacific since the mid–1970s: An atmospheric GCM study.Crossref | GoogleScholarGoogle Scholar |
Kim, J., Waliser, D. E., Neiman, P. J., Guan, B., Ryoo, J. M., and Wick, G. A. (2013). Effects of atmospheric river landfalls on the cold season precipitation in California. Climate Dyn. 40, 465–474.
| Effects of atmospheric river landfalls on the cold season precipitation in California.Crossref | GoogleScholarGoogle Scholar |
Knippertz, P., and Wernli, H. (2010). A Lagrangian climatology of tropical moisture exports to the Northern Hemispheric extratropics. J. Climate 23, 987–1003.
| A Lagrangian climatology of tropical moisture exports to the Northern Hemispheric extratropics.Crossref | GoogleScholarGoogle Scholar |
Kosaka, Y., Xie, S. P., Lau, N. -C., et al. (2013). Origin of seasonal predictability for summer climate over the northwestern Pacific. Proc. Natl. Acad. Sci. U.S.A. 110, 7574–7579.
| Origin of seasonal predictability for summer climate over the northwestern Pacific.Crossref | GoogleScholarGoogle Scholar | 23610388PubMed |
Lavers, D., and Villarini, G. (2015). The contributions of atmospheric rivers to precipitation in Europe and the United States. J. Hydrol. 522, 382–390.
| The contributions of atmospheric rivers to precipitation in Europe and the United States.Crossref | GoogleScholarGoogle Scholar |
Li, J. P., and Zeng, Q. C. (2005). A New Monsoon Index-Its Interannual Variability and Relation with Monsoon Precipitation. Climatic and Environmental Research 31, 766–778.
| A New Monsoon Index-Its Interannual Variability and Relation with Monsoon Precipitation.Crossref | GoogleScholarGoogle Scholar |
Li, Y. Y., Yu, R. C., Fu, Y. F., and Ye, C. Z. (2009). A case study on the triggering of thermal convective precipitation. Acta Meteorol. Sin. 23, 455–467.
| A case study on the triggering of thermal convective precipitation.Crossref | GoogleScholarGoogle Scholar |
Lim, E.-P., Hendon, H. H., Arblaster, J. M., Chung, C., Moise, A. F., Hope, P., Young, G., and Zhao, M. (2016). Interaction of the recent 50 year SST trend and La Niña 2010: amplification of the Southern Annular Mode and Australian springtime rainfall. Climate Dyn. 47, 2273–2291.
| Interaction of the recent 50 year SST trend and La Niña 2010: amplification of the Southern Annular Mode and Australian springtime rainfall.Crossref | GoogleScholarGoogle Scholar |
Liu, Y. M., Wu, G. X., Liu, H., and Liu, P. (2001). Condensation heating of the Asian summer monsoon and the subtropical anticyclone in the eastern hemisphere. Climate Dyn. 17, 327–338.
| Condensation heating of the Asian summer monsoon and the subtropical anticyclone in the eastern hemisphere.Crossref | GoogleScholarGoogle Scholar |
Milton S. (2018). Seamless Tropical Evaluation in the UM. Global Modelling Science Workshop, Melbourne, 21–23 February 2018.
Nicholls, N., Drosdowsky, W., and Lavery, B. (2012). Australian rainfall variability and change. Weather 52, 66–72.
| Australian rainfall variability and change.Crossref | GoogleScholarGoogle Scholar |
Paek, H., Yu, J. Y., Zheng, F., and Lu, M. M. (2016). Impacts of ENSO diversity on the western pacific and north pacific subtropical highs during boreal summer. Climate Dyn. 52, 7153–7172.
| Impacts of ENSO diversity on the western pacific and north pacific subtropical highs during boreal summer.Crossref | GoogleScholarGoogle Scholar |
Pittock A. B. (1971). Rainfall and the general circulation. In ‘International Conference in Weather Modification’, Canberra, 6–11 September 1971. pp. 330–338. American Meteorological Society.
Qin, Z. J., Hou, S. G., Wang, Y. T., and Pang, H. X. (2017). Spatio-temporal variability of winter snow cover over the Tibetan Plateau and its relation to Arctic Oscillation. Geograph. Res. 36, 743–754.
| Spatio-temporal variability of winter snow cover over the Tibetan Plateau and its relation to Arctic Oscillation.Crossref | GoogleScholarGoogle Scholar |
Raghavan K., Sabin T. P., Mujumdar M., and Priya, P. (2012). Extreme monsoon precipitation events over South Asia in a warming world. Egu General Assembly Conference. EGU General Assembly Conference Abstracts.
Rayner, N. A., Parker, D. E., Horton, E. B., Folland, C. K., Alexander, L. V., Rowell, D. P., Kent, E. C., and Kaplan, A. (2003). Global analyses of sea surface temperature, sea ice, and night marine air temperature since the late nineteenth century. J. Geophys. Res. 108, 4407.
| Global analyses of sea surface temperature, sea ice, and night marine air temperature since the late nineteenth century.Crossref | GoogleScholarGoogle Scholar |
Risbey, J. S., Pook, M. J., and McIntosh, P. C. (2013). Spatial trends in synoptic rainfall in southern Australia. Geophys. Res. Lett. 40, 3781–3785.
| Spatial trends in synoptic rainfall in southern Australia.Crossref | GoogleScholarGoogle Scholar |
Rivera, E. R., Dominguez, F., and Castro, C. L. (2014). Atmospheric rivers and cool season extreme precipitation events in the Verde river basin of Arizona. J. Hydrometeor. 15, 813–829.
| Atmospheric rivers and cool season extreme precipitation events in the Verde river basin of Arizona.Crossref | GoogleScholarGoogle Scholar |
Rutz, J. J., Steenburgh, W. J., and Ralph, F. M. (2014). Climatological characteristics of atmospheric rivers and their inland penetration over the western United States. Mon. Wea. Rev. 142, 905–921.
| Climatological characteristics of atmospheric rivers and their inland penetration over the western United States.Crossref | GoogleScholarGoogle Scholar |
Saha, S., Moorthi, S., Pan, H. L., et al. (2014). The NCEP climate forecast system versions 2 reanalysis. J. Climate 27, 2186–2208.
| The NCEP climate forecast system versions 2 reanalysis.Crossref | GoogleScholarGoogle Scholar |
Simmons, I., Bi, D. H., and Hope, P. (1999). Atmospheric Water Vapour Flux and its Association with Rainfall over China in Summer. J. Climate 12, 1353–1367.
| Atmospheric Water Vapour Flux and its Association with Rainfall over China in Summer.Crossref | GoogleScholarGoogle Scholar |
Stan, C., Straus, D. M., Frederiksen, J. S., Lin, H., Maloney, E. D., and Schumacher, C. (2017). Review of Tropical-Extratropical Teleconnections on Intraseasonal Time Scales. Rev. Geophys. 55, 902–937.
| Review of Tropical-Extratropical Teleconnections on Intraseasonal Time Scales.Crossref | GoogleScholarGoogle Scholar |
Sui, C. H., Chung, P. H., and Li, T. (2007). Interannual and interdecadal variability of the summertime western north pacific subtropical high. Geophys. Res. Lett. 34, L11701.
| Interannual and interdecadal variability of the summertime western north pacific subtropical high.Crossref | GoogleScholarGoogle Scholar |
Sun, Y. S., Wang, Y. Q., Shen, X. Y., Zhou, Y. S., and Deng, G. (2018). Diagnostic analysis on a heavy rainfall associated with the Northeast cold vortex and atmospheric river. Plateau Meteorol. 37, 970–980.
| Diagnostic analysis on a heavy rainfall associated with the Northeast cold vortex and atmospheric river.Crossref | GoogleScholarGoogle Scholar |
Tapp, R. G., and Barrell, S. L. (1984). The north-west Australian cloud band: climatology, characteristics and factors associated with development. J. Climatol. 4, 411–424.
| The north-west Australian cloud band: climatology, characteristics and factors associated with development.Crossref | GoogleScholarGoogle Scholar |
Telcik, N., and Pattiaratchi, C. (2014). Influence of Northwest Cloudbands on Southwest Australian Rainfall. J. Climate 2014, 1–11.
| Influence of Northwest Cloudbands on Southwest Australian Rainfall.Crossref | GoogleScholarGoogle Scholar |
Timbal, B., and Drosdowsky, W. (2013). The relationship between the decline of southeastern Australian rainfall and the strengthening of the subtropical ridge. J. Climatol. 33, 1021–1034.
| The relationship between the decline of southeastern Australian rainfall and the strengthening of the subtropical ridge.Crossref | GoogleScholarGoogle Scholar |
Ummenhofer, C. C., Sen, G. A., Briggs, P. R., England, M. H., Mcintosh, P. C., Meyers, G. A., Michael, P., Michael, R. R., and James, S. R. (2011). Indian and Pacific Ocean influences on southeast Australian drought and soil moisture. J Climate 24, 1313–1336.
| Indian and Pacific Ocean influences on southeast Australian drought and soil moisture.Crossref | GoogleScholarGoogle Scholar |
Wang, B. (2006). The Asian monsoon. (Praxis Publishing: Chichester.) 787pp.
Wang, R., and Wang, B. (2000). Phase space representation and characteristics of El Niño–La Niña. J. Atmos. Sci. 57, 3315–3333.
| Phase space representation and characteristics of El Niño–La Niña.Crossref | GoogleScholarGoogle Scholar |
Wang, B., Jiao, Z.-H., and Chao, J. (2005). The relationship between the surface temperature on tropical seas and the western end of the ridge of the subtropical high of Atlantic. Journal of Yunnan University: Natural Sciences Edition 27, 332–336,342.
Wang, B., Xiang, B., and Lee, J. Y. (2013). Subtropical high predictability establishes a promising way for monsoon and tropical storm predictions. Proc. Natl. Acad. Sci. U.S.A. 110, 2718–2722.
| Subtropical high predictability establishes a promising way for monsoon and tropical storm predictions.Crossref | GoogleScholarGoogle Scholar | 23341624PubMed |
Warner, M. D., Mass, C. F., and Salathé, E. P. (2015). Changes in winter atmospheric rivers along the North American west coast in CMIP5 climate models. J. Hydrometeor. 16, 118–128.
| Changes in winter atmospheric rivers along the North American west coast in CMIP5 climate models.Crossref | GoogleScholarGoogle Scholar |
Williams, A. A. J., and Stone, R. C. (2009). An assessment of relationships between the Australian subtropical ridge, rainfall variability, and high-latitude circulation patterns. Int. J. Climatol. 29, 691–709.
| An assessment of relationships between the Australian subtropical ridge, rainfall variability, and high-latitude circulation patterns.Crossref | GoogleScholarGoogle Scholar |
Wright, W. J. (1997). Tropical-extratropical cloudbands and Australian rainfall: I. Climatology. J. Climatol. 17, 807–829.
| Tropical-extratropical cloudbands and Australian rainfall: I. Climatology.Crossref | GoogleScholarGoogle Scholar |
Wu, X., Ye, C., He, W., Chen, J., Xu, L., and Zhang, H. (2020). Atmospheric rivers impacting mainland China and Australia: climatology and interannual variations. J. South. Hemisph. Earth Syst. Sci. , .
| Atmospheric rivers impacting mainland China and Australia: climatology and interannual variations.Crossref | GoogleScholarGoogle Scholar |
Xie, P., Yatagai, A., Chen, M., Hayasaka, T., Fukushima, Y, Liu, C., and Yang, S. (2007). A gauge-based analysis of daily precipitation over East Asia. J. Hydrometeor. 8, 607–626.
| A gauge-based analysis of daily precipitation over East Asia.Crossref | GoogleScholarGoogle Scholar |
Xie, S. P., Hu, K. M., Hafner, J., Tokinaga, H., Du, Y., Huang, G., and Takeaki, S. (2009). Indian Ocean capacitor effect on Indo-Western Pacific climate during the summer following El Niño. J. Climate 22, 730–747.
| Indian Ocean capacitor effect on Indo-Western Pacific climate during the summer following El Niño.Crossref | GoogleScholarGoogle Scholar |
Yang, Y., Zhao, T., Ni, G., and Sun, T. (2017). Atmospheric rivers over the Bay of Bengal lead to northern Indian extreme rainfall. Int. J. Climatol. 38, 1010–1021.
| Atmospheric rivers over the Bay of Bengal lead to northern Indian extreme rainfall.Crossref | GoogleScholarGoogle Scholar |
Yang, R., Wang, J., Zhang, T., and He, S. (2019). Change in the relationship between the Australian summer monsoon circulation and boreal summer precipitation over central china in the late 1990s. Meteorol. Atmos. Phys. 131, 105–113.
| Change in the relationship between the Australian summer monsoon circulation and boreal summer precipitation over central china in the late 1990s.Crossref | GoogleScholarGoogle Scholar |
Ye, C. Z., Zhang, H. Q., Moise, A., and Mo, R. P. (2020). Atmospheric Rivers in the Australia-Asian Region: A BoM-CMA Collaborative Study. J. South. Hemisph. Earth Syst. Sci. , .
| Atmospheric Rivers in the Australia-Asian Region: A BoM-CMA Collaborative Study.Crossref | GoogleScholarGoogle Scholar |
Yue, J., and Li, G. P. (2015). Diagnostic Analysis of the impact of atmospheric river in a persistent heavy rainfall in Sichuan Basin. Journal of Chengdu University of Information Technology 30, 72–80.
| Diagnostic Analysis of the impact of atmospheric river in a persistent heavy rainfall in Sichuan Basin.Crossref | GoogleScholarGoogle Scholar |
Yue, J., and Li, G. P. (2016). Study on the moisture source of rainstorms in Sichuan basin by the Lagrangian method. J. Trop. Meteorol. 32, 256–264.
Zhang, H. (2010). Diagnosing Australia-Asian monsoon onset/retreat using large-scale wind and moisture indices. Climate Dyn. 35, 601–618.
| Diagnosing Australia-Asian monsoon onset/retreat using large-scale wind and moisture indices.Crossref | GoogleScholarGoogle Scholar |
Zhang, C., and Zhang, H. (2010). Potential impacts of East Asian winter monsoon on climate variability and predictability in the Australian summer monsoon region. Theor. Appl. Climatol. 101, 161–177.
| Potential impacts of East Asian winter monsoon on climate variability and predictability in the Australian summer monsoon region.Crossref | GoogleScholarGoogle Scholar |
Zhang H., and Moise A. (2017). The Australian Summer Monsoon in Current and Future Climate. In ‘The Monsoons and Climate Change’. (Eds L. de Carvalho, C. Jones) pp. 67–120. (Springer International Publishing: Cham)
Zhang, H., Wen, Z., Wu, R., Chen, Z., and Guo, Y. (2017). Inter-decadal changes in the East Asian summer monsoon and associations with sea surface temperature anomaly in the South Indian Ocean. Climate Dyn. 48, 1125–1139.
| Inter-decadal changes in the East Asian summer monsoon and associations with sea surface temperature anomaly in the South Indian Ocean.Crossref | GoogleScholarGoogle Scholar |
Zheng, B., Chen, Y., and Li, C. Z. (2016). Characteristic of precursor environment of mesoscale convective system during summer in central-eastern China. Plateau Meteorol. 35, 460–468.
| Characteristic of precursor environment of mesoscale convective system during summer in central-eastern China.Crossref | GoogleScholarGoogle Scholar |
Zhou, T. J., and Yu, R. C. (2005). Atmospheric water vapour transport associated with typical anomalous summer rainfall patterns in China. J. Geophys. Res. Atmos. 110, 1–10.
| Atmospheric water vapour transport associated with typical anomalous summer rainfall patterns in China.Crossref | GoogleScholarGoogle Scholar |
Zhu, Y., and Newell, R. (1998). A proposed algorithm for moisture fluxes from atmospheric rivers. Mon. Wea. Rev. 126, 725–735.
| A proposed algorithm for moisture fluxes from atmospheric rivers.Crossref | GoogleScholarGoogle Scholar |