

Same with less: a method to reduce destructive sampling to estimate nitrogen use efficiency components using allometric relationships in spring wheat (Triticum aestivum)
Lorena Guardia-Velarde A * , Jonathan E. Cope A , Holger Metzler B , Anna Westerbergh C and Martin Weih A
A
B
C
Abstract
Enhancing nitrogen (N) use efficiency is important for a sustainable food production. Measuring shoot biomass and N pool across growth stages is critical to calculate N use efficiency, but relies on slow, costly and destructive sampling. This paper presents a non-destructive allometric approach developed for cereals; in this study, we assessed wheat (Triticum aestivum) for crop shoot biomass and N pool. Our methodology considered tiller height and number, and the estimates of leaf chlorophyll content (SPAD) as non-destructive measures to predict shoot biomass and N pool by using a multiple linear and a non-linear regression (R2 = 0.71 and R2 = 0.89, respectively) on the data from 72 samples of 16 recombinant inbred spring wheat lines (RILs) field-grown in central Sweden during 2 years with contrasting weather. Model parameters are estimated separately for different years to accommodate environmental variations between them. The regressions obtained were applied to estimate critical N use efficiency traits of 80 randomly selected wheat lines from the same RIL population. The method developed here provides a promising novel tool for the cost-effective estimation of critical N use efficiency parameters in cereals, with reduced destructive sampling, and a first step toward automated phenotyping for rapid N use efficiency assessment in cereal breeding populations.
Keywords: allometry, crop modelling, grain nitrogen concentration, nitrogen accumulation efficiency, plant height, shoot biomass, SPAD, wheat.
Introduction
Plants develop allometric patterns reflecting adaptations to selection pressures and constraints (Müller et al. 2000). Thus, allometric analyses have been applied to study plant architecture and size-dependencies of many processes (Niklas 1994; Gould 1966), including size-dependencies in resource allocation and reproductive allocation (Samson and Werk 1986; Schmid et al. 1994). In general, an allometric approach can be described as a specific result derived from scaling measurements of relative sizes in plant and animal structures or processes (Sadras and Egli 2008); it outlines the relative growth of a structure compared to other structures as a whole (Bakhshandeh et al. 2012). Allometry has also been used to analyse the relationship between reproductive and vegetative biomass, which has been suggested to have a genetic basis (Du et al. 2020). Similarly, Shipley and Meziane (2002) used allometry to test ecological models of plant growth based on the ideas by Müller et al. (2000), specifically examining the relationship between biomass allocation to different resource capturing structures such as roots and leaves, and fitting them to allometric equations. It has been known for a long time that structure development frequently follows a well-defined allometric route, where plants create allometric patterns to face different selection pressures (Weiner 2004; Lemaire et al. 2019), such as the relationship between plant height or stem diameter and shoot biomass (Sileshi et al. 2023). Consequently, a quantitative positive correlation is often found between plant growth measures and allocation to different plant parts (West et al. 1997; Enquist et al. 1999; Weiner 2004; Luo et al. 2020). Whilst allometric equations are most commonly used in forestry as a tool to estimate tree volume or biomass from forest inventory data (e.g. tree diameter and height), the application of allometric equations is rarely used in agriculture. Plant height is a key factor in allometric approaches for crop plants such as wheat (Triticum aestivum), as it plays a crucial role for both producers and breeders in cultivar development (Bakhshandeh et al. 2012). From a modelling perspective, plant height can be used to estimate canopy conductance and the attenuation of radiation fluxes. Additionally, the relationship between stem mass and height helps land managers determine how much standing biomass can be removed while still maintaining protection against erosion. These applications highlight the significance of plant height in relation to a plant’s vegetative structures. Bakhshandeh et al. (2012) focused on developing relationships between plant height, leaf number, and stem biomass in seven wheat cultivars field-grown under rainfed and irrigated conditions for a single growing season in Iran. Whilst the investigation by Bakhshandeh et al. (2012) demonstrates the successful application of an allometric approach for predicting shoot biomass from simple plant height measurements in wheat, it is limited by the low number of varieties and environments (one growing season) considered, and the lack of including any N-related traits that are relevant for the assessment of N use efficiency.
Monitoring crop biomass and yield usually requires frequent destructive sampling, which is unsuitable for high-throughput phenotyping due to the large sampling populations, labour requirements, and methodological challenges (one plant or plant part cannot be sampled twice). Including important growth and yield drivers, such as plant nutrients, involves additional plant sampling and chemical analysis, with associated labour and costs. Methodological approaches, which reduce destructive sampling, and are amendable to high-throughput phenotyping, are therefore highly desired (Zhao et al. 2016; Lemaire et al. 2019; Yang et al. 2022). Hence, feasible allometric approaches can have an impact on agronomic research in plant production systems as they can be used to non-destructively estimate yield components and biomass production (Weiner 2004; Qin et al. 2013). In addition, since breeding programs require extensive populations (Bernardo 2004), the estimation of crop biomass and nitrogen (N) contents without any destructive sampling is essential for evaluating plant development (Zhao et al. 2016).
As N is often growth-limiting in crops (Gastal and Lemaire 2002), it is a key element in the evaluation of nutrient use efficiency. The development of plant N pools (plant biomass multiplied by plant N content) and N accumulation (net increase in N content) over time are central aspects in various nutrient use efficiency quantification approaches, such as that conceived by Weih et al. (2011a). This approach includes three components regarding N use efficiency, which are related to initial seed N content, the efficiency of transforming plant N to harvested grain biomass, and N re-translocation to harvested grain. In agriculture, N is usually provided to the crop in large quantities through fertilizers and in combination with other nutrients to guarantee high grain yields. Furthermore, N use efficiency has become a relevant parameter in the estimation and development of sustainability in food production. Therefore, improving the capacity of crop plants to gain, uptake, distribute, and metabolise N is the most favourable alternative to produce sustainable crops and cropping systems with enhanced efficiency in the use of N (Gastal and Lemaire 2002; Weih et al. 2018). Moreover, improved N use efficiency is expected to enhance crop production and reduce environmental pollution caused by N losses (Gaju et al. 2011; Zhao et al. 2016; Ravier et al. 2017). It is therefore desirable to develop methods to estimate plant-internal N accumulation reducing the destructive plant sampling and chemical N analysis. Chlorophyll meters (such as SPAD meters) are popular tools to non-destructively assess the relative chlorophyll and, indirectly, N content in plant leaves (Peltonen et al. 1995; Le Bail et al. 2005; Asplund et al. 2016). Regression models and correlation analyses are mostly used to establish statistical relationships between dependent and independent variables in crop agricultural systems (Park et al. 2005; York 2019). However, there are currently no models or methods available that link the plant height–plant biomass allometry with both the leaf N concentration (assessed non-destructively with the use of chlorophyll meters) and the plant N pool. Linking plant height, plant biomass, and plant N pool based on predictable allometric relationships will enable the assessment of important aspects of N use efficiency. This relationship is explored in this study through the N accumulation efficiency concept (Weih et al. 2018) by using non-destructive methods.
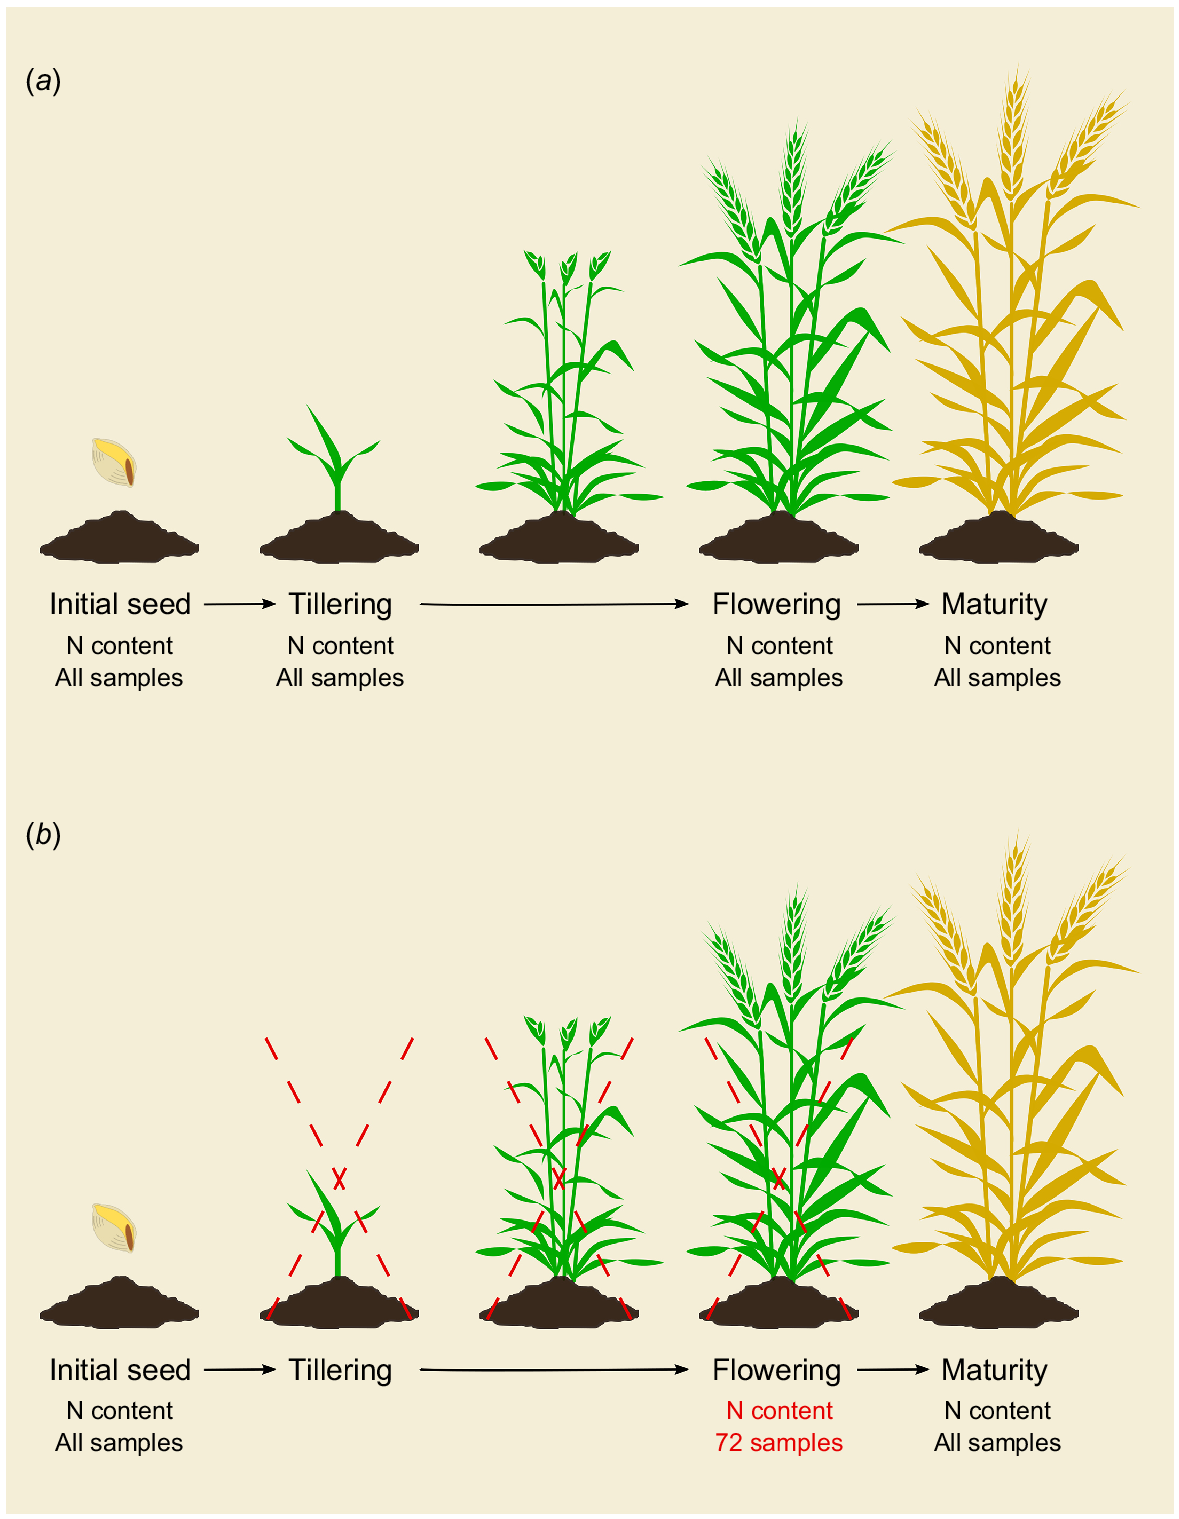
This study aimed to develop a simple methodology, based on spring wheat, that uses specific allometric associations to reduce the amount of destructive plant sampling in studies requiring data on plant biomass and N content, such as investigations on crop N use efficiency. Specifically, we aimed to estimate: (1) plant biomass from measurements that can be performed non-destructively (plant height and number of tillers); and (2) plant N pools from non-destructive chlorophyll meter measurements coupled with the plant biomass estimates. The methodology can then be used to non-destructively assess crucial aspects of N use efficiency using the concept of N accumulation efficiency (Weih et al. 2018) (Fig. 1). We hypothesised that the stem height at the flowering stage and the number of tillers are good predictors of aboveground biomass (H1), and that relative leaf chlorophyll amount during flowering, combined with the corresponding biomass, is a good predictor of plant N pool (H2). To test these hypotheses, we assessed a large number of spring wheat lines grown in two field experiments over 2 years.
Illustration of the estimation of N accumulation efficiency (NAE) and its components. (a) NAE calculation based on destructive sampling in four developmental stages suggested by Weih et al. (2018). (b) Presents what has been done in this study. Initial seed and maturity analysis required destructive sampling for 80 lines (four repetitions). At tillering, no samples were taken, and at anthesis, 72 destructive samples were harvested for calibrating the equations for an allometric approach based on non-destructive sampling.
Materials and methods
Conceptual approach
The detailed assessment of N use efficiency, according to the N accumulation efficiency (NAE) concept (Weih et al. 2018), requires the estimation of plant N pools in various developmental stages of the crop. It is desirable to reduce the number of destructive samplings and maintaine accuracy of the NAE component estimations. The attempt here was to calculate the shoot (tiller) biomass and N pools at anthesis, which are needed for estimating the NAE components, by identifying the allometric relationships between some non-destructively assessable traits (tiller number, height, and leaf chlorophyll content) and the biomass and N pools that normally are assessed after destructive sampling. To establish the allometric relationships, 72 destructive samples from 14 semi-randomly selected wheat (Triticum aestivum L.) lines and the parental lines of the total recombinant inbred spring wheat lines (RIL) population of 183 wheat lines were collected to determine shoot biomass and shoot N contents at anthesis. These samples consisted of three tillers per plant for 14 lines (42 samples) and the two parental lines (one plant per block; 30 samples). In addition to the destructive assessments, three non-destructive assessments were performed on the same material: (1) shoot (tiller) height; (2) number of tillers; and (3) leaf chlorophyll content. These three non-destructively assessable traits were also measured (at anthesis) in all lines of the RIL population for 2 years. Once the data from the destructively and non-destructively assessed traits were collected, both a linear and a non-linear regression model using height and tiller number per plant were developed to predict the shoot biomass using the most suitable model. In order to allow for the accommodation of year-to-year variability in environmental conditions (e.g. weather), model parameters were allowed to be estimated separately for each year. A second set of linear and non-linear regressions was then performed using leaf chlorophyll values and the shoot biomass estimates obtained from the previous regression to predict the shoot N pool at anthesis. The two regressions were applied to all the lines in the RIL population. Thus, the allometric equations were used only for the prediction of shoot biomass and N pools at anthesis. For the corresponding data at the initial seed and maturity stages (needed to calculate NAE components), the calculations were made based on the destructive sampling of a subset of 80 lines that were randomly selected out of the 183 RIL in total.
Study location
Field trials were carried out in Uppsala, Sweden (59°45′N, 17°42′E) during May–September in 2022 and during June–September in 2023. The two trials were carried out at different sites at the same experimental farm and the soils had a silty clay texture (44–48% clay, 45–51% silt, <4–5% sand), with a pH of 6.5, an organic matter content of 2.6–3.4% in the top 0.3 m layer and a total N content of 2.3 g kg−1 in the same layer. A commercial nutrient fertiliser was used after sowing in 2022 and before sowing in 2023, containing 500 kg ha−1 and 540 kg ha−1 NPK 24-4-5 (2022 and 2023, respectively).
Plant material and experimental design
In 2022, the field trial consisted of a population of 183 spring wheat RILs, and 179 of the same RILs in 2023. The RILs were developed from a cross between the commercial cultivars ‘Happy’ and ‘Boett’. F2 plants were advanced to the F6 generation by the single-seed descent procedure so that one seed from each plant was used to produce the next offspring generation (Acquaah 2009). In addition to the RILs, plants of the F1 hybrid and the two parental cultivars were included in the trial. The field experiment consisted of a randomised split-plot design with five blocks. In 2022, each block contained 60 micro-plots (0.62 m × 0.75 m) with six linear arrays, the centre four were used for the RILs and Boett was used as border plants along the two sides. Each line had 45 seeds per repetition in a plot (550 seeds per m2) and, depending on the seed quantity of each line, 3–5 repetitions were distributed across the blocks. All the lines were sown on the 10 May 2022. The field trial in 2023 held 179 lines (including both parents and F1) arranged in a split-plot design with five blocks, each consisting of 200 plots (0.62 m × 0.75 m) with six linear arrays. Each plot was sown with separate lines, at a rate of 550 seeds per m2 on 30 May 2023.
Non-destructive and destructive analysis
In the field, at the anthesis stage, height was measured from ground level to the tip of the spike on the main tiller using measuring tape, recording three plants per replication. The chlorophyll content of the second leaf of the main tiller was assessed at the same stage on the same three plants, using a SPAD meter (SPAD-502, Konica Minolta Sensing Inc., Japan) to take the mean of three measurements in the middle of the leaves for three plants per replication. Additionally, 72 destructive samples were harvested from 14 semi-randomly selected wheat lines and the parental lines from a total population of 183 wheat lines to determine shoot biomass and shoot nitrogen content at anthesis. These 14 lines were chosen from the 183 lines in total based on the criteria that they had five replicates across the blocks, and that they represented the height variability range in the population. The samples were three tillers (a tall, medium and short tiller to capture height variation) per plant for the 14 lines, in total 42 samples. For each parental line, we collected three tillers per plant from five plants (one per block), totalling 30 samples per year. Non-destructive traits, such as shoot height, number of tillers, and SPAD, were measured in all lines of the population over 2 years at anthesis. All measurements were done within a period of 5 days.
Destructive sampling of shoots for measuring straw and grain biomass was done at full maturity for all the 183 (2022) and 179 (2023) lines (where all plots were sampled), cutting at ground level five plants in the centre of each plot. Samples were dried at 70°C for 48 h in a drying oven and then weighed. The spikes were threshed, and the grains were weighed. Eighty RILs (including both parental lines and F1) were randomly selected to determine total N content using a LECO CNS72000 analyser (standard method SS-ISO13878). The N content was also analysed in the initial seeds of 80 selected lines, the 72 shoot samples, and the 80 lines (four replicates) at the maturity stage (Fig. 1).
Nitrogen accumumation efficiency (NAE) calculations
NAE and related components were calculated based on the N pool of the five sampled plants per plot according to the method by Weih et al. (2018). The NAE (g g−1) is determined by multiplying three components:
where UN (g g−1) is the mean N uptake efficiency, which is calculated as the ratio of the mean N amount during the entire plant growth period (N’) and the N amount in the initial seed; EN,g (g g−1) is the grain-specific N efficiency, which is calculated by dividing the grain yield by N’; and CN,g (g g−1) is the grain N concentration at the final harvest, which is calculated by dividing the N content of produced grain by grain biomass at harvest.
In our study, two out of three N accumulation efficiency components (UN and EN) require estimates of the plant N pools during different stages of the entire growth period. To estimate it, the shoot N pool per growth stage is required (Eqn 7 was applied at the flowering stage). In Weih et al. (2018), four growth stages were considered to represent the entire growth season: (1) initial seed; (2) tillering: (3) flowering; and (4) maturity. In this study, due to the restricted amount of seeds available for the RILs, we did not consider taking destructive samples during the tillering stage. We used an allometric approach to predict shoot biomass and N pool with only 72 destructive samples for the model development, and harvested 80 lines at the maturity stage to calculate the NAE components. Taken together, the NAE components were calculated by applying Eqn 1 for 80 lines that had complete values (i.e. destructive and non-destructive samples from all sampling stages in Fig. 1) for the three components.
Allometric models and statistical analysis
We contrasted a linear, two multiple linear, and a non-linear regression model with up to three parameters to determine the most suitable equation for shoot biomass prediction from plant height and tiller number. For the prediction of shoot N pool from SPAD measurements, we compared a multiple linear and non-linear regression analysis with up to three parameters, using the 72 destructive samples to build and calibrate the model equation. Each parameter used in the suggested regression equations was estimated separately for each year to account for environmental (e.g. weather) variations between the years, ensuring that the models remained receptive to environmental changes. This possibility for annual (or seasonal) recalibration makes the suggested equations adaptive regression models, capable of adjusting to different growing conditions. By incorporating this adaptability, the models can be applied more broadly across different climate and weather scenarios, improving their robustness and predictive accuracy in different field conditions.
After applying the suggested equation to estimate shoot biomass to the complete population, the shoot biomass estimates and the observed SPAD values were used to predict the shoot N pool at anthesis. Finally, as validation of the generated data from the equations, a linear regression between the predicted and observed values was performed to calculate the coefficient of determination (R2) and residual sum of squares (RSS).
The NAE values were calculated for 80 lines (out of 183 in total) using the observed initial seed N contents and plant N contents at crop maturity, together with the predicted plant N contents at flowering.
Additionally, NAE components were estimated only using the initial seed N pool (observed) and shoot N pool at anthesis (estimated) to test if omitting destructive sampling at maturity will produce reliable predictions; while considering only the major growth period ending at anthesis (instead of the entire growth period ending at maturity), as suggested by Weih et al. (2011a).
All statistical analyses were performed using SPSS ver. 29. ANOVA were used for the estimation of the probabilities of significant differences between lines and between the 2 years in the three traits used for allometry, using fixed effects of year, line, and block including the interaction between year and line. Non-linear and linear model regressions were used to suggest a suitable equation and parameters for the allometry relationships and for its confirmation and representation, respectively.
Results
Prediction of shoot biomass by plant height and number of tillers at anthesis
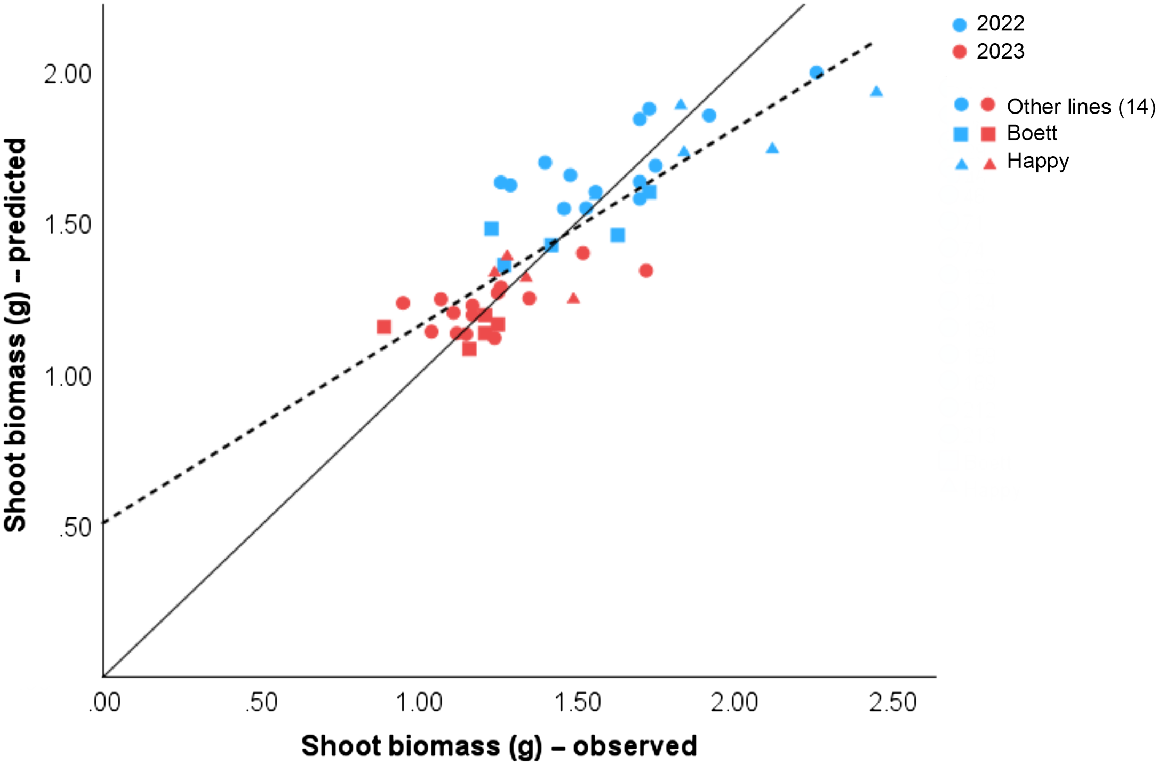
To calibrate the model, non-destructive measurements of stem height and tiller number from 72 samples during 2 years were used together with the corresponding destructive samples of shoot biomass. A linear regression model, two multiple linear regression models, and a non-linear regression model were calculated and compared to determine the most suitable equation for shoot biomass prediction (Table 1). In the first attempt, the linear model included only plant height as a constant parameter (R2 = 0.701, RSS = 1.551). To include the number of tillers per plant, a multiple linear model was needed. The multiple linear model showed a significant difference in the regression regarding depending and independent variables (P < 0.001), a higher predictive value (R2 = 0.723), and a smaller residual sum of squares = 1.438. After that, a non-linear regression was performed (R2 = 0.731, RSS = 1.394). The three models produced similar outcomes. However, the linear and the multiple linear models generated negative constants (Table 1), which is not favourable when missing data or small data values are to be expected. In the case of the non-linear regression, missing data can also present a difficulty to the analysis. A fourth regression was performed using a multiple linear model (as Eqn 3), fixing the constant value to zero (a = 0) in order to avoid subtraction, this model showed a significant difference between dependent and independent traits (P < 0.001), an R2 of 0.705, and an RSS of 1.553 (Eqn 5). The latter model (Eqn 5), which is a special case of Eqn 3, was chosen as it brought more flexibility for the analysis of our data as it can manage small data and did not show negative constants. The model parameters for the regressions were calculated separately for the 2 years (Table 1) and thereby accommodated the great variation between the 2 years. Additionally, a linear regression from the predicted biomass mean by Eqn 5 and the shoot biomass mean from the observed data were plotted to visualise the accuracy of our model (Fig. 2).
| Model equation | Regression model | Year | Parameter | Parameter value | s.e. | R2 | RSS | F-value | P-value | |
|---|---|---|---|---|---|---|---|---|---|---|
| Linear regression – Eqn 2 | Linear regression | 2022 | a | −0.535 | 0.452 | 0.519 | 1.066 | |||
| b | 0.32 | 0.007 | ||||||||
| 2023 | a | −0.203 | 0.435 | 0.331 | 0.485 | |||||
| b | 0.22 | 0.007 | ||||||||
| Linear regression | 2022 and 2023 | 0.701 | 1.551 | 107.838 | <0.001 | |||||
| Multiple linear regression – Eqn 3 | Multiple linear regression | 2022 | a | −0.699 | 0.45 | 0.569 | 0.954 | |||
| b | 0.031 | 0.006 | ||||||||
| c | 0.043 | 0.028 | ||||||||
| 2023 | a | −0.212 | 0.447 | 0.332 | 0.484 | |||||
| b | 0.021 | 0.007 | ||||||||
| c | 0.004 | 0.19 | ||||||||
| Linear regression | 2022 and 2023 | 0.723 | 1.438 | 119.859 | <0.001 | |||||
| Non-linear regression – Eqn 4 | Non-linear regression | 2022 | a | 0.005 | 0.005 | 0.588 | 0.914 | |||
| b | 1.323 | 0.259 | ||||||||
| c | 0.136 | 0.078 | ||||||||
| 2023 | a | 0.009 | 0.013 | 0.338 | 0.48 | |||||
| b | 1.161 | 0.362 | ||||||||
| c | 0.044 | 0.106 | ||||||||
| Linear regression | 2022 and 2023 | 0.731 | 1.394 | 125.229 | <0.001 | |||||
| Multiple linear regression (a = 0) – Eqn 5 | Multiple linear regression (a = 0) | 2022 | b | 0.022 | 0.02 | 0.52 | 1.064 | |||
| c | 0.033 | 0.028 | ||||||||
| 2023 | b | 0.018 | 0.02 | 0.325 | 0.489 | |||||
| c | 0.003 | 0.018 | ||||||||
| Linear regression | 2022 and 2023 | 0.705 | 1.553 | 109.913 | <0.001 |
R2, coefficient of determination; RSS, residual sum of the squares for the different regression models per year; F- value and P- value, sigificance for the linear regression model.
Linear regression from predicted values for shoot biomass from mean stem height and mean tiller number and observed values from mean shoot dry biomass. Predicted values were calculated from a multiple linear regression model (Eqn 5). Statistics results were R2 = 0.705, RSS = 1.553, and P < 0.001. The solid one-to-one line at the origin represents the ideal prediction, and the dashed line shows our model prediction. Different colours represent data from different years (blue, 2022; red, 2023). The shapes differentiate the 14 RILs (circles, ●), from the parent lines ‘Boett’ (squares, ■) and ‘Happy’ (triangles, ▲), each point represents the mean from three samples. Data was collected in 2022 and 2023 for 72 samples in Uppsala, Sweden.
The equations for a linear, multiple linear, and non-linear regression were:
The suggested fitting equation was:
where b = 0.022 and c = 0.033 are the parameters suggested to fit in the equation for 2022; and b = 0.018 and c = 0.003 are the parameters suggested to fit in the equation for 2023 (Table 1).
Prediction of shoot N pool by shoot biomass and SPAD
To predict the shoot N pool (straw N content flowering × shoot biomass flowering), shoot biomass (Eqn 5 was applied to calculate shoot biomass) and SPAD mean values at anthesis were used. A total of 72 straw samples at anthesis were collected in 2022 and 2023 to obtain N contents to convert to shoot N pools. Multiple linear and non-linear regressions were performed and compared to identify the most suitable equation for the shoot N pool. The multiple linear model (Eqn 6) showed a RSS = 271.98, a high coefficient of determination (R2 = 0.886), and a significant difference between dependent and independent traits P < 0.001 (Table 2). The non-linear model (Eqn 7) obtained slightly better values, with a smaller RSS = 266.908, higher R2 = 0.888, and significant (P < 0.001). Therefore, the non-linear model (Eqn 7) was the selected one. The parameters for the regressions were also calculated separately for the years 2022 and 2023 (Table 2) to accommodate the great inter-annual variation.
| Model equation | Regression model | Year | Parameter | Parameter value | s.e. | R2 | RSS | F-value | P-value | |
|---|---|---|---|---|---|---|---|---|---|---|
| Multiple linear regression – Eqn 6 | Multiple linear regression | 2022 | a | −2.571 | 12.379 | 0.827 | 184.173 | |||
| b | 19.301 | 2.730 | ||||||||
| c | 0.102 | 0.315 | ||||||||
| 2023 | a | −2.470 | 9.897 | 0.864 | 87.807 | |||||
| b | 28.099 | 2.534 | ||||||||
| c | −0.106 | 0.213 | ||||||||
| Linear regression | 2022 and 2023 | 0.886 | 271.98 | 357.701 | <0.001 | |||||
| Non-linear regression – Eqn 7 | Non-linear regression | 2022 | a | 10.673 | 17.493 | 0.827 | 183.703 | |||
| b | 0.928 | 0.131 | ||||||||
| c | 0.181 | 0.436 | ||||||||
| 2023 | a | 27.353 | 40.96 | 0.871 | 83.205 | |||||
| b | 1.292 | 0.104 | ||||||||
| c | −0.074 | 0.386 | ||||||||
| Linear regression | 2022 and 2023 | 0.888 | 266.908 | 365.527 | <0.001 |
R2, coefficient of determination (R2); RSS, residual sum of the squares (RSS) for the different regression models per year; F-value and P-value, significance for the linear regression model.
The equation for multiple linear regression was:
The suggested non-linear regression model was:
where a = 10.673, b = 0.928, and c = 0.181 are the parameters suggested to fit the equation for 2022; and a = 27.353, b = 1.292, and c = −0.074 are the parameters suggested to fit the equation for 2023 (Table 2).
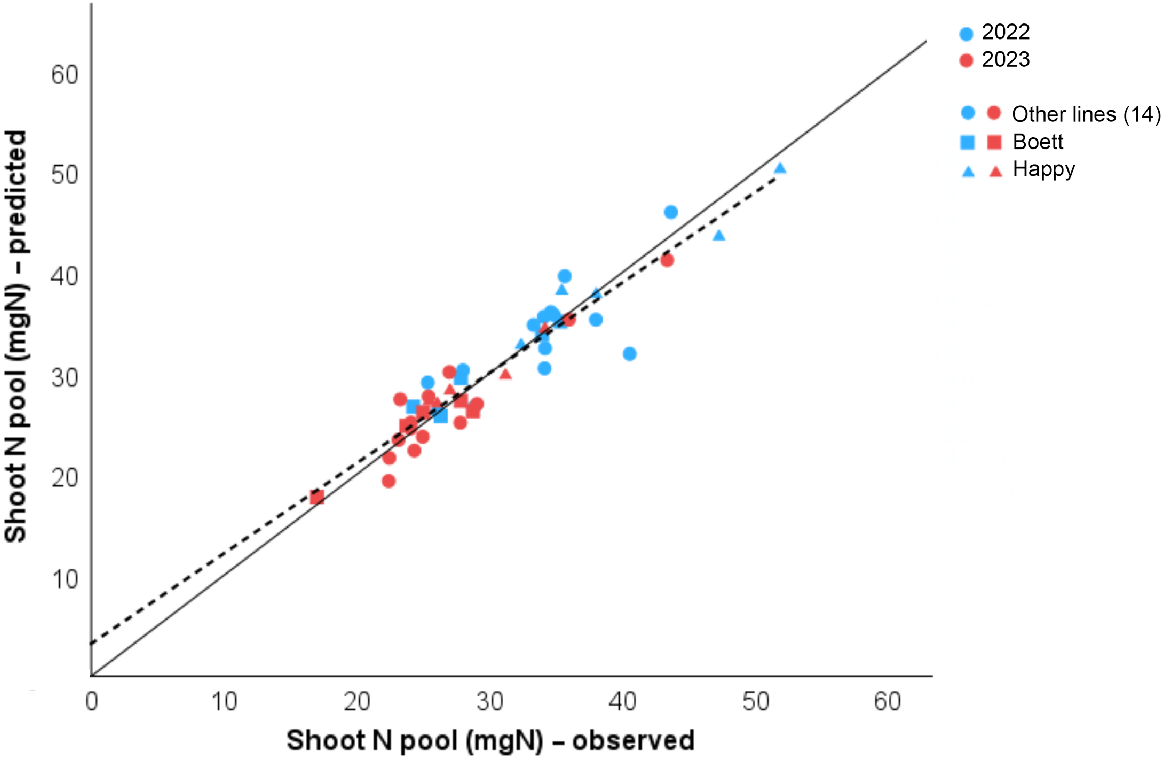
After the non-linear regression (Eqn 7), the predicted shoot N pool obtained from the shoot biomass flowering mean (calculated by the previous Eqn 5) and mean SPAD values were calculated and plotted against the observed shoot N pool values in a linear regression model (Fig. 3).
Linear regression from predicted and observed values for Shoot N pool (mean) at anthesis for 16 spring wheat lines (72 destructive samples) grown in Uppsala, Sweden in 2022 and 2023. Predicted values were obtained after a non-linear regression model (Eqn 7). Statistics results were R2 = 0.888, RSS = 266.908, and P < 0.001. The solid one-to-one line at the origin represents the ideal prediction; the dashed line shows our model prediction. Different colours represent data from different years (blue, 2022; red, 2023). The shapes differentiate the 14 RILs (circles, ●), from the parent lines ‘Boett’ (squares, ■) and ‘Happy’ (triangles, ▲), each point represents the mean from three samples.
Means and s.d. of shoot, height, SPAD, number of tillers (non-destructive traits), shoot biomass, and shoot N pool (predicted traits) were also calculated for 183 lines in 2022 and 179 lines in 2023 (Table 3).
| Year | Shoot height (cm) | Number of tillers per plant | SPAD | Shoot biomass (g) | Shoot N pool (mg N) | ||
|---|---|---|---|---|---|---|---|
| 2022 | Mean | 72.03 | 5.17 | 47.55 | 1.72 | 35.48 | |
| s.d. | 7.76 | 1.8 | 3.03 | 0.19 | 3.7 | ||
| 2023 | Mean | 66.07 | 7.72 | 48.93 | 1.2 | 26.02 | |
| s.d. | 8.88 | 2.14 | 3.52 | 0.13 | 3.6 | ||
Estimation of NAE and components
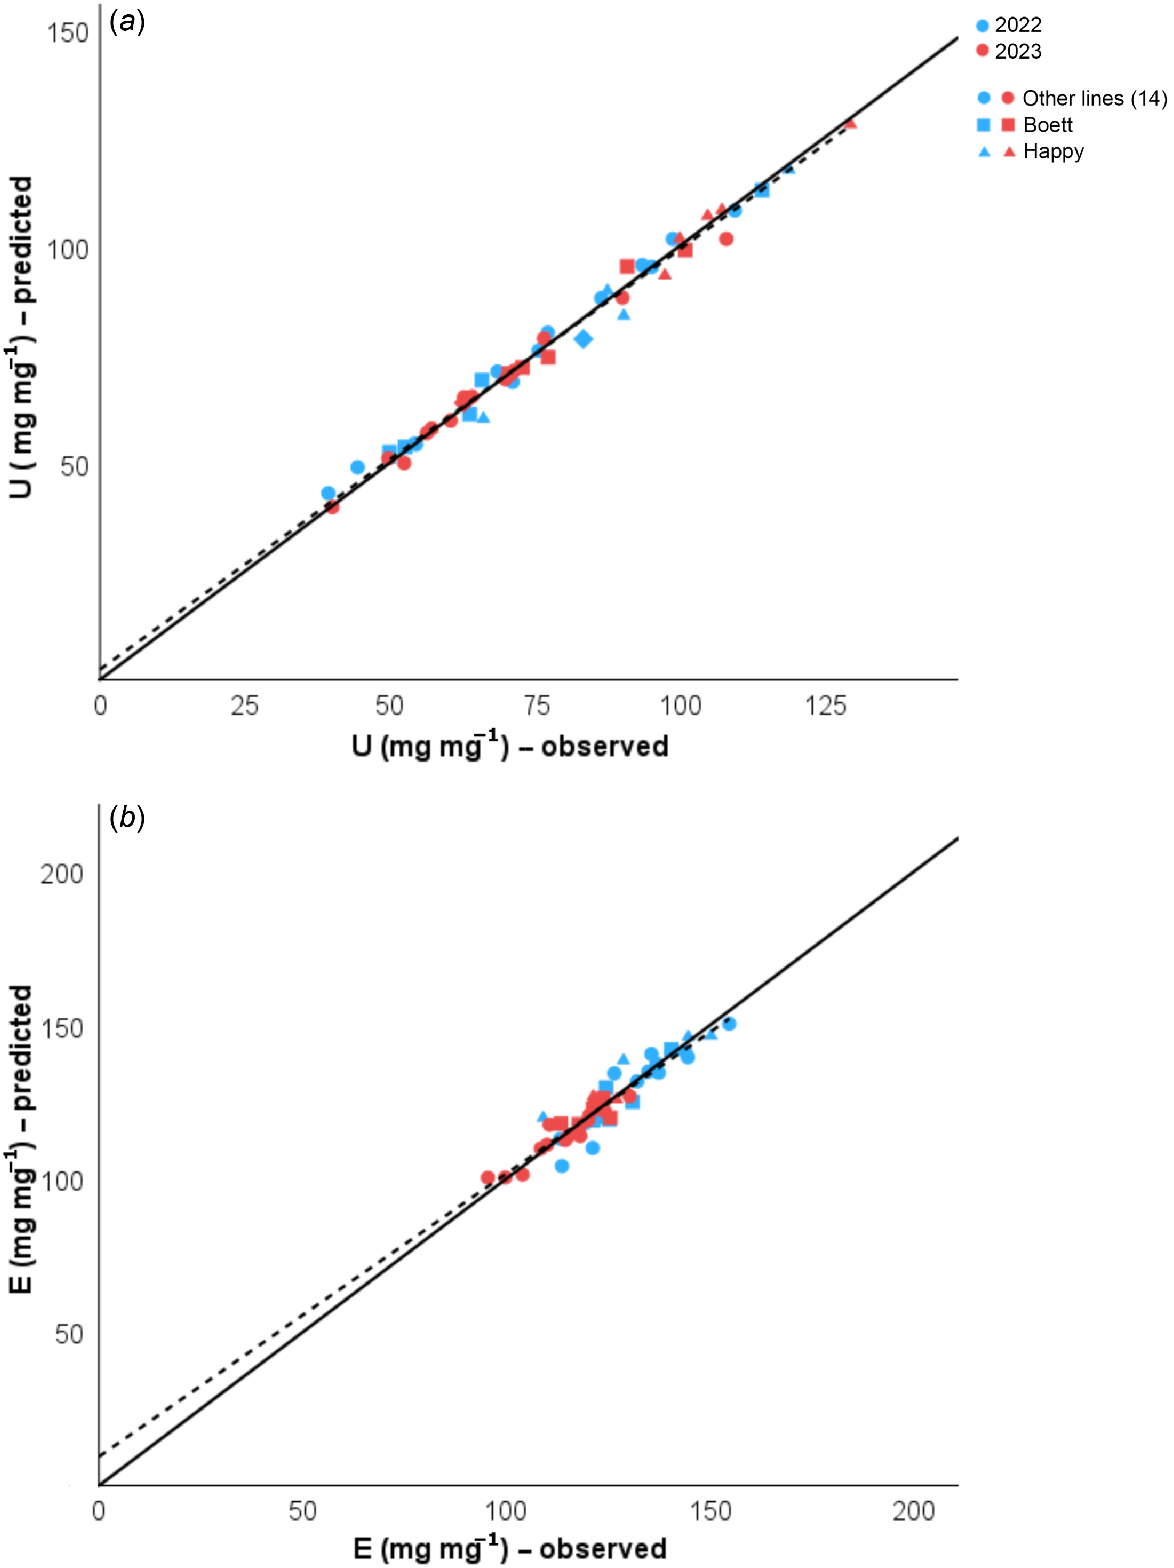
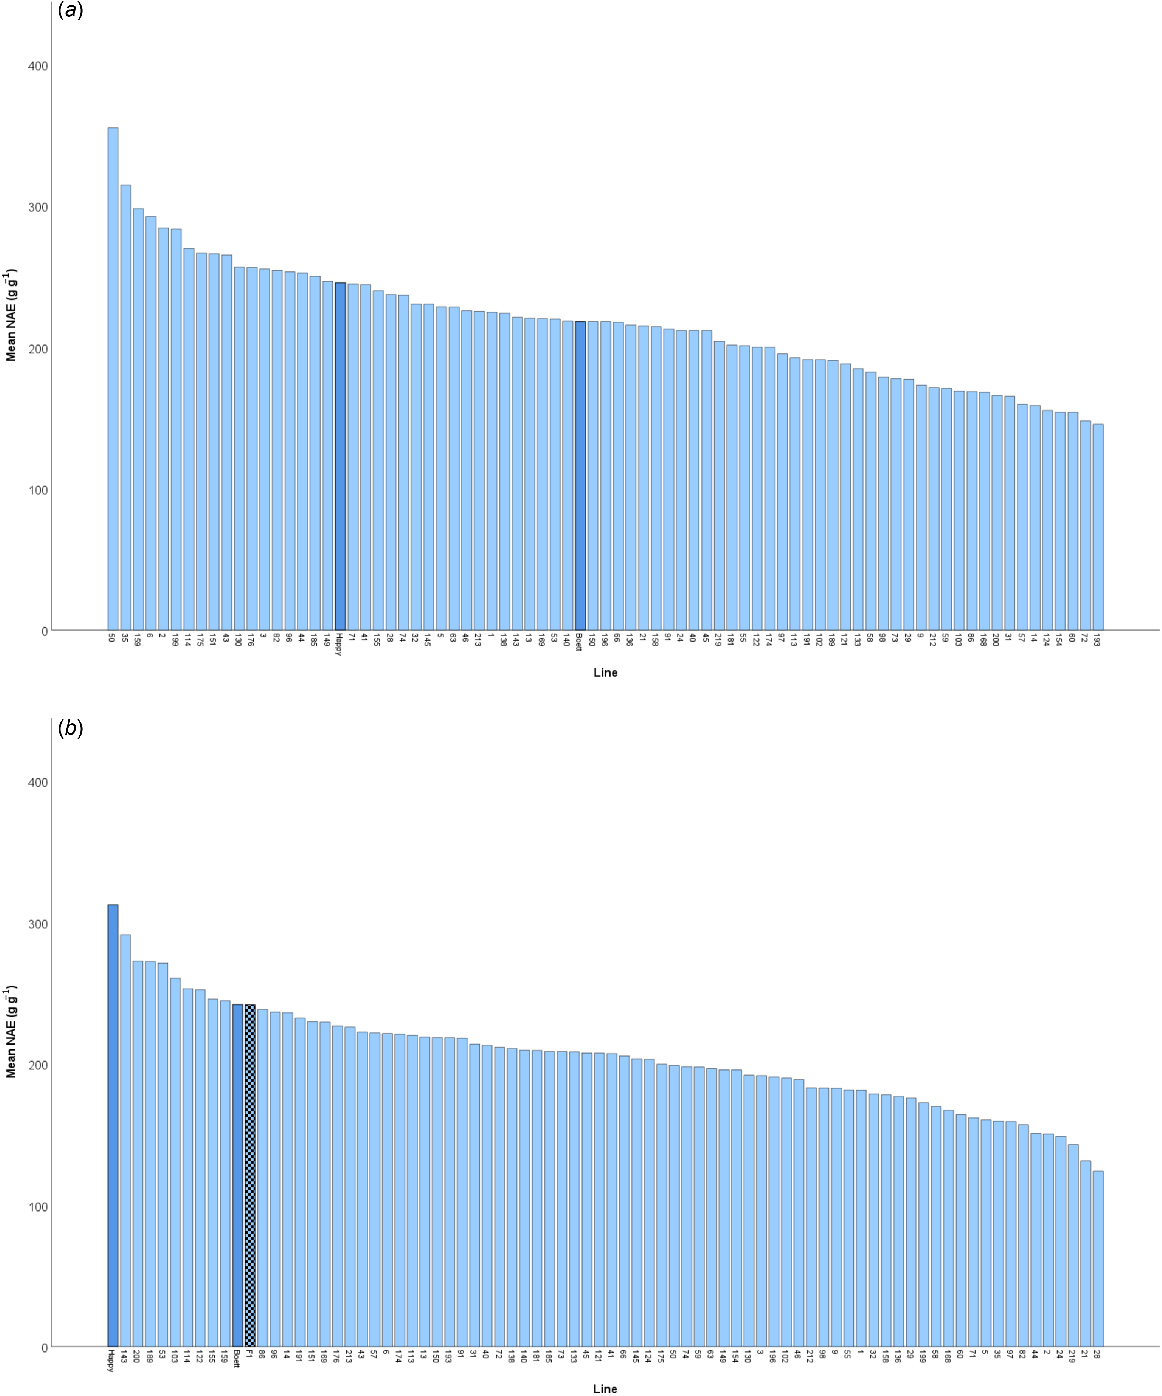
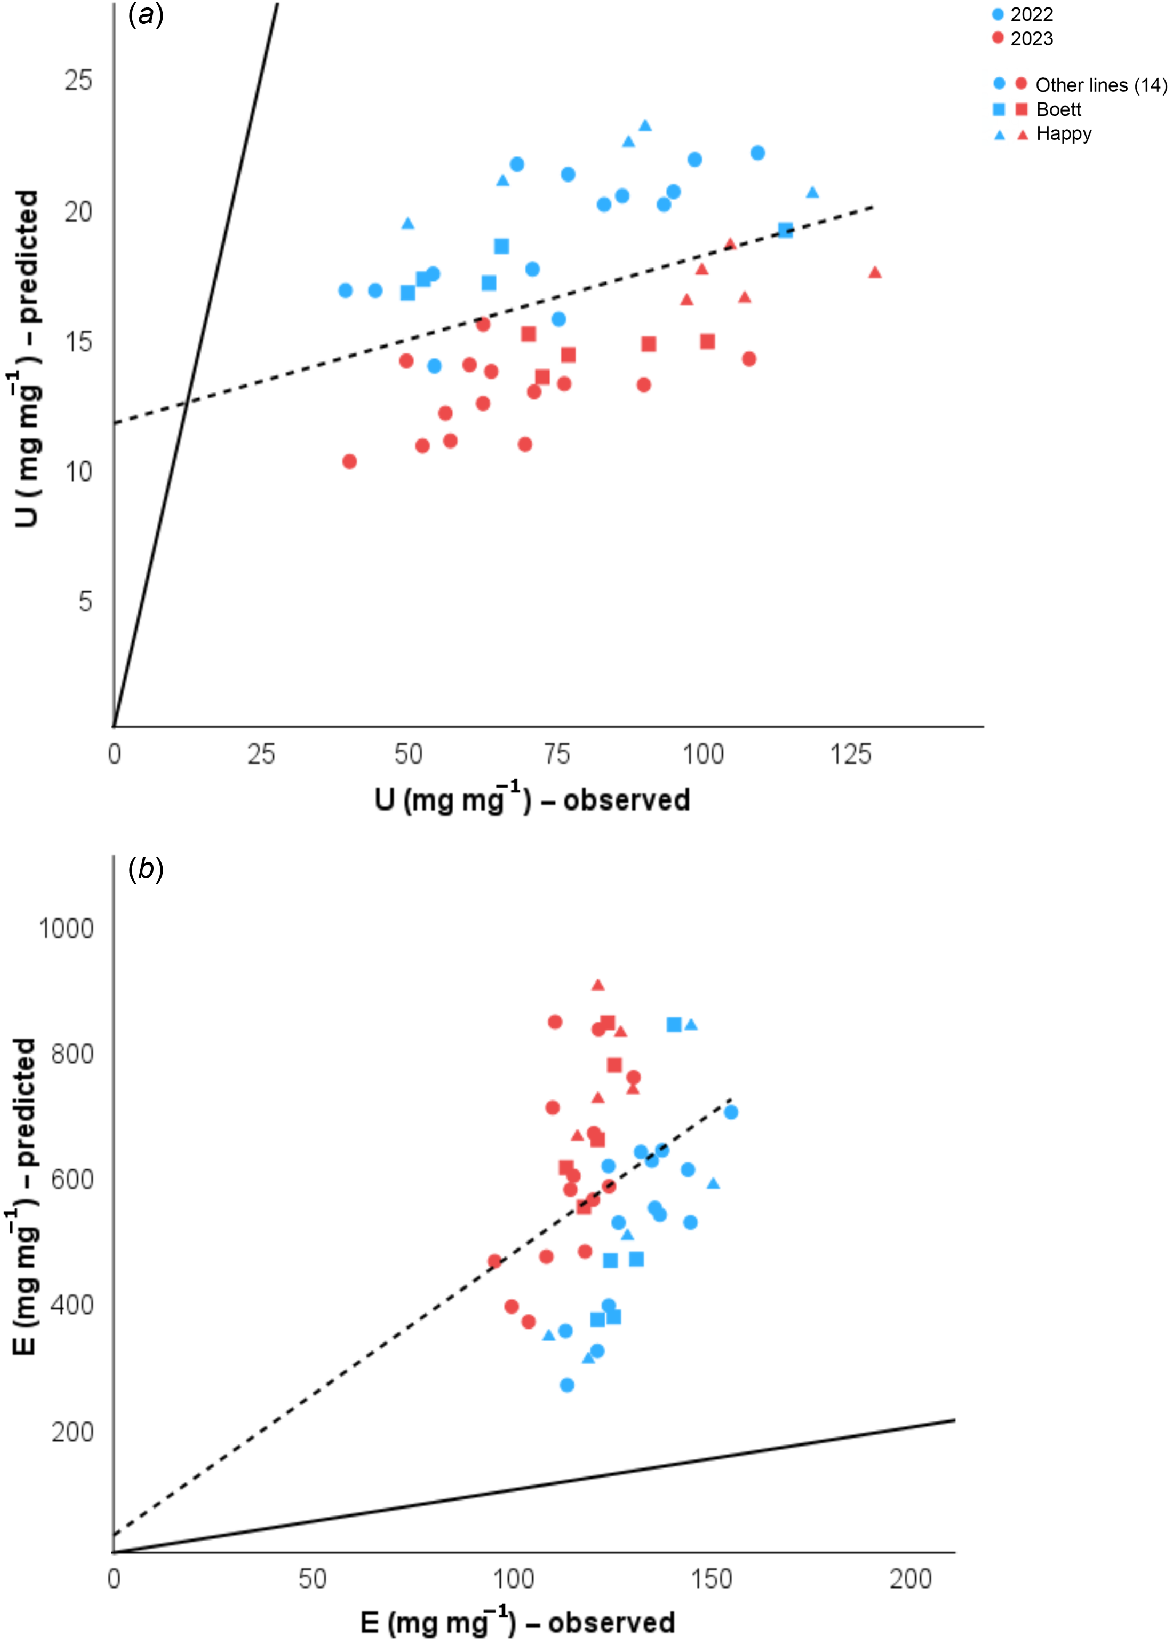
To address our main aim, two NAE components, N uptake efficiency (UN) and grain-specific N efficiency (EN), were calculated using observed data from all sampling stages, and compared against the predicted values from the allometric equations for the estimation of the plant N content at anthesis, detailed above. The predicted data closely reflected the observed data (Fig. 4). Then, NAE was estimated using the predicted UN and EN according to Eqn 1 for the subset of 80 lines (see Supplementary Table S1, Fig. 5).
Linear regressions from predicted and observed values for (a) N uptake efficiency (UN). Statistics results were R2 = 0.986, RSS = 304.951, and P < 0.001, and (b) grain-specific N efficiency (EN), R2 = 0.873, RSS = 908.149 and P < 0.001 for wheat lines grown in Uppsala, Sweden in 2022 and 2023. Predicted values were obtained after applying Eqn 7 and maturity data. The solid one-to-one line at the origin represents the ideal prediction; the dashed line shows our model prediction. Different colours represent data from different years (blue, 2022; red, 2023). The shapes differentiate the 14 RILs (circles, ●), from the parent lines ‘Boett’ (squares, ■) and ‘Happy’ (triangles, ▲), each point represents means from three samples.
Estimated mean values of N accumulation efficiency (NAE) in each of 80 spring wheat lines grown in Uppsala, Sweden in (a) 2022 and (b) 2023. The dark blue bars correspond to the parental lines ‘Happy’ and ‘Boett’. The chequered bar in (b) represents the mean of F1 plants grown in 2023.
Although our estimation of NAE components using allometry associations and less destructive samples was highly accurate, we also tested if omitting destructive sampling at maturity would produce good predictions. For this step, we plotted the observed values of UN and EN against their predicted values based only on the initial seed N pool and the non-destructively assessed estimates at anthesis (Fig. 6). The estimations were poorly accurate, confirming that the use of allometry models at anthesis with non-destructive sampling and only very limited destructive sampling (for model calibration) should be followed by full destructive sampling at plant maturity for reliable predictions of NAE and its components.
Linear regressions from predicted and observed values for (a) N uptake efficiency (UN). Statistics result were R2 = 0.171, RSS = 97.169, and P = 0.003, and (b) grain-specific N efficiency (EN), R2 = 0.113, RSS = 148289.89, and P = 0.019 in 2022 and 2023 for 16 wheat lines (72 destructive samples at anthesis) grown in Uppsala, Sweden. Predicted values were obtained after taking into account only the seed N pool and the predicted shoot N pool at anthesis (Eqn 7). The solid one-to-one line at the origin represents the ideal prediction; the dashed line shows our model prediction. Different colou represent data from different years (blue, 2022; red, 2023). The shapes differentiate the 14 RILs (circles, ●), from the parent lines ‘Boett’ (squares, ■) and ‘Happy’ (triangles, ▲), each point represents the mean from three samples.
Discussion
Similar to others (e.g. Bakhshandeh et al. 2012), we found a close relationship between shoot height and biomass in wheat. By integrating additional information on leaf chlorophyll content (SPAD), we were able to connect non-destructively assessable traits with the normally destructively assessed traits of shoot biomass and N pool. Moreover, by introducing another easy-to-assess trait (shoot or tiller number) along with a series of parameters that can be calculated separately for different years, we were able to allow for the accommodation of year-to-year variability in environmental conditions (e.g. weather). By incorporating this adaptability the models can be applied more broadly across different environmental conditions, improving their predictive accuracy in different field situations and using different plant material. In the specific case of this investigation, we used our adaptive regression models to significantly reduce the need for destructive sampling in our detailed N use efficiency concept developed previously (Weih et al. 2011a, 2018). Thus, this study builds on the NAE approach developed by Weih et al. (2018), and develops it further. While Weih et al. (2018) developed the NAE conceptual approach, solely relying on multiple destructive sampling, and tested it with several examples, our study complements that approach and enhances its practicality, reducing the destructive sampling and chemical analysis efforts needed without compromising accuracy. The suggested simplifications make the NAE concept (Weih et al. 2011a, 2018) more accessible and adaptable for broader applications. Similar to other N use efficiency approaches, the NAE concept (Weih et al. 2011a, 2018) is based on nutrient and biomass ratios, and the calculation basis is the N pool in a plant and/or seed (a critical discussion of different calculation bases is found in the above two papers). Technically, these ratios can also be expressed per unit land area to make the calculations appear more relevant for practical agriculture considerations, although we here refrained from doing so, due to the very small micro-plot size (0.47 m2) used in this study.
Allometric relationships between traits
Allometric relationships between plant height and shoot biomass of wheat have been reported in previous studies showing a strong relationship (Bakhshandeh et al. 2012; Sileshi et al. 2023). Bakhshandeh et al. (2012) showed an allometric pattern between stem dry weight and plant height in seven wheat cultivars under two different conditions (irrigated and rainfed) but they did test their equations only during one growing season and on a limited plant material. In our study we established a close relationship between plant height and shoot biomass, confirming hypothesis 1; and developed a more generalisable equation by incorporating tiller number as an additional easy-to-measure trait, along with a serious of parameters that allow adaptation to different environmental conditions that are known to strongly affect shoot number and shoot growth in wheat. With these adjustments, we achieved a greater flexibility and precision of the model, improving its predictive power, especially when data from different years with contrasting weather are used.
Optical methods for assessing plant N contents have also been in use for a long time (Saberioon et al. 2014), common is the use of chlorophyll meter (SPAD) readings to predict leaf N-concentration by measuring leaf greenness; or also the evaluation of genetic variability in leaf greenness across cereal populations (Giunta et al. (2002). These SPAD readings are faster and more practical compared to conventional N testing, in which plant samples need to be dried and further prepared for analysis (Parvizi et al. 2004). In contrast to the applications where SPAD measurements are used to evaluate genetic variability in leaf N or to provide fertiliser recommendations, we combined the SPAD measurements with the non-destructively assessed biomass data and applied them as an elegant tool to get an easy-to-measure but still representative estimate of the N pool in a shoot. The predictive power (R2) of the equations generated was again satisfying (Fig. 3), supporting our second hypothesis (H2). In these equations, we also incorporated several parameters that can be calculated separately for each year in order to allow for the flexible adaptation to different plant material and environments.
Influence of environmental variability on model predictions
A specific characteristic of the regression equations developed here is that the parameter estimations of the multiple linear and non-linear equations were allowed to be calculated differently for different years, which enabled us to account for the differential weather conditions for the 2 years of the experiment. While temperatures and precipitation patterns were similar to long-term means during 2022, 2023 had an extended dry period that occurred in June, which was followed by intense rains in July and August. The intense drought in the middle of the growing season in 2023 affected the height of the wheat lines, a result that is in line with other reports on the effect of water stress on stem and tiller height (Destro et al. (2001). In spite of the very contrasting weather conditions in the 2 years of our study, and the corresponding effects on stem height and tiller number, our model was able to accommodate these differences when tiller number was assessed and parameters were calculated separately for the 2 years.
The contrasting weather conditions were also greatly reflected by the leaf chlorophyll (SPAD) values assessed in the 2 years. Thus, the SPAD values were higher and shoot biomasses were lower in 2023 than in 2022. These results indicate that the leaf chlorophyll content, thus N content, increased in 2023, possibly as a consequence of acclimation to drought stress (Weih et al. 2011b). Taken together, the separate calibration and estimation of parameter values for each season provided a greater accuracy and adjustability to our models, making them adaptable to a greater set of plant material and environmental conditions than was used in this investigation. However, these equations need to be further validated in different plant material and environmental contexts.
Implications for breeding
Previous studies have reported the usefulness of SPAD measurements in breeding, especially for the estimation of grain protein content (Matsunaka et al. 1997; Rharrabti et al. 2001). Additionally, in the study of Debaeke et al. (2006), SPAD values were shown to be cultivar dependent, due to differences in leaf weight between cultivars. SPAD measurements at flag leaves were also shown to be indicative of N use efficiency differences seen between wheat cultivars and treatments (Asplund et al. 2016).
Despite being seen as a valuable breeding goal, wheat varieties with improved N use efficiency mechanisms currently lack dedicated breeding programs. This might be influenced by the large quantity of data needed during the complete phenotyping and breeding process. Large populations of lines, such as RILs, are common in pre-breeding and breeding, and the amount of trait data analysis required for the selection of desirable candidate lines to continue in the breeding process can be vast. As a more accurate alternative to simpler N use efficiency approaches only requiring N data at maturity (e.g. Moll et al. 1982), the allometry approach proposed here maintains the higher accuracy of the N use efficiency concept by Weih et al. (2011a) and Weih et al. (2018), whilst significantly reducing destructive sampling by eliminating the need for such sampling at anthesis. The evaluation of traits that can be assessed non-destructively, combined with an allometry approach, offers an opportunity to efficiently assess the various NAE-related traits across a large number of breeding lines without damaging many samples at anthesis. The destructive sampling would only be needed to calibrate and parameterise the corresponding model equations on a subset of samples to account for the environmental conditions.
Phenotyping and modelling go hand-in-hand
Collecting the phenotype data is often the most laborious part of the research process. To screen valuable agricultural traits in a population, replicated trials in different sites and different years are needed. Additionally, destructive harvests during different growth stages are slow and costly, but often needed to achieve better mechanistic understanding of the traits determining the N use efficiency in crops (Weih et al. 2018). In order to speed up the phenotyping, remote sensing technologies can be applied and make the field evaluation of agricultural traits faster and less dependent on extensive destructive sampling (Furbank and Tester 2011).
Many traits can be measured by digital imaging, such as plant size and colour, which helps to quantify plant senescence, transpiration, toxicities, and diseases (Poorter et al. 2010; Furbank and Tester 2011; York 2019). Plant biomass and shoot biomass growth are two traits that are of great interest to breeders (Golzarian et al. 2011). Other traits such as early vigour, coleoptile length, and biomass at anthesis may also be correlated with plant biomass (Furbank and Tester 2011; Liu et al. 2021). These traits are usually scored manually and can be improved by using phenomics tools (Furbank and Tester 2011). By using the allometry approach of our study, two traits (plant size and plant biomass) can be determined non-destructively, and the manual workload is reduced even more. SPAD values will be the only measurement taken manually for the prediction of shoot N pool at anthesis. It should be emphasised that a certain number of destructive samples, representing the expected trait variability, have to be taken to calibrate the models and produce trustworthy estimations. If the information here assessed through manual measurements (shoot height, tiller number, SPAD) is monitored using modern remote sensing technology, the allometric relationships developed here can be applied to calculate shoot biomasses and N pools in a true high-throughput approach. The combination of remote sensing technologies to provide data needed for the allometric models therefore can be considered as a next step for the efficient high-throughput estimation of N use efficiency traits such as the NAE and its components.
Practicality and restrictions of crop models
Different kinds of crop models are often used in agriculture to facilitate decision-making processes in crop management (Spitters 1990; Park et al. 2005). In this context, allometric approaches and their combination with regression models, as presented in this study, have been applied before, especially in crop growth research (Spitters 1990). A universal crop model that takes into account the majority of crops and variables in one single model would not be an appropriate approach, due to the specific adaptations and environmental conditions in a given agricultural context (Brisson et al. 2003). Instead, a crop model should fulfil the observations and hypotheses proposed in a given agricultural context, and it is desirable to develop different models for different objectives or hypotheses (as shown in this study). Additionally, crop models should allow context-specific calibration and parameterisation to allow for adjustments to different years, environments and plant materials; examples for providing this flexibility are the models presented here (Eqn 5, Eqn 7).
It is important to note that although modelling is a suitable tool for understanding complex relations and predicting processes, it implies some limitations. Although linear models are not always suitable for predicting crop responses to environmental conditions (Park et al. 2005), it turned out that a multiple linear and a non-linear regression model were among the best performing for our purposes. Additionally, it was shown that a representative estimation of mean N pools during the growing season, which is needed for the assessment of NAE components, requires some sort of sampling (using non-destructive or destructive ones) at both flowering and maturity stages. By relying only on the data assessed at anthesis, one would assume that the majority of the N uptake by the plant occurs before anthesis, while our data showed that the spring wheat investigated here continued taking up significant amounts of N also after anthesis. Including destructively assessed data from the maturity stage generated thus a much higher predictive power in combination with the non-destructively assessed data from the flowering stage, providing a reliable working model (Fig. 4).
Conclusions
Shoot height and number of tillers at flowering, both easy to assess with non-destructive methods, can be used as reliable predictors for shoot biomass of wheat. The use of these traits in the adaptive regression model presented here, when parameterised separately for each year, was robust enough to accommodate large inter-annual variability in weather conditions. The shoot biomass estimate, together with non-destructively assessed leaf nitrogen content (SPAD), can further be used to predict the shoot N pool of wheat at flowering. In addtion, the adaptive regression model developed for this purpose was capable of accommodating large inter-annual variability in weather, when parameterised separately for the 2 years. The adaptive regression models developed here can be applied to significantly reduce the need for destructive sampling in nitrogen use efficiency approaches, normally requiring extensive destructive sampling, without reducing precision; which was demonstrated in this study for a RIL population field-grown in Sweden for 2 years with contrasting weather. Provided that the plant traits assessed through manual measurements (shoot height, tiller number, chlorophyll content) are monitored using modern phenotyping technology, the allometric relationships developed here can be used to estimate shoot biomasses and nitrogen pools in high-throughput phenotyping approaches to assess nitrogen use efficiency in large breeding populations of wheat and other cereals. Further validation of the proposed models using data from different plant material and environments is recommended to improve generalizability and precision of the adaptive regression models developed here.
Data availability
The data that supports this study will be shared upon reasonable request to the corresponding author.
Declaration of funding
This research was financed by a grant from the Swedish research council Formas (grant number 2019-00314 to Martin Weih).
Acknowledgements
We thank Pernilla Vallenback for providing the seeds, and Ivana Jonavić for assistance in the field, lab, and sample processing. We also thank Ewa Magnuski and Nils-Erik Nordh for their support in the lab and sample processing.
References
Asplund L, Bergkvist G, Weih M (2016) Functional traits associated with nitrogen use efficiency in wheat. Acta Agriculturae Scandinavica, Section B – Soil & Plant Science 66(2), 153-169.
| Crossref | Google Scholar |
Bakhshandeh E, Soltani A, Zeinali E, Kallate-Arabi M (2012) Prediction of plant height by allometric relationships in field-grown wheat. Cereal Research Communications 40(3), 413-422.
| Crossref | Google Scholar |
Bernardo R (2004) What proportion of declared QTL in plants are false? Theoretical and Applied Genetics 109, 419-424.
| Crossref | Google Scholar | PubMed |
Brisson N, Gary C, Justes E, Roche R, Mary B, Ripoche D, Zimmer D, Sierra J, Bertuzzi P, Burger P, Bussière F, Cabidoche YM, Cellier P, Debaeke P, Gaudillère JP, Hénault C, Maraux F, Seguin B, Sinoquet H (2003) An overview of the crop model stics. European Journal of Agronomy 18(3–4), 309-332.
| Crossref | Google Scholar |
Debaeke P, Rouet P, Justes E (2006) Relationship between the normalized SPAD index and the nitrogen nutrition index: application to durum wheat. Journal of Plant Nutrition 29(1), 75-92.
| Crossref | Google Scholar |
Destro D, Miglioranza É, Arias CAA, Vendrame JM, de Almeida JCV (2001) Main stem and tiller contribution to wheat cultivars yield under different irrigation regimes. Brazilian Archives of Biology and Technology 44(4), 325-330.
| Crossref | Google Scholar |
Du Y-L, Xi Y, Cui T, Anten NPR, Weiner J, Li X, Turner NC, Zhao Y-M, Li F-M (2020) Yield components, reproductive allometry and the tradeoff between grain yield and yield stability in dryland spring wheat. Field Crops Research 257, 107930.
| Crossref | Google Scholar |
Enquist BJ, West GB, Charnov EL, Brown JH (1999) Allometric scaling of production and life-history variation in vascular plants. Nature 401, 907-911.
| Crossref | Google Scholar |
Furbank RT, Tester M (2011) Phenomics – technologies to relieve the phenotyping bottleneck. Trends in Plant Science 16(12), 635-644.
| Crossref | Google Scholar | PubMed |
Gaju O, Allard V, Martre P, Snape JW, Heumez E, LeGouis J, Moreau D, Bogard M, Griffiths S, Orford S, Hubbart S, Foulkes MJ (2011) Identification of traits to improve the nitrogen-use efficiency of wheat genotypes. Field Crops Research 123(2), 139-152.
| Crossref | Google Scholar |
Gastal F, Lemaire G (2002) N uptake and distribution in crops: an agronomical and ecophysiological perspective. Journal of Experimental Botany 53(370), 789-799.
| Crossref | Google Scholar | PubMed |
Giunta F, Motzo R, Deidda M (2002) SPAD readings and associated leaf traits in durum wheat, barley and triticale cultivars. Euphytica 125, 197-205.
| Crossref | Google Scholar |
Golzarian MR, Frick RA, Rajendran K, Berger B, Roy S, Tester M, Lun DS (2011) Accurate inference of shoot biomass from high-throughput images of cereal plants. Plant Methods 7, 2.
| Crossref | Google Scholar |
Gould SJ (1966) Allometry and size in ontogeny and phylogeny. Biological Reviews 41(4), 587-638.
| Crossref | Google Scholar | PubMed |
Le Bail M, Jeuffroy M-H, Bouchard C, Barbottin A (2005) Is it possible to forecast the grain quality and yield of different varieties of winter wheat from Minolta SPAD meter measurements? European Journal of Agronomy 23(4), 379-391.
| Crossref | Google Scholar |
Lemaire G, Sinclair T, Sadras V, Bélanger G (2019) Allometric approach to crop nutrition and implications for crop diagnosis and phenotyping. A review. Agronomy for Sustainable Development 39, 27.
| Crossref | Google Scholar |
Liu H, Fiorani F, Jäck O, Colombi T, Nagel KA, Weih M (2021) Shoot and root traits underlying genotypic variation in early vigor and nutrient accumulation in spring wheat grown in high-latitude light conditions. Plants 10(1), 174.
| Crossref | Google Scholar |
Luo C-L, Zhang X-F, Duan H-X, Mburu DM, Kavagi L, Naseer M, Dai R-Z, Nyende AB, Batool A, Xiong Y-C (2020) Allometric relationship and yield formation in response to planting density under ridge-furrow plastic mulching in rainfed wheat. Field Crops Research 251, 107785.
| Crossref | Google Scholar |
Matsunaka T, Watanabe Y, Miyawaki T, Ichikawa N (1997) Prediction of grain protein content in winter wheat through leaf color measurements using a chlorophyll meter. Soil Science and Plant Nutrition 43(1), 127-134.
| Crossref | Google Scholar |
Moll R, Kamprath E, Jackson WA (1982) Analysis and interpretation of factors which contribute to efficiency of nitrogen utilization. Agronomy Journal 74(3), 562-564.
| Crossref | Google Scholar |
Müller I, Schmid B, Weiner J (2000) The effect of nutrient availability on biomass allocation patterns in 27 species of herbaceous plants. Perspectives in Plant Ecology, Evolution and Systematics 3(2), 115-127.
| Crossref | Google Scholar |
Park SJ, Hwang CS, Vlek PLG (2005) Comparison of adaptive techniques to predict crop yield response under varying soil and land management conditions. Agricultural Systems 85(1), 59-81.
| Crossref | Google Scholar |
Parvizi Y, Ronaghi A, Maftoun M, Karimian N (2004) Growth, nutrient status, and chlorophyll meter readings in wheat as affected by nitrogen and manganese. Communications in Soil Science and Plant Analysis 35(9–10), 1387-1399.
| Crossref | Google Scholar |
Peltonen J, Virtanen A, Haggren E (1995) Using a chlorophyll meter to optimize nitrogen fertilizer application for intensively-managed small-grain cereals. Journal of Agronomy and Crop Science 174(5), 309-318.
| Crossref | Google Scholar |
Poorter H, Niinemets Ü, Walter A, Fiorani F, Schurr U (2010) A method to construct dose–response curves for a wide range of environmental factors and plant traits by means of a meta-analysis of phenotypic data. Journal of Experimental Botany 61(8), 2043-2055.
| Crossref | Google Scholar | PubMed |
Qin X-L, Weiner J, Qi L, Xiong Y-C, Li F-M (2013) Allometric analysis of the effects of density on reproductive allocation and harvest index in 6 varieties of wheat (Triticum). Field Crops Research 144, 162-166.
| Crossref | Google Scholar |
Ravier C, Meynard J-M, Cohan J-P, Gate P, Jeuffroy M-H (2017) Early nitrogen deficiencies favor high yield, grain protein content and N use efficiency in wheat. European Journal of Agronomy 89, 16-24.
| Crossref | Google Scholar |
Rharrabti Y, Villegas D, García Del Moral LF, Aparicio N, Elhani S, Royo C (2001) Environmental and genetic determination of protein content and grain yield in durum wheat under Mediterranean conditions. Plant Breeding 120(5), 381-388.
| Crossref | Google Scholar |
Saberioon MM, Amin MSM, Gholizadeh A, Ezri MH (2014) A review of optical methods for assessing nitrogen contents during rice growth. Applied Engineering in Agriculture 30(4), 657-669.
| Crossref | Google Scholar |
Sadras VO, Egli D (2008) Seed size variation in grain crops: allometric relationships between rate and duration of seed growth. Crop Science 48, 408-416.
| Crossref | Google Scholar |
Samson DA, Werk KS (1986) Size-dependent effects in the analysis of reproductive effort in plants. The American Naturalist 127(5), 667-680.
| Crossref | Google Scholar |
Schmid B, Polasek W, Weiner J, Krause A, Stoll P (1994) Modeling of discontinuous relationships in biology with censored regression. The American Naturalist 143(3), 494-507.
| Crossref | Google Scholar |
Shipley B, Meziane D (2002) The balanced-growth hypothesis and the allometry of leaf and root biomass allocation. Functional Ecology 16(3), 326-331.
| Crossref | Google Scholar |
Sileshi GW, Nath AJ, Kuyah S (2023) Allometric scaling and allocation patterns: implications for predicting productivity across plant communities. Frontiers in Forests and Global Change 5, 1084480.
| Crossref | Google Scholar |
Spitters CJT (1990) Crop growth models: their usefulness and limitations. Acta Horticulturae 267, 349-368.
| Crossref | Google Scholar |
Weih M, Asplund L, Bergkvist G (2011a) Assessment of nutrient use in annual and perennial crops: a functional concept for analyzing nitrogen use efficiency. Plant and Soil 339, 513-520.
| Crossref | Google Scholar |
Weih M, Bonosi L, Ghelardini L, Rönnberg-Wästljung AC (2011b) Optimizing nitrogen economy under drought: increased leaf nitrogen is an acclimation to water stress in willow (Salix spp.). Annals of Botany 108(7), 1347-1353.
| Crossref | Google Scholar |
Weih M, Hamnér K, Pourazari F (2018) Analyzing plant nutrient uptake and utilization efficiencies: comparison between crops and approaches. Plant and Soil 430, 7-21.
| Crossref | Google Scholar |
Weiner J (2004) Allocation, plasticity and allometry in plants. Perspectives in Plant Ecology, Evolution and Systematics 6(4), 207-215.
| Crossref | Google Scholar |
West GB, Brown JH, Enquist BJ (1997) A general model for the origin of allometric scaling laws in biology. Science 276, 122-126.
| Crossref | Google Scholar |
Yang H, Hu Y, Zheng Z, Qiao Y, Hou B, Chen J (2022) A new approach for nitrogen status monitoring in potato plants by combining RGB images and SPAD measurements. Remote Sensing 14(19), 4814.
| Crossref | Google Scholar |
York LM (2019) Functional phenomics: an emerging field integrating high-throughput phenotyping, physiology, and bioinformatics. Journal of Experimental Botany 70(2), 379-386.
| Crossref | Google Scholar |
Zhao B, Liu Z, Ata-Ul-Karim ST, Xiao J, Liu Z, Qi A, Ning D, Nan J, Duan A (2016) Rapid and nondestructive estimation of the nitrogen nutrition index in winter barley using chlorophyll measurements. Field Crops Research 185, 59-68.
| Crossref | Google Scholar |