

Effects of nitrogen level on growth, nutrient uptake, and nitrogen use efficiency in cotton seedlings
Dandan Chen A B , Zhao Zhang A , Honghong Wu A B * and Guozheng Yang A *
A
B
Handling Editor: Sergey Shabala
Abstract
Cotton, as a globally important economic crop, has high nitrogen (N) demand but low N uptake and N utilization efficiency (NUE). Optimizing N input by improving NUE represents a critical challenge for sustainable cotton production. We applied six N levels (0, 0.04, 0.4, 1, 4, 8 mM Ca(NO3)2, designated as N0, N0.04, N0.4, N1, N4, and N8, respectively) to examine their effects on morphology, biomass, nutrient absorption, and NUE at four treatment durations. Results showed that seedling growth and nutrient accumulation initially increased and subsequently decreased with increasing N levels. The optimal N ranges for seedling growth at 7, 14, 21 and 28 d were 0.4, 0.4–1, 1–4 and 4–8 mM Ca(NO3)2, respectively. Under optimal N, seedlings achieved maximum accumulations of N, P, K, and Ca (55.8, 8.8, 64.9, and 26.2 mg/plant at 28 d, respectively), while maintaining consistent N:P:K:Ca ratios of approximately 1:0.2:1.2:0.5 across seedling stage. Under low N, nutrients were preferentially allocated to roots, promoting root growth. NUE exhibited positive correlations with root traits and nutrient proportion, whereas shoot traits showed positive associations with nutrient accumulation and shoot nutrient proportion. These findings provide a theoretical basis for scientific fertilization, and establish a theoretical foundation for understanding the physiological mechanisms of efficient N use in cotton.
Keywords: biomass accumulation, cotton seedling, macronutrient, morphological changes, nitrogen level, nitrogen use efficiency, nutrient distribution, root growth.
Introduction
Cotton (Gossypium hirsutum L.) is a globally significant fiber crop that plays a pivotal role in the world economy (Zhang et al. 2021a; Shah et al. 2022). As the primary raw material for textiles, cotton also serves as an important oilseed crop, with seeds containing 18–20% oil – ranking as the world’s fourth-largest edible oil source (Yang et al. 2019; Shah et al. 2022; Riaz et al. 2023). The agricultural value of cotton extends beyond fiber and oil production; byproducts including hulls and stalks find extensive application in the industrial and pharmaceutical sectors (Zhang et al. 2021a; Cui et al. 2023; Cai et al. 2024). The growing textile industry and expanding utilization of cotton byproducts have driven sustained increases in global demand (Iqbal et al. 2020; Ma et al. 2023). China, while remaining a top producer, has become the world’s third-largest cotton importer due to insufficient domestic production to meet consumption needs (Wang et al. 2021; OECD-FAO 2023). Over the past two decades, China’s cotton harvest area has progressively declined (OECD-FAO 2023), necessitating yield improvement as a crucial strategy to meet national demand under limited arable land resources. However, cotton production requires substantial nitrogen (N) inputs, and yield increases have long relied on excessive N fertilizer application (Shah et al. 2022; Ma et al. 2023).
N is an essential macronutrient for crop growth, regulating various metabolic processes through incorporation into proteins, nucleic acids, chlorophyll, coenzymes, and hormones (Iqbal et al. 2020; Lv et al. 2021; Zhang et al. 2021b). As a major yield-limiting factor (Sun et al. 2020a; Ma et al. 2023), N fertilizer production consumes 1%−2% of global energy (Havé et al. 2017), yet only 30%−50% of applied N is typically absorbed by crops (Coskun et al. 2017; Shah et al. 2022). Low N uptake and utilization efficiency (NUE) is a worldwide concern, and particularly acute in China where average N application rates (213.0 kg/ha) are 3.4 times the global average (FAO 2022). Global agricultural N consumption reached 108.1 million tons in 2022, with China accounting for 27.7% of total usage (FAO 2022). In China’s major cotton-producing regions, conventional N application rates (300 kg/ha) (Zhang et al. 2021a; Ma et al. 2023) far exceed the global average (62.8 kg/ha) (FAO 2022). While NUE increases with N application within a certain range, excessive N not only fails to enhance yields but also reduces NUE, increases production costs (Lee et al. 2020; Ma et al. 2023), and causes environmental problems including soil acidification, water eutrophication, and greenhouse gas emissions (Coskun et al. 2017; Stevens 2019; Shah et al. 2022). Consequently, reducing N inputs while improving NUE has become an urgent priority and a focal point of international agricultural research (Lee et al. 2020; Liu et al. 2022a). As the primary organ for nutrient acquisition, root systems play a central role in plant adaptation to nutrient limitations (Chen et al. 2020a; Sun et al. 2020a). Root architecture significantly influences shoot growth and yield formation, and optimizing root traits is critical for improving NUE while minimizing N leaching (Li et al. 2015; Iqbal et al. 2020; Louvieaux et al. 2020). Under natural conditions where soil nutrients are heterogeneously distributed, crop roots preferentially proliferate in N-rich patches through directional lateral root development (Oldroyd and Leyser 2020; Liu et al. 2022b). Under uniform N distribution, crops exhibit a biphasic response to N availability (Sun et al. 2020a). Severe N deficiency markedly inhibits primary and lateral root elongation, and lateral root formation (Gruber et al. 2013; Jia et al. 2019), indicating that a threshold N level is required to sustain root growth. Moderate N limitation stimulates root elongation and proliferation to expand the absorptive surface area (Feng et al. 2016; Zang et al. 2019; Sun et al. 2020b), whereas N sufficiency suppresses root growth, resulting in lower root-shoot ratios as minimal root systems can acquire adequate nutrients (Gruber et al. 2013; Oldroyd and Leyser 2020; Sun et al. 2020a). As the critical interface for soil-plant exchange, root systems have attracted considerable attention for their potential to enhance NUE (Iqbal et al. 2020; Wang et al. 2022; De Oliveira Santos et al. 2025). Numerous studies have investigated the effects of N concentration on root growth and its underlying mechanisms, yet most focus on model plants such as Arabidopsis, rice, maize, and wheat (Gruber et al. 2013; Gao et al. 2014; He et al. 2019; Jia et al. 2019). Cotton roots, however, exhibit complex architecture and high lignification, posing significant research challenges. Consequently, reports on the impact of N levels on cotton root growth remain limited. Identifying optimal N level and elucidating their effects on root growth are critical for reducing N input while improving NUE in cotton production (Louvieaux et al. 2020).
N level not only directly affects N uptake but also influences the absorption of other nutrients by modulating root growth (Luo et al. 2020; Wang et al. 2022), photosynthesis (Mu and Chen 2021), physiological metabolism, and soil properties (Iqbal et al. 2020; Chen et al. 2023). N, phosphorus (P), potassium (K), and calcium (Ca) are key macronutrients for crop growth and development (Johnson et al. 2022; Weng et al. 2022), and deficiency in any one nutrient can disrupt the balance of others (Duncan et al. 2018a, 2018b). Cotton production often suffers from imbalanced fertilization with excessive N and highly variable N:P:K ratios (Ali et al. 2019; Wang et al. 2021), whereas appropriate nutrient management can significantly improve yield and fertilizer use efficiency (Duncan et al. 2018b; Lollato et al. 2019; Ali et al. 2020). Understanding crop nutrient requirements and implementing balanced fertilization are therefore crucial for optimizing productivity and nutrient use efficiency. Current research on cotton primarily focuses on N, while little attention has been paid to the requirements of P, K, and Ca, and the internal nutrient balance ratio in cotton plants is poorly understood.
Therefore, this study systematically evaluated the effects of six N levels on root and shoot morphological characteristics, biomass accumulation and distribution, nutrient uptake and allocation, and NUE across cotton seedling stage. The objectives were to identify the optimal N levels and determine the requirements and optimal ratios of essential nutrients (N, P, K, and Ca) for seedling growth, to provide a theoretical basis for scientific fertilization. Furthermore, through comprehensive analysis of the relationships between NUE, growth-related traits of roots and shoots, nutrient accumulation and distribution, the physiological mechanism underlying low-N-induced root growth promotion was revealed, and the key traits influencing cotton NUE were identified, laying a theoretical foundation for elucidating the physiological basis of efficient N use in cotton.
Materials and methods
Material and growth condition
A laboratory experiment was carried out at Huazhong Agricultural University, Wuhan, China, with a temperature of 30°C/26°C and a photoperiod of 16 h/8 h (day/night). Huamian 3097 (HM3097, Gossypium hirsutum L.), a commercialized Bt (Bacillus thuringiensis) transgenic cotton cultivar was used in this study.
Cotton seeds of uniform size and color were selected and sown in plastic bowls (8 × 8 cm) filled with vermiculite. Four seeds were evenly distributed in each bowl, and the medium was saturated with distilled water before placing the bowls on a culture shelf. Approximately 6 days (d) after sowing, when the cotyledons had fully expanded, the seedlings were carefully washed and transplanted into nutrient solutions with varying N levels (0, 0.04, 0.4, 1, 4, 8 mM Ca(NO3)2, designated as N0, N0.04, N0.4, N1, N4, N8, respectively). The nutrient solution was contained in black plastic pots (27 × 18 × 7.5 cm), with six uniformly sized seedlings secured in each pot using a black foam board. Seedling growth was monitored daily, and significant variations in root morphological characteristics under different N treatments were observed by 7 d post-treatment. Therefore, samples were collected weekly from 7 to 28 d after treatment. To maintain precise records of total N input, the nutrient solution was not replaced periodically throughout the experiment. Each treatment pot received 2.5 L of the respective nutrient solution at 0 d, with the initial water level marked for reference. Following the 14-d sampling, each remaining pot was supplemented with 1.2 L of fresh nutrient solution corresponding to the treatment concentration. After 21-d sampling, deionized water was added to the remaining pots to restore the initial water level, ensuring adequate water supply and stable growth conditions. Consequently, the total nutrient solution volumes were maintained at 2.5 L per pot for 7-d and 14-d samples, and 3.7 L for 21-d and 28-d samples. Additionally, the nutrient solution was gently stirred daily to ensure homogeneous distribution of salts and nutrients.
The nutrient solution was based on a modified version of the Hoagland nutrient solution formula with slight adjustments (Iqbal et al. 2020), including macro-elements: 1 mM KH2PO4, 2.5 mM K2SO4 and 2 mM MgSO4•7H2O, six treatments of N0, N0.04, N0.4, N1, N4, and N8 contained 0, 0.04, 0.4, 1, 4, 8 mM Ca(NO3)2•4H2O, respectively; micro-elements: 0.1 mM H3BO3, 29.9 μM ZnSO4•7H2O, 0.1 μM CuSO4•5H2O, 5.0 μM KI, 0.1 mM MnSO4•4H2O, 1.0 μM Na2MoO4•2H2O, 0.2 μM CoCl2•2H2O; and EDTA-Fe2+ solution: 0.05 mM FeSO4•7H2O and 0.05 mM EDTA-Na2. Based on established protocols from previous studies (Jiang et al. 2017; Iqbal et al. 2020), the Ca2⁺ concentration in each treatment was adjusted to 4 mM using CaCl2, with the exception of the N8 treatment that contained 8 mM Ca(NO3)2. This approach was validated by preliminary experimental data showing no significant effects of varying Ca concentrations (4–8 mM) on cotton seedling growth performance (Supplementary Fig. S1). The initial pH of the nutrient solution was set to 6.7 ± 0.1.
Methods
At each sampling time, 12 cotton seedlings were randomly selected for morphological and biomass analyses per treatment. Seedling height was measured from the lateral root initiation point to the apical meristem, and stem diameter was recorded at the cotyledonary node using digital calipers. The number of fully expanded true leaves was counted for each seedling. Fully expanded true leaves and intact root systems were scanned using a Microtek Phantom 9900XL Plus scanner at 400 dpi resolution. True leaf area was quantified using ImageJ software, while root morphological parameters (total length, surface area, average diameter, and forks) were analyzed with the Wanshen LA-S Plant Image Analysis System.
Following harvest, seedlings were dissected into roots, stems, and leaves. All samples were firstly heat-deactivated at 105°C for 30 min, followed by oven-drying at 75°C to constant weight. The dry biomass of each organ (roots, stems, and leaves) was recorded individually. Total plant biomass was calculated as the sum of all organ weights, and biomass allocation proportion (root, stem and leaf) was calculated as follow: Biomass distribution (%) = Organ biomass/Total plant biomass × 100%.
The dried shoots and roots were homogenized separately and ground to fine powder. For each sample, 0.2 g aliquots were weighed into heat-resistant digestion tubes and completely immersed in 5 mL of concentrated H2SO4. The samples were subsequently digested using the H2SO4-H2O2 method in an infrared digestion furnace until complete clarification. The digestates were filtered and diluted to appropriate concentrations with deionized water. N and P concentrations were quantified using an automated chemical analyzer (Smartchem 200, AMS Alliance), whereas K and Ca concentrations were determined by flame photometry (FP6431, INESA). All analyses were performed with three biological replicates per treatment. NUE and the concentrations/distribution ratios of N, P, K, and Ca were calculated as follows:
Note: NUpE: N uptake efficiency, NUtE: N utilization efficiency, c (mg/L): sample concentration, VT (L): sample extraction volume, m0 (g·DW): sample mass.
Statistical analysis
All statistical analyses were performed using SPSS 22.0 (IBM Corp., USA). Data are presented as mean ± standard error (s.e.). Treatment effects were evaluated through one-way ANOVA, with significant differences (α = 0.05) further analyzed using Duncan’s multiple range test. Multivariate analyses included hierarchical clustering with z-score normalized data using Manhattan distance, visualized via heatmap; principal component analysis (PCA) with varimax rotation, and Pearson correlation analysis to quantify variable relationships. All figures were created using Origin 2021 (OriginLab, USA).
Results
Response of shoot growth to N levels
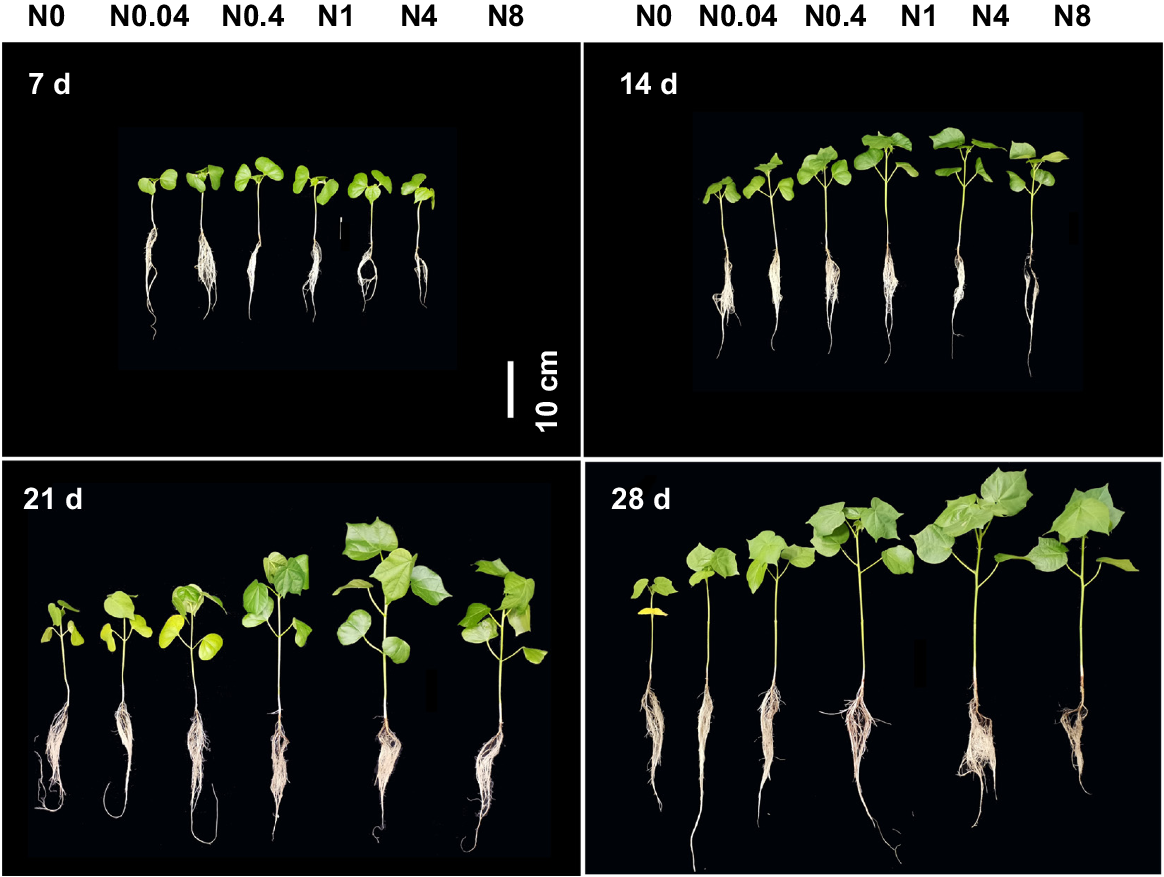
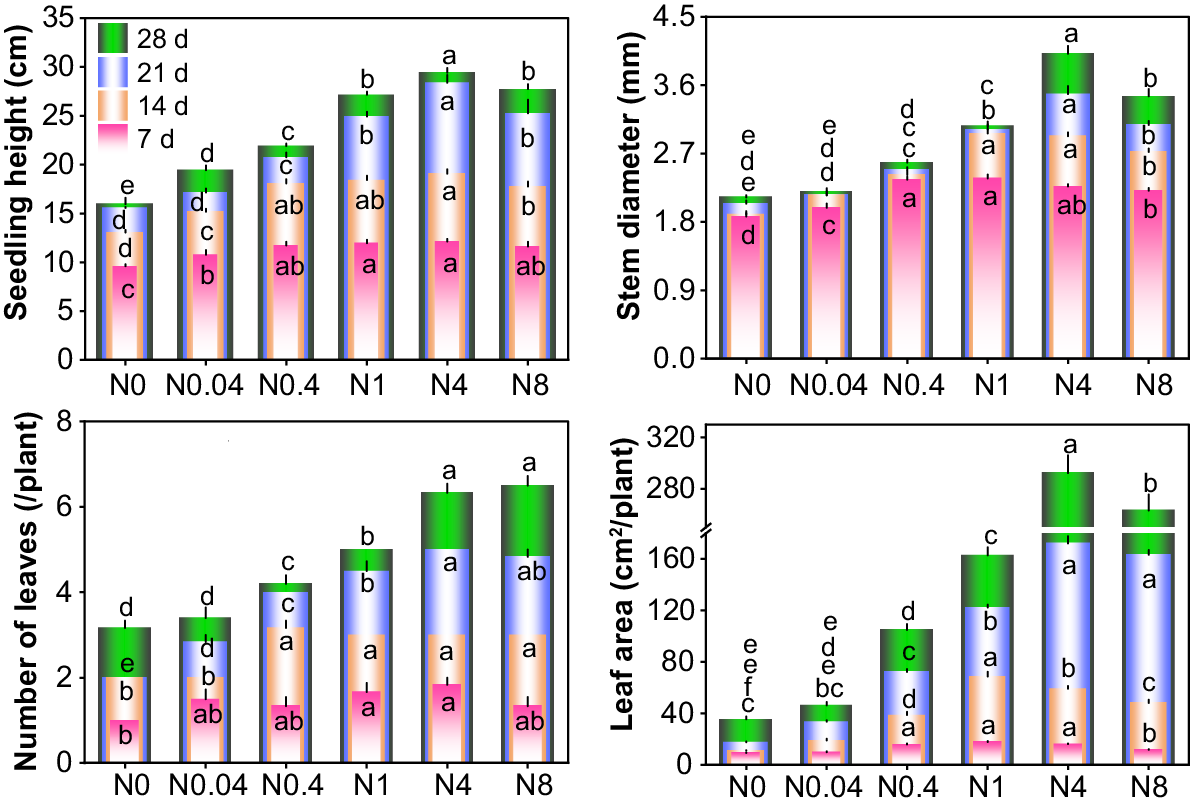
The shoot growth of cotton seedlings exhibited significant responses to different N levels across various treatment durations (Figs 1 and 2). At each treatment duration, plant height, stem diameter, leaf number and area first increased and subsequently decreased with rising N levels, with peak values observed at 0.4, 0.4–1 and 4 mM Ca(NO3)2 for 7 d, 14 d and 21–28 d-old seedlings, respectively. At 7 d, the differences in plant height, stem diameter, leaf number, and leaf area among treatments were relatively small. Compared to the control (N0), N0.04–N8 increased plant height by 12.3%, 22.2%, 24.7%, 26.4%, and 21.0%; stem diameter by 6.3%, 26.0%, 27.0%, 21.2%, and 18.3%; leaf number by 50.0%, 33.3%, 66.7%, 83.3%, and 33.3%; and leaf area by 6.2%, 70.0%, 91.2%, 72.7%, and 26.0%, respectively. All growth parameters exhibited continuous increases with prolonged treatment durations. By 28 d, compared to 7 d, N0–N8 showed increases in plant height by 66.3%−142.6%, stem diameter by 9.5%−77.1%, leaf number by 126.7%−387.5%, and leaf area by 280.0%−2146.7%. Relative to N0, N0.04–N8 at 28 d enhanced plant height by 21.7%, 37.3%, 70.1%, 84.3%, and 73.8%; stem diameter by 3.7%, 21.7%, 44.5%, 89.4%, and 63.0%; leaf number by 7.3%, 32.5%, 57.7%, 99.8%, and 105.0%; and leaf area by 30.7%, 196.8%, 360.7%, 726.5%, and 644.3%, respectively. N deficiency exerted more pronounced effects on leaf area and stem diameter.
Phenotypes of cotton seedlings at different periods under different N levels. d: days after treatment, N0~N8 represents 0, 0.04, 0.4, 1, 4, 8 mM Ca(NO3)2, respectively.
Effects of N levels on shoot growth in cotton seedlings. d: days after treatment. N0~N8 represents 0, 0.04, 0.4, 1, 4, 8 mM Ca(NO3)2, respectively. Different lowercase letters in the same row indicate significant differences among different treatments at the same day (P < 0.05). The lowercase letters in the same column, arranged from bottom to top, are the significance analysis identifiers of 7 d, 14 d, 21 d and 28 d respectively.
Response of root growth to N levels
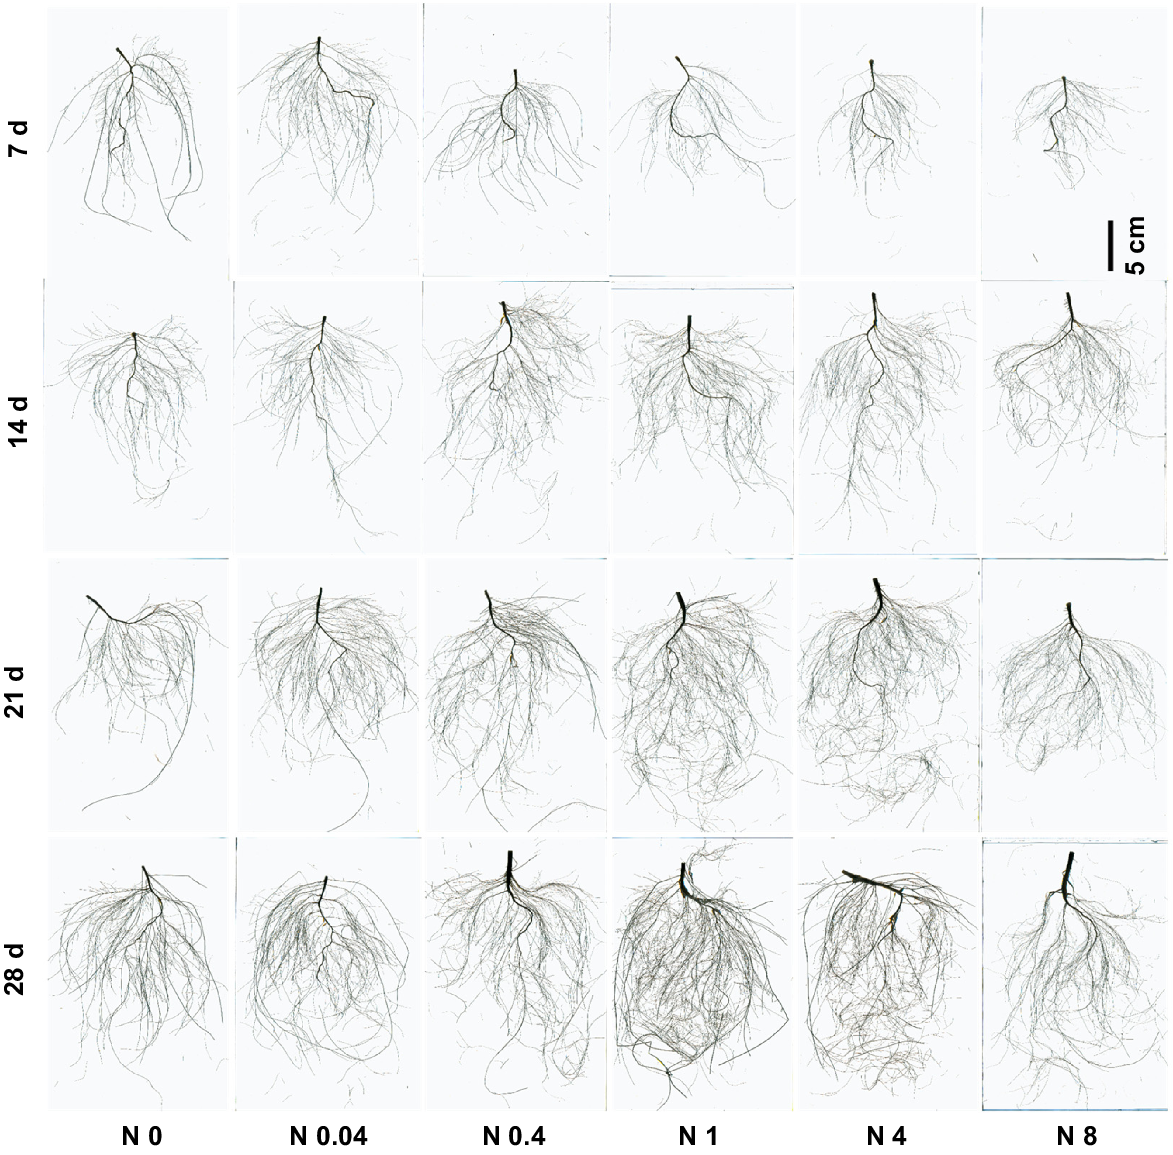
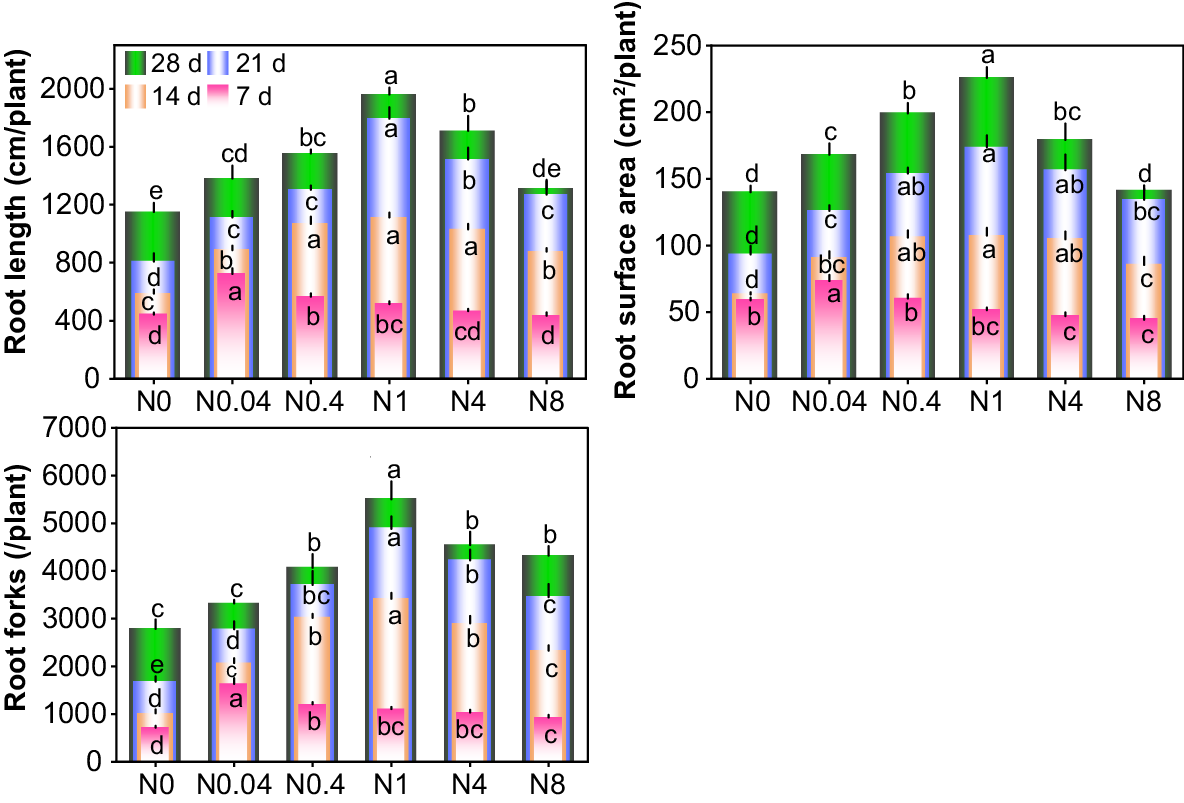
Cotton seedling root growth showed a significant response to different N levels across various treatment durations (Figs 3 and 4). At each treatment duration, root length, surface area, and forks followed a trend of initial increase and subsequent decrease with rising N levels. Optimal root development occurred with N0.04, N0.4, and N1 at 7 d, 14 d, and 21–28 d, respectively, maximizing all measured root parameters. At 7 d, differences among treatments were relatively small, but the N0.04 treatment significantly outperformed others, increasing root length, root surface area, and root forks by 63.3%, 24.7%, and 128.7%, respectively, compared to N0. As the treatment durations extended, root length, surface area, and forks continued to increase, with growing disparities among treatments. At 28 d, N0–N8 exhibited 90.9%−280.1% increases in root length, 129.2%−337.5% in root surface area, and 103.2%−397.8% in root forks compared to 7 d. Relative to N0, N0.04–N8 at 28 d enhanced root length by 20.0%, 35.1%, 70.4%, 48.6%, and 13.9%; root surface area by 20.0%, 42.2%, 61.2%, 28.0%, and 1.0%; and root forks by 19.1%, 45.9%, 97.4%, 63.0%, and 55.1%, respectively. Moderate N reduction substantially promoted both root elongation and proliferation.
Root morphology of cotton seedlings at different periods under different N levels. d: days after treatment. N0~N8 represents 0, 0.04, 0.4, 1, 4, 8 mM Ca(NO3)2, respectively.
Effects of N levels on root growth of cotton seedlings. d: days after treatment. N0~N8 represents 0, 0.04, 0.4, 1, 4, 8 mM Ca(NO3)2, respectively. Different lowercase letters in the same row indicate significant differences among different treatments at the same day (P < 0.05). The lowercase letters in the same column, arranged from bottom to top, are the significance analysis identifiers of 7 d, 14 d, 21 d and 28 d respectively.
Response of biomass accumulation and distribution to N levels
The responses of cotton seedling root, stem, leaf, and whole-plant biomass to different N levels varied significantly across treatment durations (Fig. 5). At each treatment duration, the biomass of roots, stems, leaves, and whole plants initially increased and subsequently decreased with increasing N levels. The optimal N levels for maximum whole-plant biomass were 0.4, 1, and 4 mM Ca(NO3)2 at 7 d, 14 d, and 21–28 d, respectively, that were significantly higher than in other treatments. Initial treatment duration (7 d) showed limited shoot biomass variation but significant root biomass differences among treatments. Progressive treatment durations revealed consistent biomass increases across all organs, with treatment effects becoming more pronounced. Compared to 7 d, the root biomass of N0–N8 at 28 d increased by 313.3%, 264.8%, 349.2%, 645.2%, 734.6%, and 488.1%; stem biomass increased by 417.1%, 544.9%, 953.2%, 1317.6%, 1885.7%, and 1406.0%; and leaf biomass increased by 113.8%, 171.6%, 291.9%, 456.4%, 868.9%, and 730.5%, respectively. Relative to N0, N0.04–N8 at 28 d exhibited increases in root biomass by 14.9%, 41.9%, 50.0%, 43.9%, and 1.1%; stem biomass by 46.1%, 124.7%, 207.2%, 333.1%, and 178.4%; and leaf biomass by 27.8%, 120.4%, 195.2%, 419.1%, and 297.9%, respectively. N deficiency had a greater impact on shoot biomass than root biomass.
Effects of N levels on biomass accumulation of cotton seedlings. d: days after treatment. N0~N8 represents 0, 0.04, 0.4, 1, 4, 8 mM Ca(NO3)2, respectively. Different lowercase letters in the same row indicate significant differences among different treatments at the same day (P < 0.05). The lowercase letters in the same column, arranged from bottom to top, are the significance analysis identifiers of 7 d, 14 d, 21 d and 28 d respectively.
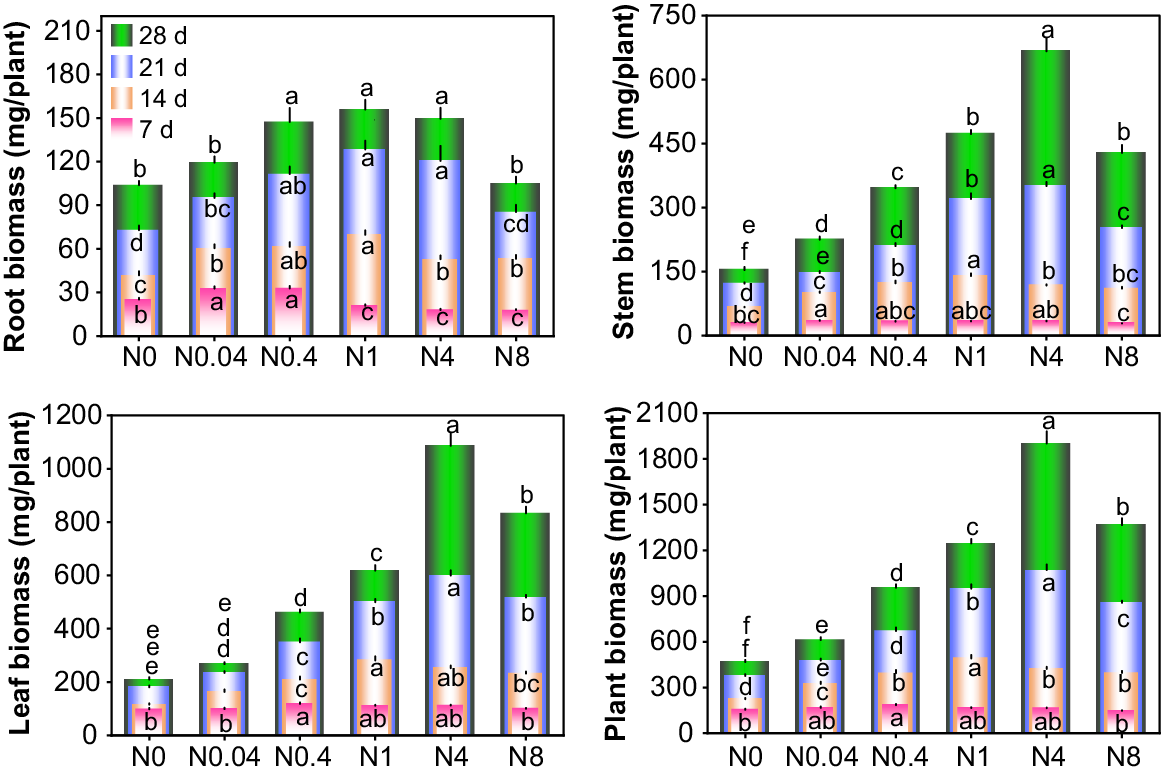
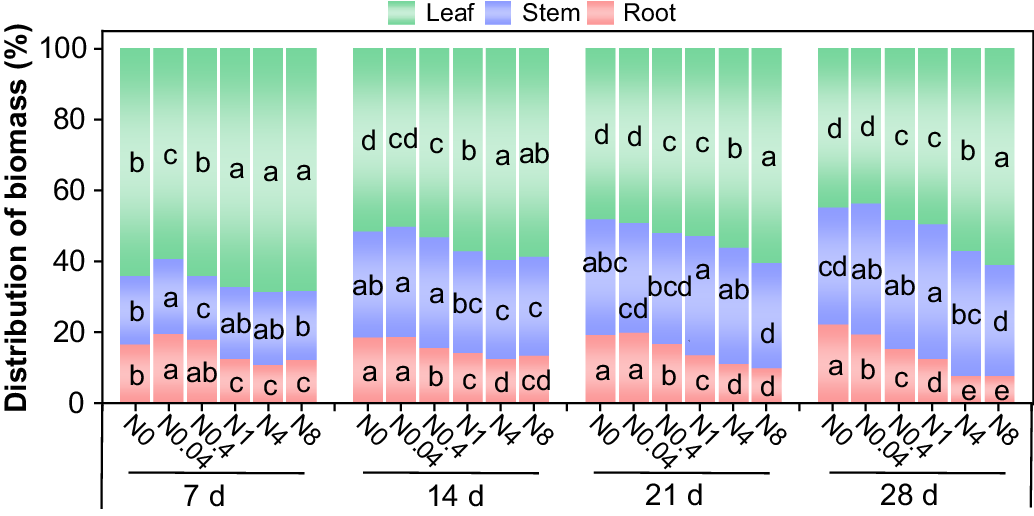
At all treatment durations, the root biomass proportion decreased with increasing N levels, whereas the leaf biomass proportion exhibited an opposite trend and the stem biomass proportion was less affected by N levels (Fig. 6). Across all treatments, the root biomass proportion ranged from 7.7% to 22.3%, the stem from 17.9% to 38.0%, and the leaf from 43.8% to 68.6% within 28 d. Root (except N0) and leaf biomass proportion gradually declined with prolonged treatment durations, while the stem biomass proportion increased progressively.
Response of macronutrient concentration to N levels
The responses of N concentration in cotton seedling roots and shoots to N levels differed significantly (Fig. 7a, b). Overall, the N concentrations in both roots and shoots increased with rising N supply across all treatment durations, with N4 and N8 exhibiting comparable N concentrations that were significantly higher than in other treatments. Over time, the N concentrations in roots and shoots gradually declined in all treatments, and the differences among treatments became more pronounced. By 28 d, compared to 7 d, the root N concentrations in N0-N8 decreased by 48.7%, 53.0%, 62.5%, 59.2%, 25.8%, and 25.2%, respectively, while shoot N concentrations decreased by 69.6%, 73.1%, 69.8%, 59.6%, 25.8%, and 23.1%, respectively. Relative to N0, the average root N concentrations in N0.4-N8 across the four sampling periods were 19.4%, 38.2%, 118.4%, and 122.1% higher, respectively, whereas shoot N concentrations were 33.0%, 69.0%, 138.0%, and 147.4% higher than N0. During the seedling stage, the root N concentration ranged from 1.0% to 3.5%, while the shoot N concentration varied between 0.7% and 4.2%.
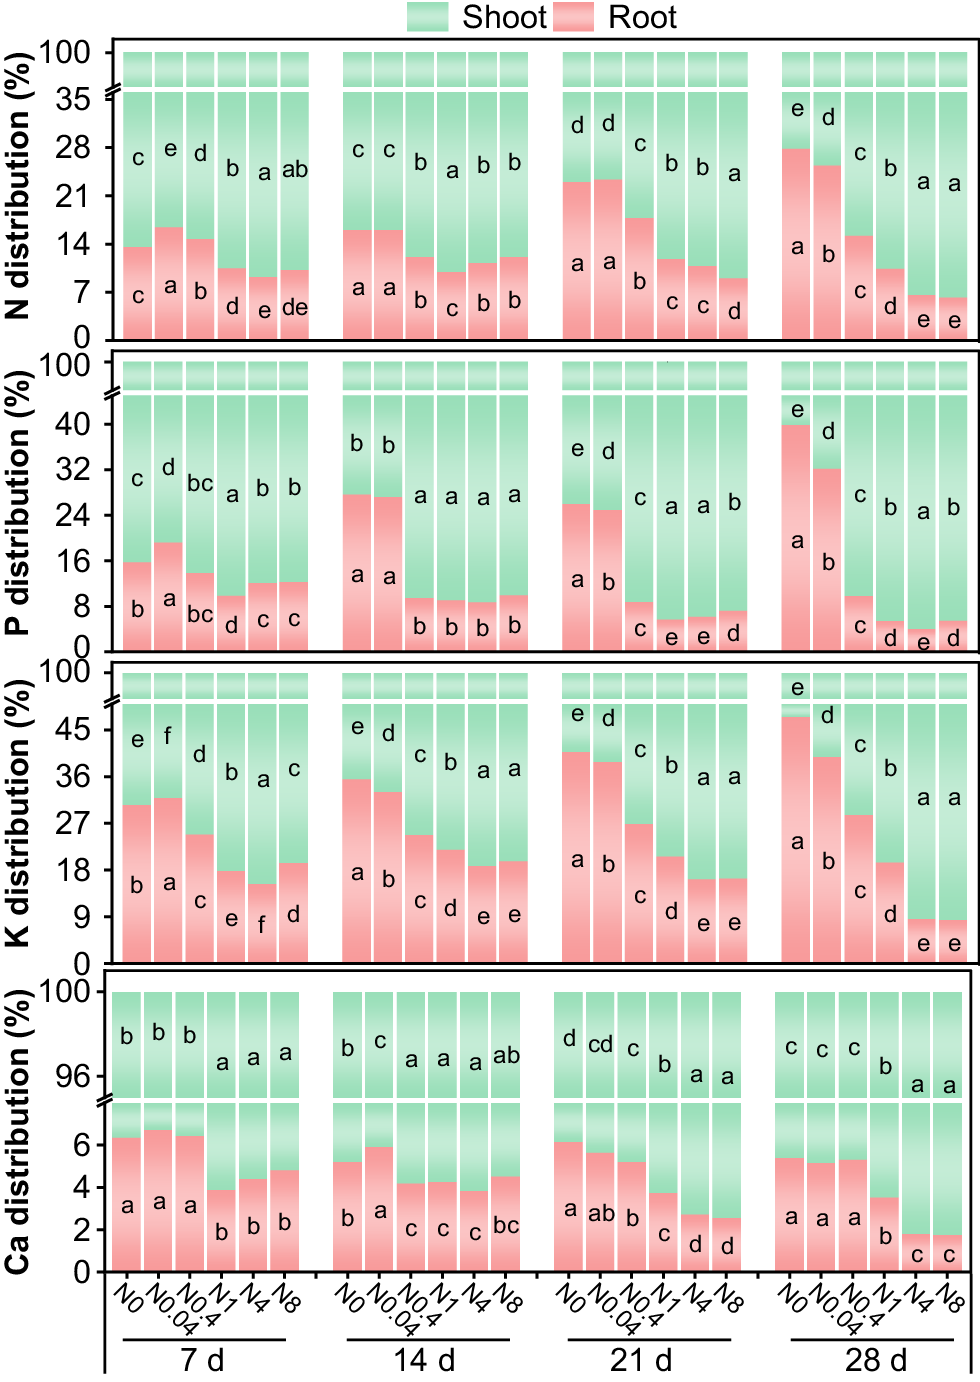
Effects of N levels on macronutrient concentrations of cotton seedlings. (a), (c), (e), (g) represent the concentrations of N, P, K and Ca in seedling roots, respectively; (b), (d), (f), (h) represent the concentrations of N, P, K, and Ca in seedling shoots, respectively. d: days after treatment. N0~N8 represents 0, 0.04, 0.4, 1, 4, 8 mM Ca(NO3)2, respectively. Different lowercase letters indicate significant difference between different treatments (P < 0.05).
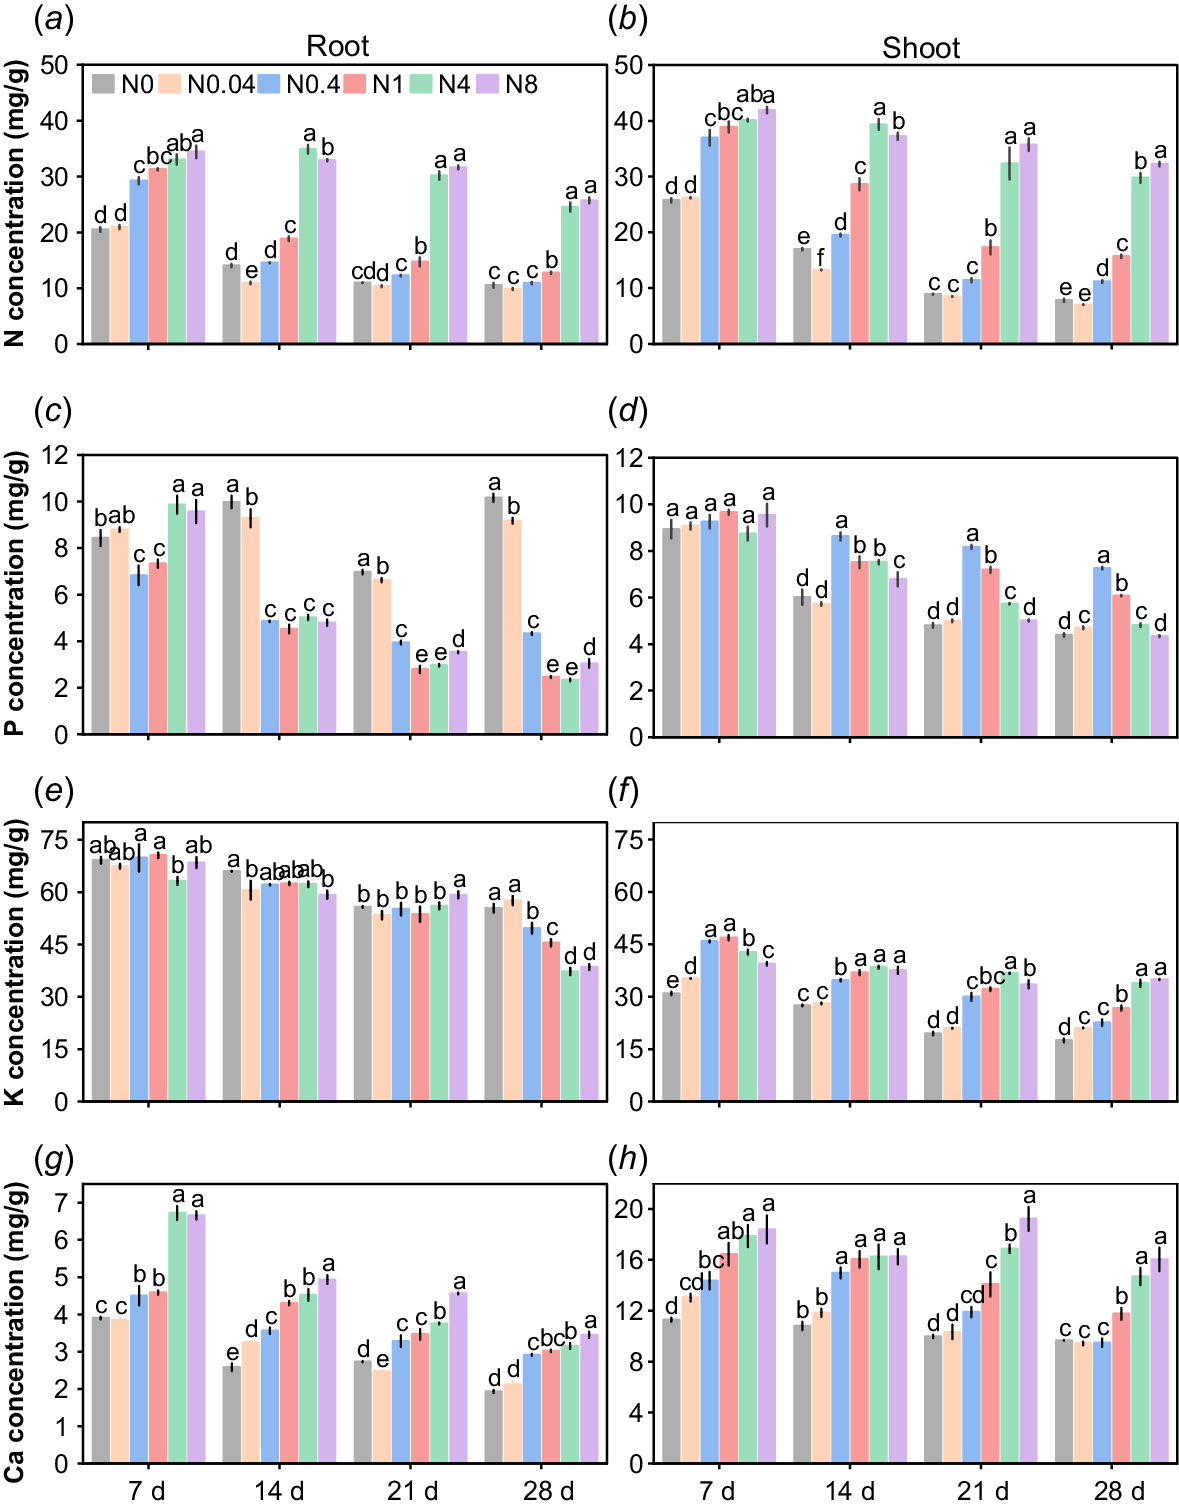
The responses of P concentration to N levels in roots and shoots of cotton seedlings exhibited significant differences (Fig. 7c, d). At 7 d, the root P concentration initially decreased and subsequently increased with rising N levels, with N4 and N8 showing comparable P concentrations that were significantly higher than other treatments. In contrast, no differences were observed in shoot P concentration among treatments. From 14 d to 28 d, root P concentration decreased with increasing N levels, with N0 and N0.04 exhibiting significantly higher root P concentrations than other treatments. Meanwhile, shoot P concentration initially increased and subsequently decreased, with N0.4-N1 showing significantly higher shoot P concentrations than other treatments. With prolonged treatment durations, root P concentrations in N0.4-N8 and shoot P concentrations in N0-N8 gradually declined. Compared to 7 d, at 28 d, the root P concentrations in N0 and N0.04 increased by 20.5% and 4.3%, respectively, whereas those in N0.4-N8 decreased by 36.6%, 66.4%, 76.4%, and 68.1%, respectively. Shoot P concentrations in N0-N8 decreased by 50.9%, 48.2%, 21.6%, 37.1%, 45.0%, and 54.5%, respectively. Compared to N0, the average root P concentrations across four time points in N0.04-N8 decreased by 4.7%, 43.8%, 51.9%, 43.2%, and 41.1%, respectively, while the average shoot P concentrations increased by 1.4%, 37.9%, 26.0%, 11.0%, and 6.3%, respectively. The root P concentration of cotton seedlings ranged from 0.2% to 1.0%, while the shoot P concentration ranged from 0.4% to 1.0%.
Root K concentration in cotton seedlings showed a limited response to varying N levels (Fig. 7e). From 7 to 21 d, root K concentrations exhibited minimal differences among treatments. However, by 28 d, root K concentration decreased significantly with increasing N supply. In shoots, K concentration at 7 d initially increased and subsequently decreased with rising N levels, with N0.4-N1 treatments showing significantly higher K concentrations than others. From 14 to 28 d, shoot K concentration increased with N supply, and N4-N8 treatments had significantly higher K concentrations than other treatments (Fig. 7f). Compared to N0, the average root K concentrations across four time points in N0.04-N8 decreased by 2.9%, 3.9%, 5.7%, 11.1%, and 8.4%, respectively. Conversely, average shoot K concentrations increased by 10.4%, 39.4%, 49.5%, 59.0%, and 52.4%, respectively. Over time, both root and shoot K concentrations gradually declined. Compared to 7 d, root K concentrations at 28 d in N0-N8 decreased by 14.6%−43.7%, while shoot K concentrations decreased by 11.5%−50.6%. During the seedling stage, root K concentrations ranged from 3.7% to 7.1%, whereas shoot K concentrations ranged from 1.8% to 4.7%.
The responses of Ca concentration to N levels in cotton seedling roots and shoots differed significantly (Fig. 7g, h). Overall, at all treatment durations, the Ca concentrations in both roots and shoots gradually increased with rising N levels, with significant differences observed among most treatments. Compared to N0, the average root Ca concentrations under N0.04-N8 increased by 4.6%, 27.8%, 37.8%, 62.8%, and 75.7% across the four treatment durations, respectively, while the average shoot Ca concentrations increased by 6.9%, 21.4%, 39.6%, 57.3%, and 67.4%, respectively. Over time, Ca concentrations in both roots and shoots gradually declined. By 28 d, compared to 7 d, the root Ca concentrations in N0-N8 decreased by 34.2%−53.0%, and shoot Ca concentrations decreased by 12.8%−34.0%. The Ca concentrations in cotton seedling roots ranged from 0.2% to 0.7%, while in shoots, this ranged from 1.0% to 1.9%.
Response of macronutrient accumulation and distribution to N levels
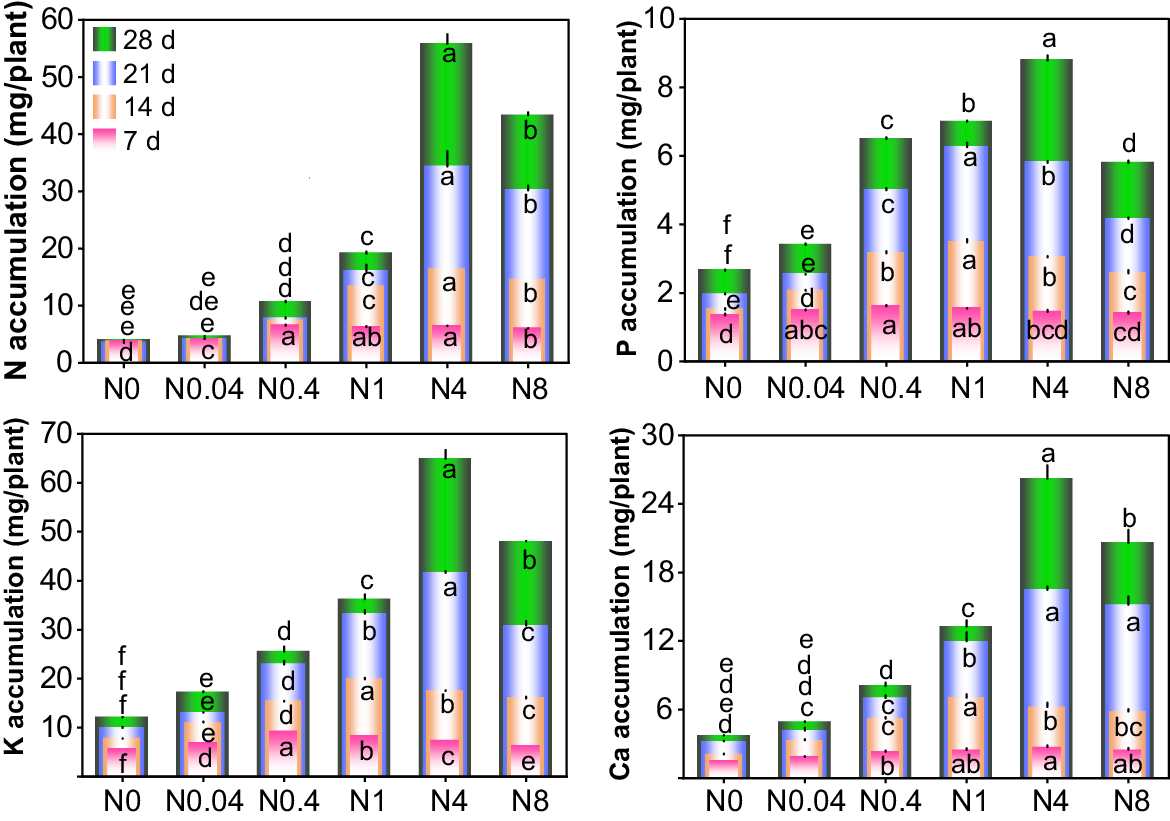
The accumulation of N, P, K, and Ca in cotton seedlings varied significantly in response to different N levels and treatment durations (Fig. 8). At each treatment duration, the accumulation of N, P, K, and Ca initially increased and subsequently decreased with rising N levels. Overall, the N0.4, N1, and N4 treatments exhibited the highest nutrient accumulation (or were statistically equivalent to the highest values) at 7 d, 14 d, and 21–28 d. At 7 d, differences in nutrient accumulation among treatments were minor, but as the treatment durations extended, accumulation gradually increased, and inter-treatment differences became more pronounced. Compared with 7 d, the N accumulation in N0.04-N8 at 28 d increased by 11.0%, 63.1%, 204.7%, 767.5%, and 621.1%, respectively; P accumulation in N0-N8 increased by 96.3%, 127.4%, 301.9%, 352.8%, 506.0% and 313.8%; K accumulation increased by 112.8%, 149.8%, 178.3%, 339.4%, 782.0%, and 662.7%; and Ca accumulation increased by 141.1%, 162.1%, 249.6%, 437.9%, 862.3%, and 727.5%, respectively. Relative to N0 at 28 d, N0.04-N8 showed 17.7%, 170.0%, 384.9%, 1317.2%, and 999.9% increases in N accumulation; 28.4%, 145.2%, 164.3%, 231.6%, and 118.6% increases in P accumulation; 42.5%, 111.2%, 199.5%, 436.3%, and 297.0% increases in K accumulation; and 31.8%, 117.5%, 257.8%, 605.7%, and 454.1% increases in Ca accumulation, respectively. The maximum accumulations of N, P, K, and Ca during the seedling stage were 55.8, 8.8, 64.9, and 26.2 mg/plant, respectively. Across all treatment durations, the ratio of maximum accumulations of N, P, K, and Ca was approximately 1.0:0.2:1.2:0.5 (Table 1).
Effects of N levels on macronutrient accumulation of cotton seedlings. d: days after treatment. N0~N8 represents 0, 0.04, 0.4, 1, 4, 8 mM Ca(NO3)2, respectively. Different lowercase letters in the same row indicate significant differences among different treatments at the same day (P < 0.05). The lowercase letters in the same column, arranged from bottom to top, are the significance analysis identifiers of 7 d, 14 d, 21 d and 28 d respectively.
| Time | Maximum macronutrients accumulation (mg/plant) | Ratio of N:P:K:Ca | ||||
|---|---|---|---|---|---|---|
| N | P | K | Ca | |||
| 7 d | 6.5 | 1.6 | 9.2 | 2.7 | 1.0:0.2:1.4:0.4 | |
| 14 d | 16.4 | 3.5 | 19.9 | 7.0 | 1.0:0.2:1.2:0.4 | |
| 21 d | 34.3 | 6.3 | 41.6 | 16.5 | 1.0:0.2:1.2:0.5 | |
| 28 d | 55.8 | 8.8 | 64.9 | 26.2 | 1.0:0.2:1.2:0.5 | |
| Average | 28.3 | 5.0 | 33.9 | 13.1 | 1.0:0.2:1.2:0.5 | |
Note: The nutrient accumulation on 7 d, 14 d, 21–28 d in the table is the nutrient accumulation of the optimal N treatment (N0.4 for 7 d, N1 for 14 d, N4 for 21–28 d) in each period, and the nutrient accumulation in the optimal N treatment is the highest or has no significant difference from the maximum value.
At each treatment duration, the allocation ratios of N, P, K, and Ca in cotton seedling roots generally decreased with increasing N levels, while the nutrient allocation ratios in shoots gradually increased (Fig. 9). During the 28-d seedling phase, the allocation ratios of N, P, K, and Ca in roots ranged from 6.2% to 27.8%, 4.0% to 39.8%, 8.4% to 47.5%, and 1.8% to 6.8%, respectively. Root allocation ratios of N, P, and K in the N0 and N0.04 treatments gradually increased with prolonged treatment durations, whereas those in the N4 and N8 treatments gradually decreased, with minimal changes observed in the N0.4 and N1 treatments. In contrast, the root Ca allocation ratio declined over time across all treatments. At 28 d, compared to N0, the root N allocation ratios in N0.04-N8 decreased by 8.9%, 45.4%, 62.6%, 76.4%, and 77.6%, respectively; the P allocation ratios decreased by 19.3%, 75.3%, 86.3%, 90.0%, and 86.1%; the K allocation ratios decreased by 16.2%, 39.7%, 58.8%, 81.9%, and 82.3%; and the Ca allocation ratios decreased by 4.6%, 1.3%, 34.5%, 66.7%, and 67.3%, respectively.
Response of N uptake and utilization efficiency to N levels
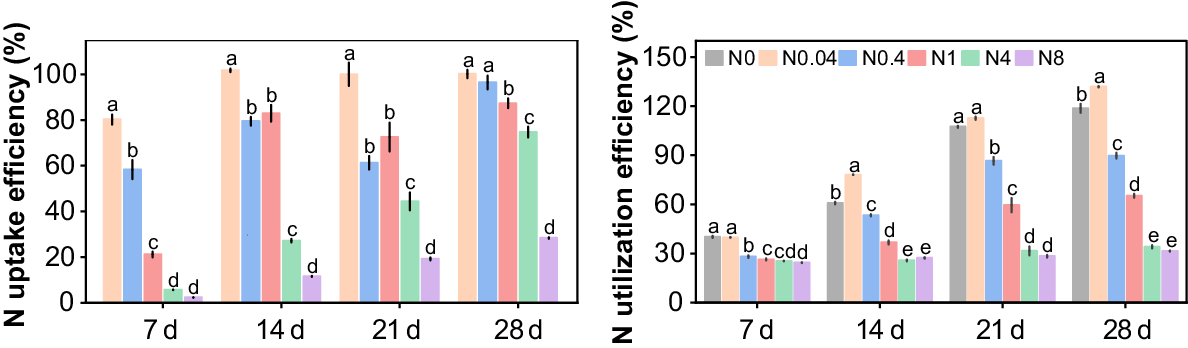
Overall, the NUpE and NUtE gradually decreased with increasing N levels at all treatment durations, but improved over time across most treatments (Fig. 10). At 7 d, the NUpE of N0.04 and N0.4 were significantly higher than that of other treatments, both exceeding 50%, whereas N1-N8 exhibited much lower NUpE, ranging only from 2.4% to 21.1%. The NUpE of N0.04-N1 increased to over 60% from 14 d to 21 d, while that of N4–N8 remained below 45%. By 28 d, the NUpE of N0.04-N4 rose further to above 70%, whereas N8 showed a much lower efficiency of only 28.4%. Over time, the NUtE of N0-N1 continued to increase, while that of N4–N8 exhibited minor fluctuations with no significant differences among them. Compared to 7 d, the NUtE of N0-N8 at 28 d increased by 195.4%, 231.7%, 218.9%, 147.3%, 34.2%, and 29.3%, respectively. Furthermore, at 28 d, the NUtE of N0.04 was 11.1% higher than that of N0, whereas N0.4–N8 showed a progressive decline in NUtE by 24.4%, 45.0%, 71.3%, and 73.4%, respectively.
The optimal N levels for cotton seedling growth and key traits influencing NUE
Simultaneous clustering analysis was performed on the measured parameters across four treatment durations and six N levels, with rows (measured parameters) and columns (N levels) clustered independently. The results revealed significant differences in the clustering patterns of N levels across different treatment durations (Fig. 11a), whereas the clustering of measured parameters remained consistent. Therefore, the clustering results of traits measured at 28 d were selected as representative for visualization (Fig. 11b). Based on seedling growth status, biomass, nutrient accumulation and N-level clustering, the six N levels were classified into two major groups: low N and sufficient N. The sufficient N group encompassed both optimal and high N levels. Specifically, the low N groups at 7 d, 14 d, 21 d, and 28 d were N0-N0.04, N0-N0.04, N0-0.4, and N0-N1, respectively, while the optimal N levels or ranges were 0.4, 0.4–1, 1–4, and 4–8 mM Ca(NO3)2 for 7 d, 14 d, 21 d, and 28 d, respectively. Based on a comprehensive comparison of the growth status, biomass and nutrient accumulation of seedlings in each treatment, 0.4, 0.4–1, 1–4 and 4–8 mM Ca(NO3)2 were finally determined as the optimal N levels or ranges for the growth of seedlings at 7 d, 14 d, 21 d and 28 d, respectively, as these treatments consistently promoted the best growth, highest biomass, and maximal nutrient accumulation (Figs 1, 2, 5, and 8).
Cluster analysis of N levels at different treatment durations and growth-related trait indices of 28-d-old seedlings. (a) Partial dendrogram of the complete cluster heatmap (column clustering by N levels at four sampling time; full heatmap not shown to avoid redundancy). (b) Representative complete heatmap showing clustering results based on trait indices measured at 28 d. LN, SN, ON, and HN represent low N, sufficient N, optimal N, and high N treatments, respectively. d: days after treatment. N0~N8 represents 0, 0.04, 0.4, 1, 4, 8 mM Ca(NO3)2, respectively.
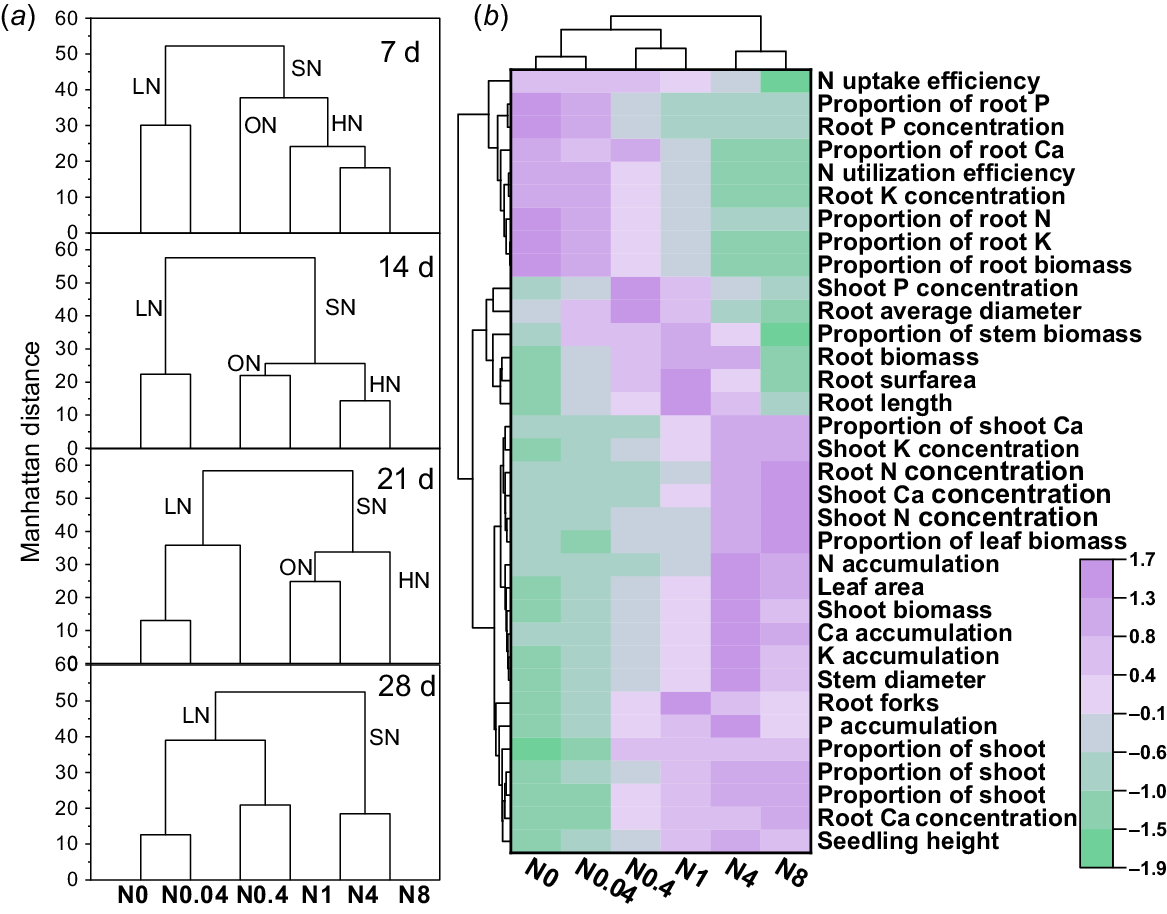
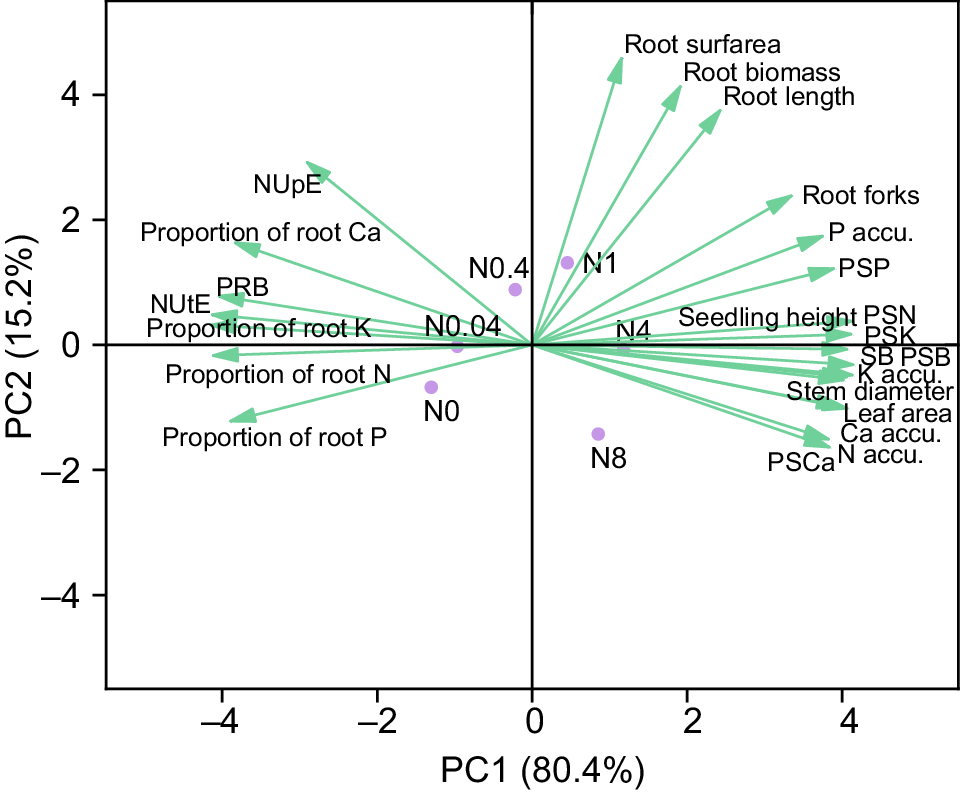
Growth parameters exhibited two contrasting response patterns to N supply. The first pattern showed progressive decline with increasing N levels and included: NUpE, NUtE, root biomass proportion, root nutrient proportions (N, P, K, Ca), and root P/K concentrations. The second pattern demonstrated positive responses to N and further differentiated into two subgroups: one displaying unimodal responses that peaked at N0.4-N1 treatments including root architectural parameters (length, surface area, average diameter, biomass) and stem biomass proportion; the other showing continuous increases up to the highest N treatments (N4-N8) for shoot growth metrics, nutrient accumulation and shoot nutrient proportions. Both cluster and principal component analyses consistently demonstrated significant positive correlations between NUE and root biomass proportion, and root nutrient proportions, while shoot growth showed strong positive associations with nutrient accumulation and shoot nutrient proportions (Fig. 12).
Principal component analysis of growth and nutrient uptake related traits in 28-d-old cotton seedlings under different N levels. N0~N8 represents 0, 0.04, 0.4, 1, 4, 8 mM Ca(NO3)2, respectively. SB: shoot biomass, accu.:accumulation; PRB and PSB: proportion of root and shoot biomass; PSN, PSP, PSK, and PSCa: proportion of shoot N, P, K and Ca.
Discussion
Optimal N levels are essential for cotton seedling growth
N serves as a fundamental macronutrient regulating plant growth and development, where maintaining optimal levels proves critical for normal physiological processes (Moreau et al. 2019; Lee et al. 2020; Ma et al. 2023). Our results demonstrate that both N deficiency and excess significantly impair cotton seedling growth (Figs 2, 5). Through comprehensive growth, biomass and nutrient accumulation data analysis, stage-specific optimal N levels were identified as 0.4 mM Ca(NO3)2 at 7 d, 0.4–1 mM at 14 d, 1–4 mM at 21 d, and 4–8 mM at 28 d, as these treatments consistently promoted the most growth, highest biomass, and maximal nutrient accumulation (Figs 1, 2, 5, 8). These results are consistent with those presented in previous reports (Iqbal et al. 2020). Among growth parameters, stem diameter and leaf area exhibited particular sensitivity to N limitation. By 28 d, N0-N1 treatments showed marked reductions in these traits along with cotyledon yellowing and shedding (Fig. 1). This phenotypic response can be attributed to multiple physiological effects induced by N deficiency. N deficiency promotes carbohydrate accumulation that accelerates leaf senescence (Havé et al. 2017; Wei et al. 2020; Asim et al. 2022). As a key constituent of proteins, nucleic acids, and chlorophyll (Iqbal et al. 2020; Lv et al. 2021), N deficiency directly suppresses cell division and expansion (Gao et al. 2014; Zhang et al. 2021b), while reducing chlorophyll content (Lee et al. 2020), thereby impairing photosynthetic capacity (Mu and Chen 2021; De Oliveira Santos et al. 2025). To adapt to low photosynthetic efficiency, plants restrict leaf expansion to minimize transpiration and energy expenditure (Fig. 2). Additionally, under low N conditions, plants adjust carbon and nutrient allocation, prioritizing stem elongation over leaf expansion or stem thickening. This adaptive strategy enhances light capture capacity, sustaining photosynthesis and survival (Zhang et al. 2022) that aligns with the observed increase in stem biomass proportion over time (Fig. 6). Furthermore, N deficiency stimulates ethylene biosynthesis, further inhibiting leaf expansion and stem thickening (Chen et al. 2013).
The influence of N levels on cotton seedling growth exhibited a pronounced dose-dependent effect. Moderate N supplementation significantly enhanced N uptake (Figs 7, 8), facilitating cell division and expansion via increased protein synthesis (Liu et al. 2018; Lee et al. 2020), likely contributing to rapid leaf area expansion (Figs 1, 2). Elevated leaf N concentration also improved photosynthetic efficiency (Liu et al. 2018; Chen et al. 2023), providing the material basis for biomass accumulation that explained the positive correlation between N levels, and shoot growth traits and biomass (Figs 11, 12). However, excessive N triggered a negative feedback mechanism: plants suppressed root growth to restrict N uptake (Fig. 4), potentially disrupting the absorption of other essential nutrients (Figs 7, 8), ultimately leading to nutrient imbalance and growth inhibition (Duncan et al. 2018a; Ali et al. 2020; Ma 2020). Furthermore, high N levels reduce the activity of N-assimilating enzymes (Xin et al. 2019; Liu et al. 2021; Lv et al. 2021), resulting in the accumulation of toxic N metabolites such as ammonia that is a potential mechanism for growth suppression under high N (Coskun et al. 2017; Stevens 2019).
Moderate N reduction promotes root growth in cotton seedlings
As the primary organ for nutrient uptake in plants, Roots play a pivotal role in adapting to various nutrient stresses (Gruber et al. 2013; Chen et al. 2020a; Sager et al. 2020). Our study revealed that moderate N deficiency significantly suppressed shoot growth while markedly stimulating root growth in cotton seedlings (Figs 3, 4). This phenomenon may be attributed to low N accelerating leaf senescence but delaying root senescence (Dong et al. 2012; Havé et al. 2017; Zhu et al. 2021). Suboptimal N availability typically triggers compensatory root growth as an adaptive strategy to enhance nutrient foraging capacity (Feng et al. 2016; Jia et al. 2019; Sager et al. 2020; Sun et al. 2020a). This phenomenon has been well-documented across species: in Arabidopsis thaliana, moderate N deficiency (275–550 μM) promotes primary root elongation, lateral root proliferation, and increased root-shoot ratio (Gruber et al. 2013; Jia et al. 2019). Similarly, wheat or maize seedlings subjected to 0.25–1.0 mM N exhibit enhanced root length, surface area, tips, and biomass (Jiang et al. 2017; Sun et al. 2020a; Lv et al. 2021; Wang et al. 2022). Our experimental results align with the findings reported by Iqbal et al. (2020), who demonstrated that low-to-moderate N treatments (0.5–2 mM) significantly improve various root architectural parameters in cotton, including length, surface area, volume, and biomass. We further reveal that moderate N deficiency can indeed promote root development. This phenomenon may be attributed to the differential N requirements during distinct treatment durations: our data indicate that the optimal N levels [as Ca(NO3)2] for seedling growth were 0.4 mM at 7 d, 1 mM at 14 d, and 4 mM at 21–28 d. Notably, the most robust root systems were consistently observed under lower N treatments (0.04, 0.4, and 1 mM Ca(NO3)2), suggesting that suboptimal N availability may stimulate compensatory root growth during the early developmental stage. However, severe N deprivation (0–0.04 mM) impaired both root and shoot growth (Fig. 5), indicating a threshold requirement at which N sustains normal growth (Gruber et al. 2013; Sager et al. 2020). Notably, root forks, a proxy for lateral root abundance, declined significantly under extreme N limitation, suggesting resource conservation through reduced carbon and N allocation to lateral root development (Gruber et al. 2013; Li et al. 2015; Jia et al. 2019). This aligns with maize responses to N stress, where moderate N deficiency (0.5–5 mM NO3−) enhances axial root elongation while reducing crown root number (Gao et al. 2014; Sun et al. 2020a). Conversely, N oversupply induced negative feedback regulation, suppressing root growth and NUpE, likely reflecting a physiological adjustment to limit excessive N accumulation (Sun et al. 2020a; Oldroyd and Leyser 2020).
N levels modulate nutrient uptake and distribution in cotton seedlings
The accumulation dynamics of N, P, K, and Ca in cotton seedlings showed consistent stage-dependent responses to N levels (Fig. 8), revealing coordinated nutrient uptake patterns. The observed N:P:K:Ca accumulation ratio (1:0.2:1.2:0.5; Table 1) corresponds with reported ratios in mature cotton (1:0.15–0.20:0.88–1.2) (Ma 2020; Ali et al. 2020), confirming conserved nutrient balance mechanisms across growth stage. These findings underscore that N availability systemically regulates the acquisition of other nutrients, emphasizing the need for balanced fertilization to optimize uptake efficiency (Duncan et al. 2018a; Ali et al. 2019).
N accumulation exhibited the strongest response to N levels, followed by K and Ca, while P showed minor variation (Fig. 8). The preferential P retention in roots under N-deficient conditions likely reflects adaptive root morphological changes to enhance nutrient acquisition capacity (Fig. 7), consistent with known P-mediated root architecture modifications (Yang et al. 2014; Duncan et al. 2018a). N availability regulates photosynthesis and C-N metabolism in plants (Iqbal et al. 2020), while K is equally essential for these processes, and for protein synthesis and enzyme activation (Xu et al. 2020; Johnson et al. 2022). Given that photosynthesis and C-N metabolism primarily occur in leaves, N level significantly influences leaf K concentration (Fig. 7). The positive correlation between K+ and NO3− uptake may be due to charge balance or the activation of NO3− assimilating enzymes (Feng et al. 2020; Xu et al. 2020). NO3− is transported from roots to shoots in the xylem with K+ as a counter ion, leading to substantial K+ accumulation in roots under low N supply (Fig. 7) (Feng et al. 2020). Ca, as a structural component of cells, maintains cell wall integrity and membrane stability (Hou et al. 2019; Weng et al. 2022). Increased N concentration promotes plant growth that in turn increases the demand and uptake of Ca (Gruber et al. 2013; Chen et al. 2023). Additionally, Ca moves with water, explaining the higher concentration in shoots than in roots (Fig. 7) (Gao et al. 2020). The prolonged treatment durations resulted in a gradual decline in nutrient concentrations in both roots and shoots (Fig. 7), that can be primarily attributed to a dilution effect caused by substantial biomass accumulation (Fig. 5). Taking N concentration as an example, by 28 d, the total plant biomass in N0-N8 increased to 3.1–12 times their respective 7-d values (Fig. 5), while the corresponding total N accumulation only reached 1.0–8.7 times the initial levels (Fig. 8). This clear disparity demonstrates that biomass growth outpaced N uptake during the experimental period. Furthermore, the declining N availability in the system, particularly pronounced in low-N treatments (N0-N1), contributed to this observed pattern. Although nutrient solution was supplemented after 14 d, this additional supply likely remained insufficient to meet the growth demands of seedlings, especially in N-deficient treatments. Consequently, the reduction in tissue N concentration was more substantial in low-N treatments (48.7%−73.1% decrease in N0-N1) than in N-sufficient groups (23.1%−25.8% decrease in N4-N8).
N levels not only affect plant nutrient uptake but also alter their allocation patterns. Generally, most absorbed N is translocated to shoots or stored in vacuoles as temporary N reserves (Wang et al. 2018; Chen et al. 2020b). However, under stress conditions, absorbed N is preferentially allocated to roots to enhance crop stress resistance (Chen et al. 2016; Jian et al. 2019). Our results demonstrate an inverse relationship between N levels and root nutrient allocation ratio in cotton seedlings (Fig. 9). Under low N conditions, plants strategically allocate limited nutrients to roots to sustain their growth demands (Chen et al. 2023), while simultaneously promoting root expansion to improve nutrient acquisition capacity (Gao et al. 2014; Jia et al. 2019). Furthermore, the transport of nutrients to shoots through the xylem is driven by transpiration and requires energy provided by photosynthesis (Iqbal et al. 2020; Mu and Chen 2021). Therefore, the increase in root nutrient allocation proportion under low N conditions may be due to decreased photosynthetic rate and transpiration.
Key traits influencing N uptake and utilization efficiency in cotton seedlings
NUpE and NUtE represent the plant’s capacity to acquire N from soil and convert absorbed N into harvestable biomass, respectively (Louvieaux et al. 2020; Shah et al. 2022). Growing evidence demonstrates significant positive correlations between NUE and root morphological traits (Li et al. 2015; Liu et al. 2017; Shah et al. 2022; Wang et al. 2022). Notably, root architecture is more influenced by genotype than N concentration (Gao et al. 2014; Iqbal et al. 2020; Shah et al. 2022). Our study confirms that NUE in cotton seedlings is positively correlated with root growth parameters and root nutrient allocation patterns (Figs 11 and 12). As the primary organ for nutrient and water acquisition, root architecture significantly impacts crop biomass and yield (Liu et al. 2017; Louvieaux et al. 2020). Specifically, increased shoot and boll biomass in cotton correlate strongly with root development, with well-developed roots substantially enhancing seed cotton yield (Chen et al. 2020a). This phenomenon is consistent across crops: N-efficient varieties of rapeseed, rice, maize, and wheat consistently exhibit more extensive root systems than their inefficient counterparts (Li et al. 2015; He et al. 2019; Duan 2019; Wang et al. 2022; Xin et al. 2022). Consequently, root growth parameters have become critical criteria for selecting N-efficient cultivars. Enhancing nutrient use efficiency through root system optimization represents a pivotal research direction in agriculture. Modern crop breeding programs increasingly focus on manipulating root morphology to improve productivity, nutrient use efficiency, and reduce N inputs (He et al. 2019; Louvieaux et al. 2020). Our findings provide novel insights for developing N-efficient cotton varieties through root system optimization. Furthermore, enhanced N remobilization capacity plays a crucial role in improving plant NUE. Under low-N conditions, plants typically activate leaf senescence to facilitate source-to-sink N remobilization, thereby sustaining the growth of newly developing tissues, while sufficient N supply generally suppresses this process (Havé et al. 2017; Xiong et al. 2022; Dourmap et al. 2023). Notably, certain low-N-tolerant genotypes exhibit superior N remobilization efficiency that is often associated with higher NUE (Chen et al. 2020b; Padhan et al. 2023). The response of N remobilization to varying external N supply levels and the intricate relationship with NUE warrant further study.
Conclusion
Optimal N ranges for cotton seedling growth at 7, 14, 21 and 28 d after cotyledon expansion were determined to be 0.4, 0.4–1, 1–4 and 4–8 mM Ca(NO3)2, respectively. Under these conditions, seedlings exhibited maximum nutrient accumulation of N, P, K and Ca that were 55.8, 8.8, 64.9, and 26.2 mg/plant at 28 d, respectively, while maintaining consistent N:P:K:Ca ratios of ~1:0.2:1.2:0.5 across seedling stages, revealing an intrinsic nutrient homeostasis mechanism in cotton seedlings. Under low N conditions, nutrients were preferentially allocated to roots, promoting root elongation and proliferation, thereby enhancing NUE. NUE showed positive correlations with root growth traits and root nutrient proportion, whereas shoot growth traits were positively associated with nutrient accumulation and shoot nutrient proportion. This study not only determined the optimal N levels, and requirements and optimal ratios of essential nutrients for seedling growth, but also identified key agronomic traits affecting NUE. These results provide a theoretical foundation for scientific fertilization during the cotton seedling stage to reduce N input while improving NUE. Future research should focus on: (1) elucidating the regulatory mechanisms of different nutrient ratios on crop yield formation and fertilizer use efficiency; and (2) uncovering the molecular basis of root morphological development under N deficiency that will support the breeding of N-efficient cotton varieties with optimized root architecture.
Data availability
All data generated or analysed in this study will be made available on the request.
Conflicts of interest
The authors declare that they have no known competing financial interests or personal relationships that could have appeared to influence the work reported in this paper. Honghong Wu is an Associate Editor for Functional Plant Biology but was not involved in the peer review or decision-making process for this paper.
Declaration of funding
This work was supported by the Hubei Key Research and Development Project (2024BBB065), National Key Research and Development Project (2020YFD1001001), the National Natural Science Foundation of China (31771708), and the Fundamental Research Funds for the Central Universities (2662021PY003, 2662024JC011).
Author contributions
Dandan Chen: conducted experiments, analyzed data, prepared figures, and wrote the manuscript; Zhao Zhang: assisted with experiments; Honghong Wu: supervised the research and revised the manuscript; Guozheng Yang: acquired funding, supervised the research, and revised the manuscript.
Reference
Ali S, Hafeez A, Ma X, Tung SA, Chattha MS, Shah AN, Luo D, Ahmad S, Liu J, Yang G (2019) Equal potassium-nitrogen ratio regulated the nitrogen metabolism and yield of high-density late-planted cotton (Gossypium hirsutum L.) in Yangtze River valley of China. Industrial Crops and Products 129, 231-241.
| Crossref | Google Scholar |
Ali S, Hafeez A, Ma X, Tung SA, Yang G (2020) Relative potassium ratio balanced the carbon-nitrogen assimilation in cotton leaf under reducing nitrogen application. Journal of Soil Science and Plant Nutrition 20, 761-774.
| Crossref | Google Scholar |
Asim M, Guo M, Khan R, Sun Y, Du S, Liu W, Li Y, Wang X, Wang M, Shi Y, Zhang Y (2022) Investigation of sugar signaling behaviors involved in sucrose-induced senescence initiation and progression in N. tabacum. Plant Physiology and Biochemistry 184, 112-125.
| Crossref | Google Scholar | PubMed |
Cai C, Wang Z, Ma L, Xu Z, Yu J, Li F (2024) Cotton stalk valorization towards bio-based materials, chemicals, and biofuels: a review. Renewable and Sustainable Energy Reviews 202, 114651.
| Crossref | Google Scholar |
Chen L, Dodd LC, Theobald JC, Belimov AA, Davies WJ (2013) The rhizobacterium Variovorax paradoxus 5C-2, containing ACC deaminase, promotes growth and development of Arabidopsis thaliana via an ethylene-dependent pathway. Journal of Experimental Botany 64(6), 1565-1573.
| Crossref | Google Scholar |
Chen J, Zhang Y, Tan Y, Zhang M, Zhu L, Xu G, Fan X (2016) Agronomic nitrogen-use efficiency of rice can be increased by driving OsNRT2.1 expression with the OsNAR2.1 promoter. Plant Biotechnology Journal 14(8), 1705-1715.
| Crossref | Google Scholar | PubMed |
Chen J, Liu L, Wang Z, Zhang Y, Sun H, Song S, Bai Z, Lu Z, Li C (2020a) Nitrogen fertilization increases root growth and coordinates the root–shoot relationship in cotton. Frontiers in Plant Science 11, 880.
| Crossref | Google Scholar |
Chen K-E, Chen H-Y, Tseng C-S, Tsay Y-F (2020b) Improving nitrogen use efficiency by manipulating nitrate remobilization in plants. Nature Plants 6(9), 1126-1135.
| Crossref | Google Scholar |
Chen D, Wang J, Peng J, Xie X, Lu L, Du X, Meng L, Yang G (2023) Effects of nitrogen on cotton growth, macronutrients distribution and nitrogen use efficiency. Cotton science 35(6), 473-486.
| Crossref | Google Scholar |
Coskun D, Britto DT, Shi WM, Kronzucker HJ (2017) How plant root exudates shape the nitrogen cycle. Trends in Plant Science 22(8), 661-673.
| Crossref | Google Scholar | PubMed |
Cui J, Fang D, Tian X, Peng J, Chen D, Xu S, Ma L (2023) Sustainable conversion of cottonseed hulls to valuable proanthocyanidins through ultrasound-assisted deep eutectic solvent extraction. Ultrasonics Sonochemistry 100, 106605.
| Crossref | Google Scholar | PubMed |
De Oliveira Santos T, Teixeira do Amaral Junior A, Batista Pinto V, Barboza Bispo R, Campostrini E, Glowacka K, Rohem Simão B, De Paula Bernardo W, Nicácio Viana F, Silveira V, Apolinário de Souza Filho G (2025) Morphophysiological and proteomic profiling unveiling mechanisms underlying nitrogen use efficiency in popcorn (Zea mays var. everta). Plant Physiology and Biochemistry 221, 109581.
| Crossref | Google Scholar | PubMed |
Dong H, Li W, Eneji AE, Zhang D (2012) Nitrogen rate and plant density effects on yield and late-season leaf senescence of cotton raised on a saline field. Field Crops Research 126, 137-144.
| Crossref | Google Scholar |
Dourmap C, Marmagne A, Lebreton S, Clément G, Guivarc’h A, Savouré A, Masclaux-Daubresse C (2023) Carbon and nitrogen remobilization during seed filling in Arabidopsis is strongly impaired in the pyrroline-5-carboxylate dehydrogenase mutant. Journal of Experimental Botany 74(5), 1489-1500.
| Crossref | Google Scholar | PubMed |
Duan P-F (2019) Response of maize genotypes with different nitrogen use efficiency to low nitrogen stresses. Acta Ecologica Sinica 39(1), 77-80.
| Crossref | Google Scholar |
Duncan EG, O’Sullivan CA, Roper MM, Palta J, Whisson K, Peoples MB (2018a) Yield and nitrogen use efficiency of wheat increased with root length and biomass due to nitrogen, phosphorus, and potassium interactions. Journal of Plant Nutrition and Soil Science 181(3), 364-373.
| Crossref | Google Scholar |
Duncan EG, O’Sullivan CA, Roper MM, Biggs JS, Peoples MB (2018b) Influence of co-application of nitrogen with phosphorus, potassium and sulphur on the apparent efficiency of nitrogen fertiliser use, grain yield and protein content of wheat: review. Field Crops Research 226, 56-65.
| Crossref | Google Scholar |
FAO (2022) World fertilizer trends and outlook to 2022. Available at http://openknowledge.fao.org
Feng G, Zhang Y, Chen Y, Li Q, Chen F, Gao Q, Mi G (2016) Effects of nitrogen application on root length and grain yield of rain-fed maize under different soil types. Agronomy Journal 108(4), 1656-1665.
| Crossref | Google Scholar |
Feng H, Fan X, Miller AJ, Xu G (2020) Plant nitrogen uptake and assimilation: regulation of cellular pH homeostasis. Journal of Experimental Botany 71(15), 4380-4392.
| Crossref | Google Scholar | PubMed |
Gao K, Chen F-J, Yuan L-X, Mi G-H (2014) Cell production and expansion in the primary root of maize in response to low-nitrogen stress. Journal of Integrative Agriculture 13(11), 2508-2517.
| Crossref | Google Scholar |
Gao H, Wu X, Zorrilla C, Vega SE, Palta JP (2020) Fractionating of calcium in tuber and leaf tissues explains the calcium deficiency symptoms in potato plant overexpressing CAX1. Frontiers in Plant Science 10, 1793.
| Crossref | Google Scholar | PubMed |
Gruber BD, Giehl RFH, Friedel S, Von Wirén N (2013) Plasticity of the Arabidopsis root system under nutrient deficiencies. Plant Physiology 163(1), 161-179.
| Crossref | Google Scholar | PubMed |
Havé M, Marmagne A, Chardon F, Masclaux-Daubresse C (2017) Nitrogen remobilization during leaf senescence: lessons from Arabidopsis to crops. Journal of Experimental Botany 68(10), 2513-2529.
| Crossref | Google Scholar | PubMed |
He Y, Hu D, You J, Wu D, Cui Y, Dong H, Li J, Qian W (2019) Genome-wide association study and protein network analysis for understanding candidate genes involved in root development at the rapeseed seedling stage. Plant Physiology and Biochemistry 137, 42-52.
| Crossref | Google Scholar | PubMed |
Hou J, Li J, Yang Y, Wang Z, Chang B, Yu X, Yuan L, Wang C, Chen G, Tang X, Zhu S (2019) Physiological and transcriptomic analyses elucidate that exogenous calcium can relieve injuries to potato plants (Solanum tuberosum L.) under weak light. International Journal of Molecular Sciences 20(20), 5133.
| Crossref | Google Scholar | PubMed |
Iqbal A, Dong Q, Wang Z, Xiangru W, Huiping G, Hengheng Z, Nianchang P, Xiling Z, Meizhen S (2020) Growth and nitrogen metabolism are associated with nitrogen-use efficiency in cotton genotypes. Plant Physiology and Biochemistry 149, 61-74.
| Crossref | Google Scholar | PubMed |
Jia Z, Giehl RFH, Meyer RC, Altmann T, Von Wirén N (2019) Natural variation of BSK3 tunes brassinosteroid signaling to regulate root foraging under low nitrogen. Nature Communications 10(1), 2378.
| Crossref | Google Scholar |
Jian S, Luo J, Liao Q, Liu Q, Guan C, Zhang Z (2019) NRT1.1 regulates nitrate allocation and cadmium tolerance in Arabidopsis. Frontiers in Plant Science 10, 384.
| Crossref | Google Scholar | PubMed |
Jiang S, Sun J, Tian Z, Hu H, Michel EJS, Gao J, Jiang D, Cao W, Dai T (2017) Root extension and nitrate transporter up-regulation induced by nitrogen deficiency improves nitrogen status and plant growth at the seedling stage of winter wheat (Triticum aestivum L.). Environmental and Experimental Botany 141, 28-40.
| Crossref | Google Scholar |
Johnson R, Vishwakarma K, Hossen MS, Kumar V, Shackira AM, Puthur JT, Abdi G, Sarraf M, Hasanuzzaman M (2022) Potassium in plants: growth regulation, signaling, and environmental stress tolerance. Plant Physiology and Biochemistry 172, 56-69.
| Crossref | Google Scholar | PubMed |
Lee S, Marmagne A, Park J, Fabien C, Yim Y, Kim S-J, Kim T-H, Lim PO, Masclaux-Daubresse C, Nam HG (2020) Concurrent activation of OsAMT1;2 and OsGOGAT1 in rice leads to enhanced nitrogen use efficiency under nitrogen limitation. The Plant Journal 103(1), 7-20.
| Crossref | Google Scholar | PubMed |
Li P, Chen F, Cai H, Liu J, Pan Q, Liu Z, Gu R, Mi G, Zhang F, Yuan L (2015) A genetic relationship between nitrogen use efficiency and seedling root traits in maize as revealed by QTL analysis. Journal of Experimental Botany 66(11), 3175-3188.
| Crossref | Google Scholar | PubMed |
Liu Z, Gao K, Shan S, Gu R, Wang Z, Craft EJ, Mi G, Yuan L, Chen F (2017) Comparative analysis of root traits and the associated QTLs for maize seedlings grown in paper roll, hydroponics and vermiculite culture system. Frontiers in Plant Science 8, 436.
| Google Scholar | PubMed |
Liu T, Ren T, White PJ, Cong R, Lu J (2018) Storage nitrogen co-ordinates leaf expansion and photosynthetic capacity in winter oilseed rape. Journal of Experimental Botany 69(12), 2995-3007.
| Crossref | Google Scholar | PubMed |
Liu J, Liu M, Fang H, Zhang Q, Ruan J (2021) Accumulation of amino acids and flavonoids in young tea shoots is highly correlated with carbon and nitrogen metabolism in roots and mature leaves. Frontiers in Plant Science 12, 756433.
| Crossref | Google Scholar | PubMed |
Liu Q, Wu K, Song W, Zhong N, Wu Y, Fu X (2022a) Improving crop nitrogen use efficiency toward sustainable green revolution. Annual Review of Plant Biology 73(1), 523-551.
| Crossref | Google Scholar |
Liu H, Liu Q, Gao X, Fu X (2022b) Role of nitrogen sensing and its integrative signaling pathways in shaping root system architecture. Frontiers of Agricultural Science and Engineering 9(3), 316-332.
| Crossref | Google Scholar |
Lollato RP, Figueiredo BM, Dhillon JS, Arnall DB, Raun WR (2019) Wheat grain yield and grain-nitrogen relationships as affected by N, P, and K fertilization: a synthesis of long-term experiments. Field Crops Research 236, 42-57.
| Crossref | Google Scholar |
Louvieaux J, Spanoghe M, Hermans C (2020) Root morphological traits of seedlings are predictors of seed yield and quality in winter oilseed rape hybrid cultivars. Frontiers in Plant Science 11, 568009.
| Crossref | Google Scholar | PubMed |
Luo L, Zhang Y, Xu G (2020) How does nitrogen shape plant architecture? Journal of Experimental Botany 71(15), 4415-4427.
| Crossref | Google Scholar | PubMed |
Lv X, Zhang Y, Hu L, Zhang Y, Zhang B, Xia H, Du W, Fan S, Kong L (2021) Low-nitrogen stress stimulates lateral root initiation and nitrogen assimilation in wheat: roles of phytohormone signaling. Journal of Plant Growth Regulation 40, 436-450.
| Crossref | Google Scholar |
Ma Y, Sun H, Yang Y, Li Z, Li P, Qiao Y, Zhang Y, Zhang K, Bai Z, Li A (2023) Long-term nitrogen fertilizer management for enhancing use efficiency and sustainable cotton (Gossypium hirsutum L.). Frontiers in Plant Science 14, 1271846.
| Crossref | Google Scholar | PubMed |
Moreau D, Bardgett RD, Finlay RD, Jones DL, Philippot L (2019) A plant perspective on nitrogen cycling in the rhizosphere. Functional Ecology 33(4), 540-552.
| Crossref | Google Scholar |
Mu X, Chen Y (2021) The physiological response of photosynthesis to nitrogen deficiency. Plant Physiology and Biochemistry 158, 76-82.
| Crossref | Google Scholar | PubMed |
OECD-FAO (2023) OECD-FAO agricultural outlook 2023–2032. Available at https://www.oecd.org/zh/publi-cations/2023-2032_f2ad1d80-zh.html
Oldroyd GED, Leyser O (2020) A plant’s diet, surviving in a variable nutrient environment. Science 368(6486), eaba0196.
| Crossref | Google Scholar |
Padhan BK, Sathee L, Kumar S, Chinnusamy V, Kumar A (2023) Variation in nitrogen partitioning and reproductive stage nitrogen remobilization determines nitrogen grain production efficiency (NUEg) in diverse rice genotypes under varying nitrogen supply. Frontiers in Plant Science 14, 1093581.
| Crossref | Google Scholar | PubMed |
Riaz T, Iqbal MW, Mahmood S, Yasmin I, Leghari AA, Rehman A, Mushtaq A, Ali K, Azam M, Bilal M (2023) Cottonseed oil: A review of extraction techniques, physicochemical, functional, and nutritional properties. Critical Reviews in Food Science and Nutrition 63(9), 1219-1237.
| Crossref | Google Scholar |
Sager R, Wang X, Hill K, Yoo B-C, Caplan J, Nedo A, Tran T, Bennett MJ, Lee J-Y (2020) Auxin-dependent control of a plasmodesmal regulator creates a negative feedback loop modulating lateral root emergence. Nature Communications 11(1), 364.
| Crossref | Google Scholar | PubMed |
Shah AN, Javed T, Singhal RK, Shabbir R, Wang D, Hussain S, Anuragi H, Jinger D, Pandey H, Abdelsalam NR, Ghareeb RY, Jaremko M (2022) Nitrogen use efficiency in cotton: challenges and opportunities against environmental constraints. Frontiers in Plant Science 13, 970339.
| Crossref | Google Scholar | PubMed |
Stevens CJ (2019) Nitrogen in the environment. Science 363(6427), 578-580.
| Crossref | Google Scholar | PubMed |
Sun X, Chen F, Yuan L, Mi G (2020a) The physiological mechanism underlying root elongation in response to nitrogen deficiency in crop plants. Planta 251(4), 84.
| Crossref | Google Scholar |
Sun X, Chen H, Wang P, Chen F, Yuan L, Mi G (2020b) Low nitrogen induces root elongation via auxin-induced acid growth and auxin-regulated target of rapamycin (TOR) pathway in maize. Journal of Plant Physiology 254, 153281.
| Crossref | Google Scholar |
Wang Y-Y, Cheng Y-H, Chen K-E, Tsay Y-F (2018) Nitrate transport, signaling, and use efficiency. Annual Review of Plant Biology 69(1), 85-122.
| Crossref | Google Scholar |
Wang H, Wu L, Wang X, Zhang S, Cheng M, Feng H, Fan J, Zhang F, Xiang Y (2021) Optimization of water and fertilizer management improves yield, water, nitrogen, phosphorus and potassium uptake and use efficiency of cotton under drip fertigation. Agricultural Water Management 245, 106662.
| Crossref | Google Scholar |
Wang H, Wu Y, An T, Chen Y (2022) Lateral root elongation enhances nitrogen-use efficiency in maize genotypes at the seedling stage. Journal of the Science of Food and Agriculture 102(12), 5389-5398.
| Crossref | Google Scholar | PubMed |
Wei Y, Wang X, Zhang Z, Xiong S, Meng X, Zhang J, Wang L, Zhang X, Yu M, Ma X (2020) Nitrogen regulating the expression and localization of four glutamine synthetase isoforms in wheat (Triticum aestivum L.). International Journal of Molecular Sciences 21(17), 6299.
| Crossref | Google Scholar | PubMed |
Weng X, Li H, Ren C, Zhou Y, Zhu W, Zhang S, Liu L (2022) Calcium regulates growth and nutrient absorption in poplar seedlings. Frontiers in Plant Science 13, 887098.
| Crossref | Google Scholar | PubMed |
Xin W, Zhang L, Zhang W, Gao J, Yi J, Zhen X, Li Z, Zhao Y, Peng C, Zhao C (2019) An integrated analysis of the rice transcriptome and metabolome reveals differential regulation of carbon and nitrogen metabolism in response to nitrogen availability. International Journal of Molecular Sciences 20(9), 2349.
| Crossref | Google Scholar | PubMed |
Xin W, Zhang L, Zhang W, Gao J, Yi J, Zhen X, Du M, Zhao Y, Chen L (2022) Morphological and physiological characteristics of rice cultivars with higher yield and nitrogen use efficiency at various nitrogen rates. Agronomy 12(2), 358.
| Crossref | Google Scholar |
Xiong H, Ma H, Zhao H, Yang L, Hu B, Wang J, Shi X, Zhang Y, Rennenberg H (2022) Integrated physiological, proteome and gene expression analyses provide new insights into nitrogen remobilization in citrus trees. Tree Physiology 42(8), 1628-1645.
| Crossref | Google Scholar | PubMed |
Xu X, Du X, Wang F, Sha J, Chen Q, Tian G, Zhu Z, Ge S, Jiang Y (2020) Effects of potassium levels on plant growth, accumulation and distribution of carbon, and nitrate metabolism in apple dwarf rootstock seedlings. Frontiers in Plant Science 11, 904.
| Crossref | Google Scholar | PubMed |
Yang H, Zhang X, Gaxiola RA, Xu G, Peer WA, Murphy AS (2014) Over-expression of the Arabidopsis proton-pyrophosphatase AVP1 enhances transplant survival, root mass, and fruit development under limiting phosphorus conditions. Journal of Experimental Botany 65(12), 3045-3053.
| Crossref | Google Scholar |
Yang A, Qi M, Xu W, Wang S, Sun L, Qi D, Zhu L, Duan Y, Gao X, Ali Rajput S, Niya Z (2019) Refined cottonseed oil as a replacement for soybean oil in broiler diet. Food Science & Nutrition 7(3), 1027-1034.
| Crossref | Google Scholar | PubMed |
Zang L, Paven M-CM-L, Clochard T, Porcher A, Satour P, Mojović M, Vidović M, Limami AM, Montrichard F (2019) Nitrate inhibits primary root growth by reducing accumulation of reactive oxygen species in the root tip in Medicago truncatula. Plant Physiology and Biochemistry 146, 363-373.
| Crossref | Google Scholar |
Zhang Z, Chattha MS, Ahmed S, Liu J, Liu A, Yang L, Lv N, Ma X, Li X, Hao FR, Yang G (2021a) Nitrogen reduction in high plant density cotton is feasible due to quicker biomass accumulation. Industrial Crops and Products 172, 114070.
| Crossref | Google Scholar |
Zhang L, Sun S, Liang Y, Li B, Ma S, Wang Z, Ma B, Li M (2021b) Nitrogen levels regulate sugar metabolism and transport in the shoot tips of crabapple plants. Frontiers in Plant Science 12, 626149.
| Crossref | Google Scholar |
Zhang X, Li Y, Yan H, Cai K, Li H, Wu Z, Wu J, Yang X, Jiang H, Wang Q, Qu G, Zhao X (2022) Integrated metabolomic and transcriptomic analyses reveal different metabolite biosynthesis profiles of Juglans mandshurica in shade. Frontiers in Plant Science 13, 991874.
| Crossref | Google Scholar | PubMed |
Zhu L, Liu L, Sun H, Zhang Y, Zhu J, Zhang K, Li A, Bai Z, Wang G, Li C (2021) Physiological and comparative transcriptomic analysis provide insight into cotton (Gossypium hirsutum L.) root senescence in response. Frontiers in Plant Science 12, 748715.
| Crossref | Google Scholar | PubMed |