

Trends in water quality of five dairy farming streams in response to adoption of best practice and benefits of long-term monitoring at the catchment scale
Robert J. Wilcock A F , Ross M. Monaghan B , John M. Quinn A , M. S. Srinivasan C , David J. Houlbrooke D , Maurice J. Duncan C , Aslan E. Wright-Stow A and Mike R. Scarsbrook EA National Institute of Water and Atmospheric Research, PO Box 1115, Hamilton, New Zealand.
B AgResearch, Invermay Agricultural Centre, Private Bag 50034, Mosgiel, New Zealand.
C National Institute of Water and Atmospheric Research, PO Box 8602, Christchurch, New Zealand.
D AgResearch, Ruakura Research Centre, Private Bag 3115, Hamilton, New Zealand.
E DairyNZ Ltd, Private Bag 3221, Hamilton, New Zealand.
F Corresponding author: Email: bob.wilcock@niwa.co.nz
Marine and Freshwater Research 64(5) 401-412 https://doi.org/10.1071/MF12155
Submitted: 16 June 2012 Accepted: 29 November 2012 Published: 3 May 2013
Journal Compilation © CSIRO Publishing 2013 Open Access CC BY-NC-ND
Abstract
Five streams in catchments with pastoral dairy farming as the dominant land use were monitored for periods of 7–16 years to detect changes in response to adoption of best management practices (BMPs). Stream water quality was degraded at the start with respect to N, P, suspended solids (SS) and E. coli concentrations, and was typical of catchments with intensive pastoral agriculture land use. Trend analysis showed a decrease in SS concentration for all streams, generally increasing water clarity, and lower E. coli concentrations in three of the streams. These are attributed to improved stream fencing (cattle exclusion) and greater use of irrigation for treated effluent disposal with less reliance on pond systems discharging to streams. Linkages between water quality and farm actions based on survey data were used to develop BMPs that were discussed at stakeholder workshops. Generic and specific BMPs were developed for the five catchments. The 3–7 year periodicity of major climate cycles, as well as market forces and a slow rate of farmer adoption of simple BMPs mean that monitoring programs in New Zealand need to be much longer than 10 years to detect changes caused by farmer actions. Long-term monitoring is also needed to detect responses to newly legislated requirements for improved water quality.
Additional keywords: effluent disposal, land–water interactions, stream fencing.
Introduction
Stream water quality is generally degraded in catchments where the dominant land use is intensive pastoral agriculture (Trimble and Mendel 1995; Scarsbrook and Halliday 1999; McDowell 2008; Quinn et al. 2009). A comparison between land use, stock numbers, human population and nutrient exports between 1931 and 1988 for 10 catchments in the United Kingdom concluded that the largest cause of observed increases in nitrogen (N) and phosphorus (P) stream loads was from stock wastes associated with an increase in numbers of sheep and cattle during the period, with cultivation for arable crops being next most important (Johnes et al. 1996). A review of stream and riparian ecosystems in the western United States of America found that livestock grazing negatively affected water quality and seasonal quantity, stream channel morphology, hydrology, riparian soils, in-stream and streambank vegetation, and aquatic and riparian wildlife (Belsky et al. 1999). No positive environmental impacts were found by these authors. A study of stream bank erosion in a Danish lowland stream system failed to find a relationship between stream bank erosion and land use, although erosion was lower in forest streams than in streams in grassland used for grazing cattle (Laubel et al. 1999).
Pastoral dairy farming is an intensive form of agriculture that is characterised by high levels of inputs (e.g. fertiliser, energy, livestock) into farming systems to produce more output per unit area of land (Dietrich et al. 2012). The profitability of dairy farming in New Zealand has resulted in the number of dairy cattle increasing from 3.4 to 6.2 million between 1990 and 2011 (http://www.stats.govt.nz/browse_for_stats/industry_sectors/agriculture-horticulture-forestry/AgriculturalProduction_HOTPJun11prov/Commentary.aspx [accessed 18 March 2013]). Over the same period, the total area in dairy farming grew by 60% and there was an intensification of pastoral land use (e.g. increased inputs of fertiliser, density of livestock units) with average dairy stocking rates rising from 2.4 to 2.8 cows per ha (http://www.lic.co.nz/pdf/DAIRY%20STATISTICS%2010-11-WEB.pdf [accessed 15 May 2012]). A consequence of increased stocking rates has been a concomitant increase in nutrient leakages from farm systems and increased inputs of sediment and faecal microbes to aquatic ecosystems (Ledgard et al. 1999; Quinn et al. 2009; Wilcock et al. 1999, 2007). Land use changes from sheep and beef cattle grazing to more intensive dairy farming have caused marked deterioration in the water quality of New Zealand’s low-elevation streams and rivers (Larned et al. 2004; Howard-Williams et al. 2011). Of the pastoral land use category, which makes up 42% of New Zealand’s land cover, dairy farming has the highest diffuse pollution footprint with 36.7% of the total N load entering the sea originating from the 6.8% of the land area occupied by dairy farming (Howard-Williams et al. 2011). Pastoral dairy farming is also characterised by high concentrations of nitrate to receiving aquatic ecosystems (Ledgard et al. 1999; Wilcock et al. 2007). Recent studies of nitrate toxicity to freshwater invertebrates and fish have led to maximum nitrate-N levels of ~2 g m–3 being recommended for the protection of aquatic animals (Camargo et al. 2005; Howard-Williams et al. 2011).
In 2001, the New Zealand dairy industry initiated a study in which regionally representative dairy catchments were monitored for water quality and flow, as well as changes in farm management practices, including dairy effluent disposal, fertiliser use and soil management. The aims of the study were to: (i) establish baseline water quality under current farming methods; (ii) derive suitable best management practices (BMPs) for each catchment; and (iii) detect changes in water quality as BMPs were adopted by farmers (Wilcock et al. 2007). In the present study we report on the changes in water quality in response to the adoption of some BMPs, as well as examining the length of the monitoring periods in relation to natural and anthropogenic variability and future needs for long-term monitoring of major causes of water quality change. The present study summarises and updates previously published studies on the catchments and provides an overview of the whole study.
Materials and methods
Sites
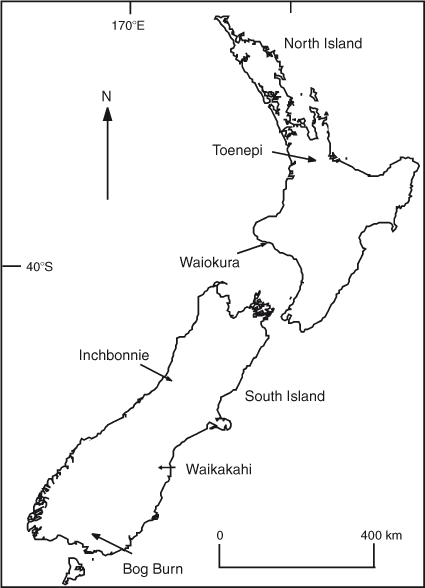
Catchments from five contrasting dairy farming areas of New Zealand (Fig. 1) were selected as being representative of regional soils, rainfall and climate, topography and farming methods (Monaghan et al. 2007, 2009; Wilcock et al. 2006, 2007; 2009). Catchment areas were 6–63 km2 and mean stream flows ranged from 220 to 590 L s–1 (Table 1). The Inchbonnie and Waikakahi catchments were dominated by free-draining stony soils, in contrast to the Bog Burn catchment where poorly draining silt-loams were underlain with extensive mole and pipe drainage networks (Monaghan et al. 2007, 2009). Toenepi and Waiokura catchment soils were dominantly volcanic silt loams (Wilcock et al. 1999, 2009).
|

|
Linking BMPs to catchment context
Stakeholder meetings were held intermittently in each catchment to report back on findings and farmer surveys were undertaken every three years to evaluate changes in farming and stream management practices. Survey data included inputs, such as amounts of fertiliser and purchased feed used, and outputs of milk solids. A half-day structured stakeholder workshop was held in each catchment in 2005–2006 to develop a shared conceptual understanding of the links between key water values, the pressures and contaminant flow paths influencing them, and the most appropriate BMPs to manage these pressures, using a method described elsewhere (McKergow et al. 2007; Monaghan et al. 2008; Quinn et al. 2010). Briefly, following presentations on the current state and trends in water quality relative to regional guidelines, and farm systems and potential management tools, values, indicators, pressures and BMPs were listed and arranged on labels on a magnetic whiteboard. Linkages were identified as lines between labels, with line thickness indicating relative strength of influence. The BMPs included a range of on-farm management actions (e.g. livestock management, farm dairy effluent (FDE) treatment and disposal, use of nitrification inhibitors) and methods of intercepting runoff from land before entry to natural waters (e.g. use of natural and constructed wetlands, riparian management) (McKergow et al. (2007). In addition, the ‘Dairying and Clean Streams Accord’ set target dates for farmers to fence waterways, manage effluent effectively and have nutrient management systems that minimised environmental damage (van der Hayden et al. 2003). Table 2 lists changes in BMP adoption within each catchment that were detected in farm surveys.

|
Water quality and discharge
A detailed description of the methodology used has been given elsewhere (Wilcock et al. 2007). Stream water quality was initially monitored at two-weekly intervals for 18–24 months at three sites in each catchment, and thereafter at monthly intervals at the catchment outlet. The purpose of this was to establish if monthly sampling from one site adequately described stream water quality and enabled accurate estimates of loads and specific yields (Kirchner et al. 2004; Johnes 2007). Stream flows were monitored continuously using a level recorder at the outlet of each catchment and ratings checked 8–10 times each year. Continuous measurement of flow began in June 1996 (Toenepi), May 2001 (Waiokura, Waikakahi and Bog Burn) and May 2004 (Inchbonnie). Stream water was analysed in situ for pH, temperature (°C), water clarity by black disc (m) and dissolved oxygen (DO, g m–3 and % saturation). Samples were analysed in the laboratory using standard methods for turbidity (nephelometric turbidity units, NTU), total and volatile suspended solids (SS and VSS, respectively), nitrate+nitrite N (NOX-N), ammonium N (NH4-N), total N (TN), filterable (0.45 μm) reactive P (FRP) and total P (TP). Total organic N (TON) concentrations were calculated from the difference between TN and dissolved (0.45 μm filtered) inorganic N (viz. NOX-N + NH4-N) values. Concentrations reported here for SS, VSS and N and P forms are expressed as g m–3. Standard protocols for sampling, sample stabilisation, analysis and quality assurance were adopted for all water quality variables (APHA 2005; Wilcock et al. 2009). Escherichia coli concentrations were determined by the Colilert most probable number (MPN) method (IDEXX Laboratories, USA) and expressed as MPN/100 mL. Multiprobe dataloggers (Datasonde, Hydrolab Corp., Austin Texas) were deployed to monitor DO, temperature and pH continuously for 2–5 days periods with accuracies of ±0.2 g m–3, ±0.1°C and ±0.2 units, respectively, in summer (four times), autumn (1), winter (4) and spring (4) during 2002–03 (Wilcock et al. 2007).
Turbidity, DO, pH, NOX-N, TN, FRP and TP data were compared with guidelines for slightly disturbed lowland rivers, derived from percentile values for reference rivers (ANZECC 2000) averaged over 3-year periods throughout each catchment’s full monitoring period. Ammonium-N concentrations were compared with the toxicant guideline level for protection of 95% of freshwater species, viz. 0.90 g m–3 (ANZECC 2000) and E. coli data were compared with a guideline specifying that freshwaters with E. coli concentrations exceeding 550 MPN/100 mL are deemed unsuitable for contact recreation (MfE/MoH 2003). Non-parametric statistics were used to show central tendency (median) and dispersion (interquartile range) for non-normally distributed data. Trend analyses were computed using the Seasonal Kendall test on SS, TN, TP and E. coli concentrations with LOWESS smoothing (Hirsch and Slack 1984) at monthly intervals for each dataset. Where appropriate, data were flow-adjusted to remove trends dominated by river flow (Helsel and Hirsch 1992).
Loads and yields
Stream loads leaving four of the catchments were initially calculated using the products of flow-weighted mean concentrations (the sum of simultaneous products of concentration and stream flow divided by the sum of the individual flows) from the monitoring data, and true mean flow for each period from the continuous flow record (Ferguson 1987; Robertson and Roerish 1999). Because continuous flow measurements in Waikakahi Stream began in 2001, load estimates for 1996–1998 were made using individual flow measurements made at each time of sampling, and using the 2001–2011 mean annual flow (Table 1) to approximate the 1996–1998 period. Sampling in the Toenepi, Waiokura, Waikakahi and Bog Burn streams was assumed to cover a sufficiently wide range of flows (>99th percentile) to enable accurate estimates of loads from these catchments. Because of the high annual rainfall (~5 m year–1) and frequency of storms flows in the Inchbonnie catchment, loads were supplemented by storm-water monitoring events for flows in excess of the 97.5th percentile, as well as losses to groundwater. Storm flows comprised ~40% of surface water loads. The groundwater losses were assessed using a water balance to determine drainage, and water chemistry data from wells in the catchment, and resulted in an extra 13 kg N ha–1 year–1 and 0.1 kg P ha–1 year–1 leaving the catchment and by-passing the monitoring site. Yields for E. coli were not calculated because storm flows, known to carry more than 90% of annual E. coli loads in dairy farming catchments, were not monitored at the necessary frequency and intensity for that purpose (Davies-Colley et al. 2008). Annual loads for TN, TP and SS were calculated using three-year monthly datasets in order to improve precision by smoothing inter-annual variations, and divided by the flow for each period to take variations in rainfall into account. These loads had units of kg km–2 mm–1 and were effectively flow-weighted mean concentrations, with mean annual flow (and its associated error) being cancelled from the calculated flow-normalised loads for each period. Uncertainties were expressed as 95% confidence intervals calculated as 1.96 times the sum of errors associated with flow and instantaneous N, P or SS yields. For example, over the 3-year period of record, the 95% confidence interval was 1.96 times the standard error of flow and instantaneous TN yields expressed relative to the sum of all flows and instantaneous yields, respectively. On average these were ±25% for TN and TP, and up to 50% for SS and were similar to other estimates of uncertainty (e.g. Robertson and Roerish 1999).
Results
Conceptual models linking catchment values, pressures and BMPs
The stakeholder workshops revealed a range of key water values (e.g. recreation, aesthetics), pressures, and appropriate BMPs that matched key contaminant flow paths and stream habitat issues. Some BMPs were common among catchments (e.g. stream fencing, nutrient management) while others (e.g. irrigation efficiency, effluent treatment) were more site-specific. At both Toenepi and Waiokura, the key values were downstream contact recreation and in-stream ecological health. The pressures were FDE discharges from oxidation ponds, poor riparian habitat or livestock access to streams and, in Toenepi, soil compaction. The main BMPs were irrigation of FDE, riparian fencing or planting, and (in Toenepi) improved grazing management, including the use of standoff pads.
At Pigeon Creek (Inchbonnie), the key water values were trout spawning and rearing, contact recreation in the streams, and maintaining the oligotrophic status of downstream Lake Brunner. The main pressures were phosphorus and faecal pollution from unfenced or unbridged streams, farm raceway runoff and runoff from FDE irrigation areas. The main BMPs were riparian fencing, diverting laneway runoff from streams to pasture, laneway bridges or culverts across streams and improved effluent irrigation (lower rates and increased size of irrigation areas).
For Waikakahi, the key waterway values were the trout fishery (particularly spawning and rearing). The main pressures were surface runoff from the border dyke-irrigated land, soil compaction, and livestock access to riparian areas and streams. The key BMPs were better irrigation management (including using low earth-barriers (bunds) to reduce surface runoff to streams), upgrading irrigation infrastructure to spray technology and riparian fencing and planting.
Bog Burn had similar key values to Pigeon Creek involving trout spawning and rearing in the farm streams and contact recreation in the Oreti River downstream, where periphyton growth is P-limited, and increased downstream of inputs from intensively farmed land. Here the main pressures were inputs of field tile drains (often enriched with irrigated FDE), soil pugging during winter, overuse of P fertiliser, laneway runoff to streams and livestock access to streams and riparian areas. The key BMPs were FDE storage during wet conditions, low application-rate FDE irrigation, use of herd shelters or off-site grazing in winter, reducing P fertiliser use to maintain soil Olsen P test levels in their optimum range and riparian planting and livestock exclusion.
State of water quality
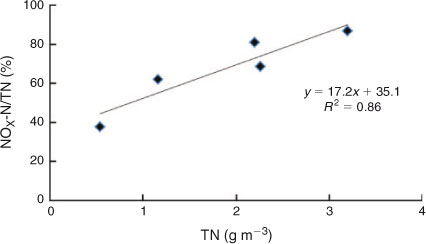
Water quality data for the entire monitoring period of each stream are compared with ecosystem status and contact recreation guidelines in Fig. 2. The five dairy catchment streams had enriched nutrient concentrations, notably of dissolved inorganic N ([NH4+NOX]-N) and TON. As a result, suspended organic material (VSS) comprised 20–40% of SS, on average. Toenepi Stream and Pigeon Creek (Inchbonnie) data exceeded the 0.9 g m–3 NH4-N toxicity guideline for protection of 95% of aquatic species, in ~3% of the samples (ANZECC 2000). All other data were below this guideline value, reflecting the trend away from pond discharges of FDE to land-application methods (Table 2). Nitrate (NOX-N) data, with the exceptions of the Inchbonnie and Waikakahi Streams, were highly seasonal, with minimum concentrations in late summer and maxima in late winter. The Inchbonnie catchment has a high annual rainfall (~5 m year–1) and the low proportion of NOX-N in TN is thought to have been a result of incomplete oxidation of ammonia before mobilisation of N occurred in drainage and surface runoff events. Flood (border-check) irrigation in the Waikakahi catchment during spring–autumn produced runoff that increased stream concentrations of nutrients, sediment and E. coli (Monaghan et al. 2009). A study of sources of NOX-N in Toenepi Stream found that summer stream water originated from old, denitrified groundwaters with very low N concentrations (Stenger et al. 2008). During high water table conditions in winter, water input to the stream is mostly from shallow (<3 m), nitrate-bearing groundwater. Median NOX-N concentration increased as a proportion of TN across all five catchments (Fig. 3), so that as N losses increased they were increasingly dominated by oxidised forms (nitrate and nitrite). Nitrate N comprised ~50% of TN when median TN was 1 g m–3, but 85% when TN was 3 g m–3. Concentrations of FRP were on average 30–70% of TP.

|
|
Median stream water clarity and turbidity were close to default trigger values (0.6 m and 5.6 NTU, respectively) for slightly disturbed lowland New Zealand aquatic ecosystems (ANZECC 2000). Median concentrations of E. coli were above the criterion in two catchments and below the criterion in three catchments (Fig. 2). Physico-chemical data indicated that stream waters were variable in composition having pH and DO ranges that were consistent with photosynthetic production and heterotrophic respiration (Wilcock and Chapra 2005; Young et al. 2008).
Concentration trends
Trend analysis results (Table 3) showed no consistent pattern for N and P data, although the increasing trends observed for TN and NOX-N in the Bog Burn and Waikakahi catchments are to be expected given the relatively recent (1990s) shift from sheep to dairy farming. Concentrations of SS had significant (P ≤ 0.05) downward trends in all five streams. Furthermore, black disc water clarity trended up in most streams while E. coli concentrations were trending down in two streams (plus Inchbonnie with P = 0.06), most likely in response to improved stock exclusion from streams via riparian fences and improved management of farm dairy effluent. On average, stream fencing improved from below 50% in 2001 to over 80% in 2011 (Table 2), with the result that less bank erosion occurred, streams had lower SS concentrations and were clearer. This has also been observed in a UK study (Collins et al. 2010). Collins et al. (2007) estimated that for flat-undulating slopes and medium soil drainage rates (5–64 mm h–1), vegetated riparian buffer widths of 1, 2 and 4 m may achieve up to 80, 90 and 95% reductions in faecal bacteria inputs. By contrast, Muirhead et al. (2006) reported that reductions in faecal bacteria from overland flow were <50% under saturation-excess runoff conditions, thought to be primarily due to a lack of settling or deposition of bacteria. Cattle access to waterways can result in increases in stream E. coli concentrations of more than an order of magnitude, compared with background levels (Collins et al. 2007; Muirhead et al. 2011), with subsequent exceedances of recreational water quality guidelines (Wilcock et al. 2009).

|
Mean TN and TP concentrations for 3-year periods (Fig. 4) were consistently above guideline values, other than for Inchbonnie TN. Turbidity means decreased below (or close to) the guideline value in all streams other than Waiokura, where there was nonetheless a downward trend. Mean concentrations of E. coli remained above the 550/100 mL contact recreation guideline for all streams, varying markedly throughout the present study.

|
Trends in loads
Water samples were collected in Toenepi, Waiokura, Waikakahi and Bog Burn flows >99th percentile and loads, therefore, represented all flows. Load calculations based on two-weekly monitoring agreed with estimates made with monthly data for the same periods, within the specified uncertainties. Average annual yields divided by discharge, for TN, TP and SS based on 24-month datasets (Fig. 5) show that: TN was constant in Toenepi, Waiokura and Waikakahi Streams and Pigeon Creek (Inchbonnie); but increased in Bog Burn as dairy farming expanded and land use intensified. Dairy farming increased as a fraction of land use by 11% in Waiokura and Inchbonnie, 20% in Waikakahi and 9% in Bog Burn between 2001 and 2008 (Table 4). TP and SS loads declined in most catchments over time, most likely as a result of improved stock exclusion from riparian areas (McDowell and Wilcock 2007), with Bog Burn being the exception. Other major changes within the catchments that would have affected yields were: fewer pond discharges of FDE in the Toenepi and Waiokura catchments and better irrigation efficiency in the Waikakahi catchment through such measures as having more accurately levelled border-dykes, bunding the end of irrigation bays and paying closer attention to irrigation timings and application depths.

|

|
Discussion
Water quality status, trends and causes
Degraded water quality is a feature of streams in intensively farmed pastoral catchments in New Zealand, such as those monitored in this study (Larned et al. 2004; Quinn et al. 2009). Concentrations of N and P forms frequently exceeded guideline values for slightly disturbed lowlands stream ecosystems (Figs 2 and 4), and median E. coli concentrations were close to the 550 MPN/100 mL criterion of unsuitability for contact recreation. Although N and P concentration trends varied among streams, there were consistent downward trends in SS with generally improved water clarity, and a weaker overall downward trend in E. coli concentration (Table 3). Much of this can be attributed to improved stock exclusion from riparian areas and major changes in FDE disposal from oxidation pond discharges to streams to greater use of irrigation (Wilcock et al. 2006, 2009). There was an improvement in streambank fencing within the five catchments from 40–50% to >80%, and major increases in the proportion of farmers using irrigation for FDE disposal during 2001–2008 (Table 2) as farmers increasingly adopted the environmental recommendations of the ‘Dairying and Clean Streams Accord’ (van der Hayden et al. 2003; Monaghan et al. 2007, 2009; Wilcock et al. 2006, 2009). Preliminary results showed that as well as reducing sediment loss and input of faecal matter (Collins et al. 2007; McDowell and Wilcock 2007), exclusion of stock from stream banks may have improved habitat quality and stream health as assessed by sampling aquatic invertebrates (http://flrc.massey.ac.nz/workshops/12/Manuscripts/Wilcock_2012.pdf). Major reductions in concentrations of NH4-N, FRP and E. coli occurred where an increased proportion of farms irrigated farm dairy effluent (FDE) to land, rather than discharging to streams via two-pond systems (Wilcock et al. 2006, 2009). Despite changes in farm management leading to some improved water quality, concentrations of TN, TP and E. coli still exceed guidelines for ecosystem protection and contact recreation (ANZECC 2000; MfE/MoH 2003) (Fig. 4), and uptake of a wider range of BMPs (e.g. Monaghan et al. 2008) will be needed to achieve further reductions in nutrient and faecal pollution levels in these streams. Average use of N fertiliser increased during the present study while P fertiliser use decreased (Table 2), while at the same time TN concentrations trended upwards while TP concentrations were mostly static. Attributing water quality changes to specific actions is difficult at a catchment scale because of the differences between the actions of individual farmers and the variable consequences of these actions. The least equivocal relationship between water quality and land use in the present study was the reduction in sediment loading and the improvement in optical water quality (black disc clarity and turbidity) as a result of improved stock exclusion with permanent fences. The move to greater use of irrigation and fewer pond discharges of FDE would have reduced inputs of FRP, NH4 and E. coli, but this is not apparent from the concentration trends (Tables 2 and 4) (Wilcock et al. 2006, 2009).
Dairy farms are major sources of N causing eutrophication in New Zealand streams, lakes and estuaries (Howard-Williams et al. 2011). Nitrate, the dominant N form in the five streams of the present study (Fig. 3), is rapidly assimilated by aquatic plants and is an essential component of coupled nitrification–denitrification and the production of the greenhouse gas N2O (Groffman et al. 2002). Furthermore, NOX-N concentrations found here frequently exceed freshwater guidelines for chronic toxicity in natural waters (viz. 1.7 g m–3 in slightly or moderately disturbed systems, and 2.4–3.6 g m–3 in highly disturbed systems, i.e. with measurable degradation) (Howard-Williams et al. 2011).
Discharge-normalised loadings of TN (Fig. 5) showed little change over time in four of the five monitored catchments despite increases in farm inputs (viz. N fertiliser, purchased feed) and milk output (Table 4). This suggests that proportionately less of the input N was leached from these catchments as farming intensified. Bog Burn was the exception and it is likely that the extensive subsurface drainage network in the catchment exacerbated leaching losses as farming intensified (Monaghan et al. 2007). Loadings of TP and SS have generally decreased over time, independently of rainfall, in response to farm and riparian management actions. Loads of FRP, TP and SS declined in Waiokura Stream by 25–40% during 2001–2008 (Wilcock et al. 2009). These decreases were attributed to increased riparian protection, a 25% reduction in pond discharges of FDE, and a 25% reduction in the average application rate of P fertiliser (Wilcock et al. 2009).
Results from the farm surveys completed at the beginning and near the end of the present study show how land use intensity increased in all catchments (Table 4). The most obvious indicator of this was the increased milk production per hectare, growing by between 7% (Inchbonnie) and 31% (Waikakahi) over the 6- (Inchbonnie) or 8- (other catchments) year monitoring periods. When combined with changes in dairy farming area within the catchments, we estimate that milk yields increased by 24, 26, 57, 23 and 18% for the Toenepi, Waiokura, Waikakahi, Bog Burn and Inchbonnie catchments, respectively. This increased milk production per catchment was also supported by significant increases in N fertiliser inputs and purchased supplementary feed in most catchments (Table 4). Of note are the broadly consistent reductions in P fertiliser inputs to farms in most catchments. These changes reflect the implementation of some improved nutrient-management practices whereby maintenance P fertiliser inputs were decreased in catchments that were shown to have high soil P test levels (Houlbrooke et al. 2010). The exception was Inchbonnie catchment, where soil P test values were already close to agronomically optimum levels and maintenance P fertiliser inputs were appropriate to maintaining these levels.
Further improvements in water quality
Although water quality in the five dairy streams improved somewhat when simple changes in farm management were made, there is still more that needs to be done for the dairy catchment streams to comply with guidelines for slightly disturbed lowland river ecosystems or contact recreation (ANZECC 2000; MfE/MoH 2003) (Fig. 4). It is likely that in the future, more stringent limits will be enforced for the protection of water body values that minimise adverse cumulative effects, through a regulatory framework based on a collaborative process to engage communities in objective setting (Land and Water Forum 2012). Recent research has identified several possible approaches to reducing diffuse source pollution from dairy farms that included a suite of on-farm actions to manage farm loadings, as well as mitigations around critical source areas and hydrological flow paths that intercept pollutants at the land–water interface (Quinn et al. 2009). Pollutant removal efficiencies vary according to method and site location, but large-scale reductions (>50%) are attainable for many BMPs, albeit at a cost to farmers (McKergow et al. 2007; Monaghan et al. 2008). The linkage models developed with stakeholders indicated that some BMPs were applicable to all five sites (e.g. good FDE management practice and riparian fencing) while others varied in their applicability with the hydrological flow paths and local and downstream water values. Further development of the Bog Burn conceptual linkage model into a Bayesian Belief Network indicated that significant benefits for water values could be attained by a strategic application of a suite of BMPs that control key contaminant sources and enhance riparian habitat, and that this could be achieved by different BMPs that might suit farmers’ management preferences (Quinn et al. 2010).
Long-term monitoring
The present study has highlighted the benefits of long-term monitoring in order to characterise existing water quality and have a reliable means of measuring trends that are not driven by climate. The Southern Oscillation Index (SOI) has a major influence on interannual climate variation in New Zealand (Gordon 1986). Negative SOI values (El Niño) are associated with cool, south-westerly conditions and below normal rainfall in the north and east but increased rainfall in the west of New Zealand. Positive values (La Niña) are generally characterised by increased moist, rainy conditions to the north-east of the North Island, and reduced rainfall to the south and south-west of the South Island (Kidson and Renwick 2002). Trends in New Zealand water quality were correlated with SOI values over a 13-year period, with statistically significant linear regression relationships being found for 13 variables (Scarsbrook et al. 2003). The strongest relationships were for water temperature (mean R2 = 0.20), FRP (0.18), and NOX-N (0.17). The analysis indicated that effects on water quality were not necessarily a direct consequence of changes in flow associated with rainfall variation, and that changes in management were not directly responsible (Scarsbrook et al. 2003). The authors suggest that water quality trends in New Zealand should take climatic influences into account when ascribing causes for trends, which implies that monitoring records should be long enough to discriminate land-management consequences from those induced by 3–7 year climate cycles.
Market forces and the rate at which farmers adopt good environmental practice are indirect causes of water quality changes. Commodity prices and farmers’ revenue affect their ability or willingness to undertake non-productive actions (e.g. adoption of BMPs) unless an on-farm benefit is perceived (MacGregor and Warren 2006; Bewsell et al. 2007). Usage of N fertiliser in New Zealand during 2002–2009 was steady, but P-fertiliser use varied by more than 2-fold in the same period (http://faostat.fao.org/site/575/default.aspx). In the five dairy catchments reported here, average N fertiliser use increased, whereas P fertiliser use declined during 2001–2008 (Table 4) but varied widely among individual farmers. External factors such as climate and market forces may have a significant effect on water quality by influencing runoff volumes and the amounts of potential pollutants that are generated on farm. Uptake of BMPs by dairy farmers in the five catchments steadily increased over time. A crude estimate of the average rate for farmers to fence major streams is 3–5% per year, based on an increase from ~40–50% in 2001 to 80–90% in 2011. Conversion of FDE treatment systems from ponds discharging to streams to land irrigation has proceeded at a similar average rate of 2–5% per year. Monitoring programs observing water quality trends must be of sufficient length to distinguish land-based farmer actions (implementation of BMPs) from climatic cycles and market effects, as well as taking into account farmer inertia in adopting environmentally sound practices. This 10-year study in New Zealand represents the minimum duration that is needed for trend analysis based on monthly water quality sampling, given the natural variations in climate and other important external variables. To date it has shown that some actions (increased fencing of streams and greater use of land irrigation of FDE) have resulted in improved water quality (reduced SS and E. coli concentrations, and improved visual clarity). Continued monitoring would enable detection of changes resulting from the enforcement of water quality limits (maximum permissible concentrations in discharges) and by necessity, adoption by farmers of a wider range of BMPs.
Conclusions
A 10-year monitoring study of five streams in predominantly dairying catchments has shown that water quality, although poor because of high concentrations of nutrients, sediment and faecal organisms, has improved. Greater use of fences for stock exclusion from streams and riparian areas, and greater use of land application of FDE have generally lowered SS and E. coli concentrations and improved visual clarity despite increasing land-use intensification. Trends for N and P concentrations and loads are more variable, although overall average yields of TP have declined. The 3–7-year periodicity of major climate cycles that affect rainfall and catchment runoff, market forces influencing farm income and costs, and a slow rate of farmer adoption of some BMPs mean that monitoring programs in New Zealand need to be much longer than 10 years if they are to detect changes in water quality caused by farmer actions. They will also have to be able to detect responses to new requirements for improved water quality by resource management legislation and plans.
Acknowledgements
The authors thank the many farmers who provided helpful cooperation and regular feedback. We are grateful to our colleagues in the regional councils, Fonterra and Westland Milk Products for their many contributions in the study. We acknowledge the constructive comments from the reviewers that have improved the paper. This work was supported by funding from DairyNZ Ltd and its predecessors, the Sustainable Farming Fund of the Ministry for Primary Industries and its predecessors, and the Pastoral 21 Consortium Pastoral21 (Environment) program (contract C10X0603), funded by the NZ Foundation for Research, Science and Technology.
References
ANZECC (2000). ‘National Water Quality Management Strategy: Australian and New Zealand Guidelines for Fresh and Marine Water Quality.’ (Australian and New Zealand Environment and Conservation Council and Agriculture and Resource Management Council of Australia and New Zealand: Canberra.)APHA (2005). ‘Standard Methods for the Examination of Water and Wastewater.’ 21st ed. (American Public Health Association, American Water Works Association and Water Environment Federation: Washington DC.)
Belsky, A. J., Matzke, A., and Uselman, S. (1999). Survey of livestock influences on stream and riparian ecosystems in the western United States. Journal of Soil and Water Conservation 54, 419–421.
Bewsell, D., Monaghan, R. M., and Kaine, G. (2007). Adoption of stream fencing among dairy farmers in four New Zealand catchments. Environmental Management 40, 201–209.
| Adoption of stream fencing among dairy farmers in four New Zealand catchments.Crossref | GoogleScholarGoogle Scholar | 17562101PubMed |
Camargo, J. A., Alonso, A., and Salamanca, A. (2005). Nitrate toxicity to aquatic animals: a review with new data for freshwater invertebrates. Chemosphere 58, 1255–1267.
| Nitrate toxicity to aquatic animals: a review with new data for freshwater invertebrates.Crossref | GoogleScholarGoogle Scholar | 1:CAS:528:DC%2BD2MXmvFaktQ%3D%3D&md5=99ea8f0cf9482cd861dc2bfa1b0e8234CAS | 15667845PubMed |
Collins, R., McLeod, M., Hedley, M., Donnison, A., Close, M., Hanly, J., Horne, D., Ross, C., Davies-Colley, R., Bagshaw, C., and Matthews, L. (2007). Best management practices to mitigate faecal contamination by livestock of New Zealand waters. New Zealand Journal of Agricultural Research 50, 267–278.
| Best management practices to mitigate faecal contamination by livestock of New Zealand waters.Crossref | GoogleScholarGoogle Scholar |
Collins, A. L., Walling, D. E., McMellin, G. K., Zhang, Y., Gray, J., McGonigle, D., and Cherrington, R. (2010). A preliminary investigation of the efficacy of riparian fencing schemes for reducing contributions from eroding channel banks to the siltation of salmonid spawning gravels across the south west UK. Journal of Environmental Management 91, 1341–1349.
| A preliminary investigation of the efficacy of riparian fencing schemes for reducing contributions from eroding channel banks to the siltation of salmonid spawning gravels across the south west UK.Crossref | GoogleScholarGoogle Scholar | 20223585PubMed |
Davies-Colley, R. J., Lydiard, E., and Nagels, J. W. (2008). Stormflow-dominated loads of faecal pollution from an intensively dairy-farmed catchment. Water Science and Technology 57, 1519–1523.
| Stormflow-dominated loads of faecal pollution from an intensively dairy-farmed catchment.Crossref | GoogleScholarGoogle Scholar |
Dietrich, J. P., Schmitz, C., Müller, C., Fader, M., Lotze-Campen, H., and Popp, A. (2012). Measuring agricultural land-use intensity – A global analysis using a model-assisted approach. Ecological Modelling 232, 109–118.
| Measuring agricultural land-use intensity – A global analysis using a model-assisted approach.Crossref | GoogleScholarGoogle Scholar |
Ferguson, R. I. (1987). Accuracy and precision of methods for estimating river loads. Earth Surface Processes and Landforms 12, 95–104.
| Accuracy and precision of methods for estimating river loads.Crossref | GoogleScholarGoogle Scholar |
Gordon, N. (1986). The Southern Oscillation and New Zealand Weather. Monthly Weather Review 114, 371–387.
| The Southern Oscillation and New Zealand Weather.Crossref | GoogleScholarGoogle Scholar |
Groffman, P. M., Gold, A. J., Kellog, D. Q., and Addy, K. (2002). Mechanisms, rates and assessment of N2O in groundwater, riparian zones and rivers. In ‘Proceedings of the third International Symposium on Non-CO2 Greenhouse Gases. Scientific Understanding, Control Options and Policy Aspects, Maastricht, 21–23 January 2002’. (Eds J. Van Ham, A.P.M. Baede, R. Guicherit, and J.G.F.M. Williams-Jacobse) pp. 159–166. (Millpress: Rotterdam.).
Helsel, D. R., and Hirsch, R. M. (1992). ‘Statistical Methods in Water Resources.’ (Elsevier: Amsterdam)
Hirsch, R. M., and Slack, J. R. (1984). A nonparametric trend test for seasonal data with serial dependence. Water Resources Research 20, 727–732.
| A nonparametric trend test for seasonal data with serial dependence.Crossref | GoogleScholarGoogle Scholar |
Houlbrooke, D., Monaghan, R., Drewry, J., Smith, C., and McGowan, A. (2010). Monitoring soil quality in intensive dairy-farmed catchments of New Zealand: implications for farm management and environmental quality. In ‘Proceedings of the 19th World Congress of Soil Science; Soil Solutions for a Changing World’. (Eds R.J. Gilkes, RJ, and N. Prakongkep). Symposium 3.1.2, Farm systems and environmental impacts ISBN 978–0-646–53783–2, Brisbane, 1–6 Aug 2010. Available at http://www.iuss.org [accessed 15 June 2010].
Howard-Williams, C., Davies-Colley, R., Rutherford, K., and Wilcock, R. (2011). Diffuse pollution and freshwater degradation: New Zealand approaches to solutions. In ‘Issues and Solutions to Diffuse Pollution: Selected Papers from the 14th International Conference of the IWA Diffuse Pollution Specialist Group, Québec, 12–17 September 2010. (Eds E. van Bochove, P.A. Vanrolleghem, P.A.; Chambers, G. Thériault, B. Novotná, B. and M.R. Burkart) pp. 126–140. Available at http://www.dipcon2010.org/DIPCON2010_Issues_and_Solutions_to_Diffuse_Pollution.pdf [accessed 5 November 2012]
Johnes, P. J. (2007). Uncertainties in annual riverine phosphorus load estimation: Impact of load estimation methodology, sampling frequency, baseflow index and catchment population density. Journal of Hydrology 332, 241–258.
| Uncertainties in annual riverine phosphorus load estimation: Impact of load estimation methodology, sampling frequency, baseflow index and catchment population density.Crossref | GoogleScholarGoogle Scholar |
Johnes, P., Moss, B., and Phillips, G. (1996). The determination of total nitrogen and total phosphorus concentrations in freshwaters from land use, stock headage, and population data: testing of a model for use in conservation and water quality management. Freshwater Biology 36, 451–473.
| The determination of total nitrogen and total phosphorus concentrations in freshwaters from land use, stock headage, and population data: testing of a model for use in conservation and water quality management.Crossref | GoogleScholarGoogle Scholar | 1:CAS:528:DyaK28XmslOntrc%3D&md5=8d5b11a576c878cf66f0b5d7ccbcb10cCAS |
Kidson, J. W., and Renwick, J. A. (2002). Patterns of convection in the tropical Pacific and their influence on New Zealand weather. International Journal of Climatology 22, 151–174.
| Patterns of convection in the tropical Pacific and their influence on New Zealand weather.Crossref | GoogleScholarGoogle Scholar |
Kirchner, J. W., Feng, X., Neal, C., and Robson, A. J. (2004). The fine-structure of water quality dynamics: the (high-frequency) wave of the future. Hydrological Processes 18, 1353–1359.
| The fine-structure of water quality dynamics: the (high-frequency) wave of the future.Crossref | GoogleScholarGoogle Scholar |
Land and Water Forum (2012). Second report of the Land and Water Forum: Setting limits for water quality and quantity, and freshwater policy- and plan-making through collaboration. Available at http://www.landandwater.org.nz [accessed 30 October 2012]
Larned, S. T., Scarsbrook, M. R., Snelder, T. H., Norton, N. J., and Biggs, B. J. F. (2004). Water quality in low-elevation streams and rivers of New Zealand: recent state and trends in contrasting land-cover classes. New Zealand Journal of Marine and Freshwater Research 38, 347–366.
| Water quality in low-elevation streams and rivers of New Zealand: recent state and trends in contrasting land-cover classes.Crossref | GoogleScholarGoogle Scholar | 1:CAS:528:DC%2BD2cXms1aktL8%3D&md5=669e0da5bfec50ca05a246da69c8dbc8CAS |
Laubel, A., Svendsen, L. M., Kronvang, B., and Larsen, S. E. (1999). Bank erosion in a Danish lowland stream system. Hydrobiologia 410, 279–285.
| Bank erosion in a Danish lowland stream system.Crossref | GoogleScholarGoogle Scholar |
Ledgard, S. F., Penno, J. W., and Sprosen, M. S. (1999). Nitrogen inputs and losses from clover/grass pastures grazed by dairy cows, as affected by nitrogen fertilizer application. Journal of Agricultural Science, 132, 215–225.
| Nitrogen inputs and losses from clover/grass pastures grazed by dairy cows, as affected by nitrogen fertilizer application.Crossref | GoogleScholarGoogle Scholar |
Macgregor, C. J., and Warren, C. R. (2006). Adopting sustainable farm management practices within a nitrate vulnerable zone in Scotland: The view from the farm. Agriculture, Ecosystems & Environment 113, 108–119.
| Adopting sustainable farm management practices within a nitrate vulnerable zone in Scotland: The view from the farm.Crossref | GoogleScholarGoogle Scholar | 1:CAS:528:DC%2BD28XhtlCms7c%3D&md5=b60e138f1a16021eaec74def7f7eb84dCAS |
McDowell, R. W. (2008). ‘Environmental Impacts of Pasture-based Farming.’ (CAB International: Wallingford, UK)
McDowell, R. W., and Wilcock, R. J. (2007). Sources of sediment and phosphorus in stream flow of a highly-productive dairy farmed catchment. Journal of Environmental Quality 36, 540–548.
| Sources of sediment and phosphorus in stream flow of a highly-productive dairy farmed catchment.Crossref | GoogleScholarGoogle Scholar | 1:CAS:528:DC%2BD2sXjsV2jsLc%3D&md5=d8e312153405d38f782a01ea112f30e5CAS | 17332258PubMed |
McKergow, L. A., Tanner, C. C., Monaghan, R. M., and Anderson, G. (2007). Stocktake of diffuse pollution attenuation tools for New Zealand pastoral farming systems. NIWA contract report prepared for Pastoral 21 Research Consortium, Hamilton, New Zealand. Available at http://www.niwa.co.nz/sites/default/files/import/attachments/stocktake-v10.pdf [accessed 6 November 2012].
MfE/MoH (2003). ‘Microbiological Water Guidelines for marine and Freshwater Recreational Areas’. (Ministry for the Environment and Ministry of Health: Wellington.)
Monaghan, R. M., Wilcock, R. J., Smith, L. C., Tikkisetty, B., Thorrold, B. S., and Costall, D. (2007). Linkages between land management activities and water quality in an intensively farmed catchment in southern New Zealand. Agriculture, Ecosystems & Environment 118, 211–222.
| Linkages between land management activities and water quality in an intensively farmed catchment in southern New Zealand.Crossref | GoogleScholarGoogle Scholar |
Monaghan, R. M., de Klein, C. A. M., and Muirhead, R. W. (2008). Prioritisation of farm scale remediation efforts for reducing losses of nutrients and faecal indicator organisms to waterways: A case study of New Zealand dairy farming. Journal of Environmental Management 87, 609–622.
| Prioritisation of farm scale remediation efforts for reducing losses of nutrients and faecal indicator organisms to waterways: A case study of New Zealand dairy farming.Crossref | GoogleScholarGoogle Scholar | 1:CAS:528:DC%2BD1cXotFCqsLg%3D&md5=9abe908e19f0e56cdbdd8bb9b3618b88CAS | 18164122PubMed |
Monaghan, R. M., Carey, P. L., Wilcock, R. J., Drewry, J. J., Houlbrook, D. J., Quinn, J. M., and Thorrold, B. S. (2009). Linkages between land management activities and stream water quality in a border-dyke irrigated pastoral catchment. Agriculture, Ecosystems & Environment 129, 201–211.
| Linkages between land management activities and stream water quality in a border-dyke irrigated pastoral catchment.Crossref | GoogleScholarGoogle Scholar |
Muirhead, R. W., Collins, R. P., and Bremer, P. J. (2006). The association of E. coli and soil particles in overland flow. Water Science and Technology 54, 153–159.
| The association of E. coli and soil particles in overland flow.Crossref | GoogleScholarGoogle Scholar | 1:STN:280:DC%2BD28ngsVOrsg%3D%3D&md5=70d4da928ac2ff09ae13b5a3c4f6001aCAS | 17037147PubMed |
Muirhead, R. W., Elliott, A. H., and Monaghan, R. M. (2011). A model framework to assess the effect of dairy farms and wild fowl on microbial water quality during base-flow conditions. Water Research 45, 2863–2874.
| A model framework to assess the effect of dairy farms and wild fowl on microbial water quality during base-flow conditions.Crossref | GoogleScholarGoogle Scholar | 1:CAS:528:DC%2BC3MXkslers7s%3D&md5=5ad8635af613e7c7c272b87aca21c281CAS | 21453952PubMed |
Quinn, J. M., Wilcock, R. J., Monaghan, R. M., McDowell, R. W., and Journeaux, P. (2009). Grassland farming and water quality in New Zealand. Tearmann: Irish Journal of Agric.- Environmental Research 7, 69–88.
Quinn, J. M., Monaghan, R. M., and Wilcock, R. J. (2010). Linking farm and waterway values – the Bog Burn catchment. In ‘Farming’s future: minimising footprints and maximising margins, Palmerston North, New Zealand, 10–11 February 2010’. (Eds L. D. Currie and C. L. Christensen). Occasional report No. 23, pp. 63–77 (Fertiliser and Lime Research Centre, Massey University: Palmerston North)
Robertson, D. M., and Roerish, E. D. (1999). Influence of various water quality sampling strategies on load estimates for small streams. Water Resources Research 35, 3747–3759.
| Influence of various water quality sampling strategies on load estimates for small streams.Crossref | GoogleScholarGoogle Scholar | 1:CAS:528:DC%2BD3cXit1yrtQ%3D%3D&md5=b8e20be2acc71b854f1e52664a4c124fCAS |
Scarsbrook, M. R., and Halliday, J. (1999). Transition from pasture to native forest land-use along stream continua: effects on stream ecosystems and implications for restoration. New Zealand Journal of Marine and Freshwater Research 33, 293–310.
| Transition from pasture to native forest land-use along stream continua: effects on stream ecosystems and implications for restoration.Crossref | GoogleScholarGoogle Scholar | 1:CAS:528:DyaK1MXmsVamu7s%3D&md5=7b719611bf8e5b08ad6be8977e88eb20CAS |
Scarsbrook, M. R., McBride, C. G., McBride, G. B., and Bryers, G. G. (2003). Effects of climate variability on rivers: consequences for long-term water quality analysis. Journal of the American Water Resources Association 39, 1435–1447.
| Effects of climate variability on rivers: consequences for long-term water quality analysis.Crossref | GoogleScholarGoogle Scholar | 1:CAS:528:DC%2BD2cXht1Whur8%3D&md5=40ae830b890c6714de3575947efd8301CAS |
Smith, D. G., Davies-Collet, R. J., Knoef, J., and Slot, G. W. J. (1997). Optical characteristics of New Zealand rivers in relation to flow. Journal of the American Water Resources Association 33, 301–312.
| 1:CAS:528:DyaK2sXjtVyqs7o%3D&md5=ea5f899ffcbd1fd29b3b7ac44accd139CAS |
Stenger, R., Barkle, G., Burgess, C., Wall, A., and Clague, J. (2008). Low nitrate contamination of shallow groundwater in spite of intensive dairying: the effect of reducing conditions in the vadose zone-aquifer continuum. Journal of Hydrology. New Zealand 47, 1–24.
Trimble, S. W., and Mendel, A. C. (1995). The cow as a geomorphic agent – a critical review. Geomorphology 13, 233–253.
| The cow as a geomorphic agent – a critical review.Crossref | GoogleScholarGoogle Scholar |
van der Hayden, H., Sutton, J., Hobbs, M., and Clarke, N. (2003). Dairying and clean streams accord between Fonterra Co-operative Group, Regional Councils, Ministry for the Environment, and Ministry of Agriculture and Forestry, Wellington.
Wilcock, R. J., and Chapra, S. C. (2005). Diel changes of inorganic chemistry in a macrophyte dominated, softwater stream. Marine and Freshwater Research 56, 1165–1174.
| Diel changes of inorganic chemistry in a macrophyte dominated, softwater stream.Crossref | GoogleScholarGoogle Scholar | 1:CAS:528:DC%2BD2MXht1Crt7bO&md5=dffdf22ea379c7791b72e3d7a989b171CAS |
Wilcock, R. J., Nagels, J. W., Rodda, H. J. E., O’Connor, M. B., Thorrold, B. S., and Barnett, J. W. (1999). Water quality of a lowland stream in a New Zealand dairy farming catchment. New Zealand Journal of Marine and Freshwater Research 33, 683–696.
| Water quality of a lowland stream in a New Zealand dairy farming catchment.Crossref | GoogleScholarGoogle Scholar | 1:CAS:528:DC%2BD3cXpt1Wrsg%3D%3D&md5=6b5e5bb1b86c90ceaf543e12635339ecCAS |
Wilcock, R. J., Monaghan, R. M., Quinn, J. M., Campbell, A. M., Duncan, M. J., McGowan, A. W., and Betteridge, K. (2006). Land use impacts and water quality targets in the intensive dairying catchment of the Toenepi Stream, New Zealand. New Zealand Journal of Marine and Freshwater Research 40, 123–140.
| Land use impacts and water quality targets in the intensive dairying catchment of the Toenepi Stream, New Zealand.Crossref | GoogleScholarGoogle Scholar | 1:CAS:528:DC%2BD28Xls1Squrg%3D&md5=37a53d1a8c99a33ce320cbb91f4d62baCAS |
Wilcock, R.J., Monaghan, R.M., Thorrold, B.S., Meredith, A.S., Betteridge, K., and Duncan, M.J. (2007). Land-water interactions in five contrasting dairying watersheds: Issues and solutions. Land Use and Water Resources Research 7, 2.1–2.10.
Wilcock, R. J., Betteridge, K., Shearman, D., Fowles, C., Scarsbrook, M. R., Thorrold, B. S., and Costall, D. (2009). Riparian management for restoration of a lowland stream in an intensive dairy farming catchment: a case study. New Zealand Journal of Marine and Freshwater Research 43, 803–818.
| Riparian management for restoration of a lowland stream in an intensive dairy farming catchment: a case study.Crossref | GoogleScholarGoogle Scholar | 1:CAS:528:DC%2BD1MXhtFKntb7N&md5=51fa5826e1b3a7035efc0a819e0928d0CAS |
Young, R. G., Matthaei, C. D., and Townsend, C. R. (2008). Organic matter breakdown and ecosystem metabolism: functional indicators for assessing river ecosystem health. Journal of the North American Benthological Society 27, 605–625.
| Organic matter breakdown and ecosystem metabolism: functional indicators for assessing river ecosystem health.Crossref | GoogleScholarGoogle Scholar |