

Integrating data, expert opinion and fuzzy logic in the development of an index of wetland condition
Phil J. Papas A D , David S. L. Ramsey A , Janet Holmes B , Doug Frood C and Shanaugh Lyon B
A Arthur Rylah Institute for Environmental Research, Department of Environment, Land, Water and Planning, 123 Brown Street, Heidelberg, Vic. 3084, Australia.
B Department of Environment, Land, Water and Planning, 8 Nicholson Street, East Melbourne, Vic. 3002, Australia.
C Pathways Bushland & Environment, 134 Wonganookah Track, Marraweeney, Vic. 3669, Australia.
D Corresponding author. Email: phil.papas@delwp.vic.gov.au
Marine and Freshwater Research 73(10) 1184-1195 https://doi.org/10.1071/MF21197
Submitted: 1 July 2021 Accepted: 25 December 2021 Published: 22 February 2022
Journal Compilation © CSIRO 2022 Open Access CC BY-NC-ND
Abstract
Wetlands face an intensifying level of degradation, and management to protect their extent and character is paramount. To support wetland management in south-east Australia, we developed a wetland condition assessment tool for palustrine and lacustrine wetlands. Through extensive consultation with end users during its development, the tool, the Index of Wetland Condition (IWC), considers user needs and skills, as well as attempts to assess the complex nature of wetland systems and their inherent variability, both spatially and temporally. The IWC is structured as a hierarchical index with 13 indicators nested under six characteristics (subindices) that influence wetland function: wetland catchment, physical form, wetland soils, water properties, hydrology and biota. The contribution of each to the overall index (scored along a condition gradient) was estimated from quantitative biological and physicochemical data from 24 wetlands using a fuzzy cognitive map approach. The IWC development framework will be particularly useful in jurisdictions globally where reference condition information is limited or lacking for indicators, or where there are substantial practical constraints that limit the selection of indicators, such as management staff capability or capacity. Uptake of the IWC with wetland practitioners in south-east Australia has been substantial.
Keywords: condition index, fuzzy cognitive map, management, practical considerations, reference condition, wetland.
Introduction
Wetlands are important habitats for biodiversity and provide many ecosystem services, including regulation of extreme events associated with climate change, biogeochemical cycling that is contributing to improved water quality and cultural services (Millennium Ecosystem Assessment 2003; Maltby et al. 2013; Meli et al. 2014). However, wetlands globally face an intensifying level of degradation from human activities (Davidson 2014; Finlayson et al. 2017). The most significant impact of these activities has been the complete loss of wetlands in some landscapes (Ausseil et al. 2011; Davidson 2014; Darrah et al. 2019).
Measuring the level of degradation in complex systems such as wetlands is difficult because of their dynamism and spatiotemporal variability. This is especially so for wetlands in Mediterranean climates (Ortega et al. 2004; Rouissi et al. 2014). In addition, wetland managers are often constrained in effectively monitoring and assessing these systems because of limited resources and expertise (De Leo and Levin 1997; Kotze et al. 2012). Condition assessment methods aim to summarise the massive complexity in wetland function and provide a simple measure or suite of measures that can be used to monitor changes in wetland components and function over time (Gardner and Davidson 2011; Finlayson et al. 2017). Approaches to developing condition assessment methods include an assessment of:
-
the whole wetland, using indicators based on wetland characteristics and components (e.g. soils, hydrology, biota) or specific biotic groups, such as invertebrates or fish (see Roth et al. 1996; Spencer et al. 1998; Ladson et al. 1999; Bolton 2003)
-
the whole wetland, using indicators based on impacts or threats known to damage wetlands (see Brooks et al. 2017; Clarkson et al. 2003)
-
specific biotic groups as a surrogate for wetland condition (see Davis et al. 1999; Chessman et al. 2002)
-
the condition of higher-level wetland biotic groups (such as fish or amphibians) rather than wetland condition (e.g. United States Environmental Protection Agency 2002; Mack 2007).
Wetland condition assessment methods have been developed in many countries and regions to address local wetland management needs and international reporting obligations. The US has an abundance of such methods in various jurisdictions (Fennesy et al. 2007), with approaches typically targeted at specific wetland types (see Fennesy et al. 2007; Martínez-López et al. 2014) and using large ecological datasets. In some contexts, for example when there is a need for broad-scale condition assessment and ecological data are limited, expert elicitation combined with modelling approaches using the available ecological data can maximise the integrity of the method.
In south-eastern Australia, there is an increasing need to be able to assess the condition of wetlands to enable surveillance monitoring for management purposes and to meet national and international reporting obligations. Scrutiny of wetland condition assessment methods that have been developed and adopted globally (Department of Sustainability and Environment 2007) or in parts of south-east Australia (Spencer et al. 1998) reveal they cannot be directly applied or adapted because of constraints on the availability of ecological data, resources and expertise.
This paper describes the development of an index to address this need, namely the Index of Wetland Condition (IWC). The IWC is relevant to palustrine and lacustrine wetlands (Ramsar Convention 2005) and its development framework used an approach that managed the limited data available using expert elicitation and fuzzy cognitive maps (FCMs). FCMs are graphical models related to Bayesian networks and artificial neural network models (Kosko 1992). FCMs encode relationships among variables of interest using a directed graph where the nodes represent variables or concepts of interest and the links or ‘edges’ between nodes represent cause-and-effect relationships (Kosko 1986). Such models have previously been used in ecology to model causal relationships among species or guilds to represent community structure (Hobbs et al. 2002; Ramsey and Veltman 2005; Ramsey and Norbury 2009). Because FCMs can encode qualitative relationships between variables, they are ideally suited to model relationships among wetland condition measures, especially where such measures consist of qualitative expressions of condition, which may be derived from expert opinion.
We describe the core characteristics of the IWC, the assessment of its indicators and the relative importance and contribution of the indicators to overall wetland condition. The current and potential uses of the index, future enhancement and application are also presented. We also highlight potential situations where the processes used in the development of the IWC could inform the design and implementation of analogous monitoring programs.
IWC design
The design of the IWC followed four key steps: (1) the development of a conceptual model of wetland function to underpin the index structure and framework; (2) identification of indicators, sourced from the literature and filtered in consideration of the practical requirements of end users and the ecological requirements of the index; (3) the development of an indicator scoring system and assigning a level of confidence to the indicator assessment; and (4) using expert elicitation and a FCM framework to identify the relative contribution of each characteristic to the overall IWC and determining the linguistic categories for condition scores.
Development of a conceptual model of wetland function
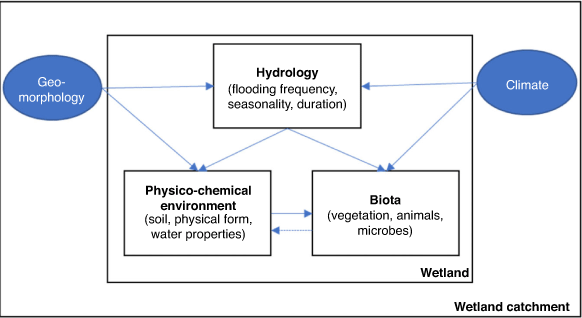
Wetland condition was defined as the ‘state of the biological, physical and chemical components of the wetland ecosystem and their interactions’. This is the definition used by the Ramsar Convention to describe ‘ecological character’ (Ramsar Convention 2005). A simplified conceptual model of wetland function, adapted from Mitsch and Gosselink (2000), was used to identify the core characteristics of the IWC and its components that were applicable to all wetlands in its geographical scope. We recognise that this model (Fig. 1) is simplistic, but its primary purpose was to define the most critical characteristics of wetland function: hydrology, physicochemical properties, soils and biota. We added the adjoining wetland catchment to the model because it has a marked influence on condition for many wetlands in the study area (Fig. 1).
|
Indicator selection and filtering
Indicators that measure specific components of each wetland characteristic were identified from an extensive list of candidates sourced from the wetland assessment literature (Spencer et al. 1998; Davis et al. 1999; Chessman et al. 2002; United States Environmental Protection Agency 2002; Bolton 2003; Clarkson et al. 2003; Ortega et al. 2004; Mack 2007), an assessment of threats to wetlands in Victoria (Department of Sustainability and Environment 2005) and consultation with wetland experts (Table 1). Specific indicators for each component of each wetland characteristic are listed in Appendix 1. Indicators were included based on whether they could be practically applied and whether reference condition could be determined from the literature and available ecological data. For components for which no reference condition is available, reference condition is inferred as the absence of threats operating on the components (based on an assessment of threats at the site).

|
The applicability of the candidate indicators was assessed according to criteria obtained from the literature, and adjusted to take into account the practical and ecological requirements of the IWC.
Breckenridge et al. (1995) and Jackson et al. (2000) suggest that indicators should be applicable and readily interpretable across different regions, correlate with changes in ecosystem processes, encompass temporal and spatial variability and be responsive to change.
In addition to these criteria, whether an indicator exhibited a known reference condition and optimally complemented other indicators in describing the complexity were also considered key criteria. The fundamental reference condition adopted by the index was a wetland in its natural state, free of human disturbance, at the time of European settlement (i.e. within the past 200 years; Ladson et al. 1999; Downes 2006). The reference condition for each indicator was specified or informed by the wetland literature (Castelle et al. 1994; Davies and Lane 1995; Boyd 2001), expert opinion and wetland plant data. For vegetation indicators, reference condition was regionalised using a wetland vegetation typology with 151 ecological vegetation classes (EVCs). The classes have indicator species and are designated based on overall vegetation structure. Mapping of these vegetation classes is not required for application of the indicators because EVCs can be identified on-site (Department of Environment, Land, Water and Planning 2018).
Cost-effectiveness and consideration of labour, equipment, analytical and data analysis costs were identified by Breckenridge et al. (1995) and Jackson et al. (2000) as important practical considerations for indicators. Practical requirements of the IWC, identified from extensive consultation with end users (wetland managers and regional planners from across the state), were threefold: feasibility within short timelines, requiring modest financial resourcing and not placing excessive demands on staff expertise. This meant that for maximum uptake the index needed to be feasible at any time of year (regardless of the wetland hydrological phase), able to be completed in a single visit, easy to implement and able to provide results that could be easily interpreted by planners and managers with limited expertise. It was also intended that the index could be applied to individual wetlands to identify long-term (>10 years) trends in condition (Department of Sustainability and Environment 2005).
Taking into account both the ecological and practical requirements of the IWC, the resultant IWC indicator assessment criteria:
-
were applicable to all wetlands in the region (Australian jurisdiction of Victoria)
-
were repeatable and suitable at any time of year
-
involved a single measurement able to be taken per year (the indicator not being temporally variable over the course of the year)
-
were responsive to changes over 3- to 5-year timescales (a time step considered suitable for the intended use of the IWC, and the Ramsar reporting cycle; Davidson et al. 2020)
-
yielded results that were easy to interpret
-
could be compared with a known reference condition or an assessment of threats operating on the component that could be assessed
-
optimally complemented the already chosen indicators in describing complexity.
Assessed against these criteria, the final list of indicators (Table 2) consisted of either direct measures of the components or processes themselves (e.g. wetland soil disturbance, wetland plant life forms, wetland weed cover) or measures of threats to the components. The latter are sometimes referred to as surrogate indicators (Kent et al. 1992; Spencer et al. 1998). The characteristics to which the indicators belong form the top tier of the index structure (i.e. its subindices).

|
Scoring indicators and assigning a level of confidence to their assessment
For all indicators, the greater the departure from the reference, the lower the score. For example, for the ‘buffer width’ indicator, the reference condition was defined as >50 m, which reflected the maximum buffer scores in other condition assessment methods (Castelle et al. 1994; Boyd 2001; Mack 2007). In the IWC, a maximum score is thus obtained for an average buffer width of >50 m, whereas a minimum score is obtained for an average buffer width of <5 m (Table 3). The scoring framework for each is presented in an excerpt from Department of Environment, Land, Water and Planning (2019) in the Supplementary material (Fig. S1).

|
To maximise confidence in the assessment of the indicators, multiple lines of evidence of impacts were included in the assessment. For example, to assess the indicator for nutrients, ‘severity of change in nutrient enrichment’, all the activities that contributed to it (point source discharges, diffuse run-off, grazing by livestock, grazing by feral animals, application of fertiliser, aquaculture) and any evidence of it (algal blooms, nutrient data) needed to be documented and considered. This approach was used for surrogate indicators in the hydrology, physical form and soils characteristics.
Weighting the subindices and developing linguistic categories of condition
The overall IWC score is represented as the sum of the six contributing subindices as a weighted sum:
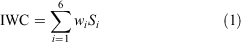
where wi are the weights and Si are the scores for each of the i characteristics (i = 1…6). The weight represents the relative importance of each characteristic (subindex) to the overall IWC.
Expert elicitation based on quantitative data was used together with condition data obtained from the IWC in a FCM framework to identify wi and linguistic categories of condition (excellent, good, poor). Nine wetland experts with a range of wetland ecology backgrounds (invertebrates, water chemistry, wetland vegetation and amphibians) participated in the process. Each expert was provided with intensive ecological datasets, land use mapping and aerial imagery from 24 wetlands in western Victoria that had been assessed using the IWC method. The level of disturbance and condition of these wetlands were representative of those across the broader study region. The ecological data, which included geomorphology, soils, electrical conductivity, pH, nutrients, turbidity, wetland plants, birds, frogs, diatoms, rotifers, zooplankton and macroinvertebrates, were used by the experts to assign a condition score on a scale from 1 to 10 for each of the wetland subindices (e.g. biota, hydrology, soils) and overall condition. Experts also classified their scores for individual subindices and the overall score as ‘poor’, ‘good’, ‘very good’ or ‘excellent’. Experts each assessed between 11 and 16 wetlands, with each of the 24 wetlands receiving between 4 and 6 assessments. The resulting training data consisted of total of 111 assessments.
The weights for each of the subindices were estimated from the expert opinion data using a FCM. As noted earlier, FCMs are graphical models related to Bayesian networks and artificial neural network models and encode relationships between variables of interest using a directed graph in which the nodes represent variables or concepts of interest and the links or ‘edges’ between nodes represent cause-and-effect relationships (Kosko 1992). A FCM model was constructed to represent the IWC index as the output node and the six subindices as input nodes (Fig. 2). Each of the edges connecting each subindex and the IWC represented the (weighted) influence of that characteristic on the IWC.
|
The model was fitted to expert opinion data to determine the appropriate edge weights for each of the subindices. Because the scoring of each component and the overall IWC was a subjective exercise, there was some uncertainty or ‘vagueness’ in the assessment. Vagueness results when the score for a component (e.g. the value ‘good’) is interpreted slightly differently by different experts. To handle this vagueness, we used fuzzy logic, the mathematics behind computing with language (Zimmermann 1996).
Fuzzy sets explicitly model the relationship between vague linguistic descriptors used to describe the ‘state’ of a component and the resulting score assigned to that component. This process, known as fuzzification, takes values (e.g. scores) and classifies them into an arbitrary number of categories or sets (e.g. ‘low’ or ‘high’). Unlike ordinary sets that have ‘hard’ boundaries, fuzzy set boundaries are ‘soft’, reflecting uncertainty in the boundary of the set. This means a score can belong to more than one set.
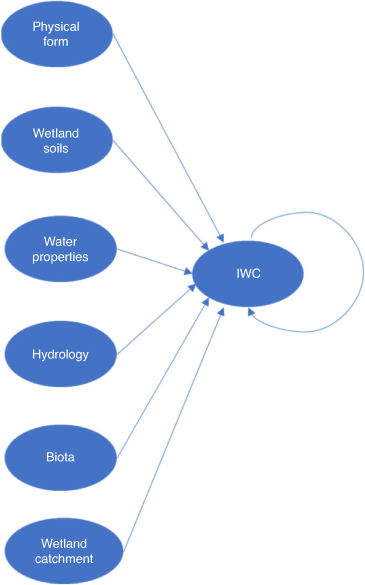
Fuzzy sets were constructed to represent each of the four linguistic classifications of condition (‘poor’, ‘good’, ‘very good’, ‘excellent’; Fig. 3). The linguistic classifications, as well as the upper and lower boundaries of each set, were elicited by expert opinion and represent an estimate of the ‘vagueness’ around each linguistic classification for a given score. Hence, based on expert opinion, wetlands with an index score of 9 or 10 definitely represent wetlands in ‘excellent’ condition, but, if the score is <7, it is considered that the wetland is definitely not ‘excellent’. Thus, scores between 7 and 9 represent wetlands that are ‘somewhat’ or ‘partially’ excellent. Because each fuzzy set has overlapping boundaries, scores of 7 and 9 also partially belong to the fuzzy set ‘very good’. Hence, any score can be represented by a membership function representing the vector of membership values of each set for that score. Another feature of the fuzzy set procedure used here is that these fuzzy set membership values can be integrated to calculate a single (fuzzy) output value (called ‘defuzzification’). This value is called a ‘fuzzy score’ and is an approximate number. Hence, a fuzzy score of 5 is interpreted vaguely (e.g. ‘about 5’). Both the ‘fuzzy set’ (linguistic approximations of ‘poor’, ‘good’) and ‘defuzzified’ scores were produced from our model to predict the overall IWC.
|
Training the model
To train the model, single observations from the training data, consisting of scores for each of the six individual subindices, were ‘fuzzified’ and entered into the model. The overall IWC score was then predicted by ‘defuzzification’, again using the fuzzy sets. This was repeated for each of the observations in the training dataset. For a training dataset consisting of n observations, the predicted IWC scores were compared with the observed (expert-elicited) IWC score by calculating the ‘fitness’:
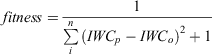
where IWCp is the predicted IWC score and IWCo is the observed IWC score. The objective of the training was to find the edge weights for the FCM model that have maximum fitness. Using a stochastic global optimisation routine based on a particle swarm algorithm (e.g. Petalas et al. 2009), estimates of the best-fitting edge weights for the FCM were determined. The problem of over-training bias, a phenomenon in which the model predicts the observed data at hand well but predicts new data poorly, was reduced using a cross-validation procedure. To do this, a portion of the training data was left out and the model was trained on the remaining data with predictions then made on the data left out (the prediction set). This cross-validation procedure was repeated using five subsets (folds) of the data with the model used to predict both the IWC score and score class category for each of the prediction sets. Two measures of predictive accuracy were used to assess model fit, namely linguistic accuracy and relative bias, defined respectively as:

and

where LA is the measure of linguistic accuracy, defined as the sum of the correctly predicted score categories f(i) divided by the total number of predicted observations (n). Relative bias (RB) was calculated as the mean of the relative bias estimates between predicted and observed IWC scores (see Stach et al. 2008).
Measure of accuracy and edge weights for subindices
The overall linguistic accuracy was 72%, meaning the model predicted the correct score category (e.g. ‘good’, ‘poor’) 72% of the time, on average. Estimates of relative bias were low, with a mean error of 11% (i.e. the predicted IWC score differed by an average of 11% from the observed IWC score).
The overall best-fit estimates of the edge weights for each subindex, averaged over the five training sets, ranged from 0.07 for soils to 0.73 for biota (Table 4). These were adopted as the weights for each subindex, used in the calculation of the overall IWC score.

|
Discussion
Many of the world’s wetlands are vulnerable to threats from many aspects of human civilisation, and large losses of wetlands have occurred globally (Davidson 2014). Wetlands that remain in the landscape are being degraded by a multitude of threats, especially those in agricultural and urban settings. Identifying and mitigating these threats is often a focus of wetland management. Key to this is an understanding of the impacts of threats on wetland components and the actions needed to mitigate them. The IWC was developed considering all wetland components and the threats operating on them.
IWC development used a systematic, transparent process in determining its structure and indicators that included filtering candidate indicators through the practical requirements of end users and the ecological requirements of the index. Expert elicitation (with multiple experts and datasets) and a FCM approach were used to assess the relative importance of the IWC indicators and to identify weights for each characteristic. The use of this approach, although common in other applications (Kahraman et al. 2003, 2006), has thus far been limited in the context of wetland condition assessment (Fennesy et al. 2007; Chatterjee et al. 2015). Therefore, many existing tools have assumed that indictors have an equally important contribution to wetland condition. Through a FCM approach, we identified that wetland plant indicators were relatively more important than wetland physical form (bathymetry) or soil indicators. This can be attributed to the comprehensive wetland plant typology that underlies the assessment of the plant indicators.
Managing constraints
The IWC approach balanced practical and ecological requirements, which meant that some important constraints needed to be overcome. The need to apply the index at any time of year (regardless of the wetland hydrological phase) in a one-off measurement and the lack of a regionalised reference condition limited the number of direct measures for several indicators. In the ‘water properties’ characteristic, direct measures of nutrients and salinity could not be used because many wetlands are seasonally dry, and multiple measurements are required to account for their large-magnitude temporal variation (particularly for seasonal wetlands). Surrogate indicators were therefore selected and, to maximise the confidence in these measures, we adopted a multiple-lines-of-evidence approach. A supplementary benefit of explicit assessment of threatening activities is that managers can also use this information for ‘threat’ identification.
Knowing the reference condition for each indicator is critical for the overall assessment of condition (Anderson 1991; Ladson et al. 1999; Downes 2006; Herlihy et al. 2008). A wetland typology takes account of spatial variability among wetlands from different landscapes (Fennesy et al. 2007) and is a useful approach for land use, physical or chemical reference criteria (Herlihy et al. 2008; Hawkins et al. 2010). Other than for vegetation (Department of Environment, Land, Water and Planning 2018), an appropriate typology was not available to assist with the determination of reference condition for many indicators and, as such, many were set as the absence of any impacts.
IWC use and future development
Following training in the practical and theoretical aspects of the IWC, its uptake and application has been substantial. It has been used by more than 20 natural resource management and government agencies, which has resulted in an assessment of more than 1600 wetlands (Papas and Moloney 2012). Predominant uses have been measuring changes in ecological character for Ramsar reporting obligations (Ramsar Convention 2005), identifying threats and impacts to wetlands and benchmarking wetland condition to examine longer-term trends in response to threat mitigation (e.g. livestock grazing, changes to the wetland water regime). The IWC has also been adopted as one of several metrics in a formula that assesses return on investment (condition gain) from proposals by private landholders to improve the condition of wetlands on their properties.
Considering its current limitations, future development of the index should seek improvements to reference condition regionalisation at broad and fine scales. A new wetland typology for wetlands in Victoria has been developed (Department of Environment, Land, Water and Planning 2016), which could support regionalised reference conditions for some indicators for certain wetland types (e.g. salinity concentrations in alpine wetlands). At a finer scale, Hawkins et al. (2010) recommend site-specific determinations for reference conditions based on predictive models. This approach has been found to be useful in other regions (Mazor et al. 2016; Stein et al. 2017).
A study is presently under way in Australia characterising water regimes of wetlands from surface water detection over the life (from 1987 to present) of the Landsat Thematic Mapper sensor (Mueller et al. 2016; Dunn et al. 2019). These data have the potential to validate or update the new wetland typology and define reference hydrological conditions for the new wetland types.
Application of the IWC development framework
The IWC was needed for a broad-scale assessment of wetland condition to meet regional and international reporting obligations and to assist wetland management. In addition, a key outcome of the use of the index across the region has been an increased awareness of wetlands by agencies and the community, the threats that affect them and wetland conservation on public and private land tenure. To improve discrimination in condition categories for reporting purposes, a richer set of linguistic descriptors (‘very poor’, ‘poor’, ‘moderate’, ‘good’ and ‘excellent’) were adopted before implementation of the IWC. Assignment of scores to these categories is unconnected to the approach and linguistic descriptors used by the experts for determination of subindex weights.
The systematic and transparent process used in the IWC development framework considers data limitations and end user requirements while employing extensive consultation with end users. In regions where limited financial resources and management capability are constraints to meeting obligations such as reporting on changes in ecological character of Ramsar wetlands (Davidson et al. 2020), the IWC development framework could be considered to meet these needs.
Indicators from five of the IWC’s six subindices can be applied to any palustrine or lacustrine wetland globally, and although the vegetation indicators are linked to a regionalised vegetation typology, the indicators themselves (life forms, weeds, indicators of altered processes, vegetation structure and health) are relevant to any wetland plant typology.
The development style of the IWC, combining data, expert elicitation and fuzzy modelling, has not commonly been used for this type of application, and as such represents a novel approach in this context. Although the method investigates and assesses wetlands, there is a similar need for condition information for other ecosystems, such as rivers, estuaries, forests.
The IWC framework will be directly useful in the following situations: threat identification; where broad-scale condition assessment of wetlands is required (encompassing multiple systems); where the reference condition of some wetland components and indicators may be limited; and where there are substantial practical constraints, such as in management capability or capacity.
As human disturbances continue to threaten ecosystems, there is an ongoing need for the continued development of approaches to assess ecological condition. The development and construction of these approaches should be tailored to the particular needs and contexts and should consider their practical implementation.
Availability of data and material
All data and materials, and custom code comply with field standards. The expert elicitation and Index of Wetland Condition data that support the findings of this study are available from the Arthur Rylah Institute, Department of Environment, Land, Water and Planning (research.ari@delwp.vic.gov.au).
Conflicts of interest
The authors declare that they have no conflicts of interest.
Declaration of funding
This study received financial support of the Victorian Government and Australian Government under the National Action Plan for Salinity and Water Quality and the Natural Heritage Trust programs.
Acknowledgements
A panel of wetland ecologists and land practitioners formed an expert panel that assisted in the development of the method. The contributions from the panel members are greatly appreciated. Panel members are: Craig Allen (formerly of the Corangamite Catchment Management Authority), Rhonda Butcher (Waters Edge Consulting), Jody Chinner (Glenelg Hopkins Catchment Management Authority), Jenny Davis (formerly of Murdoch University), Jodie Halliwel (East Gippsland and West Gippsland Catchment Management Authorities), Shelley Heron (formerly of Heron Consulting), Amy Jansen (Charles Sturt University), Eleisha Keogh (formerly of the Department of Primary Industries, Victoria), Stephen Perriss (formerly of the Environment Protection Authority), Sharada Ramamurthy (formerly of the Mallee Catchment Management Authority), Jane Roberts (Ecological Consultant, Canberra), Sabine Schreiber (formerly of the Department of Sustainability and Environment, Victoria), Will Steele (Melbourne Water Corporation) and Rebecca White (formerly of the Mallee Catchment Management Authority). Comments on the manuscript were provided by Pam Clunie, Diane Crowther, Rob Hale and Kay Morris (Department of Environment, Land, Water and Planning, Victoria).
References
Anderson, J. E. (1991). A conceptual framework for evaluating and quantifying naturalness. Conservation Biology 5, 347–352.| A conceptual framework for evaluating and quantifying naturalness.Crossref | GoogleScholarGoogle Scholar |
Ausseil, A.-G. E., Chadderton, W. L., Gerbaux, P., Stephens, R. T. T., and Leathwick, J. R. (2011). Applying systematic conservation planning principles to palustrine and inland saline wetlands of New Zealand. Freshwater Biology 56, 142–161.
| Applying systematic conservation planning principles to palustrine and inland saline wetlands of New Zealand.Crossref | GoogleScholarGoogle Scholar |
Bolton, K. G. E. (2003). ‘North Coast Wetland Assessment Field Manual: Fresh Water Wetlands & Farm Dams.’ (Department of Land and Water Conservation and Southern Cross University: Coolangatta, Qld, Australia.)
Boyd, L. (2001). Buffer zones and beyond. Wetland Conservation Professional Program. (Department of Natural Resources Conservation, University of Massachusetts: Amherst, MA, USA.) Available at https://ag.umass.edu/sites/ag.umass.edu/files/pdf-doc-ppt/final_project.pdf [Verified 25 April 2019].
Breckenridge, R. P., Kepner, W. G., and Mouat, D. A. (1995). A process for selecting indictors for monitoring conditions of rangeland heath. Environmental Monitoring and Assessment 36, 45–60.
| A process for selecting indictors for monitoring conditions of rangeland heath.Crossref | GoogleScholarGoogle Scholar | 24197675PubMed |
Brooks, R. P., Wardrop, D. H., and Bishop, J. A. (2017). Pennsylvania wetland condition level 2 rapid assessment protocol. (Pennsylvania Department of Environmental Protection: Harrisburg, PA, USA.) Available at http://files.dep.state.pa.us/PublicParticipation/Advisory%20Committees/AdvCommPortalFiles/WRAC/2016/092116/310-2137-002.pdf [Verified 25 April 2019].
Castelle, A. J., Johnson, A. W., and Conolly, C. (1994). Wetland and stream buffer size requirements – a review. Journal of Environmental Quality 23, 878–882.
| Wetland and stream buffer size requirements – a review.Crossref | GoogleScholarGoogle Scholar | 34872206PubMed |
Chatterjee, I., Bandyopadhyay, A., Ghosh, A., and Kar, S. (2015). Assessment of environmental factors causing wetland degradation using Fuzzy Analytic Network Process: a case study on Keoladeo National Park, India. Ecological Modelling 316, 1–13.
| Assessment of environmental factors causing wetland degradation using Fuzzy Analytic Network Process: a case study on Keoladeo National Park, India.Crossref | GoogleScholarGoogle Scholar |
Chessman, B. C., Trayler, K. M., and Davis, A. J. (2002). Family and species level biotic indices for invertebrates in the wetlands of the Swan Coastal Plain, Western Australia. Marine and Freshwater Research 53, 919–930.
| Family and species level biotic indices for invertebrates in the wetlands of the Swan Coastal Plain, Western Australia.Crossref | GoogleScholarGoogle Scholar |
Clarkson, B. R., Sorrell, B. K., Reeves, P. N., Champion, P. D., Partridge, T. R., and Clarkson, B. D. (2003). ‘Handbook for Monitoring Wetland Condition. Coordinated Monitoring of New Zealand Wetlands.’ (Ministry for the Environment: Wellington, New Zealand.)
| Crossref |
Darrah, S. E., Shennan-Farpón, Y., Loh, J., Davidson, N. C., Finlayson, F., Gardner, R. C., and Walpole, M. J. (2019). Improvements to the Wetland Extent Trends (WET) index as a tool for monitoring natural and human-made wetlands. Ecological Indicators 99, 294–298.
| Improvements to the Wetland Extent Trends (WET) index as a tool for monitoring natural and human-made wetlands.Crossref | GoogleScholarGoogle Scholar |
Davidson, N. C. (2014). How much wetland has the world lost? Long-term and recent trends in global wetland area. Marine and Freshwater Research 65, 934–941.
| How much wetland has the world lost? Long-term and recent trends in global wetland area.Crossref | GoogleScholarGoogle Scholar |
Davidson, N. C., Dinesen, L., Fennesy, S., Finlayson, C. M., Grillas, P., Grobricki, A., McInnes, R. J., and Stroud, D. A. (2020). A review of the adequacy of reporting to the Ramsar Convention on change of ecological character in wetlands. Marine and Freshwater Research 71, 117–126.
| A review of the adequacy of reporting to the Ramsar Convention on change of ecological character in wetlands.Crossref | GoogleScholarGoogle Scholar |
Davies, P. M., and Lane, J. A. K. (1995). Guidelines for design of effective buffers for wetlands on the Swan Coastal Plain. Report to the Australian Nature Conservation Agency, Australian Capital Territory. Available at https://trove.nla.gov.au/work/31878862?q&versionId=38687765 [Verified 25 April 2019].
Davis, J., Horwitz, P., Norris, R., Chessman, B. (1999). Monitoring wetlands health: are National River Health Program protocols applicable? National Wetlands Research and Development Program. (Department of Environment and Heritage: Canberra, ACT, Australia.) Available at http://www.environment.gov.au/water/wetlands/publications/monitoring-wetlands-health-are-national-river-health-program-protocols-applicable [Verified 25 April 2019].
De Leo, G. A., and Levin, S. (1997). The multifaceted aspects of ecosystem integrity. Conservation Ecology 1, art3.
| The multifaceted aspects of ecosystem integrity.Crossref | GoogleScholarGoogle Scholar |
Department of Environment, Land, Water and Planning (2016). The Victorian wetland classification framework 2014. (DELWP: Melbourne, Vic., Australia.) Available at https://www.water.vic.gov.au/__data/assets/pdf_file/0023/52763/Final-for-publicatn-Wetland-Classification-Report-8Mar16.pdf [Verified 25 April 2019].
Department of Environment, Land, Water and Planning (2018). Index of Wetland Condition – assessment of wetland vegetation. (DELWP: Melbourne, Vic., Australia.) Available at https://iwc.vic.gov.au/docs/IWC%20Assessment%20of%20wetland%20vegetation%20-%20February%202018.pdf [Verified 25 April 2019].
Department of Environment, Land, Water and Planning (2019). Index of Wetland Condition assessment procedure February 2019. DELWP, Melbourne, Vic., Australia.
Department of Sustainability and Environment (2005). Index of Wetland Condition. Conceptual framework and selection of measures. (DSE: Melbourne, Vic., Australia.) Available at https://iwc.vic.gov.au/docs/IWC_Conceptual_Framework_and_Selection_of_Measures_2005.pdf [Verified 25 April 2019].
Department of Sustainability and Environment (2007). Index of Wetland Condition. Review of wetland assessment methods. (DSE: Melbourne, Vic., Australia.) Available at https://iwc.vic.gov.au/docs/IWC_Review_Methods.pdf [Verified 25 April 2019].
Downes, B. J. (2006). Monitoring experiences from Downunder – the importance of deciding a priori what constitutes a significant environmental change. In ‘Biological Monitoring of Rivers’. (Eds G. Ziglio, M. Siligardi, and G. Flaim.) pp. 369–282. (Wiley: Chichester, UK)
Dunn, B., Lymburner, L., Newey, V., Hicks, A., and Carey, H. (2019). Developing a tool for wetland characterization using fractional cover, tasseled cap wetness and water observations from space. In ‘2019 IEEE International Geoscience & Remote Sensing Symposium: Proceedings’, 28 July–2 August 2019, Yokohama, Japan. IEEE Catalog Number: CFP19IGA-ART, pp. 6095–6097. (IEEE.)
Fennesy, S., Jacobs, A. D., and Kentulam, M. E. (2007). An evaluation of rapid methods for assessing the ecological condition of wetlands. Wetlands 27, 543–560.
| An evaluation of rapid methods for assessing the ecological condition of wetlands.Crossref | GoogleScholarGoogle Scholar |
Finlayson, C. M., Capon, S. J., Rissik, D., Pittock, J., Fisk, G., Davidson, N. C., Bodmin, K. A., Papas, P., Robertson, H. A., Schallenberg, M., Saintilan, N., Edyvane, K., and Bino, G. (2017). Policy considerations for managing wetlands under a changing climate. Marine and Freshwater Research 68, 1803–1815.
| Policy considerations for managing wetlands under a changing climate.Crossref | GoogleScholarGoogle Scholar |
Gardner, R. C., and Davidson, N. C. (2011). The Ramsar Convention. In ‘Wetlands – Integrating Multidisciplinary Concepts’. (Ed. B. A. LePage.) pp. 189–203. (Springer: Dordrecht, Netherlands.)
Hawkins, C. P., Olson, J. R., and Hill, R. A. (2010). The reference condition: predicting benchmarks for ecological and water-quality assessments. Journal of the North American Benthological Society 29, 312–343.
| The reference condition: predicting benchmarks for ecological and water-quality assessments.Crossref | GoogleScholarGoogle Scholar |
Herlihy, A. T., Paulsen, S. G., Van Sickle, J., Stoddard, J. L., Hawkins, C. P., and Yuan, L. L. (2008). Striving for consistency in a national assessment: the challenges of applying a reference-condition approach at a continental scale. Journal of the North American Benthological Society 27, 860–877.
| Striving for consistency in a national assessment: the challenges of applying a reference-condition approach at a continental scale.Crossref | GoogleScholarGoogle Scholar |
Hobbs, B. F., Ludsin, S. A., Knight, R. L., Ryan, P. A., Biberhofer, J., and Ciborowski, J. J. H. (2002). Fuzzy cognitive mapping as a tool to define management objectives for complex ecosystems. Ecological Applications 12, 1548–1565.
| Fuzzy cognitive mapping as a tool to define management objectives for complex ecosystems.Crossref | GoogleScholarGoogle Scholar |
Jackson, L. E., Kurtz, J. C., and Fisher, W. S. (Eds) (2000). Evaluation guidelines for ecological indicators. EPA/620/R-99/005. (US Environmental Protection Agency, Office of Research and Development, Research Triangle Park, NC, USA.) Available at https://archive.epa.gov/emap/archive-emap/web/html/ecoind.html [Verified 25 April 2019].
Kahraman, C., Ruan, D., and Dogan, I. (2003). Fuzzy group decision-making for facility location selection. Information Sciences 157, 135–153.
| Fuzzy group decision-making for facility location selection.Crossref | GoogleScholarGoogle Scholar |
Kahraman, C., Ertay, T., and Buyukozkan, G. (2006). A fuzzy optimization model for QFD planning process using analytic network approach. European Journal of Operational Research 171, 390–411.
| A fuzzy optimization model for QFD planning process using analytic network approach.Crossref | GoogleScholarGoogle Scholar |
Kent, D. M., Reimold, R. J., Kelly, J. M., and Tammi, C. E. (1992). Coupling wetlands structure and function: developing a condition index for wetlands monitoring. In ‘Ecological Indicators, Volume 1. Applied Science’. (Eds D. H. McKenzie, D. E. Hyatt, and V. J. McDonald.) pp. 557–568. (Elsevier: New York, NY, USA.)
Kosko, B. (1986). Fuzzy cognitive maps. International Journal of Man-Machine Studies 24, 65–75.
| Fuzzy cognitive maps.Crossref | GoogleScholarGoogle Scholar |
Kosko, B. (1992). ‘Neural networks and fuzzy systems: a dynamical systems approach to machine intelligence.’ (Prentice-Hall Inc.: Englewood Cliffs, NJ, USA.)
Kotze, D. C., Ellery, W. N., Macfarlane, D. M., and Jewitt, G. P. W. (2012). A rapid assessment method for coupling anthropogenic stressors and wetland ecological condition. Ecological Indicators 13, 284–293.
| A rapid assessment method for coupling anthropogenic stressors and wetland ecological condition.Crossref | GoogleScholarGoogle Scholar |
Ladson, A. R., Lindsay, J. W., Doolan, J. A., Finlayson, B. L., Hart, B. T., Lake, S., and Tilleard, J. W. (1999). Development and testing of an Index of Stream Condition for waterway management in Australia. Freshwater Biology 41, 453–468.
| Development and testing of an Index of Stream Condition for waterway management in Australia.Crossref | GoogleScholarGoogle Scholar |
Mack, J. J. (2007). Developing a wetland IBI with statewide application after multiple testing iterations. Ecological Indicators 7, 864–881.
| Developing a wetland IBI with statewide application after multiple testing iterations.Crossref | GoogleScholarGoogle Scholar |
Maltby, E., Acreman, M., Blackwell, M., Everard, M., and Morris, J. (2013). The challenges and implications of linking wetland science to policy in agricultural landscapes – experience from the UK National Ecosystem Assessment. Ecological Engineering 56, 121–133.
Martínez-López, J., Carreno, M. F., Martínez-Fernández, J., and Esteve, M. A. (2014). Wetland and landscape indices for assessing the condition of semiarid Mediterranean saline wetlands under agricultural hydrological pressures. Ecological Indicators 36, 400–408.
| Wetland and landscape indices for assessing the condition of semiarid Mediterranean saline wetlands under agricultural hydrological pressures.Crossref | GoogleScholarGoogle Scholar |
Mazor, R. D., Rehn, A. C., Ode, P. R., Engeln, M., Schiff, K. C., Stein, E. D., Gillett, D. J., Herbst, D. B., and Hawkins, C. P. (2016). Bioassessment in complex environments: designing an index for consistent meaning in different settings. Freshwater Science 35, 249–271.
| Bioassessment in complex environments: designing an index for consistent meaning in different settings.Crossref | GoogleScholarGoogle Scholar |
Meli, P., Benayas, J. M. R., Balvanera, P., and Ramos, M. M. (2014). Restoration enhances wetland biodiversity and ecosystem service supply, but results are context-dependent: a meta-analysis. PLoS One 9, e93507.
| Restoration enhances wetland biodiversity and ecosystem service supply, but results are context-dependent: a meta-analysis.Crossref | GoogleScholarGoogle Scholar | 24743348PubMed |
Millennium Ecosystem Assessment (2003). Ecosystems and human well-being: a framework for assessment. (Wetlands and Water: Washington, DC, USA.) Available at http://pdf.wri.org/ecosystems_human_wellbeing.pdf [Verified 25 April 2019].
Mitsch, W. J., and Gosselink, J. G. (2000). ‘Wetlands’, 3rd edn. (Wiley: New York, NY, USA.)
Mueller, N., Lewis, A., Roberts, D., Ring, S., Melrose, R., Sixsmith, J., Lymburner, L., McIntyre, A., Tan, P., Curnow, S., and Ip, A. (2016). Water observations from space: mapping surface water from 25 years of Landsat imagery across Australia. Remote Sensing of Environment 174, 341–352.
| Water observations from space: mapping surface water from 25 years of Landsat imagery across Australia.Crossref | GoogleScholarGoogle Scholar |
National Research Council (1995). ‘Wetlands: Characteristics and Boundaries.’ (National Academy Press: Washington, DC, USA.)
Ortega, M., Velasco, J., Millán, A., and Guerrero, C. (2004). An ecological integrity index for littoral wetlands in agricultural catchments of semiarid Mediterranean regions. Environmental Management 33, 412–430.
| An ecological integrity index for littoral wetlands in agricultural catchments of semiarid Mediterranean regions.Crossref | GoogleScholarGoogle Scholar | 15054671PubMed |
Papas, P., and Moloney, P. (2012). Victoria’s wetlands 2009–2011: statewide assessments and condition modelling. Arthur Rylah Institute for Environmental Research Technical Report Series number 229. (Department of Sustainability and Environment, Melbourne, Vic., Australia.) Available at https://iwc.vic.gov.au/docs/ARI-Technical-Report-229-Victorias-wetlands-2009-2011-statewide-assessments-and-condition-modelling.pdf [Verified 25 April 2019].
Petalas, Y. G., Parsopoulos, K. E., and Vrahatis, M. N. (2009). Improving fuzzy cognitive maps learning through memetic particle swarm optimization. Soft Computing 13, 77–94.
| Improving fuzzy cognitive maps learning through memetic particle swarm optimization.Crossref | GoogleScholarGoogle Scholar |
Ramsar Convention (2005). Resolution IX.1 Annex A: a Conceptual Framework for the wise use of wetlands and the maintenance of their ecological character. Available at https://www.ramsar.org/sites/default/files/documents/pdf/res/key_res_ix_01_annexa_e.pdf [Verified 25 April 2019].
Ramsey, D. S. L., and Norbury, G. L. (2009). Predicting the unexpected: using a qualitative model of a New Zealand dryland ecosystem to anticipate pest management outcomes. Austral Ecology 34, 409–421.
| Predicting the unexpected: using a qualitative model of a New Zealand dryland ecosystem to anticipate pest management outcomes.Crossref | GoogleScholarGoogle Scholar |
Ramsey, D. S. L., and Veltman, C. (2005). Predicting the effects of perturbations on ecological communities: what can qualitative models offer? Journal of Animal Ecology 74, 905–916.
| Predicting the effects of perturbations on ecological communities: what can qualitative models offer?Crossref | GoogleScholarGoogle Scholar |
Roth, E., Olsen, R., Snow, P., and Sumner, R. (1996). Oregon freshwater wetland assessment methodology. (Oregon Division of State Lands: Salem, OR, USA.) Available at https://digital.osl.state.or.us/islandora/object/osl:14434
Rouissi, M., Boix, D., Muller, S. D., Gascón, S., Ruhí, A., Sala, J., Bouattour, A., Ben Haj Jilani, I., Ghrabi-Gammar, Z., Ben Saad-Limam, S., and Daoud-Bouattour, A. (2014). Spatio-temporal variability of faunal and floral assemblages in Mediterranean temporary wetlands. Comptes Rendus Biologies 337, 695–708.
| Spatio-temporal variability of faunal and floral assemblages in Mediterranean temporary wetlands.Crossref | GoogleScholarGoogle Scholar | 25433562PubMed |
Spencer, C., Robertson, A. I., and Curtis, A. (1998). Development and testing of a rapid appraisal wetland condition index in south-eastern. Journal of Environmental Management 54, 143–159.
| Development and testing of a rapid appraisal wetland condition index in south-eastern.Crossref | GoogleScholarGoogle Scholar |
Stach, W., Kurgan, L. A., and Pedrycz, W. (2008). Numerical and linguistic prediction of time series with the use of fuzzy cognitive maps. IEEE Transactions on Fuzzy Systems 16, 61–72.
| Numerical and linguistic prediction of time series with the use of fuzzy cognitive maps.Crossref | GoogleScholarGoogle Scholar |
Stein, E. D., Brown, J. S., and Mazor, R. D. (2017). Transferability of bioassessment indices among water body types and ecoregions: a California experiment in wetland assessment. Ecological Indicators 81, 65–73.
| Transferability of bioassessment indices among water body types and ecoregions: a California experiment in wetland assessment.Crossref | GoogleScholarGoogle Scholar |
United States Environmental Protection Agency (2002). Methods for evaluating wetland condition: introduction to wetland biological assessment. (Office of Water, US EPA: Washington, DC, USA.) Available at https://www.epa.gov/sites/production/files/documents/wetlands_1introduction.pdf [Verified 25 April 2019].
Zimmermann, H. J. (1996). ‘Fuzzy Set Theory – And Its Applications’, 3rd edn. (Kluwer: Dordrecht, Netherlands.)
Appendix 1. Candidate indicators for each wetland characteristic and component
Direct measures are measures of the components or processes themselves, and surrogate measures are measures of threat to the components (Kent et al. 1992; Spencer et al. 1998)

|