

Adapting to Sydney’s local government boundaries changes: a population health perspective
Hassan Assareh A * , Helen Achat A , Shopna Bag B , Leendert Moerkerken A and Salwa Gabriel BA
B
Abstract
The territory of a Local Health District (LHD) comprises multiple local government areas (LGAs). The recent amalgamation of several LGAs in metropolitan Sydney has resulted in two new LGAs being expanded across multiple LHDs, resulting in nonconcordance of boundaries. Here, we discuss the implications for planning health activities and service delivery, and ways to address them.Background
In Australia, local health governing bodies operate public hospitals and institutions and provide public health services to communities in specific geographical areas.1 In New South Wales (NSW), this regionalisation of the health system occurred in the mid-1980s2 and the local health governing bodies are now called Local Health Districts (LHDs). Local government areas (LGAs) constitute the third tier of government in Australia and have roles in regulation, planning, service delivery and community development, including as major partners in the protection of public health in communities.3 LHDs closely interact with LGAs to align resources and actions in service delivery.
In NSW, LHDs and LGAs benefit from sharing population and care indicators, which are routinely measured and publicly reported by the NSW Ministry of Health at the LHD level and, increasingly, the LGA level.4 LHDs also have access to census and other de-identified nonaggregated data, which are mostly geocoded at the LGA level.5 In metropolitan Sydney, five LHDs served residents with unchanged LGA boundaries until 2016.6 Each of these LHDs accommodated entire LGAs (ranging from five to 11), with the exception of Sydney LGA, which is shared between two LHDs.
In late 2016, the NSW Government began amalgamating LGAs in metropolitan Sydney, decreasing their number from 41 to 24.7 Of the eight new LGAs formed:
Six were created without boundary changes from pre-existing LGAs. Five occurred within LHD boundaries, and the newly-formed Canterbury–Bankstown LGA crossed two LHDs
Two newly-formed LGAs, Cumberland and Parramatta, required LGA boundary changes; the latter extends across two LHDs.8-10
The resulting LHD population distribution across shared LGAs is summarised in Table 1.
| Nonconcordance | Shared LGA | LHD | |||||
| Name | Population | Name | Population | Population (%) of shared LGA | % of total LHD population | ||
| Pre-existing | Sydney LGA | 212 563 | Sydney LHD | 639 745 | 122 649 (57.7%) | 19.2% | |
| South Eastern Sydney LHD | 910 367 | 89 914 (42.3%) | 9.9% | ||||
| New | Canterbury–Bankstown LGA | 360 337 | Sydney LHD | 639 745 | 204 671 (56.8%) | 32.0% | |
| South Western Sydney LHD | 967 448 | 155 666 (43.2%) | 16.1% | ||||
| New | Parramatta LGA | 238 864 | Northern Sydney LHD | 808 872 | 24 125 (10.1%) | 3.0% | |
| Western Sydney LHD | 946 832 | 214 739 (89.9%) | 22.7% | ||||
LGA = local government area; LHD = Local Health District
Note: Population estimates are at 30 June 2016 and calculated based on LGA- and LHD-specific data published by HealthStats NSW4
Alignment of healthcare providers’ boundaries (for Primary Health Networks and LHDs) has been accepted as desirable.11 Nonconcordance between LHD and LGA boundaries will require shared responsibilities, planning and service delivery. Here we discuss these issues, and implications to consider.
Implications and considerations
LHDs with changed LGAs, and LGAs that need to work with two LHDs, may encounter differences in emphasis, resource allocation and governance. This will require negotiation and careful management among the partners. For example, a multicultural LGA that was recently targeted to address its low child immunisation rate in the Western Sydney LHD no longer exists because of changed boundaries and renaming. This has complicated implementation of planned collaborative interventions in the community and ongoing assessment of outcomes.12
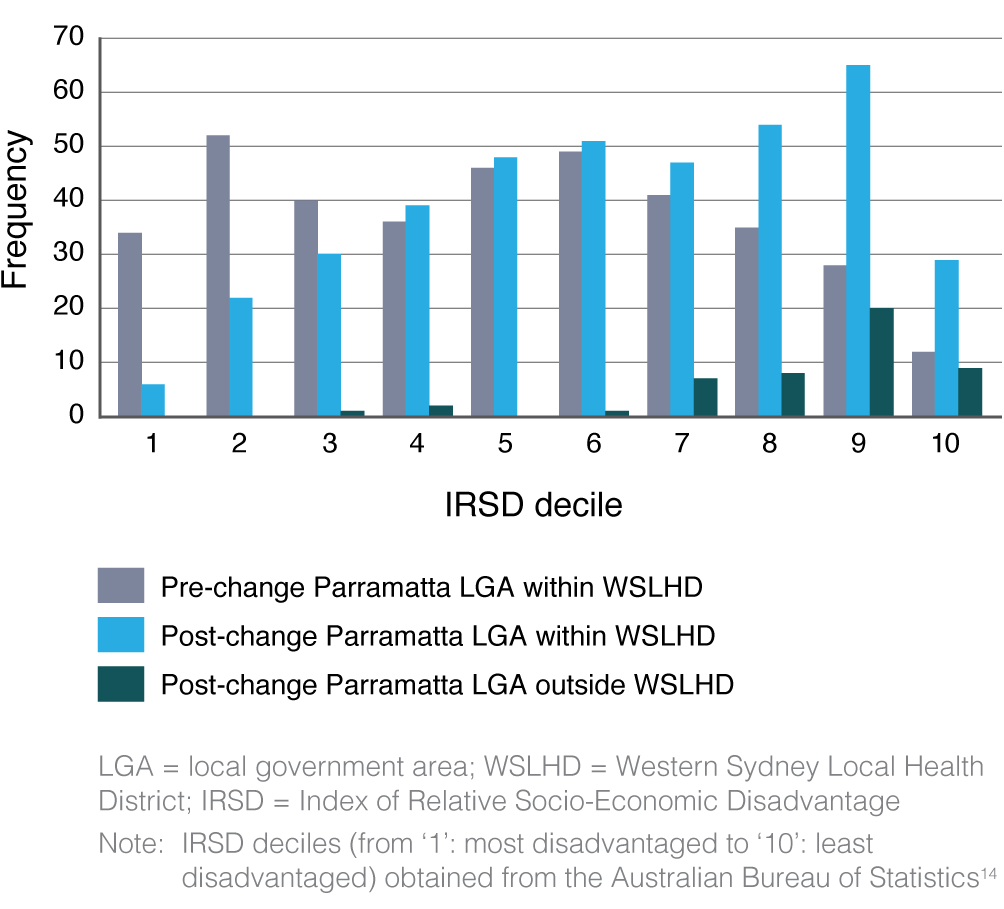
Data at the LGA level, or smaller localities, enable us to recognise variation in needs within LHDs. Immediate adoption of new LGA configurations in population health reports is challenging, but essential for planning and forecasting. For example, a year after LGA amalgamations, data on immunisation coverage (personal communication) and cancer incidence13 are being reported based on old LGAs, including an LGA that no longer exists. At the same time, available indicators for newly merged or changed LGAs that have maintained their original names have questionable utility, particularly for populous and cosmopolitan LGAs where disparities in the characteristics of residents can be substantial. For example, the new Parramatta LGA (Figure 1) has a higher socio-economic status than the previous LGA.5,14 Existing trend data are no longer reflective of newly delineated populations in areas such as Parramatta LGA with its new geography and related demographics. Consequently, existing plans are unable to align with the changed demographics.
Distribution of socio-economic status for Statistical Area Level 1 within Parramatta LGA before and after NSW LGA amalgamation
Accurate estimates from up-to-date geocoded data are unobtainable without delineating the new boundaries in public reports and accessible data. The information gap requires specialised analytical skills. A consistent approach by LHDs for reporting on community health indicators for the shared LGA would enable appropriate use and interpretation.
Specific issues arising from changed boundaries could benefit from a collaborative approach.15 This approach requires us to: recognise risks in delivery of services; align internal (inter-LHD) and external (LHD–LGA) priorities, resources and models for interaction; inform communities about new configurations of service delivery; and improve measurement and reporting systems and related infrastructure.
Conclusion
LGAs are partners of LHDs in health service delivery, and their boundaries are used for planning purposes by LHDs. Sydney’s LGAs and their boundaries have changed. The discussed implications, regardless of motives and consequences16-18, are generalisable to any geography and population. Adapting to boundary changes will benefit from a collaborative approach by all parties. The approach should address risks, priorities, partnership models, consumer engagement and alignment of data.
Acknowledgements
The authors wish to thank Stephen Leeder, Western Sydney LHD Research and Education network; Maureen Fitzpatrick, Nereus Marana, Julie Jones and Julie Meyer, Western Sydney LHD Health Services Planning and Development Department; Stephen Corbett and Sophie Norton, Western Sydney LHD Centre for Population Health; and Graham Burgess, Sydney LHD Public Health Unit, for their valuable comments and feedback.
References
1 Australian Institute of Health and Welfare. Australia’s health 2016. Canberra: AIHW; 2016 [cited 2018 Jan 12]. Available from: www.aihw.gov.au/getmedia/9844cefb-7745-4dd8-9ee2-f4d1c3d6a727/19787-AH16.pdf.aspx?inline=true
2 NSW Legislation. Area Health Services Act 1986 No 50. Sydney: NSW Government; 1986 [cited 2018 Jan 12]. Available from: legislation.nsw.gov.au/#/view/act/1986/50/id24
3 Australian Local Government Association. Canberra: ALGA; 2010. Health and wellbeing; 2017 [cited 2018 Jan 12]; [about 2 screens]. Available from: alga.asn.au/?ID=92
4 Centre for Epidemiology and Evidence. HealthStats NSW. Sydney: NSW Ministry of Health [cited 2018 Jan 12]. Available from: www.healthstats.nsw.gov.au
5 Centre for Epidemiology and Evidence. Secure Analytics for Population Health Research and Intelligence (SAPHaRI). Sydney: NSW Health; 2017 [cited 2018 Jan 12]. Available from: www.health.nsw.gov.au/epidemiology/Pages/saphari.aspx
7 Department of Premier and Cabinet. New councils progress report: delivering results for communities through stronger councils. Sydney: DPC; 2017 [cited 2018 Jan 12]. Available from: dpcsc-ss.s3.amazonaws.com/Uploads/1487025380/Stronger-Communities-Report.pdf
8 NSW Legislation. Local government (City of Parramatta and Cumberland) proclamation 2016. Sydney: NSW Government; 2016 [cited 2018 Jan 12]. Available from: legislation.nsw.gov.au/#/view/subordleg/2016/241
9 NSW Legislation. Local Government (Council Amalgamations) Proclamation 2016. Sydney: NSW Government; 2016 [cited 2018 Jan 12]. Available from: legislation.nsw.gov.au/#/view/subordleg/2016/242
10 NSW Health. Sydney: State of New South Wales NSW Ministry of Health; 2015. Local Health Districts and specialty networks Sydney [cited 2018 Jan 12]; [about 2 screens]. Available from: www.health.nsw.gov.au/lhd/pages/default.aspx
11 Bywood PT, Erny-Albrecht K. Regionalisation of health services: benefits and impact. PHCRIS Policy Issue Review. 2016. Crossref
13 Cancer Institute NSW. Sydney: State of New South Wales (Cancer Institute NSW); 2016. Cancer statistics NSW; 2017 [cited 2018 Jan 12]. Available from: www.cancerinstitute.org.au/data-research/access-our-data/cancer-statistics-nsw
14 Australian Bureau of Statistics. Census of population and housing: socio-economic indexes for areas (SEIFA), Australia. Canberra: Australian Bureau of Statistics; 2016 [cited 2018 Jan 12]. Available from: www.abs.gov.au/ausstats/abs@.nsf/mf/2033.0.55.001
16 NSW Office of Local Government. Fit for the future: a blueprint for the future of local government. Sydney: NSW Office of Local Government; 2014 [cited 2018 Jan 19]. Available from: www.fitforthefuture.nsw.gov.au/sites/fftf/files/Fit-for-the-Future-A-Blueprint-for-the-future-of-Local-Government.pdf
17 Fahey G, Drew J, Dollery B. Merger myths: a functional analysis of scale economies in New South Wales local government. Public Finance and Management. 2016;16(4):362–82. Article
18 Dollery B, Drew J. Paying the piper: a critical examination of ACIL Allen’s (2016) An economic assessment of recasting council boundaries in South Australia. Economic Analysis and Policy. 2017;54:74–82. Crossref