Patient-centred method to evaluate the spatial accessibility of primary health care in a case study in Shanghai
Xuechen Xiong A and Li Luo A BA Collaborative Innovation Center of Health Risks Governance, School of Public Health, Fudan University, 130 Dong’an Road, Shanghai 200433, China.
B Corresponding author. Email: liluo@fudan.edu.cn
Australian Journal of Primary Health 26(4) 344-350 https://doi.org/10.1071/PY19233
Submitted: 5 December 2019 Accepted: 28 April 2020 Published: 16 July 2020
Journal Compilation © La Trobe University 2020 Open Access CC BY-NC-ND
Abstract
Quantitative methodology investigating medical resource accessibility does not incorporate patients’ feelings about the adequacy and fairness of primary health care (PHC). In this study we quantified the spatial accessibility of PHC from the patient perspective. The main obstacles regarding access to PHC services are: (1) distance from the medical facility; and (2) waiting times after reaching the facility. The total time cost to access PHC is calculated as the sum of the time cost to access the PHC facility and the time cost waiting to receive health care; the total time cost was used in this study to reflect the potential spatial accessibility (i.e. probable entry into the healthcare system) of PHC. In Shanghai, it took residents approximately 13 min to reach the nearest primary care facility, with an approximate 23 min wait time after arriving at the facility. Thus, the spatial accessibility of PHC in Shanghai is approximately 36 min. The method of assessing the spatial accessibility of PHC from the perspective of patients is more explanatory and easier to interpret. In the case of Shanghai, the regional accessibility of PHC is much better than its regional availability. Relevant managers should focus on increasing the resource supply capacity of existing facilities providing primary care in the suburbs of Shanghai.
Additional keywords: patient-centred, primary health care, quantitative, spatial accessibility.
Introduction
Primary health care
Primary health care (PHC) is a powerful political means of promoting the development of health services and is the basic guarantee of population health because it is relatively inexpensive and can be more easily delivered than speciality and inpatient care, especially for resource-poor countries (Guagliardo 2004). In China, the new round of health reform launched in 2009 put forth the goal of gradually realising equitable access to PHC and improving the health of the entire population (The State Council 2016). The medical system in mainland China is dominated by public medical institutions that are classified into three categories: primary medical institutions are responsible for providing primary medical services, secondary medical institutions assume the responsibilities for providing regional medical services and tertiary medical institutions provide medical services for difficult diseases. Primary medical institutions, including village clinics and community health service centres and clinics, act as the first line of defence for residents’ health care.
There is still no precise definition of ‘access’ to PHC or health care (Nakamura et al. 2017; Ansari 2007). Different authors have different views on the accessibility of health resources (Khan and Bhardwaj 1994; Saurman 2016). Penchansky and Thomas (1981) propose a classic concept of ‘access’, defining it as the fit between the patient and the healthcare system. The measurement dimensions of health accessibility are availability, accessibility, accommodation, affordability and acceptability (Penchansky and Thomas 1981; Wang 2012). However, the dimensions of ‘access’ are not always applied as they were originally conceptualised, and they may be omitted (Gulliford et al. 2002; Morgan 2008), expanded (Russell et al. 2013), mislabelled or combined (Levesque et al. 2013). Based on two perspectives (i.e. potential vs revealed and spatial vs aspatial), access to health care can be divided into four types: potential spatial access, potential aspatial access, revealed spatial access, and revealed aspatial access (Khan 1992; Luo and Wang 2003). ‘Revealed’ access focuses on the actual use of healthcare services, whereas ‘potential’ access signifies probable entry into the healthcare system (Thouez et al. 1988; Meade and Earickson 2000). ‘Spatial’ access emphasises the importance of the geographic distribution of supply and demand, whereas ‘aspatial’ access stresses non-geographic barriers or facilitators (Saxon and Snow 2019). Using this classification system, ‘availability’ and ‘accessibility’ can be seen as the spatial variable, whereas ‘accommodation’, ‘affordability’ and ‘acceptability’ can be classified as non-geographic facilitators affecting accessibility to health care (Wang 2012). In addition, it is difficult to determine how much of the actual use of health resources is the result of spatial or aspatial factors because they usually interact (Meade and Earickson 2000; Kwan and Weber 2003). This study investigated the potential spatial accessibility of PHC, which is a classic geographical problem that can be addressed using geographic information system (GIS; Joseph and Phillips 1984).
Spatial accessibility measures
The measures of potential spatial accessibility include regional availability and regional accessibility (Guagliardo 2004). There are some variations in the measures of the geographical profile of potential accessibility. Most published measures of spatial accessibility to health care can be classified into four categories: (1) provider-to-population ratios, which are a simple method primarily used to express regional availability in terms of the quantity of health resources; (2) distance to provider, which is primarily used to express regional accessibility in terms of the location of health resources; (3) two-step floating catchment area (2SFCA); and (4) gravitational models. The 2SFCA and gravitational models consider both the quantity and layout of health resources by combining provider-to-population ratios and distance to provider calculations (Shi and Wang 2016). It is obvious that a single method for describing regional availability and regional accessibility cannot comprehensively reflect spatial accessibility. In that regard, the 2SFCA and gravitational model may perform much better.
However, these models still have some flaws in accessing the regional potential accessibility of PHC. First, the key parameter of the distance attenuation coefficient is difficult to measure (Xiong et al. 2016). Second, the PHC service area is relatively small, and the gravitational model is better suited to medical resources with a large service area (Shanghai Municipal People’s Government 2018). Third, even though both the quantity and layout of health resources are taken into consideration, the results are still expressed as provider-to-population ratios, which are intuitive for healthcare workforce planners but are not meaningful for residents of a given area. For example, patients view PHC in terms of whether it is convenient. The quantitative methods described above start from the perspective of managers, not patients, and cannot intuitively articulate patients’ feelings about the adequacy and fairness of resource allocation. Saxon and Snow (2019) proposed the Rational Agent Access Model, which incorporated the idea of dividing spatial accessibility into transit time and wait time. In this study, we quantified the spatial accessibility of PHC in Shanghai from the perspective of patients by using the Rational Agent Access Model.
Methods
Ethics approval
Because this study did not involve patients or members of the public, ethics approval was not applicable.
Data preparation
Population data
The population statistics of Shanghai take residential buildings as the statistical unit, calculating the size of the resident population in each residential building. By locating the residential buildings, the population distribution can be determined. This study used population data from 2017, which were collected by the Public Security Bureau of Shanghai. In 2017, the population database counted 65 822 residential buildings, with ~24 million permanent residents.
Primary medical institutions data
A primary care institution database counts the number of primary care physicians in each institution. By locating the primary care institutions, the distribution of primary care physicians can be determined. This study used public primary care facility data from 2016, which were collected by the Health Bureau of Shanghai. In 2016, there were 2306 public primary medical institutions in Shanghai, and approximately 14 709 physicians were employed at these public primary medical institutions.
Fundamental geographic data
The administrative boundary data of Shanghai were collected by the Urban Planning Bureau of Shanghai in 2011. The traffic network data of Shanghai from 2014 were collected by the Urban Planning Bureau of Shanghai.
Calculation process
From the perspective of spatial accessibility, the main obstacles preventing residents from obtaining PHC services are: (1) the distance from medical facilities; and (2) the wait time after reaching the facilities until care is received. Both these barriers can be directly translated into time costs of access to primary care for each patient.
Regional accessibility of PHC
The minimum time for each resident to reach a primary health facility differs depending on the geographic spatial distribution and traffic conditions surrounding the area where the resident lives and the locations of the primary health facilities. The assumption is that residents will always choose the nearest healthcare facility to access PHC. The following formula was used to calculate regional accessibility:

where T′i is the regional accessibility of PHC, reflecting the time cost for each resident to access the nearest PHC institution, i represents each resident, j represents each PHC institution, dij min is the distance to the nearest primary care facility for residents and vi refers to the travel speed when people venture out to seek PHC services. To improve residents’ access to institutions, T′i should be as small as possible, which means that the distance between the medical institutions and residents should be as short as possible.
The regional accessibility of PHC can be determined using the following steps, which were used to obtain an empirical measurement of Shanghai’s PHC accessibility, as described below.
-
Settlements (i = 1,…,65 822) were located. Residential buildings in the population database were taken as residential points, and the population distribution of residents in Shanghai was marked according to the longitude and latitude of the residential buildings.
-
PHC institutions (j = 1,…,2306) were located. According to the latitude and longitude of medical institutions in the database of primary medical institutions, the spatial layout of medical institutions was determined.
-
Based on the road network database of Shanghai, the road network matrix between residential settlements and primary medical institutions (dij) can be calculated using the origin–destination (OD) cost matrix solver properties. For each of the settlements, there were 2306 PHC options. According to the principle of proximity, the PHC institution with the shortest road network distance (dij min) was chosen.
-
In reference to Shanghai’s municipal master plan (Health Bureau of Shanghai 2013), the primary plan is managed within a 15-min walking distance of the space. This study adopted a walking speed of 1000 m per 15 min as an accessible speed (vi).
-
Assuming that each resident chooses to walk to the nearest PHC facility for medical treatment, the accessible time (T′i) for residents to go to the nearest PHC institution can be calculated on the basis of the walking speed and the network distance to the nearest PHC facility.
The steps described above were implemented in ArcMap 10.2.
Regional availability of PHC
Once a patient arrives at the PHC facility, it is likely that he or she will not see a physician immediately and will have to wait in line. Generally, the more physicians there are in the facility, the shorter the waiting time for patients. By combining the number of physicians employed in the primary health institution with the number of potential patients, the time that patients may need to wait can be estimated. The general components for calculating the regional availability of PHC are as follows: (1) identify the service areas of the PHC facility; (2) calculate the demand for PHC service time in each service area; (3) calculate how much PHC service time is available in each service area; and (4) calculate the mean waiting time for patients in each service area.
Under the principle of recent medical treatment, the nearest residential areas (i) together constitute the distance advantage service area (A) of each primary care facility (j). The formula for calculating the regional availability of PHC is given below, and is calculated with the service area A as the unit. For each i in area A, A = 1,…,k.


where T″i represents the regional availability of PHC calculated according to the waiting time for each patient to access PHC services,  represents the mean waiting time for each patient to access PHC services, TD represents the total time all patients need to see PHC physicians, TS represents the total time all PHC physicians spend serving patients, ND represents the number of patients who need PHC, Np is the number of residents, r is disease prevalence, u is the rate of PHC visits, t is the length of visit time per person for primary care services, NS is the number of physicians providing PHC and w is the duration of standard working hours for each physician.
The following steps outline how to measure the regional availability of PHC, with empirical measurements of PHC availability in Shanghai.
-
For each settlement, there is a PHC facility with the shortest network distance as an institutional option. Similarly, for each PHC facility, all the settlements within the shortest distance of the facility constitute the coverage of that PHC facility. The integration of the settlements served by a PHC facility constitutes the distance advantage service area of that PHC facility (A = 1,…,2306).
-
The number of PHC doctors in each distance advantage service area (NS) is calculated according to the distribution data of PHC doctors in the database of PHC institutions. In addition, the number of residents in each distance advantage service area (ND) is calculated according to the population distribution data of residential areas.
-
The total number of hours that PHC physicians can serve in each distance advantage service area is calculated based on the assumption that each medical worker provides services according to the standard working hours, working 8 h per day (w). Combined with the number of doctors, we can obtain the total time all PHC physicians in each distance advantage service area can spend serving patients (TS).
-
The total length of medical service required by residents in each distance advantage service area is calculated by first estimating the number of patients according to disease prevalence (r). Then, the number of patients according to the rate of patient visits (u) is estimated, followed by estimation of the length of time each patient needs to see a doctor (t). In the process of calculating the regional availability of PHC in Shanghai, these above key parameters were obtained from the Shanghai municipal health service survey (Pan et al. 2019). The 2-week prevalence of disease is 29.66%. Assuming that the prevalence of disease among residents is evenly distributed over a period of time, the 2-week prevalence can be converted to a daily prevalence of 2.12% (r). The probability of seeing a physician after an illness (u) is 96.28%. Previous studies of the treatment times of primary care doctors have reported that, in China, the time primary care doctors spend with patients for each consultation is approximately 30 min. So, in the present study, we assume that the length of time each patient needs to see a doctor is 30 min.
-
At this point, both daily primary care demand time (TD) and supply time (TS) for each distance advantage service area have been obtained. If daily TD is less than TS, the supply of primary care exceeds the demand and patients do not have to wait (
 ). However, if daily TD is greater than TS, the supply of primary care is less than demand and patients have to wait. The mean wait time (
 ) is based on the gap between supply and demand and the number of people who need to wait.
 -
Finally, the mean waiting times for all patients (
 ) are averaged to obtain the regional availability of PHC (T″i).
All the procedures described above were completed in ArcMap 10.2.
Spatial accessibility of PHC
For each patient, the total time cost for access to PHC (T) was calculated by summing the time cost for access to a PHC facility (T′) and the waiting time cost for access to primary health services (T″), and was used to reflect the spatial accessibility of PHC:

Results
Regional accessibility of PHC in Shanghai
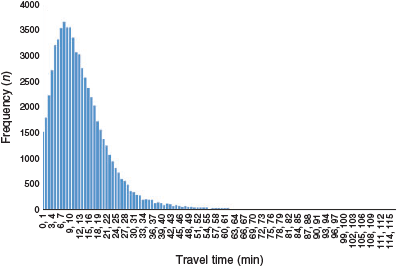
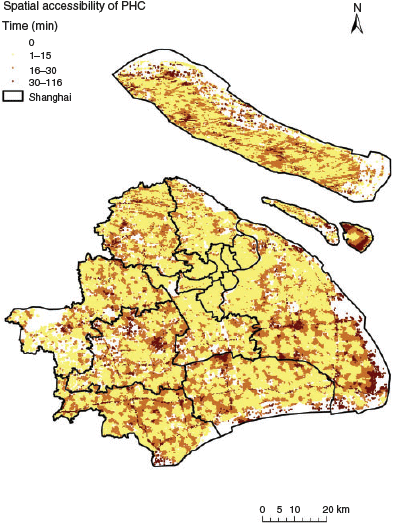
For 65 822 residential areas, the mean regional accessibility of PHC in Shanghai is approximately 13 min, which means that it takes approximately 13 min for Shanghai residents to reach the nearest primary care facility. Of course, residents in different residential areas take different amounts of time to reach the nearest primary care facility; the minimum travel time was 0 min, and the maximum was 116 min. Basic statistical results regarding travel time in Shanghai are given in Table 1. The frequency distribution of travel times for different residential areas is shown in Fig. 1. Of all 65 822 residential areas, approximately 67% had access to a PHC facility within a 15-min walk, and 94% had access to a primary care facility within a 30-min walk. The spatial distribution of PHC travel times in Shanghai is shown in Fig. 2. The residential areas with poor accessibility to PHC facilities are primarily located in the suburbs of Shanghai (Fig. 2).

|
|
|
Regional availability of PHC in Shanghai
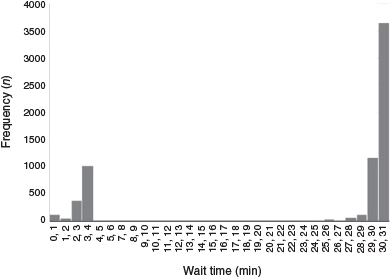
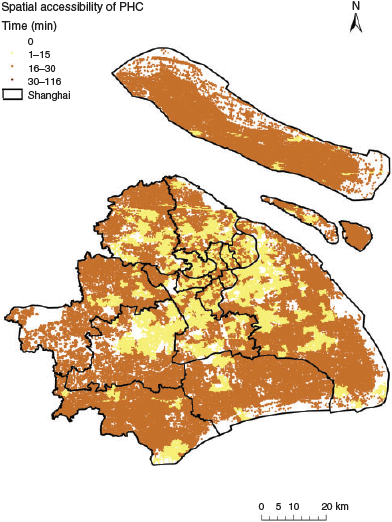
For the 65 822 residential areas, the mean regional availability of PHC in Shanghai was approximately 23 min, which means that Shanghai residents have to wait approximately 23 min after arriving at a PHC facility until they receive primary care. Of course, residents attending different facilities wait for different amounts of time until they receive primary care, and the minimum wait time was 0 min and the maximum was 30 min. The basic statistical results regarding wait time in Shanghai are given in Table 1. The frequency distribution diagram of the wait time for different residential areas is shown in Fig. 3. As can be seen from the frequency diagram, the distribution of residents’ waiting time presents two extremes: some residents have a wait time of <5 min and others have a wait time of approximately 30 min. The frequency of wait times between 5 and 30 min is almost zero. The spatial distribution of PHC wait time in Shanghai is shown in Fig. 4. Most residential areas with short wait times are located in the central city, whereas suburban residential areas generally have long wait times.
|
|
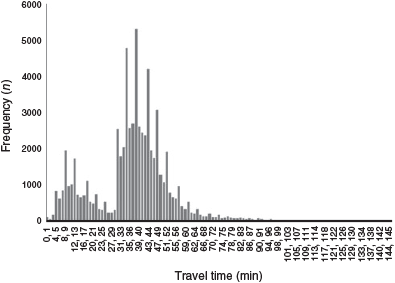
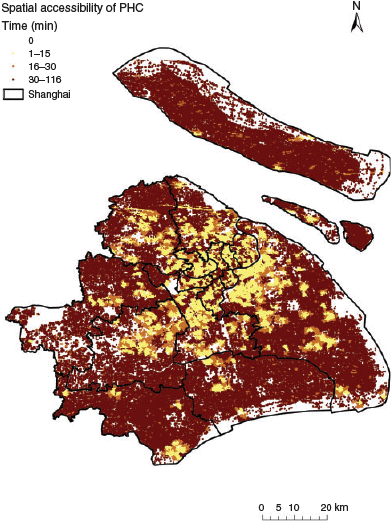
Finally, the regional accessibility and availability of PHC were combined to obtain the spatial accessibility of PHC. The mean spatial accessibility of PHC in Shanghai was approximately 36 min, which means that it takes approximately 36 min for Shanghai residents to receive primary care if they are going to see a primary care physician. The frequency distribution diagram of the spatial accessibility of PHC in different residential areas is shown in Fig. 5. As can be seen from the frequency diagram, the distribution generally presents two small peaks, one near a total accessible time of 10 min and the other near 40 min. The spatial accessibility of PHC in Shanghai is shown in Fig. 6. As can be seen in Fig. 6, the gap in total accessibility time between urban and suburban areas has further widened, with the total accessibility time of most urban areas within 15 min and that of most suburban areas >30 min.
|
|
Discussion
In this study, the total time cost to access PHC, calculated by summing the time cost for access to a PHC facility and the waiting time cost to receive PHC, is used to reflect the spatial accessibility of PHC. Compared with other common methods for calculating the spatial accessibility of primary health resources (e.g. the 2SFCA and the gravitational model), the method used in this study also considered both the distribution and quantity of resources. However, the difference is in the final expression index that reflects spatial accessibility. In this study the final index is the time for residents to obtain primary care medical services. The less time it takes to access primary care, the more accessible it is for residents. Other methods use the provider-to-population ratio as a final index to explain the accessibility of health resources. The greater the number of resources owned per person, the more accessible it is for residents to obtain primary care.
The advantages of the method used in this paper are as follows. First, the time index quantifies the accessibility and availability of PHC separately. Therefore, it is easy to add them together and to explain the contribution of each part to spatial accessibility. The Rational Agent Access Model proposed by Saxon and Snow (2019) has a similar idea. In contrast, other common methods that cannot account for spatial accessibility are primarily based on institutional distribution (accessibility) or resource volume (availability). Second, time cost is an intuitive indicator that expresses accessibility for patients and makes it easy to explain the meaning of ‘accessibility’ from the perspective of individual patients. Provider-to-population ratios are indirect and tend to ignore individual differences because the provider-to-population ratio of each resident in a region is often replaced by the mean of all people in a region. These methods differ only in the manner in which the region is divided, but they are essentially the same. Therefore, the provider-to-population ratio is more suitable for a relatively larger area, such as a district or a country, rather than for small geographic units.
However, the following points should also be noted when using the method of measuring spatial accessibility proposed in this study. First, this method has two basic assumptions in determining regional accessibility and availability: the principle of recent visits to healthcare services and the principle of queuing for medical treatment after reaching a healthcare institution. In this study we focused on the spatial accessibility of PHC, so both principles are applicable. However, when extrapolating this method to other types of medical resources, it is necessary to pay attention to the applicability of assumptions. Second, this paper focuses on the potential spatial accessibility of PHC, so the result of spatial accessibility is not equal to real accessibility, which is much more complicated and affected by other non-spatial factors.
Conclusion
This study demonstrates that the method to assess the potential spatial accessibility of PHC from the perspective of patients is feasible. This method takes the time spent as a quantitative index, which is more explanatory and easier to interpret than using provider-to-population ratios as an outcome index.
In the case of Shanghai, the regional accessibility of PHC is much better than the regional availability of PHC. As shown in Fig. 1, most residents can access a PHC facility within a 15-min walk. This means that the layout of PHC facilities in Shanghai is relatively fair, and people can basically reach a facility within 15 min. From Fig. 2, we can see that the waiting time for local PHC resources in the suburbs of Shanghai is increased significantly to 30 min. This means that in some areas, especially the suburbs, even though there are already set primary medical institutions, the resources in these institutions (e.g. physicians) are insufficient and need to be increased to reduce people’s waiting time. In general, the spatial accessibility of PHC services for residents in urban and suburban areas of Shanghai is better. To improve the spatial accessibility of primary medical resources in Shanghai, relevant managers should focus on increasing the resource supply capacity of existing primary medical institutions in the suburbs.
Conflicts of interest
The authors declare no conflicts of interest.
Acknowledgements
The authors thank the reviewers and editor for their insightful and constructive comments, and the Shanghai Health and Population and Family Planning Commission for providing the data. Data collection, data analysis and the writing of this paper were funded by a grant from the National Natural Science Foundation of China (No. 71874033) to L. Li.
References
Ansari Z (2007) A review of literature on access to primary health care. Australian Journal of Primary Health 13, 80–95.| A review of literature on access to primary health care.Crossref | GoogleScholarGoogle Scholar |
Guagliardo MF (2004) Spatial accessibility of primary care: concepts, methods and challenges. International Journal of Health Geographics 3, 3
| Spatial accessibility of primary care: concepts, methods and challenges.Crossref | GoogleScholarGoogle Scholar | 14987337PubMed |
Gulliford M, Figueroa MJ, Morgan M, Hughes D, Gibson B, Beech R, Hudson M (2002) What does ‘access to health care’ mean? Journal of Health Services Research & Policy 7, 186–188.
| What does ‘access to health care’ mean?Crossref | GoogleScholarGoogle Scholar |
Health Bureau of Shanghai (2013) Health services survey report of Shanghai. Health Bureau of Shanghai, Shanghai.
Joseph AE, Phillips DR (1984) ‘Accessibility and utilization: geographical perspectives on health care delivery.’ (Harper and Row: New York, NY, USA)
Khan AA (1992) An integrated approach to measuring potential spatial access to health care services. Socio-economic Planning Science 26, 275–287.
| An integrated approach to measuring potential spatial access to health care services.Crossref | GoogleScholarGoogle Scholar |
Khan AA, Bhardwaj SM (1994) Access to health care. A conceptual framework and its relevance to health care planning. Evaluation & the Health Professions 17, 60–76.
| Access to health care. A conceptual framework and its relevance to health care planning.Crossref | GoogleScholarGoogle Scholar |
Kwan MP, Weber J (2003) Individual accessibility revisited: implications for geographical analysis in the twenty-first century. Geographical Analysis 35, 341–353.
| Individual accessibility revisited: implications for geographical analysis in the twenty-first century.Crossref | GoogleScholarGoogle Scholar |
Levesque JF, Harris MF, Russell G (2013) Patient-centred access to health care: conceptualising access at the interface of health systems and populations. International Journal for Equity in Health 12, 18
Luo W, Wang F (2003) Measures of spatial accessibility to health care in a GIS environment: synthesis and a case study in the Chicago region. Environment and Planning. B, Planning & Design 30, 865–884.
| Measures of spatial accessibility to health care in a GIS environment: synthesis and a case study in the Chicago region.Crossref | GoogleScholarGoogle Scholar |
Meade SM, Earickson RJ (2000) ‘Medical geography.’ 2nd edn. (Guilford Press: New York, NY, USA)
Morgan M (2008) What is the goal of access to health care? Journal of Law and Medicine 15, 742–751.
Nakamura T, Nakamura A, Mukuda K, Harada M, Kotani K (2017) Potential accessibility scores for hospital care in a province of Japan: GIS-based ecological study of the two-step floating catchment area method and the number of neighborhood hospitals. BMC Health Services Research 17, 438
| Potential accessibility scores for hospital care in a province of Japan: GIS-based ecological study of the two-step floating catchment area method and the number of neighborhood hospitals.Crossref | GoogleScholarGoogle Scholar | 28651532PubMed |
Pan L, He P, Deng FZ (2019) Job duties of TCM general practitioners in primary medical institutions from Chongqing, Yunnan and Guizhou, China. Chinese General Practice 22, 1468–1473.
Penchansky R, Thomas JW (1981) The concept of access. Medical Care 19, 127–140.
| The concept of access.Crossref | GoogleScholarGoogle Scholar | 7206846PubMed |
Russell DJ, Humphreys JS, Ward B, Chisholm M, Buykx P, McGrail M, Wakerman J (2013) Helping policy-makers address rural health access problems. Australian Journal of Rural Health 21, 61–71.
| Helping policy-makers address rural health access problems.Crossref | GoogleScholarGoogle Scholar | 23586567PubMed |
Saurman E (2016) Improving access: modifying Penchansky and Thomas’s theory of access. Journal of Health Services Research & Policy 21, 36–39.
| Improving access: modifying Penchansky and Thomas’s theory of access.Crossref | GoogleScholarGoogle Scholar |
Saxon J, Snow D (2019) A rational agent model for the spatial accessibility of primary health care. Annals of the American Association of Geographers 20, 205–222.
Shanghai Municipal People’s Government (2018) Shanghai municipal master plan (2017–2035). [In Chinese]. Available at http://www.shanghai.gov.cn/newshanghai/xxgkfj/2035002.pdf [Verified 12 April 2020]
Shi X, Wang F (2016) Chapter 9. Measurement, impact and optimization of medical convenience. In ‘Applications of geospatial information technologies in public health’. [In Chinese]. pp 183–193. (Higher Education Press: Beijing, China)
The State Council (2016) The state council issued a notice on deepening the reform of the pharmaceutical and health care system in the 13th five-year plan. [In Chinese]. http://www.gov.cn/zhengce/content/2017-01/09/content_5158053.htm [Verified 2 April 2020]
Thouez JP, Bodson P, Joseph AE (1988) Some methods for measuring the geographic accessibility of medical service in rural regions. Medical Care 26, 34–44.
| Some methods for measuring the geographic accessibility of medical service in rural regions.Crossref | GoogleScholarGoogle Scholar | 3336244PubMed |
Wang F (2012) Measurement, optimization, and impact of health care accessibility: a methodological review. Annals of the Association of American Geographers 102, 1104–1112.
| Measurement, optimization, and impact of health care accessibility: a methodological review.Crossref | GoogleScholarGoogle Scholar | 23335813PubMed |
Xiong X, Jin C, Chen HL, Luo L (2016) Using the fusion proximal area method and gravity method to identify areas with physician shortages. PLoS One 11, e0163504


