

An assessment of the spatial distribution of bulk billing-only GP services in Australia in relation to area-based socio-economic status
Bree Graham A * , Estie Kruger A , Marc Tennant A and Yulia Shiikha A
A School of Human Sciences, University of Western Australia, 35 Stirling Highway, Crawley, Perth, WA 6009, Australia.
Australian Journal of Primary Health 29(5) 437-444 https://doi.org/10.1071/PY22125
Submitted: 21 June 2022 Accepted: 15 January 2023 Published: 23 February 2023
© 2023 The Author(s) (or their employer(s)). Published by CSIRO Publishing on behalf of La Trobe University. This is an open access article distributed under the Creative Commons Attribution-NonCommercial-NoDerivatives 4.0 International License (CC BY-NC-ND)
Abstract
Background: The accessibility to affordable primary healthcare services contributes to population health and health equity. A key aspect to accessibility is the geographical distribution of primary healthcare services. Limited studies have assessed the nationwide spatial distribution of bulk billing-only medical practices or ‘no-fee’ services. The aim of this study was to provide a nationwide approximation of bulk billing-only services and evaluate the socio-demographic status and population characteristics in relation to the distribution of bulk billing-only GP services.
Methods: The methodology in this study used Geographic Information System (GIS) technology to map the locations of all bulk bulking-only medical practices collected in mid-2020 and linked this with population data. The population data and practice locations were analysed at the level of Statistical Areas Level 2 (SA2) regions and used the most recent Census data.
Results: The study sample included (n = 2095) bulk billing-only medical practice locations. The nationwide average Population-to-Practice (PtP) ratio was 1 practice to 8529 people for regions with access to bulk billing-only practice, and 57.4% of the Australian population lives within an SA2 that has access to at least one bulk billing-only medical practices. No significant associations were identified between practice distribution and area socio-economic status.
Conclusion: The study identified areas with low access to affordable GP services, with many SA2 regions having no access to bulk billing-only practices. Findings also indicate that there was no association between area socio-economic status and the distribution of bulk billing-only services.
Keywords: Australia, bulk billing only, General Practitioner (GP) services, GIS, medical practices, out-of-pocket expenses, practice billing policies, practice-to-population ratio, socio-economic status.
Introduction
Background
It is globally recognised that accessibility to affordable primary healthcare services has an impact on population health and health equity (World Health Organization 2010). An individual’s ability to access and utilise services is dependent on many contributing factors, which have been researched and conceptualised by experts. The spatial distribution of healthcare services is a measurable component of access, simplified as ratios of supply (services) and demand (population) (Roeger et al. 2010). Comparative trends in population characteristics, such as socio-demographic and economic status, can be observed in the variances of the supply and demand of healthcare services (Roeger et al. 2010; Dudko et al. 2018; Lyle and Hendrie 2019; Mu and Hall 2020; Pulok et al. 2020a). Previous research has indicated that these geographical disparities in distribution and supply of healthcare services have a negative impact on health outcomes (Butler et al. 2010; Ireland et al. 2017; Turner et al. 2017). Leading drivers of variations in general practitioner (GP) services are both supplier-induced or population needs-based (McRae and Butler 2014; Mu and Hall 2020). For example, differences in utilisation and demand for health care along with GP labour and market-forces attribute to underserved or overserved areas (McIsaac et al. 2019; Mu and Hall 2020). The inverse care law proposed by Tudor Hart further illustrates this concept where the ‘availability of good medical services tends to vary inversely with the need for it in the population served’ (Tudor Hart 1971, p. 1.). Public health policy decision-making pertaining to resource allocation and workforce distribution is critical to population access and utilisation of services (Laurence and Karnon 2017).
Australian healthcare system
The Australian healthcare system is comprised of public and private sectors, funded by private sources and tax-fundable public insurance coverage (Australia Institute of Health and Welfare 2018). The Australian Government provides basic coverage through a universal public health insurance scheme known as Medicare. Medicare offers all Australian citizens and permanent residents fixed rebates listed on the Medicare Benefits Schedule (MBS) for medical treatments and services. However, private healthcare providers can determine fee-for-service that may generate out-of-pocket (OOP) costs or providers may accept the determined Medicare rebate known as bulk billing (Pulok et al. 2020a). The concept of ‘bulk billing’ means that the medical service is fully covered by the Government Medicare rebate with no OOP expenses. Nearly 9 in 10 GP services (87.5%) were bulk billed with no out-of-pocket expenses in 2019–20, and increased by 1.3% in comparison to 2018–19 (Department of Health 2020). The record increase in bulk billing is associated with the Government response to coronavirus disease 2019 (COVID-19) and increased services, which included a new telehealth item. Although most services are bulk billed, only 66% of patients had all consultation services bulk billed, and the average OOP expense for GP services in 2019–20 was A$39.33 (Royal Australian College of General Practitioners 2018; Australia Institute of Health and Welfare 2019; Department of Health 2020). The Australian Government’s Medicare policy changes, with the rebate ‘freeze’ (2014–20), contributed to the failure of ample subsidisation, and it is suggested that the indexation of fees inadequately covered inflation over the years (Australian Medical Association 2015; Harrison et al. 2015).
Australian general and medical practices are largely private businesses, with a small minority of Government-funded and not-for-profit organisations providing GP services. General practitioners and medical practices are eligible to decide billing policies and consultation fees at their own discretion. Medical practices’ billing policies are predominately modelled as private billing (private fees with OOP costs), mixed billing (private fees and bulk billing) and bulk billing only (no fees or no OOP costs for Medicare-rebated items) (Australian Medical Association 2015, 2017). According to peak organisations and industry representatives, the rising operating costs of a medical practice and insufficient indexation has led to difficulties in sustaining bulk billing-only practices and remaining a viable business, with the need for co-payments to aid practice running costs and wages (Australian Medical Association 2015; Harrison et al. 2015; Royal Australian College of General Practitioners 2018, 2020).
Both OOP expenses/co-payments acts as a financial barrier that influences the accessibility of health care and the utilisation of preventive care and health-related behaviour (Rezayatmand et al. 2013). The total spending of health by individuals was 16.5% (a decrease from the steady 17.1% over the last decade), and the average OOP cost per person was A$1578 (Australia Institute of Health and Welfare 2019). Socio-economically disadvantaged households experiencing income poverty are more likely to be impacted by increased health expenditure. Furthermore, the probability of individuals with chronical illnesses entering income poverty increases with the reduction of participation in employment, producing the need for more access to affordable healthcare services (Callander et al. 2017). Higher levels of spatial distribution of bulk billing-only services in areas of socio-economically disadvantage is one of the first steps to health equality (Fisher et al. 2017; Whitehead et al. 2018).
What does this research bring?
This study aims to evaluate the socio-demographic status and population characteristics in relation to the distribution of bulk billing-only GP services and identify areas of low access across Australia. The socio-demographics assessment will determine whether services are targeted towards lower socio-economic areas.
Methods
Population data
The study obtained the most recent population data from the Australian Bureau of Statistics (2016b), available on the Australian Bureau of Statistics (ABS) website. The geographical areas that divided population data and medical practice locations were gathered into Statistical Areas Level 2 (SA2) boundaries (Australian Bureau of Statistics 2016a). The socio-economic status (SES) of SA2s was assessed using one of the subsets of the Socio-Economic Indexes for Areas (SEIFA) 2016 (Australian Bureau of Statistics 2016b) The Index of Relative Socioeconomic Advantage and Disadvantage (IRSD) was used as the area-based composite measure of SES, and this index is derived from variables that include income, economics, occupation, employment, education, housing and economics. This study analysed the socio-economic status as deciles (10 categories, with 1 being the poorest decile and 10 the wealthiest) and quintiles (five categories).
Data collection
Medical practices that bulk bill all Medicare rebate-able services and items for all patients with no additional fees were included in this analysis. A nationwide data collection of all bulk billing-only medical practices was gathered and verified on 21 August 2020. The triangulation of data were collected from publicly accessible sources; Australian Government website, Healthdirect (https://about.healthdirect.gov.au/.) and all practice billing policies were checked and cross-referenced against billing information stated on HealthEngine (https://healthengine.com.au/.) and medical practices websites. The bulk billing-only medical practices that catered for specific demographics and not all the public were excluded from this analysis. The exclusion criteria included medical practices that incurred small fees, only practices bulk billing for a Brief Consultation (Level A) and not others, practices with unclear or missing billing information, not all GPs that bulk bill, and practices that did not bulk bill throughout all opening hours. A small sample was extracted from the dataset to confirm data accuracy, with 100 randomly chosen practices checked via phone call and Google; all were found to be correctly located. For each bulk billing-only medical practice, the longitude and latitude values were accessed from the geo-coding website (https://maps.google.com.au/maps).
Data analysis
The longitude and latitude coordinates for each bulk billing-only medical practice physical address was entered into a Microsoft Excel spreadsheet (Ver. 16.0.6965.2053, 2010; Microsoft Corporation, Redmond, WA, USA). The ABS SA2 shapefiles, census data and physical addresses of the medical practices were entered into Geographic Information System (GIS) – QGIS (Ver. 3.10.2 A Coruńa, 2020, Chicago, USA). The coordinate reference system (CRS) used for both ABS shapefiles and physical address coordinates was CRS: EPSG: 4326 -WGS 84. The calculated Population-to-Practice (PtP) ratios, SES and population variables were summarised using descriptive statistics calculated in Microsoft Excel (Microsoft Corporation). Inferential statistical analyses were conducted using SPSS (Ver. 27.0, 2020; Chicago, IL, USA), and Independent-Samples Kruskal–Wallis tests to determine the effects of categorical independent variables (IRSD categories) on dependent variables (population mean and number of practices). The statistical significance level was set at a P-value of ≤0.05.
Ethics approval
No ethics approval was needed as all data were obtained from open access sources.
Results
Population data
The total population calculated from all the SA2s boundaries was 23 352 146, and the population was distributed across 2191 SA2s, out of 2310 in total. The analysis excluded 119 SA2s that had zero population or were non-spatial SA2s. The population per SA2 ranged from 23 to 37 321, and the average population per SA2s was 10 658. In total, 2095 bulk billing-only medical practices were included in the analysis and were geo-located across the 2191 populated SA2s (Fig. 1).

|
PtP ratio differences between States and Territories
The PtP ratio averages were defined by only calculating SA2 regions with access to bulk billing-only practices and PtP ratios with no access calculated to zero. The PtP ratio averages and number of practices per SA2 region were calculated for each State and Territory with an overall nationwide sum (Table 1). The average PtP ratio for Australia was one bulk billing-only medical practice per 8529 people. The nationwide PtP ratios ranged from 1: 28 050 to 1: 549. The most bulk billing-only medical practices in one SA2 was 18 in Bankstown – Inner South West Sydney, NSW. The highest average State and Territory ratio was VIC with 1: 10 138 and the lowest ratio was NT with 1: 2724.

|
Practice distribution statistics and frequency of PtP ratios across all Australia
The percentage of SA2 regions and percentage of population with access to one or more bulk billing-only practices was calculated (Table 1). Under a half (44.8%) of all SA2s nationwide had access to one or more bulk billing-only practices, supplying 57.4% of the Australian population. In total, 983 SA2s had access to one or more bulk billing-only medical practices (Population = 13 410 737) and 1208 SA2s had no access (Population = 9 941 409). The highest percentage of SA2s with access to practices per State and Territory was New South Wales (NSW;53.2%) and the lowest was the Australian Capital Territory (ACT; 7.1%). A total of 608 (27.7%) SA2 regions had a ratio lower than national the PtP average (1: 8529) and 375 SA2 regions (17.1%) had a ratio higher than the national average when comparing all SA2 regions including the 1208 regions with no access. The frequency of PtP ratios distribution was calculated and indicated a positive skewed value of 0.96 and median (IQR) = 7065 (4477–11 181) (Fig. 2).

|
Relationship between socio-economic factors and practice distribution
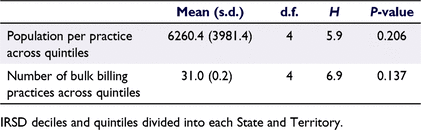
Each SA2 region was assigned an IRSD score and linked with the average PtP ratios, number of practices and population for each State and Territory (Table 2). The highest national average PtP ratio was 1: 11 322 for IRSD – 9 (second wealthiest decile) and the lowest ratio was 1: 6144 for IRSD – 1 (poorest decile). The highest average PtP ratio for each State and Territory was SA with 1: 15 860 for IRSD-6 and lowest was ACT with 1: 947 for IRSD-8. The PtP ratios were then gathered into IRSD quintiles (Fig. 3). The highest IRSD quintile ratio was 1: 11 107 for quintile 5 (wealthiest quintile) and the lowest ratio was 1: 6628 for quintile 1 (poorest quintile). The distribution of population mean per practice, and the total number of bulk billing practices across ISRD quintiles were analysed (Table 3). There were no significant associations between population per practice, or total number of bulk billing practices and IRSD categories for all areas.

|

|
|
Discussion
The study examined the distribution of bulk billing-only medical practices and socio-economic status of the population it serves using GIS technology. The key findings of this study showed that a little over half of the Australian population lived within a SA2 region that had access to bulk billing-only medical practices. Of those with access to a practice, a small percentage (27.7%) of SA2 regions had a PtP ratio lower than the national average, signifying ‘good accessibility’, and (17.1%) had ‘poorer accessibility’ than the national average. Despite the lack of statistical significance of socio-demographic status trends in practice distribution, the NT (46.8%), SA (36.9%), Tas. (8.3%) and ACT (7.1%) had remarkably lower access overall when it came to SA2 regions with a bulk billing-only practice (Table 1). Of these States and Territories, the NT has regions in the top 10 most disadvantaged areas in Australia, and notably SA and Tas. have large pockets of population living in disadvantaged areas (Australian Bureau of Statistics 2016b). The lowest percentages of the population having accessibility to practices in regions of the poorest IRSD decile were observed in ACT (0%), WA (16.6%) and Tas. (18.2%). Examining the four poorest IRSD deciles, Tasmania had all poorest regions with inadequate access to bulk billing-only practices (Table 2). Findings highlight the many lower socio-economic regions in Australia with a lack of affordable services.
Several authors have reported differences in Australian GP distribution, utilisation and GP employment locality choices within lower SES area levels (Roeger et al. 2010; McRae and Butler 2014; Lyle and Hendrie 2019; McIsaac et al. 2019; Mu and Hall 2020). In contrast, a study published two decades ago documented high GP hours per population and higher bulk billing rates in the most disadvantaged areas in comparison to least disadvantaged areas (Hyndman and Holman 2001). The utilisation of services is driven by health, personal preferences, and economic status, with lower SES populations visiting GP services more frequently and at greater risk of poorer health (Achat et al. 2010; Australia Institute of Health and Welfare 2016; Lyle and Hendrie 2019; Mu and Hall 2020). Affordable GP services should conceptually follow a needs-based trend to largely supply socially disadvantaged populations (Pulok et al. 2020a). The equitable provision of healthcare services can be defined as two subcategories of a needs-based approach, which is horizontal equity: ‘the equal treatment of equals’ or vertical equity: the ‘appropriate unequal treatment of unequals’ (Pulok et al. 2020a). Vertical equity is services that are distributed or targeted to an individual’s needs; for example, providing more medical tests to a population with a specific medical condition in comparison to supplying the same medical tests to the population without the medical condition. This horizontal equity is the equal access and use of healthcare services despite socio-economic status (SES) (Pulok et al. 2020b).
It should be mentioned facility locality does not account for practice operating hours or workforce metrics, and bulk-billing services are also attainable through private or mixed billing practices (Dingwall et al. 2020). Although bulk billing rates remains high, bulk billing is at the discretion of the consulting GP, but is not always necessarily guaranteed. Business sustainability and market forces greatly impact the viability of bulk billing-only practices and billing models (Royal Australian College of General Practitioners 2018). There are few studies examining bulk billing practices and of these few, bulk billing behaviour is suggested to be influenced by regional area status, practice size, consultation length, patient income and practice location (Britt et al. 2004; Achat et al. 2010; De Abreu Lourenco et al. 2015; Mu and Hall 2020; O’Sullivan et al. 2022).
The main limitation in this study is the only recent population dataset available from the ABS was an enumeration dated earlier than the data collection of medical practice locations, as that is the only population dataset available. It is well acknowledged that census population estimates are subject to change and are cross-sectional in nature.
The second limitation is the modelling of bulk billing-only medical practices has the potential of sample errors with a small probable chance of an over or under representation of practices. Any missing samples could be a result of the reliability of data sources possibly excluding medical practices from health directories or the advertisement of incorrect billing policies information or change in billing policies.
Mapping GP services with area-level data using GIS technology has proven to be useful tool to reveal spatial variations and distribution (Roeger et al. 2010; McGrail 2012; Dudko et al. 2018). Research recording trends in bulk billing-only services is valuable for observing the effect that Government policy has on medical practices billing models and business sustainability. The main contribution of this study was to provide a current estimate of bulk billing-only practices and geographic distribution of services, which, to date, has not been available. The study’s design is strengthened by the entire population-based dataset that include all practices and whole population distribution, which increases the validity of results.
Conclusion
In summary, a large percentage of the Australian population lacked access to bulk billing medical practices, with 55.2% of regions having no services, which contain 42.5% of the population. The portion of bulk billing-only services distributed exhibited no statistically socio-demographics trends, yet results described substantial access issues in some States with higher numbers of lower socio-economic regions. This study defined areas of low accessibility, with only 27.7% of the population living within a region with access higher than the national average. Underlining drivers for the spatial distribution of bulk billing-only practices are not yet understood and would require additional investigation. Suggestions for future research could be to model bulk billing-only services with longitudinal methods and encourage a more definitive measure of medical practices across Australia.
Data availability
The data that support this study are available in FigShare at [10.6084/m9.figshare.16840975].
Conflicts of interest
The authors declare no conflicts of interest.
Declaration of funding
This research did not receive any specific funding.
References
Achat HM, Thomas P, Close GR, Moerkerken LR, Harris MF (2010) General health care service utilisation: where, when and by whom in a socioeconomically disadvantaged population. Australian Journal of Primary Health 16, 132–140.| General health care service utilisation: where, when and by whom in a socioeconomically disadvantaged population.Crossref | GoogleScholarGoogle Scholar |
Australia Institute of Health and Welfare (2016) Australia’s health 2016: 5.1 Health across socioeconomic groups. (AIHW: Canberra, ACT, Australia) Available at https://www.aihw.gov.au/getmedia/405d9955-c170-4c39-a496-3839059149f7/ah16-5-1-health-across-socioeconomicgroups.pdf.aspx [Verified 16 May 2021]
Australia Institute of Health and Welfare (2018) Australia’s health 2018: 2.1 How does Australia’s health system work. (AIHW: Canberra, ACT, Australia) Available at https://www.aihw.gov.au/getmedia/63fe0895-b306-4375-95ff-162149ffc34b/aihw-aus-221-chapter-21.pdf.aspx [Verified 16 May 2021]
Australia Institute of Health and Welfare (2019) Health expenditure Australia 2017–18. (AIHW: Canberra, ACT, Australia) Available at https://www.aihw.gov.au/getmedia/91e1dc31-b09a-41a2-bf9f8deb2a3d7485/aihw-hwe-77-25092019.pdf.aspx [Verified 18 May 2021]
Australian Bureau of Statistics (2016a) 1270.0.55.001 – Australian Statistical Geography Standard (ASGS): Volume 1 – Main Structure and Greater Capital City Statistical Areas, July 2016. (ABS: Canberra, ACT, Australia) Available at www.abs.gov.au/AUSSTATS/abs@.nsf/Lookup/1270.0.55.001 [Verified 2 December 2020]
Australian Bureau of Statistics (2016b) 2033.0.55.001 – Census of population and housing: socio-economic indexes for areas (SEIFA), Australia, 2016. (ABS: Canberra, ACT, Australia) Available at https://www.abs.gov.au/ausstats/abs@.nsf/mf/1270.0.55.001 [Verified 2 December 2020]
Australian Medical Association (2015) Guide for patients on how the health care system fund medical care. Available at https://ama.com.au/articles/guide-patientshow-health-care-system-funds-medical-care#First [Verified 16 May 2021]
Australian Medical Association (2017) AMA position statement : setting medical fees and billing practices. Available at https://ama.com.au/position-statement/settingmedical-fees-and-billing-practices-2017 [Verified 18 May 2021]
Britt H, Valenti L, Miller GC, Farmer J (2004) Determinants of GP billing in Australia: content and time. Medical Journal of Australia 181, 100–104.
| Determinants of GP billing in Australia: content and time.Crossref | GoogleScholarGoogle Scholar |
Butler DC, Petterson S, Bazemore A, Douglas KA (2010) Use of measures of socioeconomic deprivation in planning primary health care workforce and defining health care need in Australia. The Australian Journal of Rural Health 18, 199–204.
| Use of measures of socioeconomic deprivation in planning primary health care workforce and defining health care need in Australia.Crossref | GoogleScholarGoogle Scholar |
Callander EJ, Corscadden L, Levesque J-F (2017) Out-of-pocket healthcare expenditure and chronic disease – do Australians forgo care because of the cost? Australian Journal of Primary Health 23, 15–22.
| Out-of-pocket healthcare expenditure and chronic disease – do Australians forgo care because of the cost?Crossref | GoogleScholarGoogle Scholar |
De Abreu Lourenco R, Kenny P, Haas MR, Hall JP (2015) Factors affecting general practitioner charges and Medicare bulk-billing: results of a survey of Australians. Medical Journal of Australia 202, 87–90.
| Factors affecting general practitioner charges and Medicare bulk-billing: results of a survey of Australians.Crossref | GoogleScholarGoogle Scholar |
Department of Health (2020) Annual medicare statistics: financial year 1984–85 to 2019–20. (DoH: Canberra, ACT, Australia) Available at https://www1.health.gov.au/internet/main/publishing.nsf/Content/Medicare%20Statistics-1 [Verified 16 May 2021]
Dingwall S, Henderson J, Britt H, Harrison C (2020) Adequacy of Australia’s GP workforce: estimating supply and demand, 2005–06 to 2015–16. Australian Health Review 44, 328–333.
| Adequacy of Australia’s GP workforce: estimating supply and demand, 2005–06 to 2015–16.Crossref | GoogleScholarGoogle Scholar |
Dudko Y, Robey DE, Kruger E, Tennant M (2018) Selecting a location for a primary healthcare facility: combining a mathematical approach with a Geographic Information System to rank areas of relative need. Australian Journal of Primary Health 24, 130–134.
| Selecting a location for a primary healthcare facility: combining a mathematical approach with a Geographic Information System to rank areas of relative need.Crossref | GoogleScholarGoogle Scholar |
Fisher M, Baum F, Kay A, Friel S (2017) Are changes in Australian national primary healthcare policy likely to promote or impede equity of access? A narrative review. Australian Journal of Primary Health 23, 209–215.
| Are changes in Australian national primary healthcare policy likely to promote or impede equity of access? A narrative review.Crossref | GoogleScholarGoogle Scholar |
Harrison C, Bayram C, Miller GC, Britt HC (2015) The cost of freezing general practice. Medical Journal of Australia 202, 313–316.
| The cost of freezing general practice.Crossref | GoogleScholarGoogle Scholar |
Hyndman JCG, Holman CDJ (2001) Accessibility and spatial distribution of general practice services in an Australian city by levels of social disadvantage. Social Science & Medicine 53, 1599–1609.
| Accessibility and spatial distribution of general practice services in an Australian city by levels of social disadvantage.Crossref | GoogleScholarGoogle Scholar |
Ireland MJ, March S, Crawford-Williams F, Cassimatis M, Aitken JF, Hyde MK, Chambers S K, Sun J, Dunn J (2017) A systematic review of geographical differences in management and outcomes for colorectal cancer in Australia. BMC Cancer 17, 95
| A systematic review of geographical differences in management and outcomes for colorectal cancer in Australia.Crossref | GoogleScholarGoogle Scholar |
Laurence COM, Karnon J (2017) What will make a difference? Assessing the impact of policy and non-policy scenarios on estimations of the future GP workforce. Human Resources for Health 15, 43
| What will make a difference? Assessing the impact of policy and non-policy scenarios on estimations of the future GP workforce.Crossref | GoogleScholarGoogle Scholar |
Lyle G, Hendrie D (2019) Predicting general practitioner utilisation at a small area level across Western Australia. Australian Journal of Primary Health 25, 570–576.
| Predicting general practitioner utilisation at a small area level across Western Australia.Crossref | GoogleScholarGoogle Scholar |
McGrail MR (2012) Spatial accessibility of primary health care utilising the two step floating catchment area method: an assessment of recent improvements. International Journal of Health Geographics 11, 50
| Spatial accessibility of primary health care utilising the two step floating catchment area method: an assessment of recent improvements.Crossref | GoogleScholarGoogle Scholar |
McIsaac M, Scott A, Kalb G (2019) The role of financial factors in the mobility and location choices of General Practitioners in Australia. Human Resources for Health 17, 34
| The role of financial factors in the mobility and location choices of General Practitioners in Australia.Crossref | GoogleScholarGoogle Scholar |
McRae I, Butler JRG (2014) Supply and demand in physician markets: a panel data analysis of GP services in Australia. International Journal of Health Care Finance and Economics 14, 269–287.
| Supply and demand in physician markets: a panel data analysis of GP services in Australia.Crossref | GoogleScholarGoogle Scholar |
Mu C, Hall J (2020) What explains the regional variation in the use of general practitioners in Australia? BMC Health Services Research 20, 325
| What explains the regional variation in the use of general practitioners in Australia?Crossref | GoogleScholarGoogle Scholar |
O’Sullivan BG, Kippen R, Hickson H, Wallace G (2022) Mandatory bulk billing policies may have differential rural effects: an exploration of Australian data. Rural and Remote Health 22, 7138
| Mandatory bulk billing policies may have differential rural effects: an exploration of Australian data.Crossref | GoogleScholarGoogle Scholar |
Pulok MH, van Gool K, Hall J (2020a) Horizontal inequity in the utilisation of healthcare services in Australia. Health Policy (Amsterdam) 124, 1263–1271.
| Horizontal inequity in the utilisation of healthcare services in Australia.Crossref | GoogleScholarGoogle Scholar |
Pulok MH, van Gool K, Hajizadeh M, Allin S, Hall J (2020b) Measuring horizontal inequity in healthcare utilisation: a review of methodological developments and debates. The European Journal of Health Economics 21, 171–180.
| Measuring horizontal inequity in healthcare utilisation: a review of methodological developments and debates.Crossref | GoogleScholarGoogle Scholar |
Rezayatmand R, Pavlova M, Groot W (2013) The impact of out-of-pocket payments on prevention and health-related lifestyle: a systematic literature review. European Journal of Public Health 23, 74–79.
| The impact of out-of-pocket payments on prevention and health-related lifestyle: a systematic literature review.Crossref | GoogleScholarGoogle Scholar |
Roeger LS, Reed RL, Smith BP (2010) Equity of access in the spatial distribution of GPs within an Australian metropolitan city. Australian Journal of Primary Health 16, 284–290.
| Equity of access in the spatial distribution of GPs within an Australian metropolitan city.Crossref | GoogleScholarGoogle Scholar |
Royal Australian College of General Practitioners (2018) Billing for general practice services. Available at https://www.racgp.org.au/advocacy/position-statements/view-all-position-statements/health-systems-and-environmental/billing-for-general-practice-services [Verified 16 May 2021]
Royal Australian College of General Practitioners (2020) General practice: health of the nation. Available at https://www.racgp.org.au/health-of-the-nation/health-of-the-nation [Verified 16 May 2021]
Tudor Hart J (1971) The inverse care law. The Lancet 297, 405–412.
| The inverse care law.Crossref | GoogleScholarGoogle Scholar |
Turner M, Fielding S, Ong Y, Dibben C, Feng Z, Brewster DH, Black C, Lee A, Murchie P (2017) A cancer geography paradox? Poorer cancer outcomes with longer travelling times to healthcare facilities despite prompter diagnosis and treatment: a data-linkage study. British Journal of Cancer 117, 439–449.
| A cancer geography paradox? Poorer cancer outcomes with longer travelling times to healthcare facilities despite prompter diagnosis and treatment: a data-linkage study.Crossref | GoogleScholarGoogle Scholar |
Whitehead J, Pearson AL, Lawrenson R, Atatoa-Carr P (2018) Framework for examining the spatial equity and sustainability of general practitioner services. The Australian Journal of Rural Health 26, 336–341.
| Framework for examining the spatial equity and sustainability of general practitioner services.Crossref | GoogleScholarGoogle Scholar |
World Health Organization (2010) The world health report 2010. Health systems financing: the path to universal coverage. (World Health Organization: Geneva, Switzerland) Available at https://www.who.int/publications/i/item/9789241564021 [Verified 16 May 2021]