

CD36- and obesity-associated granulosa cells dysfunction
Ru-xing Wu A * , Ying-ying Dong B * , Pei-wen Yang A , Lan Wang A , Yun-hua Deng B , Han-wang Zhang A D and Xiao-yuan Huang C D
C D
A Reproductive Medicine Center, Tongji Hospital, Tongji Medical College, Huazhong University of Science and Technology, 1095 Jie Fang Avenue, Wuhan 430030, China.
B Department of Dermatology, Tongji Hospital, Tongji Medical College, Huazhong University of Science and Technology, 1095 Jie Fang Avenue, Wuhan 430030, China.
C Cancer Biology Research Centre, Tongji Hospital, Tongji Medical College, Huazhong University of Science and Technology, 1095 Jie Fang Avenue, Wuhan 430030, China.
D Corresponding authors. Emails: hwzhang605@126.com; huangxy@tjh.tjmu.edu.cn
Reproduction, Fertility and Development 31(5) 993-1001 https://doi.org/10.1071/RD18292
Submitted: 14 June 2018 Accepted: 27 December 2018 Published: 5 March 2019
Journal Compilation © CSIRO 2019 Open Access CC BY-NC-ND
Abstract
Emerging evidence indicates that obesity impairs granulosa cell (GC) function, but the underlying mechanisms remain unclear. Gene expression profiles in GC of non-polycystic ovary syndrome (PCOS) obese (NPO), PCOS obese (PO), PCOS normal weight (PN) and non-PCOS normal weight (NPN) patients were analysed by microarray analysis. Compared with the NPN group, there were 16, 545 and 416 differently expressed genes in the NPO, PO and PN groups respectively. CD36 was the only intersecting gene, with greater than two fold changes in expression between the NPO versus NPN and PO versus NPN comparisons, and was not present in the PN versus NPN comparison. In addition, levels of CD36 protein were higher in GC from obese than normal weight patients. Furthermore, CD36 overexpression in a GC line inhibited cell proliferation, as determined by the cell counting kit-8 (CCK8) test, promoted cell apoptosis, as determined by flow cytometry, and inhibited the secretion of oestradiol by depositing triglyceride in cells and increasing cellular lipid peroxide levels. These adverse effects were reduced by sulfo-N-succinimidyloleate, a specific inhibitor of CD36. Together, the findings of this study suggest that obesity with and without PCOS should be regarded as separate entities, and that CD36 overexpression in GC of obese patients is one of the mechanisms by which obesity impairs GC function.
Additional keywords: endocrinology, fatty acid, gene expression.
Introduction
It has been reported that in the US and most European countries, 30% of women are obese (body mass index (BMI) ≥30 kg/m2) and that 6% of these women are morbidly obese (BMI ≥35 kg/m2) (World Health Organization (WHO) 2000; Norman et al. 2004; Haslam and James 2005). In China, the prevalence of obesity increased from 8.6% in 2000 to12.9% in 2014 (Tian et al. 2016). In the US, according to the National Health and Nutrition Examination Survey (NHANES) 1999–2002, 29% of non-pregnant women aged 20–39 years were obese (Hedley et al. 2004). Obese women have increased risks of subfecundity and infertility, reduced conception rates, increased miscarriage rates and pregnancy complications (Wise et al. 2010; Boots and Stephenson 2011) and these women also experience poor reproductive outcomes in natural as well as assisted conception (Metwally et al. 2007a; Rittenberg et al. 2011).
Unfortunately, the aetiology of obesity-related subfecundity and infertility is not well known. The main causes are menstrual dysfunction and anovulation (Bolúmar et al. 2000), which result from hyperinsulinaemia, insulin resistance and hyperandrogenism (Diamanti-Kandarakis and Dunaif 1996). However, subfecundity and poor pregnancy outcomes are similar in obese women who are young, without hyperandrogenism and with regular menstrual cycles (Linné 2004; Yang et al. 2012). A study in Spain reported that 28% of overweight and obese women were diagnosed with polycystic ovary syndrome (PCOS; Álvarez-Blasco et al. 2006). PCOS is the most common endocrine disease in women of reproductive age. Menstrual disturbances, anovulation, infertility and high levels of basal LH are more common in obese women with PCOS than without PCOS (Al-Azemi et al. 2004; Metwally et al. 2007b), with the former group associated with the retrieval of fewer oocytes, higher miscarriage rates and lower clinical pregnancy rates (Jungheim et al. 2009; Ozgun et al. 2011).
Granulosa cell (GC) are crucial in ovarian folliculogenesis because they provide an appropriate microenvironment for follicular development and oocyte maturation. In response to pituitary gonadotrophin secretion, GC upregulate the expression of various genes that encoding proteins in steroidogenic pathways involved in oestradiol (E2) biosynthesis (Barnes et al. 2000). Some studies have reported that obesity is accompanied by high leptin levels, which inhibit insulin-induced ovarian steroidogenesis and LH-stimulated E2 production by acting on GC (Gil-Campos et al. 2004; Metwally et al. 2007b). Furthermore, recent studies have suggested that in women with PCOS, GC dysfunction may lead to abnormal folliculogenesis and increased ovarian androgens and/or circulating anti-Müllerian hormone concentrations (Das et al. 2008; Homburg et al. 2013; Homburg and Crawford 2014). However, the underlying mechanism by which obesity impairs GC function has yet to be elucidated. Therefore, it is crucial to explore the mechanisms underlying GC dysfunction in obese patients.
Therefore, in the present study, we compared gene expression profiles of GC from preovulatory follicles in obese and normal weight women of reproductive age with or without PCOS using Affymetrix microarray chips to estimate global changes in gene expression profiles and the significant pathways affected. The results showed that high CD36 expression is associated with obesity, but not PCOS. Furthermore, we explored the effects of CD36 overexpression on the function of COV434 cell, an immortalised human GC line, and the underlying mechanisms, as well as the effects of the specific CD36 inhibitor sulfo-N-succinimidyloleate (SSO).
Materials and methods
Patient selection
This study was approved by the Ethics Committee of Tongji Hospital, Tongji Medical College, Huazhong University of Science and Technology. All patients signed an informed consent form. Patients undergoing IVF or intracytoplasmic sperm injection (ICSI) were divided into four groups: non-PCOS obese (NPO), PCOS obese (PO), PCOS normal weight (PN) and non-PCOS normal weight (NPN) groups. The BMI was categorised according to established 2013 Chinese criteria as follows: normal weight, 18.5 kg/m2 ≤ BMI <24 kg/m2; overweight, 24 kg/m2 ≤ BMI < 28 kg/m2; and obese, BMI ≥28 kg/m2 (Health Industry Standard of the People’s Republic of China 2013). PCOS patients were diagnosed according to the Rotterdam revised criteria (Rotterdam ESHRE/ASRM-Sponsored PCOS Consensus Workshop Group 2004). To be eligible for inclusion in the study, women had to meet the following criteria: having undergone IVF or ICSI for blocked oviducts or male factor infertility at the Reproductive Medicine Centre in Tongji Hospital, age <35 years, a regular menstrual cycle and normal ultrasound appearance of ovaries in non-PCOS patients, no diabetes or biological or clinical signs of hyperandrogenism and no diagnosis of endometriosis, tuberculosis or tumours. All patients underwent controlled ovarian stimulation that combined a long gonadotrophin-releasing hormone (GnRH) agonist protocol (0.1 mg GnRH-a: Decapeptyl (Ferring) or Diphere-line (Ipsen)) with recombinant FSH (Gonal-F (Serono) or Puregon (Organon)) and ovulation was induced by recombinant human chorionic gonadotrophin (hCG; Serono).
GC collection
GC were isolated from follicular aspirates. After removal of oocytes, follicular aspirates from the same patient were centrifuged at 750g for 5 min at 37°C, after which 1.5 mL supernatant and precipitate was mixed and gently layered over 2 mL of a 50% Percoll density gradient and centrifuged at 1688g for 20 min at 37°C. GC at the interface were collected, washed with phosphate-buffered saline (PBS) and stored at −80°C until further testing.
Microarray hybridisation and analysis
Total RNA was isolated from the collected GC using an RNeasy Fibrous Tissue Kit (Qiagen). The quality of the RNA was assessed by denaturing gel electrophoresis. An Affymetrix Whole Transcript Sense Target Labelling Assay was used to create biotin-labelled sense-strand cDNA targets for hybridisation to the Gene 1.0 ST Arrays (Genminix Informatics). Gene chips were scanned using the Affymetrix Gene Chip Scanner 3000 7G. Significance analysis of microarrays (SAM) was used to filter the differentially expressed genes (DEGs) with a Q-value threshold of <0.05, an absolute value of fold change |FC| ≥1.2 and P < 0.05 for the control and experimental groups (Tusher et al. 2001). Hierarchical clustering was computed by the Pearson method (Eisen et al. 1998). Data were deposited in the Gene Expression Omnibus (GEO) of the National Center for Biotechnology Information and can be accessed through GEO series accession number GSE80432 (http://www.ncbi.nlm.nih.gov/geo/query/acc.cgi?acc=GSE80432, publically available from 14 April 2021). Gene ontology (GO) analysis was applied to analyze the main function of the differential expression genes according to the Gene Ontology which is the key functional classification of NCBI. Pathways were analysed according to the Kyoto Encyclopedia of Genes and Genomes (KEGG) database. DEGs with an FC >2 were analysed in three comparisons by a Venn diagram using the Venny 2.1 online tool (http://bioinfogp.cnb.csic.es/tools/venny/, verified 13 February 2019) to find the intersecting genes.
Western blot analysis
Total protein was extracted from additional GC of obese and normal weight patients or from COV434 cell and stored in a buffer including radioimmunoprecipitation assay (RIPA) lysis buffer and cocktail. Approximately 50 μg protein was loaded onto 15% polyacrylamide gels, separated electrophoretically and then transferred from the gel to polyvinylidene difluoride membranes. Membranes were blocked with non-fat milk and then immunoblotted with anti-CD36 antibody and anti-β-actin antibody or glyceraldehyde 3-phosphate dehydrogenase (GAPDH; ABclonal). Then, membranes were incubated with secondary antibodies (ABclonal), and the immune complexes were detected by enhanced chemiluminescence (Advansta, USA) using protein exposure apparatus (Genesys). Relative protein levels per sample were normalised against β-actin or GAPDH signals.
Cell culture
COV434 cell were purchased from the China Centre for Type Culture Collection. Cells were cultured in Dulbecco’s modified Eagle’s medium (DMEM) supplemented with 20% fetal bovine serum and 1% penicillin–streptomycin. All cells were grown in a humidified 37°C incubator with 5% CO2. COV434 cell were transfected with CD36 recombinant plasmid (CD36 group) at a concentration of 0.1 µg µL−1, empty plasmid (empty plasmid group) at a concentration of 0.1 µg µL−1 or 1× PBS (control group; Sino Biological). SSO (Santa Cruz Biotechnology) was used to investigate the effects of inhibiting CD36 in COV434 cell (Habets et al. 2007). In these experiments, 24 h after transfection with CD36 recombinant plasmid, COV434 cell were exposed to 0.4 mM SSO in the medium or 0.5% dimethyl sulfoxide (DMSO; control group) for 30 min. In some experiments, 200 μM palmitic acid (PA; Solarbio) was added to the medium 24 h after the transfection of cells with CD36 recombinant plasmid or after 30 min of the addition of SSO.
Cellular triglyceride content
To determine the triglyceride (TG) content in COV434 cell, cells were cultured in 6-well plates at a density of 5 × 10⁵ cells per well and TG concentrations detected after 48 h culturing with PA using a commercially available TG kit (Nanjing Institute of Biological Engineering, China) according to the manufacturer’s instructions. Briefly, cells from each well were counted and collected. Then, cells were lysed by RIPA, after which the protein concentration was measured using a microplate reader. TG concentrations are given per 1 × 10⁵ cells.
Cell proliferation assay
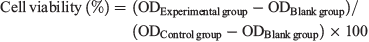
COV434 cell were seeded at a density of 1.9 × 10⁴ cells per well in 96-well flat-bottomed microtitre plates. After 48 h in culture with 200 μM PA, 10 μL CCK-8 solution (Dojindo) and 90 μL DMEM were added to each well and the cells were cultured for another 2 h. The plates were then read in a microplate reader at 450 nm to determine the absorbance of each well (optical density (OD)). Cell viability was calculated using the following equation:
Apoptosis assay
COV434 cell were seeded at a density of 1.5 × 10⁵ cells per well in 12-well plates. After 48 h culture with 200 μM PA, COV434 cell were washed with phosphate buffer and resuspended in 300 μL binding buffer (BD Biosciences). Then, cells were stained with 5 μL annexin V and propidium iodide (PI; BD Biosciences) and analysed by flow cytometry.
Endocrine function
COV434 cell were seeded at a density of 2 × 10⁵ cells per well in 12-well plates. After 48 h culture with 200 μM PA, 96 U mL−1 recombinant FSH (Gonal-F; Serono) and 1 × 10⁻⁶ µM androstendione (Shang Hai Shfeng Biological Technology) were added to the medium. After 24 h, the medium was collected and used for determination of E2 concentrations using an E2 ELISA kit (CUSABIO) according to the manufacturer’s instructions. The cells were also counted.
Measurement of lipid peroxidation
COV434 cell were cultured in 6-well plates at a density of 5 × 10⁵ cells per well. After 48 h culture with 200 μM PA, COV434 cell were collected and counted. The F2-isoprostanes are a class of prostaglandins formed from free radical-mediated lipid peroxidation (van‘t Erve et al. 2015). The concentration of 8-iso-prostaglandin (PG) F2α in cells was determined by comparing 8-iso-PGF2α absorbance (450 nm) against a known 8-iso-PGF2α standard curve using the OXiSelect 8-iso-PGF2α ELISA kit (Cell Biolabs) according to the manufacturer’s instructions.
Statistical analysis
Data obtained from three independent measurements of cell concentrations and clinical data from patients are presented as the mean ± s.d. The significance of differences between groups was evaluated using t-tests in GraphPad Prism 5. Two-tailed P < 0.05 was considered significant.
Results
Characteristics of the patients used for the microarray screen
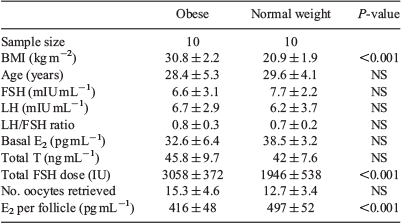
Each of the NPO, PO, PN and NPN groups contained four patients, and the patients’ characteristics are given in Table 1. The BMI of patients in the NPO, PO, PN and NPN groups was 30.3 ± 2.5, 30.8 ± 2.0, 22.5 ± 0.9 and 21.7 ± 1.7 kg/m2 respectively. Binary comparisons were as follows: NPO versus NPN, PO versus NPN and PN versus NPN. There were no significant differences between the groups with regard to age and basal FSH and E2 concentrations. The basal LH concentration, LH/FSH ratio, total testosterone and number of oocytes retrieved was significantly higher in the PO and PN groups than in the NPN group, but there were no significant differences in these parameters between the NPO and NPN groups. The total FSH dose was significantly higher in both the PO and NPO groups than in the NPN group, but not in the PN versus NPN group. The E2 concentration per follicle was lower in both the PO and NPO groups than in the NPN group, but not in the PN versus NPN group.

|
Array analysis of intersecting genes
Comparing the NPO and NPN groups revealed 16 DEGs (Fig. 1a); all genes were upregulated in the NPO group, including four genes with an FC >2 (see Table S1, available as Supplementary Material to this paper). The top five outstanding pathways were progesterone-mediated oocyte maturation, oocyte meiosis, cell cycle, sulfur metabolism and fat digestion and absorption. Comparing the PO with NPN group revealed 545 DEGs (Fig. 1b), of which 90.6% (494/545) were downregulated in the PO group. There were 14 upregulated genes with an FC >2 and 20 downregulated genes with an FC less than −2 (Table S1). Prominent GOs were primarily connected with metabolic process and DNA-dependent transcription. The top five outstanding pathways were metabolic pathways, valine, leucine and isoleucine degradation, propanoate metabolism, pyruvate metabolism and Alzheimer’s disease. A comparison of the PN with NPN group revealed 416 DEGs, with 50 genes upregulated in the PN group (Fig. 1c). Seven of the upregulated genes had an FC >2 and 25 downregulated genes had an FC less than −2 (Table S1). The DEGs were primarily associated with metabolic process and signal transduction, and as well as metabolic pathways. Of interest, the expression of a group of genes encoding proteins involved in oocyte meiosis was decreased in GC from the PN group. The mitogen-activated protein kinase (MAPK), wnt, calcium and focal adhesion pathways were also highlighted pathways.

|
CD36 was the only intersecting gene between the NPO versus NPN and PO versus NPN comparisons, and was not present in the PN versus NPN comparison (Fig. 1d). Furthermore, CD36 was found in the fat digestion and absorption pathway.
Overexpression of CD36 protein in GC of obese patients with or without PCOS
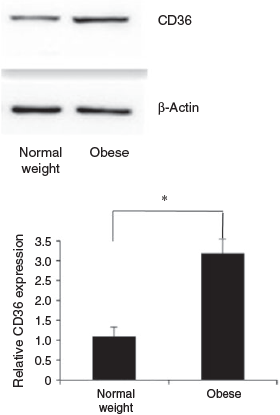
CD36 protein concentrations were determined in GC from obese and normal weight patients who had undergone IVF. Each group included 10 patients. The BMI of patients in the obese and normal weight groups was 30.8 ± 2.2 and 20.9 ± 1.9 kg/m2 respectively, and other patient characteristics are given in Table 2. No normal weight patients had PCOS. Five obese patients were diagnosed with PCOS. There were no differences between the groups with regard to age, basal FSH, LH and E2 concentrations, the LH : FSH ratio, total testosterone and the number of oocytes retrieved. The total FSH dose was significantly higher in the obese than normal weight group. The E2 concentration per follicle was lower in obese than normal weight patients. Western blotting analysis showed that of CD36 protein levels in GC were 3.2-fold higher in obese than normal weight patients (Fig. 2).
|
|
Effects of CD36 overexpression on COV434 cell function
The expression of CD36 protein in COV434 cell in the CD36 group was 2.73- and 2.79-fold higher than that in the empty plasmid and control groups respectively (P < 0.05), with no significant difference (P > 0.05) between the empty plasmid and control groups (Fig. 3a, b). The TG content in the CD36 and control groups was 0.3243 ± 0.0117 and 0.1659 ± 0.0104 mmol g−1 protein per 1 × 10⁵ cells respectively (P < 0.05; Fig. 3c). Relative cell viability in the CD36 group was 74% of that of the control group (P < 0.05; Fig. 3d) and the rate of apoptosis was 9.36 ± 0.80% and 2.47 ± 0.53% in the CD36 and control groups respectively (P < 0.05; Fig. 3e). The concentration of E2 in the medium of the CD36 and control groups was 65.10 ± 2.23 and 95.23 ± 1.83 pg mL−1 per 1 × 10⁵ cells respectively (P < 0.05; Fig. 3f), whereas the concentration of 8-iso-PGF2α was 30.73 ± 1.34 and 12.82 ± 1.03 pg mL−1 per 1 × 10⁵ cells respectively (P < 0.05; Fig. 3g).

|
Effects of SSO on COV434 cell function
TG content in the SSO-treated and control groups was 0.1337 ± 0.1017 and 0.3357 ± 0.0243 mmol g−1 protein per 1 × 10⁵ cells respectively (P < 0.05; Fig. 4a). Cell viability was a nearly 22% increase in the SSO compared with control group (P < 0.05; Fig. 4b). The rate of apoptosis in the SSO and control groups was 9.03 ± 0.61% and 13.78 ± 0.86% respectively (P < 0.05; Fig. 4c). Concentrations of E2 in the medium were higher for the SSO than control group (80.42 ± 1.12 vs 66.01 ± 2.12 pg mL−1 per 1 × 10⁵ cells respectively; P < 0.05; Fig. 4d), whereas 8-iso-PGF2α concentrations were lower in the SSO than control group (11.52 ± 1.04 and 32.2 ± 1.15 pg mL−1 per 1 × 10⁵ cells respectively; P < 0.05; Fig. 4e).

|
Discussion
This study used DNA microarray to identify DEGs in GC between obese and normal weight women with or without PCOS to offer novel information for further investigation of the mechanisms by which obesity impairs the function of GC. These microarray profiles show that CD36 is the only intersecting gene in the NPO versus NPN and PO versus NPN comparisons, but not in the PN versus NPN comparison, which suggests that high CD36 expression is associated with obesity, but not PCOS. Further, we demonstrated, in a large sample, that CD36 protein is overexpressed in GC of obese women. Finally, we demonstrated that CD36 overexpression in a GC line inhibited cell proliferation, promoted cell apoptosis and inhibited the secretion of E2 by depositing TG in cells and increasing lipid peroxide. We also demonstrated that the dysfunction of the GC line can be decreased by using SSO to inhibit CD36.
Exploring gene expression profiles of GC in obese infertile patients is necessary and reasonable. Throughout oocyte development, there is a codependency between the oocyte and its surrounding GC, which are essential for providing the oocyte with nutrients and growth regulators. The oocyte, in return, accelerates the proliferation of GC (Buccione et al. 1990). In the present study, the number of DEGs in GC in the NPO versus NPN groups was lower than that reported by Kenigsberg et al. (2009), who found 125 DEGs (P < 0.01 and an |FC| >1.5) in cumulus cells from overweight–obese non-PCOS versus lean non-PCOS patients, suggesting that obesity has different effects on GC and cumulus cell. This is supported by the findings of Borgbo et al. (2013), who reported that GC and cumulus cell show different gene profiles in a controlled ovarian stimulation cycle.
The microarray profiles in the present study indicate that obesity with and without PCOS should be regarded as separate subentities, because there were only 16 DEGs in the NPO versus NPN comparison but 545 DEGs in the PO versus NPN comparison, which strongly suggests that we should focus on obese patients with PCOS who have a more complex relationship with subfecundity or infertility. Similarly, previous studies have indicated that obese patients with PCOS have higher rates of insulin resistance (IR) and β-cell dysfunction, lower concentrations of insulin-like growth factor-binding protein 1 (IGFBP1), lower concentrations of sex hormone-binding globulin (SHBG) and higher ratios of E2 and testosterone to SHBG (Morales et al. 1996). However, GC of obese patients either with PCOS or without PCOS overexpress CD36 protein, indicating that CD36 plays an important role in obesity-associated dysfunction of GC.
Lan et al. (2015) reported 243 DEGs (125 upregulated, 118 downregulated) between PCOS and non-PCOS GC, and that the MAPK signalling pathway played a vital role in the pathogenesis of PCOS. In the present study, there were 416 DEGs identified in the PN versus NPN comparison (50 upregulated, 366 downregulated). Both the MAPK and wnt signalling pathways were found to play vital roles in the pathogenesis of PCOS. Wu et al. (2017) reported that the wnt signalling pathway may be related to the apoptosis of GC in PCOS patients.
CD36, the fatty acid translocase, regulates uptake of long-chain fatty acids (LCFAs) into cells (Febbraio et al. 2001). Schube et al. (2014) reported that CD36 protein is expressed in human GC. The results of the present study further demonstrate that levels of CD36 mRNA and protein in GC are higher in obese than normal weight patients without PCOS. The persistent presence of CD36 increases the rate of LCFA uptake and TG accumulation in cardiomyocytes (Angin et al. 2012), which is similar to the results in the present study showing that TG concentrations are higher in CD36-overexpressing COV434 cell. The concentration of TG in follicular fluid that affects GC viability was higher in obese than normal weight women who underwent IVF (Valckx et al. 2014). In mammals, obesity causes GC apoptosis, alters hormone production and compromises ovarian function, but the underlying mechanisms are not clearly known. The results of this study show that CD36 overexpressed by COV434 cell inhibits cell proliferation, promotes cell apoptosis and inhibits the secretion of E2, which is in accordance with the clinical characteristics that E2 concentrations per follicle are lower in both the PO and NPO groups compared with the NPN group. Lash and Armstrong (2009) reported that obesity resulting in irregular ovarian cycles and anovulation was associated with systemic oxidative stress caused by increased levels of lipid peroxides, but the mechanisms responsible are not fully understood. The results of the present study show that CD36 overexpression by COV434 cell increases lipid peroxide levels. Methods of eliminating or reducing the adverse effects of obesity on GC have become a popular research topic. The results of this study suggest that the dysfunction of COV434 cell caused by CD36 overexpression can be ameliorated by SSO.
Some factors may influence gene expression in GC, such as ovarian reserve (Chin et al. 2002), recombinant FSH or urinary human menopausal gonadotrophin (Grøndahl et al. 2009) and GnRH agonist or hCG triggering (Borgbo et al. 2013). The protocol of controlled ovarian stimulation for all patients in this study was a long GnRH agonist combined with recombinant FSH, with triggering by recombinant hCG. In the microarray study, there were four patients in each group, which may have affected the gene expression profiles in GC, but the CD36 protein was reanalysed in another 10 obese participants with or without PCOS and 10 normal weight participants.
In conclusion, this study identifies several genes and pathways that are differentially expressed in GC from non-PCOS obese patients and PCOS obese patients. Therefore, obesity with and without PCOS should be regarded as separate subentities. CD36 is overexpressed in the GC of obese patients, which leads to GC dysfunction by depositing TG in cells and increasing lipid peroxide. This adverse effect can be decreased using SSO to inhibit CD36.
Conflicts of interest
The authors declare no conflicts of interest.
Acknowledgements
The authors thank all the sample donors and the clinicians and embryologists of the Reproduction Centre of Tongji Hospital, Huazhong University of Science and Technology, for their excellent assistance. This study was supported by the National Natural Science Foundation of China (81471459).
References
Al-Azemi, M., Omu, F. E., and Omu, A. E. (2004). The effect of obesity on the outcome of infertility management in women with polycystic ovary syndrome. Arch. Gynecol. Obstet. 270, 205–210.| The effect of obesity on the outcome of infertility management in women with polycystic ovary syndrome.Crossref | GoogleScholarGoogle Scholar | 12955532PubMed |
Álvarez-Blasco, F., Botella-Carretero, J. I., San Millán, J. L., and Escobar-Morreale, H. F. (2006). Prevalence and characteristics of the polycystic ovary syndrome in overweight and obese women. Arch. Intern. Med. 166, 2081–2086.
| Prevalence and characteristics of the polycystic ovary syndrome in overweight and obese women.Crossref | GoogleScholarGoogle Scholar | 17060537PubMed |
Angin, Y., Steinbusch, L. K., Simons, P. J., Greulich, S., Hoebers, N. T., Douma, K., van Zandvoort, M. A., Coumans, W. A., Wijnen, W., Diamant, M., Ouwens, D. M., Glatz, J. F., and Luiken, J. J. (2012). CD36 inhibition prevents lipid accumulation and contractile dysfunction in rat cardiomyocytes. Biochem. J. 448, 43–53.
| CD36 inhibition prevents lipid accumulation and contractile dysfunction in rat cardiomyocytes.Crossref | GoogleScholarGoogle Scholar | 22780108PubMed |
Barnes, R. B., Rosenfield, R. L., Namnoum, A., and Layman, L. C. (2000). Effect of follicle-stimulating hormone on ovarian androgen production in a woman with isolated follicle-stimulating hormone deficiency. N. Engl. J. Med. 343, 1197–1198.
| Effect of follicle-stimulating hormone on ovarian androgen production in a woman with isolated follicle-stimulating hormone deficiency.Crossref | GoogleScholarGoogle Scholar | 11041762PubMed |
Bolúmar, F., Olsen, J., Rebagliato, M., Sáez-Lloret, I., Bisanti, L., the European Study Group on Infertility and Subfecundity (2000). Body mass index and delayed conception: a European Multicenter Study on Infertility and Subfecundity. Am. J. Epidemiol. 151, 1072–1079.
| Body mass index and delayed conception: a European Multicenter Study on Infertility and Subfecundity.Crossref | GoogleScholarGoogle Scholar | 10873131PubMed |
Boots, C., and Stephenson, M. D. (2011). Does obesity increase the risk of miscarriage in spontaneous conception: a systematic review. Semin. Reprod. Med. 29, 507–513.
| Does obesity increase the risk of miscarriage in spontaneous conception: a systematic review.Crossref | GoogleScholarGoogle Scholar | 22161463PubMed |
Borgbo, T., Povlsen, B. B., Andersen, C. Y., Borup, R., Humaidan, P., and Grondahl, M. L. (2013). Comparison of gene expression profiles in granulosa and cumulus cells after ovulation induction with either human chorionic gonadotropin or a gonadotropin-releasing hormone agonist trigger. Fertil. Steril. 100, 994–1001.e2.
| Comparison of gene expression profiles in granulosa and cumulus cells after ovulation induction with either human chorionic gonadotropin or a gonadotropin-releasing hormone agonist trigger.Crossref | GoogleScholarGoogle Scholar | 23856575PubMed |
Buccione, R., Schroeder, A. C., and Eppig, J. J. (1990). Interactions between somatic cells and germ cells throughout mammalian oogenesis. Biol. Reprod. 43, 543–547.
| Interactions between somatic cells and germ cells throughout mammalian oogenesis.Crossref | GoogleScholarGoogle Scholar | 2289008PubMed |
Chin, K. V., Seifer, D. B., Feng, B., Lin, Y., and Shih, W. C. (2002). DNA microarray analysis of the expression profiles of luteinized granulosa cells as a function of ovarian reserve. Fertil. Steril. 77, 1214–1218.
| DNA microarray analysis of the expression profiles of luteinized granulosa cells as a function of ovarian reserve.Crossref | GoogleScholarGoogle Scholar | 12057731PubMed |
Das, M., Djahanbakhch, O., Hacihanefioglu, B., Saridogan, E., Ikram, M., Ghali, L., Raveendran, M., and Storey, A. (2008). Granulosa cell survival and proliferation are altered in polycystic ovary syndrome. J. Clin. Endocrinol. Metab. 93, 881–887.
| Granulosa cell survival and proliferation are altered in polycystic ovary syndrome.Crossref | GoogleScholarGoogle Scholar | 18073308PubMed |
Diamanti-Kandarakis, E., and Dunaif, A. (1996). New perspectives in polycystic ovary syndrome. Trends Endocrinol. Metab. 7, 267–271.
| New perspectives in polycystic ovary syndrome.Crossref | GoogleScholarGoogle Scholar | 18406758PubMed |
Eisen, M. B., Spellman, P. T., Brown, P. O., and Botstein, D. (1998). Cluster analysis and display of genome-wide expression patterns. Proc. Natl Acad. Sci. USA 95, 14863–14868.
| Cluster analysis and display of genome-wide expression patterns.Crossref | GoogleScholarGoogle Scholar | 9843981PubMed |
Febbraio, M., Hajjar, D. P., and Silverstein, R. L. (2001). CD36: a class B scavenger receptor involved in angiogenesis, atherosclerosis, inflammation, and lipid metabolism. J. Clin. Invest. 108, 785–791.
| CD36: a class B scavenger receptor involved in angiogenesis, atherosclerosis, inflammation, and lipid metabolism.Crossref | GoogleScholarGoogle Scholar | 11560944PubMed |
Gil-Campos, M., Canete, R. R., and Gil, A. (2004). Adiponectin, the missing link in insulin resistance and obesity. Clin. Nutr. 23, 963–974.
| Adiponectin, the missing link in insulin resistance and obesity.Crossref | GoogleScholarGoogle Scholar | 15380884PubMed |
Grøndahl, M. L., Borup, R., Lee, Y. B., Myrhøj, V., Meinertz, H., and Sørensen, S. (2009). Differences in gene expression of granulosa cells from women undergoing controlled ovarian hyperstimulation with either recombinant follicle-stimulating hormone or highly purified human menopausal gonadotropin. Fertil. Steril. 91, 1820–1830.
| Differences in gene expression of granulosa cells from women undergoing controlled ovarian hyperstimulation with either recombinant follicle-stimulating hormone or highly purified human menopausal gonadotropin.Crossref | GoogleScholarGoogle Scholar | 18439596PubMed |
Habets, D. D., Coumans, W. A., Voshol, P. J., den Boer, M. A., Febbraio, M., Bonen, A., Glatz, J. F., and Luiken, J. J. (2007). AMPK-mediated increase in myocardial long-chain fatty acid uptake critically depends on sarcolemmal CD36. Biochem. Biophys. Res. Commun. 355, 204–210.
| AMPK-mediated increase in myocardial long-chain fatty acid uptake critically depends on sarcolemmal CD36.Crossref | GoogleScholarGoogle Scholar | 17292863PubMed |
Haslam, D. W., and James, W. P. (2005). Obesity. Lancet 366, 1197–1209.
| Obesity.Crossref | GoogleScholarGoogle Scholar | 16198769PubMed |
Hedley, A. A., Ogden, C. L., Johnson, C. L., Carroll, M. D., Curtin, L. R., and Flegal, K. M. (2004). Prevalence of overweight and obesity among US children, adolescents, and adults, 1999–2002. JAMA 291, 2847–2850.
| Prevalence of overweight and obesity among US children, adolescents, and adults, 1999–2002.Crossref | GoogleScholarGoogle Scholar | 15199035PubMed |
Health Industry Standard of the People’s Republic of China (2013). Criteria of weight for adults. Available at http://www.moh.gov.cn/ewebeditor/uploadfile/2013/08/20130808135715967 [verified 13 February 2019]. [In Chinese]
Homburg, R., and Crawford, G. (2014). The role of AMH in anovulation associated with PCOS: a hypothesis. Hum. Reprod. 29, 1117–1121.
| The role of AMH in anovulation associated with PCOS: a hypothesis.Crossref | GoogleScholarGoogle Scholar | 24770999PubMed |
Homburg, R., Ray, A., Bhide, P., Gudi, A., Shah, A., Timms, P., and Grayson, K. (2013). The relationship of serum anti-Mullerian hormone with polycystic ovarian morphology and polycystic ovary syndrome: a prospective cohort study. Hum. Reprod. 28, 1077–1083.
| The relationship of serum anti-Mullerian hormone with polycystic ovarian morphology and polycystic ovary syndrome: a prospective cohort study.Crossref | GoogleScholarGoogle Scholar | 23377771PubMed |
Jungheim, E. S., Lanzendorf, S. E., Odem, R. R., Moley, K. H., Chang, A. S., and Ratts, V. S. (2009). Morbid obesity is associated with lower clinical pregnancy rates after in vitro fertilization in women with polycystic ovary syndrome. Fertil. Steril. 92, 256–261.
| Morbid obesity is associated with lower clinical pregnancy rates after in vitro fertilization in women with polycystic ovary syndrome.Crossref | GoogleScholarGoogle Scholar | 18692801PubMed |
Kenigsberg, S., Bentov, Y., Chalifa-Caspi, V., Potashnik, G., Ofir, R., and Birk, O. S. (2009). Gene expression microarray profiles of cumulus cells in lean and overweight–obese polycystic ovary syndrome patients. Mol. Hum. Reprod. 15, 89–103.
| Gene expression microarray profiles of cumulus cells in lean and overweight–obese polycystic ovary syndrome patients.Crossref | GoogleScholarGoogle Scholar | 19141487PubMed |
Lan, C. W., Chen, M. J., Tai, K. Y., Yu, D. C., Yang, Y. C., Jan, P. S., Yang, Y. S., Chen, H. F., and Ho, H. N. (2015). Functional microarray analysis of differentially expressed genes in granulosa cells from women with polycystic ovary syndrome related to MAPK/ERK signaling. Sci. Rep. 5, 14994.
| Functional microarray analysis of differentially expressed genes in granulosa cells from women with polycystic ovary syndrome related to MAPK/ERK signaling.Crossref | GoogleScholarGoogle Scholar | 26459919PubMed |
Lash, M. M., and Armstrong, A. (2009). Impact of obesity on women’s health. Fertil. Steril. 91, 1712–1716.
| Impact of obesity on women’s health.Crossref | GoogleScholarGoogle Scholar | 18410940PubMed |
Linné, Y. (2004). Effects of obesity on women’s reproduction and complications during pregnancy. Obes. Rev. 5, 137–143.
| Effects of obesity on women’s reproduction and complications during pregnancy.Crossref | GoogleScholarGoogle Scholar | 15245382PubMed |
Metwally, M., Cutting, R., Tipton, A., Skull, J., Ledger, W. L., and Li, T. C. (2007a). Effect of increased body mass index on oocyte and embryo quality in IVF patients. Reprod. Biomed. Online 15, 532–538.
| Effect of increased body mass index on oocyte and embryo quality in IVF patients.Crossref | GoogleScholarGoogle Scholar | 18044034PubMed |
Metwally, M., Li, T. C., and Ledger, W. L. (2007b). The impact of obesity on female reproductive function. Obes. Rev. 8, 515–523.
| The impact of obesity on female reproductive function.Crossref | GoogleScholarGoogle Scholar | 17868286PubMed |
Morales, A. J., Laughlin, G. A., Butzow, T., Maheshwari, H., Baumann, G., and Yen, S. S. (1996). Insulin, somatotropic, and luteinizing hormone axes in lean and obese women with polycystic ovary syndrome: common and distinct features. J. Clin. Endocrinol. Metab. 81, 2854–2864.
| 8768842PubMed |
Norman, R. J., Noakes, M., Wu, R., Davies, M. J., Moran, L., and Wang, J. X. (2004). Improving reproductive performance in overweight/obese women with effective weight management. Hum. Reprod. Update 10, 267–280.
| Improving reproductive performance in overweight/obese women with effective weight management.Crossref | GoogleScholarGoogle Scholar | 15140873PubMed |
Ozgun, M. T., Uludag, S., Oner, G., Batukan, C., Aygen, E. M., and Sahin, Y. (2011). The influence of obesity on ICSI outcomes in women with polycystic ovary syndrome. J. Obstet. Gynaecol. 31, 245–249.
| The influence of obesity on ICSI outcomes in women with polycystic ovary syndrome.Crossref | GoogleScholarGoogle Scholar | 21417650PubMed |
Rittenberg, V., Seshadri, S., Sunkara, S. K., Sobaleva, S., Oteng-Ntim, E., and El-Toukhy, T. (2011). Effect of body mass index on IVF treatment outcome: an updated systematic review and meta-analysis. Reprod. Biomed. Online 23, 421–439.
| Effect of body mass index on IVF treatment outcome: an updated systematic review and meta-analysis.Crossref | GoogleScholarGoogle Scholar | 21885344PubMed |
Rotterdam ESHRE/ASRM-Sponsored PCOS Consensus Workshop Group (2004). Revised 2003 consensus on diagnostic criteria and long-term health risks related to polycystic ovary syndrome (PCOS). Hum. Reprod. 19, 41–47.
| Revised 2003 consensus on diagnostic criteria and long-term health risks related to polycystic ovary syndrome (PCOS).Crossref | GoogleScholarGoogle Scholar | 14688154PubMed |
Schube, U., Nowicki, M., Jogschies, P., Blumenauer, V., Bechmann, I., and Serke, H. (2014). Resveratrol and desferoxamine protect human OxLDL-treated granulosa cell subtypes from degeneration. J. Clin. Endocrinol. Metab. 99, 229–239.
| Resveratrol and desferoxamine protect human OxLDL-treated granulosa cell subtypes from degeneration.Crossref | GoogleScholarGoogle Scholar | 24170104PubMed |
Tian, Y., Jiang, C., Wang, M., Cai, R., Zhang, Y., He, Z., Wang, H., Wu, D., Wang, F., Liu, X., et al. (2016). BMI, leisure-time physical activity, and physical fitness in adults in China: results from a series of national surveys, 2000–14. Lancet Diabetes Endocrinol. 4, 487–497.
| BMI, leisure-time physical activity, and physical fitness in adults in China: results from a series of national surveys, 2000–14.Crossref | GoogleScholarGoogle Scholar | 27133172PubMed |
Tusher, V. G., Tibshirani, R., and Chu, G. (2001). Significance analysis of microarrays applied to the ionizing radiation response. Proc. Natl Acad. Sci. USA 98, 5116–5121.
| Significance analysis of microarrays applied to the ionizing radiation response.Crossref | GoogleScholarGoogle Scholar | 11309499PubMed |
Valckx, S. D., Arias-Alvarez, M., De Pauw, I., Fievez, V., Vlaeminck, B., Fransen, E., Bols, P. E., and Leroy, J. L. (2014). Fatty acid composition of the follicular fluid of normal weight, overweight and obese women undergoing assisted reproductive treatment: a descriptive cross-sectional study. Reprod. Biol. Endocrinol. 12, 13.
| Fatty acid composition of the follicular fluid of normal weight, overweight and obese women undergoing assisted reproductive treatment: a descriptive cross-sectional study.Crossref | GoogleScholarGoogle Scholar | 24498875PubMed |
van‘t Erve, T. J., Lih, F. B., Kadiiska, M. B., Deterding, L. J., Eling, T. E., and Mason, R. P. (2015). Reinterpreting the best biomarker of oxidative stress: the 8-iso-PGF2α/PGF2α ratio distinguishes chemical from enzymatic lipid peroxidation. Free Radic. Biol. Med. 83, 245–251.
| Reinterpreting the best biomarker of oxidative stress: the 8-iso-PGF2α/PGF2α ratio distinguishes chemical from enzymatic lipid peroxidation.Crossref | GoogleScholarGoogle Scholar |
World Health Organization (WHO) (2000). Obesity: preventing and managing the global epidemic. Report of a WHO Consultation (WHO Technical Report Series 894). Available at https://www.who.int/nutrition/publications/obesity/WHO_TRS_894/en/ [verified 4 February 2019].
Wise, L. A., Rothman, K. J., Mikkelsen, E. M., Sorensen, H. T., Riis, A., and Hatch, E. E. (2010). An Internet-based prospective study of body size and time-to-pregnancy. Hum. Reprod. 25, 253–264.
| An Internet-based prospective study of body size and time-to-pregnancy.Crossref | GoogleScholarGoogle Scholar | 19828554PubMed |
Wu, X. Q., Wang, Y. Q., Xu, S. M., Liu, J. F., Bi, X. Y., Wang, Z. Q., and Zhang, J. P. (2017). The WNT/beta-catenin signaling pathway may be involved in granulosa cell apoptosis from patients with PCOS in North China. J. Gynecol. Obstet. Hum. Reprod. 46, 93–99.
| The WNT/beta-catenin signaling pathway may be involved in granulosa cell apoptosis from patients with PCOS in North China.Crossref | GoogleScholarGoogle Scholar | 28403963PubMed |
Yang, X., Wu, L. L., Chura, L. R., Liang, X., Lane, M., Norman, R. J., and Robker, R. L. (2012). Exposure to lipid-rich follicular fluid is associated with endoplasmic reticulum stress and impaired oocyte maturation in cumulus–oocyte complexes. Fertil. Steril. 97, 1438–1443.
| Exposure to lipid-rich follicular fluid is associated with endoplasmic reticulum stress and impaired oocyte maturation in cumulus–oocyte complexes.Crossref | GoogleScholarGoogle Scholar | 22440252PubMed |
* These authors contributed equally to this work.