Association between uric acid to high-density lipoprotein cholesterol ratio and infertility risk: evidence from a cross-sectional study
Huijuan Ni A and Cuiping Cao A *
A *
A
Abstract
This study explores the relationship between uric acid to high-density lipoprotein cholesterol ratio (UHR) and female infertility using data from 5814 participants in the National Health and Nutrition Examination Survey database. Multivariable logistic regression models were used to assess the association while adjusting for potential confounders. The findings revealed a significant positive correlation between UHR and infertility risk, suggesting that higher UHR levels may contribute to an increased likelihood of infertility. A dose-response relationship was observed, further supporting the robustness of the association. Additionally, subgroup analyses were conducted to examine potential heterogeneity across different populations, and the results remained consistent, reinforcing the reliability of our conclusions. While the study provides valuable insights into the potential role of UHR in female reproductive health, the cross-sectional design limits causal inference. Future longitudinal studies are needed to confirm these findings and explore the underlying mechanisms.
Keywords: cross-sectional study, dose-response relationship, infertility risk, logistic regression analysis, metabolic dysfunction, NHANES database, subgroup analysis, uric acid to high-density lipoprotein cholesterol ratio (UHR).
Infertility is a prevalent and multifaceted health issue that affects millions of women worldwide. It is defined as the inability to conceive after 12 months of regular, unprotected sexual intercourse.1 In the USA, approximately 7% to 15.5% of women of reproductive age experience infertility.2,3 This condition is influenced by various factors, including advancing age, hormonal imbalances, metabolic disorders, and environmental exposures.4–6 Beyond its profound physical and emotional toll, infertility poses significant societal and economic challenges. Identifying and understanding the underlying risk factors are essential for developing effective prevention and treatment strategies.
The uric acid to high-density lipoprotein cholesterol ratio (UHR) has recently emerged as a novel biomarker for evaluating metabolic function and inflammatory status. Elevated uric acid levels are associated with oxidative stress, inflammation, and endothelial dysfunction,7,8 while reduced levels of high-density lipoprotein cholesterol may impair lipid transport and vascular health. Recent studies have identified UHR as a predictive indicator for conditions such as type 2 diabetes, metabolic syndrome, coronary artery disease, and hypertension.9–12 This study aims to explore the relationship between UHR and the risk of infertility, providing insights into its clinical significance for women’s reproductive health.
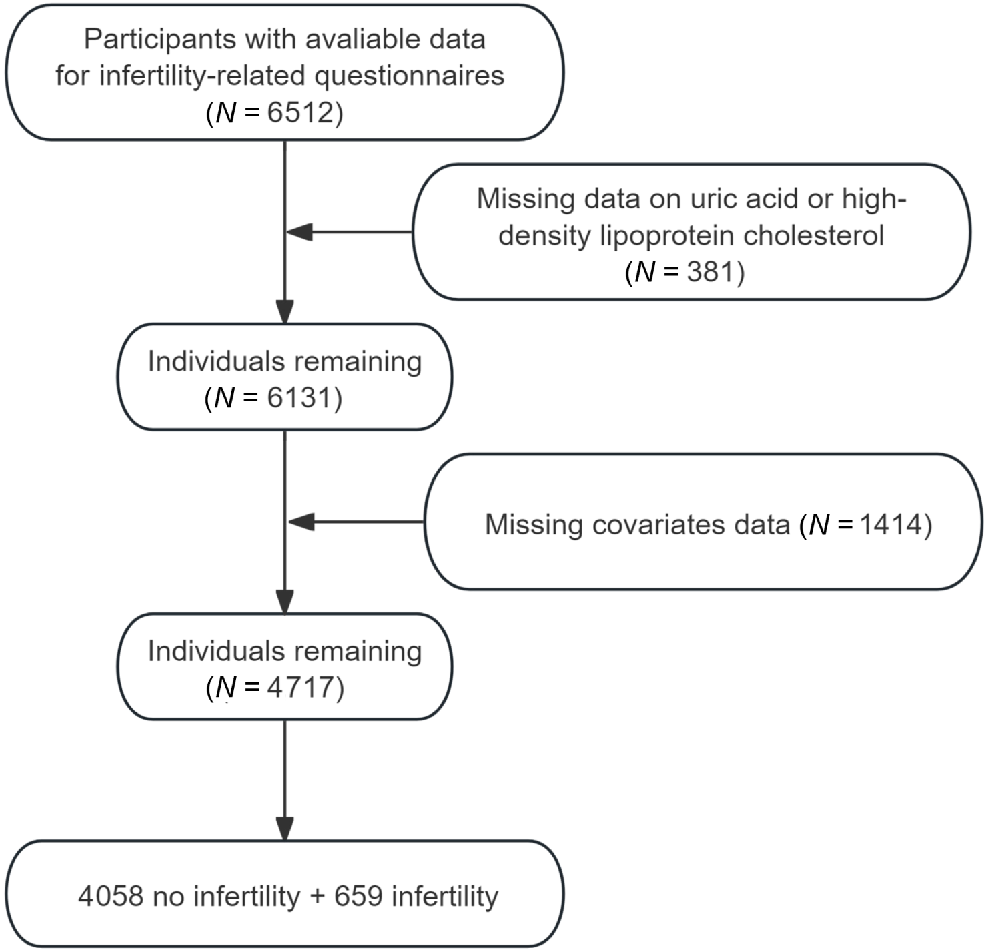
This study included a total of 4717 participants from the National Health and Nutrition Examination Survey (NHANES) database between 2013 and 2020. Fig. 1 illustrates the participant selection process. The definition of infertility in this study is consistent with that used in previous studies published utilizing the NHANES dataset.5Table 1 provides a detailed summary of the baseline characteristics of the participants, divided into the infertility group (n = 659) and the non-infertility group (n = 4058). The mean age of participants in the infertility group was significantly higher (42.29 years) compared with the non-infertility group (39.49 years, P < 0.0001). In terms of racial composition, White participants were the majority in both groups; however, the proportion was higher in the infertility group (68.21% vs 62.03%). Additionally, significant differences were observed between the groups regarding marital status, body mass index (BMI), poverty income ratio, and the prevalence of hypertension and diabetes. Overall, the infertility group was characterized by older age, a higher prevalence of overweight individuals, and an increased rate of hypertension and diabetes.
| Characteristic | Total | Non- infertility | Infertility | P-value | |
|---|---|---|---|---|---|
| (N = 4717) | (N = 4058) | (N = 659) | |||
| Age, years, mean (s.d.) | 39.91 (0.29) | 39.49 (0.30) | 42.29 (0.57) | <0.0001 | |
| Race, n (%) | 0.02 | ||||
| White | 1665 (62.98) | 1399 (62.03) | 266 (68.21) | ||
| Black | 1068 (11.81) | 922 (11.87) | 146 (11.46) | ||
| Mexican | 724 (9.61) | 641 (9.93) | 83 (7.89) | ||
| Other | 1260 (15.60) | 1096 (16.17) | 164 (12.45) | ||
| Marital status, n (%) | <0.0001 | ||||
| Married/living with partner | 2708 (62.16) | 2243 (59.67) | 465 (75.98) | ||
| Single/divorced/widowed | 2009 (37.84) | 1815 (40.33) | 194 (24.02) | ||
| Education level, n (%) | 0.14 | ||||
| Less than high school | 697 (9.97) | 620 (10.44) | 77 (7.37) | ||
| High school or equivalent | 944 (19.42) | 814 (19.56) | 130 (18.65) | ||
| College or above | 3076 (70.61) | 2624 (70.00) | 452 (73.99) | ||
| BMI, n (%) | <0.001 | ||||
| Under/normal weight (<25.00) | 1441 (33.23) | 1263 (34.09) | 178 (28.42) | ||
| Overweight (25–29.99) | 2115 (41.66) | 1763 (39.79) | 352 (52.05) | ||
| Obese (≥30.00) | 1161 (25.11) | 1032 (26.11) | 129 (19.53) | ||
| Poverty income ratio, n (%) | 0.01 | ||||
| ≤1.0 | 1522 (22.94) | 1347 (23.85) | 175 (17.84) | ||
| 1.0–4.0 | 1718 (34.36) | 1472 (33.98) | 246 (36.48) | ||
| ≥4.0 | 1477 (42.70) | 1239 (42.16) | 238 (45.68) | ||
| Recreational activity, n (%) | 0.39 | ||||
| No activity | 2242 (41.31) | 1912 (40.76) | 330 (44.36) | ||
| Moderate | 1223 (28.00) | 1042 (28.35) | 181 (26.04) | ||
| Vigorous | 1252 (30.69) | 1104 (30.89) | 148 (29.60) | ||
| Smoking status, n (%) | 0.68 | ||||
| Never | 3169 (64.17) | 2743 (64.20) | 426 (64.01) | ||
| Former | 657 (16.51) | 557 (16.31) | 100 (17.64) | ||
| Now | 891 (19.32) | 758 (19.50) | 133 (18.35) | ||
| Drinking status, n (%) | 0.21 | ||||
| Never | 746 (12.05) | 659 (12.30) | 87 (10.65) | ||
| Former | 318 (6.52) | 261 (6.24) | 57 (8.08) | ||
| Now | 3653 (81.43) | 3138 (81.46) | 515 (81.27) | ||
| Diabetes, n (%) | 0.04 | ||||
| No | 4125 (90.15) | 3561 (90.67) | 564 (87.29) | ||
| Yes | 592 (9.85) | 497 (9.33) | 95 (12.71) | ||
| Hypertension, n (%) | <0.0001 | ||||
| No | 3394 (75.04) | 2961 (76.57) | 433 (66.52) | ||
| Yes | 1323 (24.96) | 1097 (23.43) | 226 (33.48) | ||
| CVD, n (%) | 0.55 | ||||
| No | 4520 (96.43) | 3886 (96.50) | 634 (96.01) | ||
| Yes | 197 (3.57) | 172 (3.50) | 25 (3.99) | ||
| Age of menarche, year (%) | 0.45 | ||||
| <12 | 1142 (22.96) | 981 (23.31) | 161 (21.00) | ||
| 12–15 | 320 (6.36) | 277 (6.15) | 43 (7.48) | ||
| ≥15 | 3255 (70.68) | 2800 (70.53) | 455 (71.52) | ||
BMI, body mass index; CVD, cardiovascular disease.
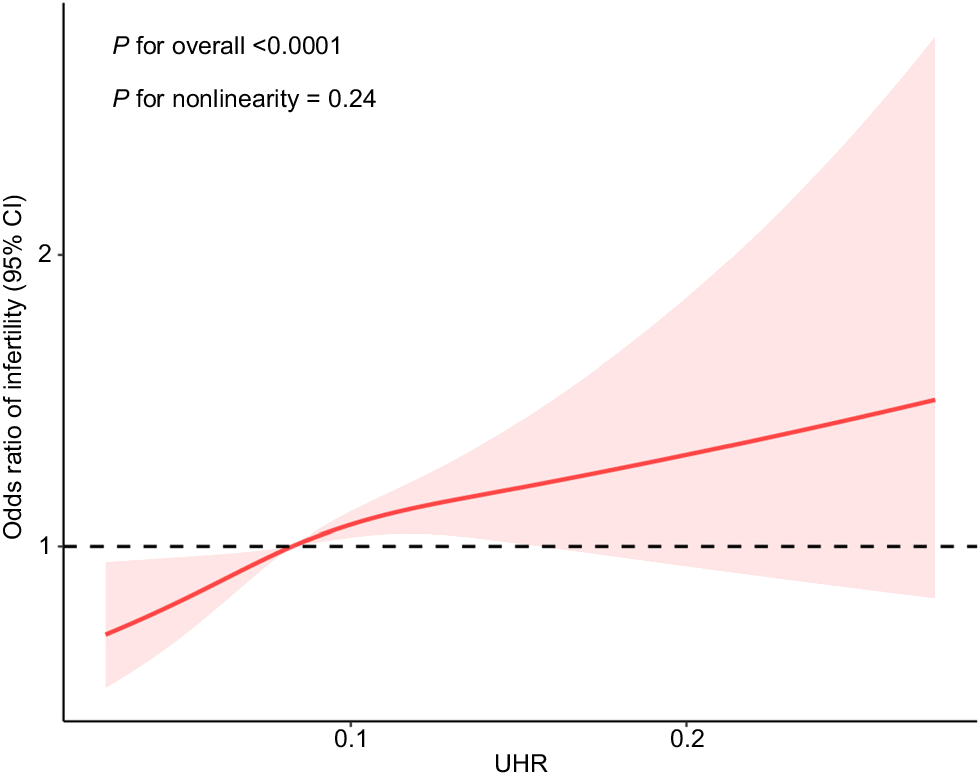
Table 2 presents the weighted logistic regression analysis exploring the relationship between UHR and infertility. Participants were stratified into quartiles based on UHR levels, with Quartile 1 serving as the reference group. In the unadjusted model (Model 1), participants in Quartile 4 (OR: 1.48, 95% CI: 1.04–2.12, P = 0.02) exhibited significantly higher odds of infertility compared to those in Quartile 1. After adjusting for age and race in Model 2, this association remained significant for Quartile 4 (OR: 1.52, 95% CI: 1.08–2.15, P = 0.02), but not for Quartile 3 (OR: 1.39, 95% CI: 1.05–2.02, P = 0.04). Further adjustments in Model 3, which accounted for socioeconomic and lifestyle factors such as marital status, educational attainment, poverty income ratio, recreational activity, smoking status, and alcohol consumption, yielded consistent results. In the fully adjusted Model 4, which additionally controlled for hypertension, diabetes, cardiovascular disease, and age at menarche, the odds ratios for infertility were 1.50 (95% CI: 1.06–2.12, P = 0.02) for Quartile 3 and 1.48 (95% CI: 1.04–2.10, P = 0.03) for Quartile 4, compared to Quartile 1. A clear dose-response relationship was observed across quartiles, with P for trend <0.0001 in all models. The dose-response relationship between UHR and infertility was further examined using restricted cubic spline regression (Fig. 2), with comprehensive adjustment for confounding factors (Model 4). A positive, linear association was observed, indicating that infertility risk increases significantly with rising UHR levels (P for overall <0.0001).
| Model 1 | P-value | Model 2 | P-value | Model 3 | P-value | Model 4 | P-value | ||
|---|---|---|---|---|---|---|---|---|---|
| OR (95% CI) | OR (95% CI) | OR (95% CI) | OR (95% CI) | ||||||
| Stratified by UHR quartiles | |||||||||
| Quartile 1 | 1 | 1 | 1 | 1 | |||||
| Quartile 2 | 1.12 (0.81, 1.54) | 0.49 | 1.17 (0.86, 1.59) | 0.31 | 1.22 (0.90, 1.65) | 0.19 | 1.19 (0.88, 1.62) | 0.25 | |
| Quartile 3 | 1.34 (0.91, 1.97) | 0.13 | 1.39 (1.05, 2.02) | 0.04 | 1.50 (1.04, 2.16) | 0.03 | 1.43 (1.09, 2.08) | 0.04 | |
| Quartile 4 | 1.48 (1.04, 2.12) | 0.02 | 1.52 (1.08, 2.15) | 0.02 | 1.62 (1.15, 2.28) | 0.01 | 1.48 (1.04, 2.10) | 0.03 | |
| P for trend | <0.0001 | <0.0001 | <0.0001 | <0.0001 | |||||
Model 1, unadjusted; Model 2, adjusted for age and race; Model 3, adjusted for age, race, marital status, education level, poverty income ratio, recreational activity, smoking status, and drinking status; Model 4, further adjusted for hypertension, diabete, CVD as well as age of menarche.
Dose-response relationship analysis between UHR and infertility. Restricted cubic spline regression was adjusted for age, race, marital status, education level, poverty income ratio, recreational activity, smoking status, drinking status, hypertension, diabetes, CVD, and age of menarche (Model 4). The red solid line represents ORs, red shaded region represents 95% CI.

The results of the subgroup analysis indicate that the association between UHR and the risk of infertility remained consistent across different age, race, BMI, and age at menarche subgroups (all P for interaction >0.05) (Table 3).
| UHR | Infertility | |||||
|---|---|---|---|---|---|---|
| Quartile 1 | Quartile 2 | Quartile 3 | Quartile 4 | P for interaction | ||
| Subgroups | OR (95% CI) | OR (95% CI) | OR (95% CI) | OR (95% CI) | ||
| Age (years) | 0.06 | |||||
| 20–39 | Reference | 1.32 (0.87, 2.00) | 1.26 (0.77, 2.06) | 1.61 (0.98, 2.64) | ||
| 40–59 | Reference | 1.23 (0.74, 2.05) | 1.41 (0.79, 2.53) | 1.13 (0.65, 1.95) | ||
| Race | 0.53 | |||||
| White | Reference | 0.98 (0.64, 1.51) | 1.15 (0.63, 2.12) | 1.04 (0.58, 1.85) | ||
| Black | Reference | 2.34 (1.23, 4.45) | 1.46 (0.74, 2.85) | 2.00 (0.96, 4.13) | ||
| Mexican | Reference | 1.71 (0.62, 4.74) | 1.79 (0.59, 5.48) | 2.72 (0.87, 8.50) | ||
| Other | Reference | 1.53 (0.84, 2.78) | 1.82 (1.09, 3.04) | 1.25 (0.72, 2.17) | ||
| BMI | 0.65 | |||||
| Under/normalweight(<25.00) | Reference | 1.22 (0.81, 1.83) | 1.67 (0.77, 3.61) | 1.20 (0.43, 3.35) | ||
| Overweight(25– 29.99) | Reference | 0.75 (0.38, 1.49) | 0.91 (0.44, 1.89) | 1.11 (0.49, 2.52) | ||
| Obese(≥30.00) | Reference | 1.79 (0.80, 4.01) | 1.56 (0.76, 3.18) | 1.49 (0.81, 2.76) | ||
| Age of menarche, year | 0.54 | |||||
| <12 | Reference | 0.94 (0.48, 1.82) | 1.02 (0.51, 2.06) | 1.24 (0.63, 2.48) | ||
| 12–15 | Reference | 1.32 (0.91, 1.91) | 1.42 (0.86, 2.36) | 1.20 (0.73, 1.99) | ||
| ≥15 | Reference | 0.48 (0.11, 2.17) | 1.03 (0.40, 2.66) | 2.83 (0.60, 13.47) | ||
Analyses were adjusted for age, race, marital status, education level, poverty income ratio, recreational activity, smoking status, drinking status, hypertension, diabetes, CVD, and age of menarche.
In conclusion, this study establishes a significant positive association between the UHR and infertility risk. Utilizing a large, nationally representative cohort from the NHANES database, we identified a clear dose-response relationship, where higher UHR levels were consistently linked to an increased risk of infertility. These findings highlight the potential of UHR as a valuable biomarker for identifying women at elevated risk of infertility, offering opportunities for early detection and targeted interventions. However, as a cross-sectional study, our findings cannot establish causality, limiting the ability to determine the temporal relationship between UHR and infertility. Future research should focus on elucidating the underlying mechanisms connecting metabolic dysregulation to reproductive health and assessing the clinical utility of UHR in the management and prevention of infertility.
Ethics approval
The NHANES protocol received approval from the National Center for Health Statistics Study’s Committee on Ethical Review.
Data availability
The datasets analyzed during the current study are available in the NHANES database (https://www.cdc.gov/nchs/nhanes/).
Author contributions
Huijuan Ni: conceptualization, review, data analysis, and writing; Cuiping Cao: review, conceptualization, and methodology.
References
1 Habbema JDF, Collins J, Leridon H, Evers JLH, Lunenfeld B, te Velde ER. Towards less confusing terminology in reproductive medicine: a proposal. Hum Reprod 2004; 19(7): 1497-1501.
| Crossref | Google Scholar | PubMed |
2 Ding C, Shi Y, Li J, et al. Association of weight-adjusted-waist index with all-cause and cardiovascular mortality in China: a prospective cohort study. Nutr Metab Cardiovasc Dis 2022; 32(5): 1210-1217.
| Crossref | Google Scholar | PubMed |
3 Gesink Law DC, Maclehose RF, Longnecker MP. Obesity and time to pregnancy. Hum Reprod 2007; 22(2): 414-420.
| Crossref | Google Scholar | PubMed |
4 Kathrins M, Niederberger C. Diagnosis and treatment of infertility-related male hormonal dysfunction. Nat Rev Urol 2016; 13(6): 309-323.
| Crossref | Google Scholar | PubMed |
5 Xia W, Cai Y, Zhang S, Wu S. Association between different insulin resistance surrogates and infertility in reproductive-aged females. BMC Public Health 2023; 23(1): 1985.
| Crossref | Google Scholar |
6 Zhan W, Yang H, Zhang J, Chen Q. Association between co-exposure to phenols and phthalates mixture and infertility risk in women. Environ Res 2022; 215(Pt 1): 114244.
| Crossref | Google Scholar |
7 Gherghina M-E, Peride I, Tiglis M, Neagu TP, Niculae A, Checherita IA. Uric acid and oxidative stress-relationship with cardiovascular, metabolic, and renal impairment. Int J Mol Sci 2022; 23(6): 3188.
| Crossref | Google Scholar |
8 Li D, Yuan S, Deng Y, et al. The dysregulation of immune cells induced by uric acid: mechanisms of inflammation associated with hyperuricemia and its complications. Front Immunol 2023; 14: 1282890.
| Crossref | Google Scholar |
9 Zhou X, Xu J. Association between serum uric acid-to-high-density lipoprotein cholesterol ratio and insulin resistance in an American population: a population-based analysis. J Diabetes Investig 2024; 15(6): 762-771.
| Crossref | Google Scholar | PubMed |
10 Seo Y-J, Shim YS, Lee HS, Hwang JS. Association of serum uric acid Levels with metabolic syndromes in Korean adolescents. Front Endocrinol 2023; 14: 1159248.
| Crossref | Google Scholar |
11 Ding L, Guo H, Zhang C, et al. Serum uric acid to high-density lipoprotein cholesterol ratio is a predictor for all-cause and cardiovascular disease mortality in patients with diabetes: evidence from NHANES 2005-2018. Nutr Metab Cardiovasc Dis 2024; 34(11): 2480-2488.
| Crossref | Google Scholar | PubMed |
12 Han X, Tan X, Liu M, et al. Association between serum uric acid/high-density lipoprotein cholesterol ratio and hypertension among reproductive-aged women. J Health Popul Nutr 2023; 42(1): 123.
| Crossref | Google Scholar |


