What is the ‘appropriate’ fuel management regime for the Otway Ranges, Victoria, Australia? Developing a long-term fuel management strategy using the structured decision-making framework
Tim Gazzard A E , Terry Walshe B , Peter Galvin A , Owen Salkin C , Michael Baker A , Bec Cross A and Peter Ashton DA Department of Environment, Land, Water and Planning, 83–85 Gellibrand Street, Colac, Vic. 3250, Australia.
B University of Melbourne, School of Biosciences, Melbourne, Vic. 3010, Australia.
C Natural Systems Analytics, PO Box 87, Noojee, Vic. 3833, Australia.
D Surf Coast Shire, PO Box 350, Torquay, Vic. 3228, Australia.
E Corresponding author. Email: tim.gazzard@delwp.vic.gov.au
International Journal of Wildland Fire 29(5) 354-370 https://doi.org/10.1071/WF18131
Submitted: 8 August 2018 Accepted: 11 July 2019 Published: 10 September 2019
Journal Compilation © IAWF 2020 Open Access CC BY-NC-ND
Abstract
The Otway Ranges contain many of the highest-wildfire-risk communities in Victoria, Australia. One of the chief risk mitigation measures in the Otway Ranges is planned burning. The location and amount of planned burning that is undertaken need to consider stakeholder perspectives that can be largely divergent, invoking difficult trade-offs for land-management agencies. The structured decision-making framework was utilised to select the most ‘appropriate’ 40-year cross-tenure fuel management strategy for the Otway Ranges. This paper details the approach undertaken to develop an optimised set of multi-objective fuel management strategies, identify suitable monetary and non-monetary objectives and calculate risk-weighted consequences using a range of modelling techniques. To underpin clarity in trade-offs and decision making, we emphasise the use of natural measures of performance for each candidate strategy against each objective, such as lives lost, species decline and economic losses associated with wildfire. This paper also highlights the role of stakeholder engagement throughout the decision-making process. We discuss the results of the formal trade-off process that was completed using an additive multi-objective value model to identify a preferred fuel management strategy for the Otway Ranges. The preferred strategy is currently used by local management agencies to guide operational planning and delivery.
Additional keywords: decision analysis, economic valuation, life loss, planned burning, risk.
Introduction
The policy challenge for modern forest and fire managers involves identifying a fire regime that minimises impacts to society. This requires an understanding of outcomes across a wide spectrum of economic, environmental and social values (Venn and Calkin 2011; Driscoll et al. 2016; Rodríguez y Silva and González-Cabán 2016; Bentley and Penman 2017; Thompson et al. 2017).
This makes the evaluation of fire regimes a multiple-objective problem that will typically involve trade-offs across uncertain consequences (Driscoll et al. 2016; Bentley and Penman 2017).
A common approach to solving multi-objective problems is to utilise multicriteria decision analysis (MCDA) (Richards et al. 1999; Failing et al. 2007; Driscoll et al. 2010; Gregory et al. 2012; Vogler et al. 2015; Ager et al. 2016; Driscoll et al. 2016; Fraser et al. 2017). An advantage of the MCDA approach is that single-objective modelling outcomes such as those derived from Bayesian networks (BNs) (e.g. Penman et al. 2011b, 2015; Papakosta et al. 2017) or other single-objective methods can be incorporated into multi-objective frameworks.
A second multi-objective approach that is increasingly being used to evaluate the effectiveness of wildfire management treatments is benefit–cost analysis (Mercer et al. 2007; Butry et al. 2010; Florec et al. 2013; Rodríguez y Silva and González-Cabán 2016). Benefit–cost approaches monetise all objectives to enable benefit–cost ratios to be derived.
Although use of MCDA and benefit–cost analysis approaches potentially provides for robust decision making via considered treatment of trade-offs, on its own it does not guarantee outcomes that are acceptable to diverse interests. Enduring solutions are more likely when managers and stakeholders work through problems together (US National Research Council 1996).
In the environmental sector, the overarching framework of structured decision making (SDM) has been promoted as a useful framework (Marcot et al. 2012; Martinez-Harms et al. 2015) and has progressively been used to navigate difficult problems involving multiple stakeholders (Failing et al. 2007; Gregory and Long 2009; Gregory et al. 2012; Moore and Runge 2012; Garrard et al. 2017).
There are six steps in SDM. Specifically:
-
Specify the decision context
-
Identify fundamental objectives
-
Nominate alternatives
-
Estimate the consequences of alternatives against objectives
-
Articulate trade-offs
-
Implement the best alternative (and monitor and review outcomes).
The SDM framework utilises the strengths of analytical approaches and emphasises stakeholder deliberation in the setting of objectives, design of candidate solutions, and ultimately in the selection of better solutions via articulation of trade-offs (Gregory et al. 2012).
In contrast to benefit–cost analysis, SDM emphasises the use of natural measures that directly relate to objectives. For example, if an objective is to minimise loss of human life, then a natural measure is mortality associated with wildfire. Direct measures make trade-offs more visible and understandable.
Where natural measures are unavailable, constructed scales can be used. Constructed scales enable the inclusion of objectives that are important to stakeholders such as ‘sense of place’ or ‘community support’ (Keeney and Gregory 2005).
The six steps of SDM provide a generic template for approaching problems within which a suite of different analytical tools, such as MCDA and BNs, can be accessed. The combination of analytical rigour and regular stakeholder input helps ensure that outcomes are transparent and repeatable and that competing interests and values are displayed in ways that technical and non-technical stakeholders can understand (Gregory et al. 2012).
The present study aimed to identify a fuel management strategy that maximised outcomes for social, economic and environmental objectives while minimising strategy implementation costs. This paper presents the outcomes of the SDM process used to select the current long-term fuel management strategy for the Otway Ranges in south-west Victoria, Australia.
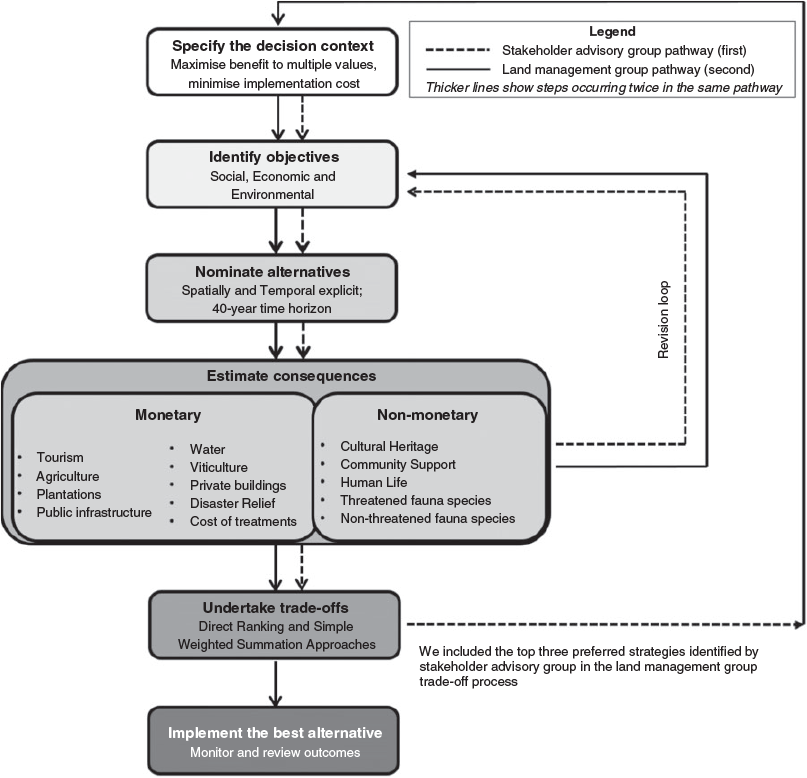
Our approach emphasised local stakeholder involvement in all steps throughout the decision-making process (Fig. 1). Local stakeholders directly contributed to the design of the fuel management strategies, selection of fundamental objectives, completion of values-based judgements for use in the MCDA method and ultimately the selection and adoption of a fuel management strategy.
The alternative candidate strategies varied in the return period of planned burning and the proportion of the landscape treated annually. Evaluation of alternative candidate strategies was undertaken using a range of objectives including loss of human life, fauna species decline, community support, number of towns adversely impacted, cultural heritage impact and economic impacts to a range of local industries and values. Consequences of the strategies were presented based on evaluation of simulated 40-year fire regimes that included planned burning and wildfire. Ultimately, local stakeholders were asked to select their preferred strategies via weighting objectives in an MCDA.
Methods
Study area and fire regime description
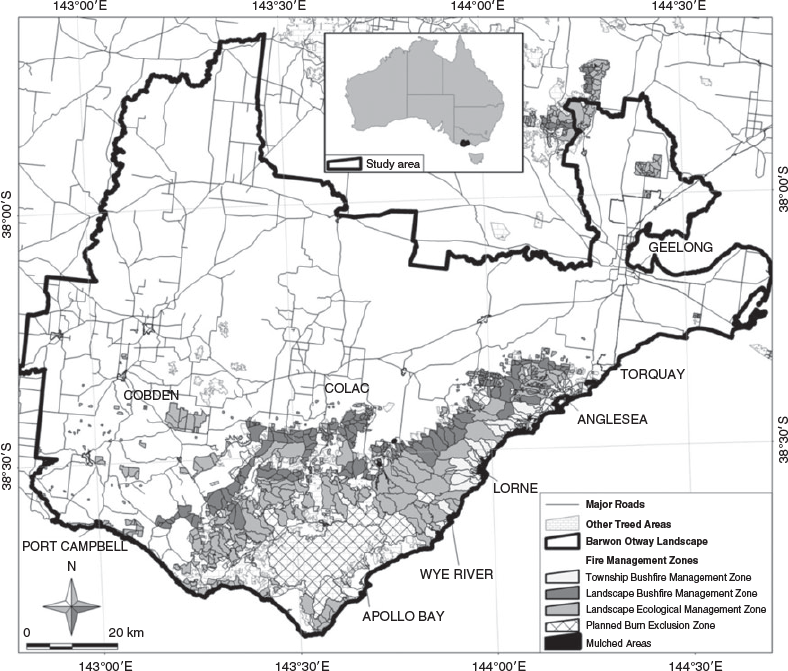
The study area encompassed approximately 1 million ha that includes large tracts of private land used for a diverse range of agricultural purposes. The dominant geographic feature is the Otway Ranges (38°31′S, 143°38′E) (Fig. 2) in the south of the landscape with prominent public forest reserves including the Great Otway National Park, Otway Forest Park, Brisbane Ranges National Park and Port Campbell National Park.
The area has a strong rainfall gradient starting at ~530 mm in the eastern part of the area (Bureau of Meteorology Geelong site no. 087025) through to 1900 mm (Bureau of Meteorology Weeaproinah site no. 090083) along the spine of the Otway Ranges. The variation in rainfall contributes to significant floristic diversity ranging from open heathland and dry forests through to wet forest and small pockets of rainforest in more mountainous areas (State of Victoria 2015a). The Otway Ranges also contain the primary water supply catchments for local towns and regional cities.
Peak human population numbers are up to four times higher over the summer months for many coastal townships, with the iconic Great Ocean Road and surrounding area experiencing up to 5.4 million visitors annually in recent years (State of Victoria 2018a). This presents challenges for fire agencies as many of these townships are surrounded by flammable forests and road access is limited to the Great Ocean Road. The risk to communities is outlined in the current Barwon Otway Bushfire Management Plan, which identifies several coastal towns, including Lorne and Anglesea, as likely to have significant house loss if exposed to catastrophic wildfires. In terms of house loss potential, these towns were ranked in the top four in Victoria (State of Victoria 2015a) with ember attack from high bark loads being a major cause of the potential losses.
Beyond tourism, other industries of note include a diverse agricultural sector consisting primarily of livestock operations and a plantation industry consisting of Eucalyptus globulus and Pinus radiata plantations. Retail, construction and manufacturing industries also make a significant contribution to the regional economy (State of Victoria 2015a).
In the Barwon Otway Bushfire Management Plan area, the fire season extends from October to April, with 69% of fires occurring between December and March and over 95% of destructive fires occurring during this period. On average, there are ~500 grass and forest ignitions per year, with 95% of fires being started by anthropogenic sources (State of Victoria, unpubl. data).
Destructive fires in the study area have been recorded approximately every decade since 1900, with the most notable examples being the Black Friday fire in 1939 (240 000 ha) and 1983 Ash Wednesday fire in the eastern half of the Otway Ranges (42 000 ha, 3 lives and 729 houses lost). More recent examples include the 2015 Wye River Wildfire (~2500 ha, 116 houses lost) and the 2018 Saint Patrick’s Day Fires (~15 000 ha, 24 houses lost) (State of Victoria 2015a, 2018b; Hinchey 2016).
Mapping of planned burning outcomes on public land has systematically occurred since 1980. Rates of burning between 1980 and 2006 achieved on average less than 1000 ha per annum. Since 2007, there has been an increased focus on the application of planned burning to mitigate wildfire risk and to maintain or improve ecosystem resilience (State of Victoria 2015a), with an average of ~4000 ha per annum being treated. The greater focus on township wildfire risk mitigation in the last decade has led to higher areas of private land inclusion in the planned burn program, with up to 10% of the area treated annually being privately owned.
Specify the decision context
Fire management planning in Victoria occurs at state, regional and municipal tiers. It involves bringing together a range of agencies and organisations to discuss, plan and manage fire with the community. Strategic bushfire management planning is guided by two overarching state-wide strategic objectives:
-
To minimise the impact of major bushfires on human life, communities, essential and community infrastructure, industries, the economy and the environment. Human life will be afforded priority over all other considerations.
-
To maintain or improve the resilience of natural ecosystems and their ability to deliver services such as biodiversity, water, carbon storage and forest products.
These two objectives provided the basis for the identification of suitable subregional objectives for inclusion in the study.
This study was implemented in two stages (Fig. 1). Stage one involved the convening of a 22-person stakeholder advisory group consisting of management agency representatives, special interest groups and local community representatives to provide input at each of the first five steps in the SDM framework. This group reflected on a broader range of treatments beyond fuel management, designing alternative treatments that included suppression and patrol effort, building standards applied to the wildland–urban interface properties and burying of powerlines. The top three preferred strategies identified by the stakeholder advisory group were included in the land-management group trade-off process.
Stage two of the study involved 11 local land managers with direct responsibility for maintaining an appropriate fire regime for the study area. The land-management group focused only on alternative treatments related to fuel management. Insights from the advisory group were utilised by a land-management group in stage two. This paper describes the methods and results from the land-management group.
Identify fundamental ends objectives
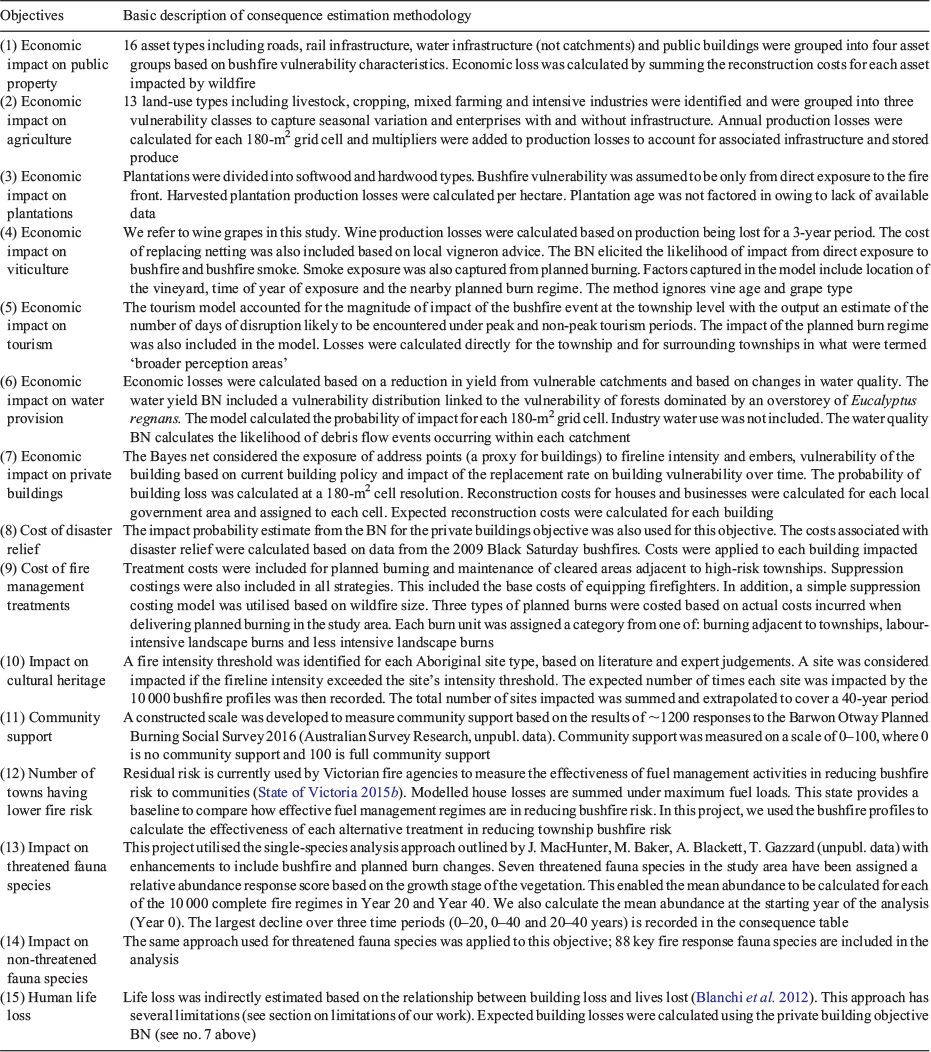
A key step is sorting means and ends objectives. Policy-makers often invoke means objectives, such as minimising fuel loads, or maximising building standards. Underpinning our concern for means objectives are more fundamental ends, such as minimising loss of human life and property. To make trade-offs as clear as possible and to avoid double counting in our evaluation of the merit of alternatives across multiple objectives, we need to include only fundamental ends objectives in our analysis (Keeney and Gregory 2005; Gregory et al. 2012). Building complete lists of objectives that focus on fundamental concerns is surprisingly difficult (Keeney 2007; Bond et al. 2008). We provided a reasonably complete list of fundamental objectives to the stakeholder groups as an initial step using the overarching state-wide strategic objectives as a foundation. The land-management group established nine monetary objectives and six non-monetary objectives (Table 1).
Where possible, we selected performance measures that utilised a natural scale that can be readily interpreted and the causal relationship between the objective and measure is self-evident – for example, the expected number of lives lost or expected dollar cost (Keeney and Gregory 2005; Gregory et al. 2005, 2012).
The community support objective was the exception and utilised a constructed scale (Gregory et al. 2012) between 0 and 100 to express alternative treatment performance. Constructed scales are created to understand the direct impacts of alternatives and are commonly developed for objectives that are difficult to quantify.
The constructed scale for community support allowed us to develop a narrative about community support or resistance to potential strategies, where support includes both active (engaged, participating) and passive (without active resistance) support, and resistance includes disgruntlement through to organised active opposition. For example, on the scale of 0–100, a score of 20 equals ‘There is likely to be active opposition and no active support’ whereas a score of 80 equals ‘Active support from key community members and others, might be slight opposition from fringes, which should be overwhelmed by active support’. Once this scale was developed, community support scores were determined through an online survey that asked participants to select one preferred strategy and identify their preferred strategy elements (e.g. low township impact or low fauna impact).
Nominate alternatives
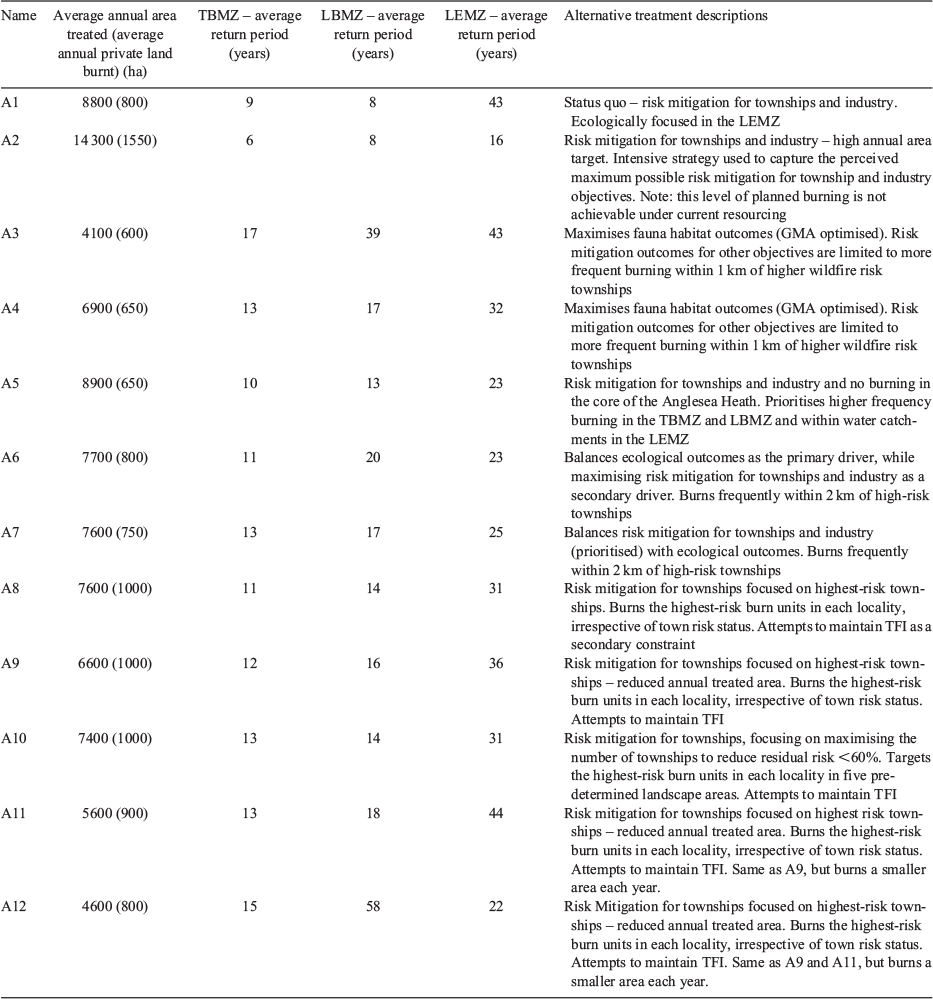
Alternative treatments consisted of spatial and temporal variations of planned burning over a 40-year period (Table 2). For the alternative treatment A1 (status quo) and alternative treatment A2, the existing fire management zones were utilised to guide the location and frequency of planned burning in the landscape. Existing fire management zoning consists of three broad landscape-scale zones (Fig. 2). The zones include the Township Bushfire Management Zone (covering an area ~2 km around high-wildfire-risk townships), Landscape Bushfire Management Zone (located in the broader landscape in areas of higher wildfire risk) and Landscape Ecological Management Zone (located in areas predominately focused on achieving ecological outcomes).
The remaining alternative treatments reflected stakeholder narratives around cause and effect and subsequently deviated from the existing fire-management zoning. For example, stakeholders asked for the development of an alternative treatment that ‘minimised burning in the Anglesea Heath’, an area known to have high biodiversity values, the underlying stakeholder assumption being that regularly repeated planned burning causes negative outcomes for some environmental values. We subsequently identified burn units within the Anglesea Heath and adjusted the burn schedule to limit burning in the area (alternative treatment A5). We then presented the alternative treatment back to the stakeholder group at a follow-up meeting to confirm we had interpreted the narrative correctly. This also presented an opportunity to add in further details such as frequency and width of burning adjacent to townships in the Anglesea Heath area.
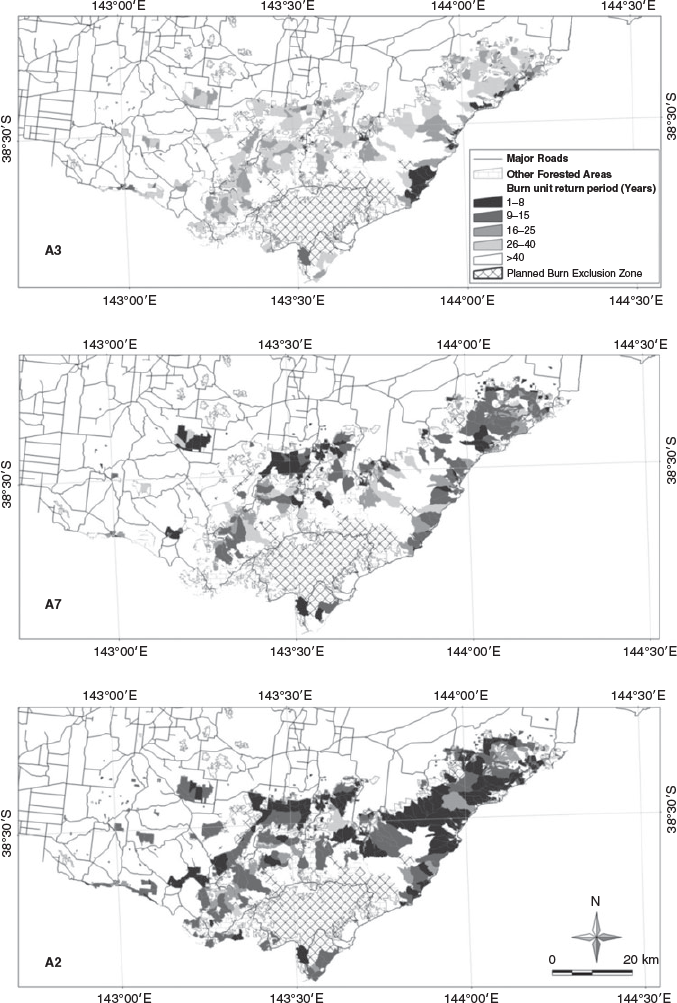
We used mixed-integer programming (MIP) within the Woodstock program (Remsoft Inc. 2018) to prepare 40-year planned burning schedules (Fig. 3). The use of MIP allows the preparation of realistic burn schedules that meet an objective subject to many constraints. For example, burn units (integer variable) can be scheduled to minimise fuel loads (objective) in areas close to assets while not being burnt below a specified time-since-fire threshold (constraint). A spatially explicit estimate of likely burn coverage was incorporated into the base burn unit dataset. In total, stakeholders developed 12 alternative treatments.
The scheduling of planned burning to meet ecological needs is guided by two ecological resilience concepts – Tolerable Fire Interval (TFI) and Geometric Mean Abundance (GMA) (Cheal 2010; McCarthy 2012; Di Stefano et al. 2013). TFI outlines the minimum or maximum recommended time intervals between successive fire disturbance events at a site for a particular vegetation community. In the present study, we utilise the time intervals for each vegetation type as outlined in Cheal (2010). All alternative treatments except A2 were subject to TFI constraints that aimed to minimise the area burnt below TFI. GMA is a biodiversity index used to describe availability of suitable wildlife habitat (McCarthy 2012). In the present study, we developed optimal growth stage targets that maximised the GMA of key fire-response fauna species, following the approach outlined by J. MacHunter, M. Baker, A. Blackett, T. Gazzard (unpubl. data). Alternative treatments A3, A4, A6 and A7 are designed using optimal growth stage targets that aimed to maximise habitat availability.
The remaining seven alternative treatments had a substantial focus on reducing risk to townships, industry and ecosystems vulnerable to repeated wildfires. Contemporary fuel management design principles (Gibbons et al. 2012; Tolhurst et al. 2013; Driscoll et al. 2016; Furlaud et al. 2018) were incorporated into the development of the seven fuel management alternatives, with scheduling aiming to either minimise fuel loads or maximise house loss reduction. Alternative treatments A1, A2 and A5 used set planned burn return intervals adjacent to townships in combination with a landscape MIP objective to maximise the annual reduction in fuel load. Alternative treatments A6–A12 were scheduled to minimise the total house loss score annually. A total house loss score was calculated for each burn unit. House losses were calculated for each fire after it had passed through the burn unit. A total house loss score for each burn unit was calculated by summing the house loss scores for all fires that passed through each burn unit. House losses were calculated based on a logistic regression equation of house loss probability (K. G. Tolhurst, D. M. Chong, T. J. Duff, unpubl. data) that includes flame height, ember density and convective strength as model parameters. The MIP objective was to maximise an annual whole-of-landscape house loss score (sum of all individual burn unit scores).
Fire modelling approach to inform estimation of consequences
We enhanced the Monte Carlo simulation methodology outlined by Mason et al. (2011) to create 10 000 annual wildfire profiles using the deterministic fire spread simulator PHOENIX RapidFire (henceforth PHOENIX) (Tolhurst et al. 2008).
The enhancements to the methodology included the estimation of travel times for all nearby fire stations and bulldozer contractor depots to each ignition point using travel time surfaces derived from the NAVIGATOR model (Duff et al. 2015) and assigning the actual resource type (e.g. bulldozer size, fire tanker size,water bombing helicopter type) from a random subset of nearby fire stations and depots to each ignition location. Resource combinations were varied based on whether the ignition started in grass or forest and based on fire danger rating classes (McArthur 1966). Modelled fire outputs were calibrated to approximately replicate historical fire size outputs for each fire danger rating – ignition location class (Table 3). Historical fire size outputs were calculated based on datasets maintained by fire agencies within Victoria between 1972 and 2014.
We also added a spatial likelihood weighting to each ignition with ignitions being randomly selected from 19 185 ignition points evenly spaced on a 1 × 1-km grid. Ignition start time was randomly allocated to occur between 1100 and 1800 hours. Fires were run until 2300 hours to reduce computational run times.
This modelling method limitation (i.e. historical records show some fires continue to spread for significantly longer durations) is offset by the inclusion of a sufficient number of larger fires to approximately match historical fire size outcomes.
Each of the 10 000 annual wildfire profiles was intersected with each of the candidate planned burn strategies at Year 20 and Year 40 to create 20 000 complete fire regimes for each alternative treatment. All PHOENIX simulations produced 180 × 180-m cell outputs (Tolhurst et al. 2008; State of Victoria 2015b).
Estimate the consequences of each candidate alternative against each objective
For each alternative treatment, we estimated consequences against each objective. Methodologies are briefly outlined in Table 1. Detailed descriptions of the methodologies are provided in Deloitte Access Economics (unpubl. data) and T. Walshe, T. Gazzard, P. Galvin, M. Baker, B. Cross (unpubl. data).
Articulate trade-offs
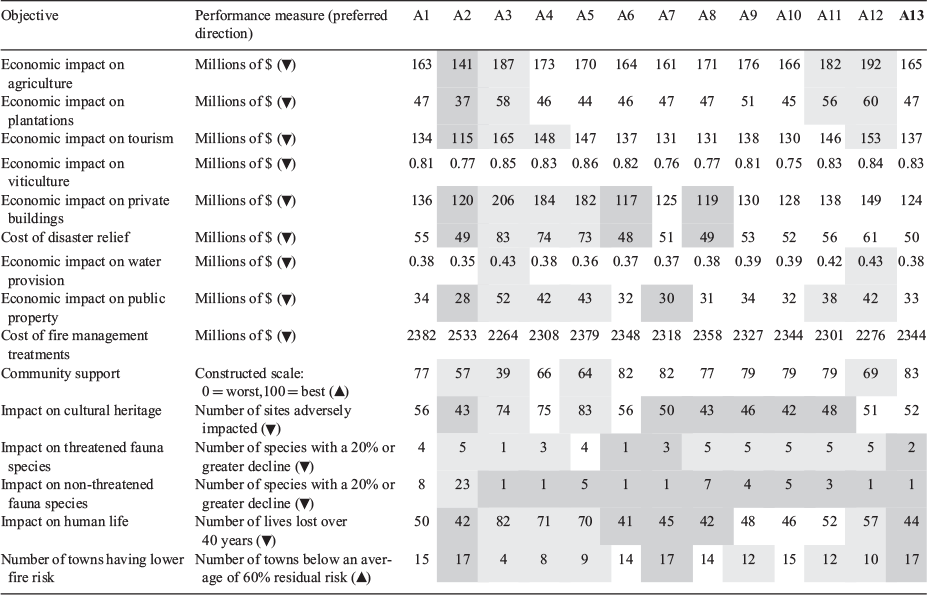
Our approach used two complementary methods to identify preferred alternative treatments with each stakeholder group. The first method appeals to fast and frugal System 1 thinking (Kahneman 2011; Gregory et al. 2012). Individual stakeholders simply ranked each of the alternatives in order of perceived merit on the basis of the information contained in the consequence table (Table 4). Direct ranking of complex problems involving multiple objectives and multiple trade-offs can be challenging (Hawkins 1994; Luce et al. 1999). So before undertaking the ranking exercise, we sought to simplify the consequence table by removing any of the alternatives that were dominated (i.e. had equal or lesser performance on all attributes then another alternative) (Driscoll et al. 2016). We likewise explored with the stakeholder groups whether any objectives were redundant because of limited variation across the alternatives.
The second method involves slow and deliberate System 2 thinking. As a basis for comparative insight, we employed a weighting method using an additive MCDA value model (von Winterfeldt and Edwards 1986; Bedford and Cooke 2001; Keeney 2007) to encourage a more detailed evaluation of trade-offs. More explicitly, to account for the range of consequences under each objective in the MCDA, we elicited compensatory weights from each stakeholder (von Winterfeldt and Edwards 1986), such that weights reflected the magnitude of gain on one objective that would be required to compensate a loss on another objective. Decision scores for each participant and each alternative were obtained, where the decision score V for alternative i is

where wj = weight for criterion j, n = number of criteria and Xij = normalised score for alternative i on criterion j.
Human life loss sensitivity analysis
Taboo trade-offs are those involving a sacred value and a secular value (Tetlock et al. 2000). In our study, the trade-off between human life (a sacred value) and monetary loss (a secular value) meets the definition of a taboo trade-off. Taboo trade-offs have been demonstrated to leave the decision maker feeling compromised (Baron and Spranca 1997; Tetlock 2003) and decision makers tend to avoid the internal conflict they incite. A common avoidance strategy is to resist a considered response to the question of willingness to pay and instead provide loose judgments that deny the realities of constrained resources (Tetlock 2000). We tested the sensitivity of preferred alternatives to weights assigned to human life.
For any individual participant, the weights assigned to monetary consequences and human life can be used to calculate an implied value for a single statistical life. For example, if the range for loss of life across alternatives was 100 lives, the range for monetary losses was AU$100 million, and the magnitude of the weight assigned to life was twice that assigned to monetary loss, we can say that the implied value of a statistical life is AU$2 million.
A meta-analysis of Australian studies that estimated the monetary value of a statistical life yielded an average AU$6.0 million in 2006 dollars (Australian Safety and Compensation Council 2008). Acknowledging the considerable variation encountered, the authors of the meta-analysis suggest a range for sensitivity analyses of AU$3.7 million to AU$8.1 million.
We conducted a sensitivity analysis whereby the weights for each stakeholder were manipulated by adjusting the implied equivalent of a statistical life to AU$3.7 million (lower bound), AU$6 million (best estimate) and AU$8.1 million (upper bound) (Australian Safety and Compensation Council 2008).
Results
Direct ranking approach
When all 15 objectives were included, the only dominated alternative was A1, which was dominated by A7. That is, A7 outperformed A1 on all objectives; however, the differences were very small for many of the objectives. To account for uncertainty in the modelling outcomes, a more common approach is to compare alternatives that differ by ±10% (Driscoll et al. 2016). When using this approach, all alternatives were non-dominated on at least one objective and were subsequently retained in the consequence table.
The range of deviation for viticulture and water provision objectives across the range of alternatives was within AU$100 000. In comparison with the other monetary objectives, the economic impact was small, with expected losses of less than AU$1 million. Nevertheless, the viticulture and water provision objectives were retained in analysis to capture the complete set of impacts.
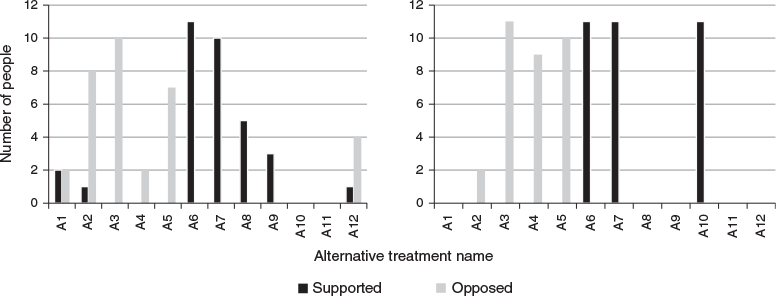
The direct ranking approach showed strong support from most stakeholders for A6 and A7 and moderate support for A8 and A9 (Fig. 4). Most stakeholders ranked A2, A3 and A5 as the least-preferred alternative treatments.
Simple weighted summation approach
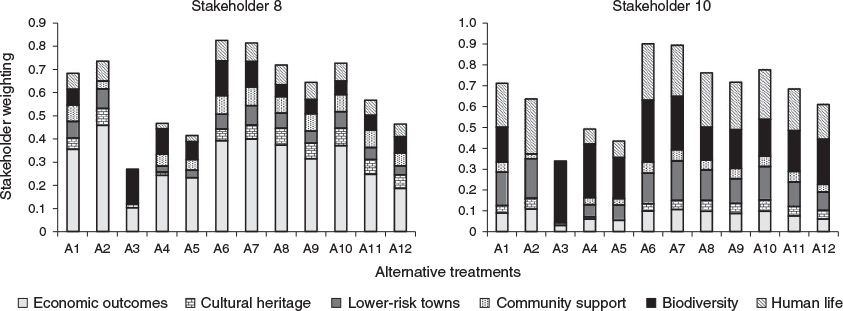
Examples of decision scores for two participants are shown in Fig. 5. Despite considerable differences in emphases across objectives, both participants rated alternatives A6 and A7 highly.
The collective outcome of the simple weighted summation approach across all 11 participants is shown in Fig. 4. The support for A6 and A7 illustrated in Fig. 5 for two participants is broadly evident in the trade-off judgments of the full stakeholder group. A6 was the top-ranking alternative for eight participants and A7 the best for three participants. A10 was also well supported. The minimalist fuel reduction burning strategy A3 performed worst. A4 and A5 were also judged poorly.
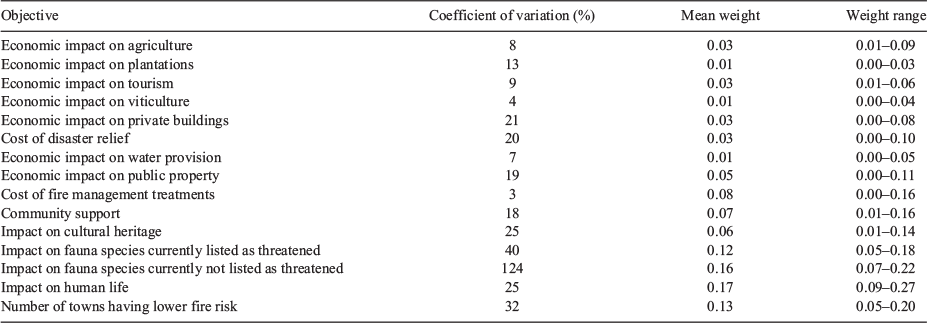
Objectives with the greatest influence on outcomes are those associated with both high variability and high weights. Table 5 collates objective-specific variability in consequences across all alternatives, together with summary statistics on how each objective was weighted. In general, stakeholders assigned high weights to human life and biodiversity. A3 was the worst alternative for human life and A2 performed weakly on biodiversity (Table 4).
Human life loss sensitivity analysis
The average implied monetary equivalent of a statistical life for all stakeholders was AU$2.34 million (range of between AU$0.27 and AU$6.48 million). This is less than half the best estimate of the Australian Safety and Compensation Council (2008) of AU$6 million. The sensitivity analysis showed that A8 would become increasingly supported had participants placed less emphasis on monetary losses and more on human life, all else being equal, whereas support for A10 is eroded at higher valuations. Alternative treatments A6 and A7 remain strongly supported irrespective of the mean value assigned to a statistical life.
Selection of a preferred strategy based on stakeholder preferences
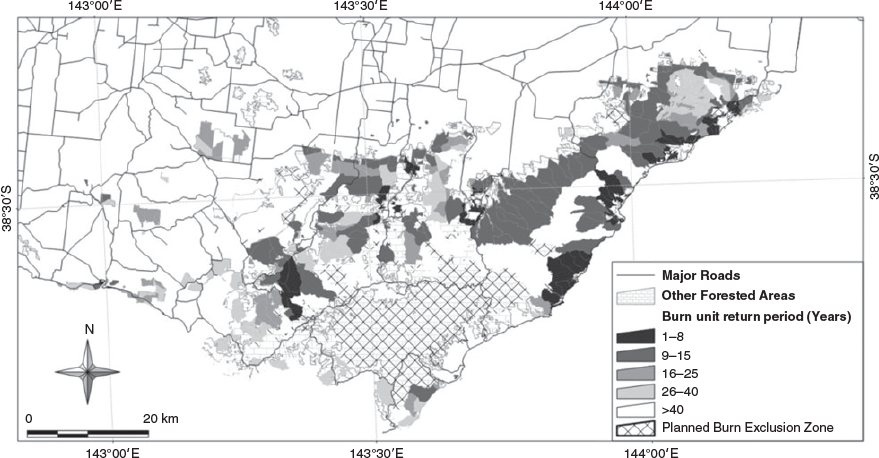
The most supported strategies identified an acceptable performance goal for each objective (Table 4). This enabled the creation of an additional set of alternatives treatments that incorporated design elements from the three most supported strategies, A6, A7 and A10, that aided operational delivery. From this additional set of alternatives, one strategy was selected for implementation (Fig. 6). The selected strategy focused on burning every 5–8 years within 2 km of high-risk townships and burning every 10–13 years in strategic locations on the northern side of the Otway Ranges to mitigate wildfire impacts. Several areas in the landscape were identified to have no planned burning or infrequent planned burning (1–2 times within the 40-year period) to enable ecological goals to be achieved. The selected strategy placed importance on risk mitigation to many towns (not just the highest-risk towns), vulnerable ecosystems and local industry while maintaining good habitat outcomes for most fauna species. This combination of outcomes had strong community support.
|
Discussion
We used a SDM approach to enable local land managers to select preferred alternative fuel management treatments that combined estimated consequences and articulation of value preferences. Psychologists distinguish between System 1 and System 2 reasoning (Stanovich and West 2000; Kahneman 2011). System 1 is the rapid processing of information using raw intuition. System 2 is slower, more deliberate and considered (Kahneman 2011). Although contrasts in outcomes between System 1 and System 2 can lead to important insights (Hawkins 1994; Fischer et al. 1999; Lichtenstein et al. 2007), consistency across the two modalities provides confidence in decision-making. The majority of participants had a strong correlation between System 1 and System 2 thinking (Fig. 4) and we could infer from this that A6, A7 and A10 as the best alternatives are a robust outcome. Further support for A6, A7 and A10 was gained through the preferred alternative treatments continuing to be selected in the sensitivity analysis of human life loss.
Making trade-offs using explicit estimation of lives lost
Life loss is often cited as the most impactful consequence of wildfires (Fernandes and Botelho 2003; Thompson et al. 2017) and minimising life loss to civilians and firefighters is consistently identified as a priority objective in wildfire management (USDA and USDI 2014; Emergency Management Victoria 2016). This emphasis was also highlighted in the results of our study with the human life objective given the highest weighting by a majority of the participants in both stakeholder groups. Given the high value placed on human life, it is surprising that greater emphasis has not been placed on directly predicting life loss outcomes for alternative treatment options. This is particularly striking given the prevalence of life loss as a performance measure in fields such as medicine (Andersson et al. 2013; Yang et al. 2014; World Health Organization 2014; Lêng et al. 2016) and for many natural hazard types such as floods, dam safety risk, tropical cyclones, storm surge and tsunamis (see Smith and Rahman 2016 for a summary of natural hazard life loss methods). This reticence may stem from a lack of hazard specific agent-based models, or sensitivity of governing bodies to the reporting of life loss, and the taboo trade-offs such reporting invokes. Despite difficulties with taboo trade-offs, based on the stakeholder results, stakeholder feedback (RMCG, unpubl. data) and our observations, the use of life loss as a performance measure is to be encouraged when utilised in SDM processes.
Estimation of consequences related to fundamental objectives
In the last two decades, many studies have analysed the effectiveness of fuel management activities and either reported on means based objectives or used proxy measures to represent fundamental outcomes. Examples include area burnt by wildfire (Bentley and Penman 2017; Furlaud et al. 2018), likelihood of fire reaching the interface (Ager et al. 2010; Price et al. 2015a), reduced probability of home exposure or habitat to wildfire (Bentley and Penman 2017), proportion of area below or above TFI (McCarthy et al. 2001; Penman et al. 2011a), growth stage structure (GSS) and GMA (Di Stefano et al. 2013; Kelly et al. 2015).
Measures related to means-based objectives or proxy measures such as TFI, GMA and GSS aid in the design of landscape fuel management strategies and have proved useful to land managers in south-eastern Australia as has been demonstrated in this study. However, results of all three measures have subsequently proved difficult to communicate to internal and external stakeholders and to provide a meaningful measure to evaluate trade-offs. For example, it can be difficult for stakeholders to comprehend what a 10-point GMA variation between alternatives signifies for native species populations. Similarly, a 10% reduction in the wildfire size is open to stakeholder interpretation when considering outcomes to multiple values.
In contrast, we set out to estimate consequences using natural measures linked to fundamental objectives. Where possible, we aimed to use existing datasets and methods. As noted by Thompson et al. (2017), fundamental objectives often do not have well-developed methodologies to enable the calculation of natural performance measures, with some notable exceptions such as house loss estimation (Tolhurst et al. 2013; State of Victoria 2015b). Subsequently, the estimation of consequences proved to be a substantial task and many of the models used were by necessity fairly simple.
The use of natural measures also assists in identifying stakeholder values that may be less sensitive to strategy design differences or where the magnitude of impact is quite small. For example, in our study, stakeholder preferences (Table 5) showed that the viticulture and water provision objectives had the least influence on the selection of strategies and could have been excluded in the first step of the trade-off process. Although these objectives had the least influence on the selection of the preferred strategy, the inclusion of these objectives in the consequence table ensures that all stakeholders have a common understanding of which values are more influential in the selection of preferred strategies. This level of transparency also has been invaluable when communicating to stakeholders not involved in the study why the selected strategy was the preferred option.
Strategy design
The magnitude of reduction in wildfire extent through use of planned burning has been described as leverage (Loehle 2004; Price et al. 2015b) and typically follows a non-linear decay relationship that suggests that as planned burning levels increase, the level of effectiveness decreases (King et al. 2008; Boer et al. 2009; Price 2012). A similar relationship existed for the agriculture and plantation objectives in our study.
In comparison, for objectives that benefited from optimised outcomes created using the MIP solver such as fixed private capital assets, life loss, township risk reduction and fauna decline, there was significant deviation away from a non-linear decay relationship, indicating that the effectiveness of planned burning is increased with the strategic placement of planned burns.
Consistent with the findings of other studies (Bradstock and Price 2010; Penman et al. 2014; Ager et al. 2016; Bentley and Penman 2017), the highest leverage was gained from frequent burning directly adjacent to the values of interest. However, our results also showed that outcomes can be further enhanced by the inclusion of burning in high-wildfire-risk pathways and increasing the depth of burning close to assets. This is reflected in the differences between alternative treatments A3 and A12.
Outcomes for fauna species
Predominately, the selected strategy offered an improvement for most objectives over the status quo – particularly in relation to fauna and human life outcomes, which were the two highest-weighted objectives in our study. Although fauna outcomes improved for most species, several species were forecast to decline locally under the selected strategy. These species have a known habitat preference for older vegetation (Wilson et al. 2001a; 2001b) and occur in the study area where frequent planned burning is scheduled to minimise the bushfire risk to nearby townships. This highlights that additional operational scheduling considerations may be required in several areas that have been prioritised for community risk reduction outcomes. Operational controls could include reducing planned burn coverage and minimising treatment during times when species may be more sensitive to disturbance, such as during drought conditions or during the primary breeding season.
Limitations of our work
We used a Monte Carlo simulation approach to examine a large number of combinations of inputs and associated outcomes. However, we acknowledge that further testing of model input sensitivity would be valuable. For instance, it is known that outcomes in the PHOENIX model are particularly sensitive to ignition location and further work should investigate whether a finer ignition grid size would significantly modify modelled outcomes. Other input areas requiring further sensitivity testing include ignition time and suppression travel times.
We were limited in this study to utilising existing datasets and drew on published methodologies for calculation of estimated consequences where they existed. However, many of the models are still in their infancy and there are many data gaps that limit the strength of some of the modelling methodologies. In particular, the indirect estimation of life loss has several limitations. Specifically, the assumption of a ratio of 16.5 : 1 for house loss and life loss is calculated based on losses recorded across Australia between 1901 and 2011 (Blanchi et al. 2012). This may not capture local landscape wildfire risks associated with peak tourism along the Great Ocean Road coinciding with peak fire danger periods or represent recent operational policy changes associated with stronger emphasis on leaving early and human survival. Also, no account has been made of post-trauma suicide and other non-fatal impacts.
Future studies
As shown by our study, the use of the SDM framework provides a solid basis on which to structure complex decisions related to fire management. We would encourage additional focus on the development of forecasting methodologies that report on natural measures connected to fundamental objectives. This will greatly aid decision makers and significantly improve the communication of outcomes.
Also, although the fire modelling approach was robust, ideally, we would create complete fire histories for each year. That is, create thousands of combinations of bushfire and planned burning for all 40 years of the analysis period. Further automation of this type of process would be particularly useful to land managers.
Conclusions
The consideration of a broad range of alternative treatment designs promotes understanding of the magnitude of leverage that planned burning can deliver over time. Further, this ensures our assumptions and narratives of what is possible are challenged and tested. From this study, we have identified that reasonable outcomes are possible through strategically focused burning of 4000–5000 ha per annum for a subset of values (e.g. high-risk townships, life, tourism, non-threatened fauna). To obtain good outcomes for the majority of values, planned burning needs to treat 7000–8000 ha per annum. Above this amount, there are diminishing returns on investment for most objectives.
This exploration of alternative treatments has also provided local land managers with insights into the limitations of planned burning to reduce bushfire risk. For example, even under an aggressive planned burn regime (A2), risk to human life still remained. As suggested by others (Bentley and Penman 2017; Furlaud et al. 2018; Penman et al. 2019), fuel management actions will need to be combined with other treatment types to further lower bushfire risk.
The SDM framework advances the possibility of realising the difficult but important objectives of fire management planning. The framework has provided a rare opportunity for combining community and organisational values with credible predictive science to inform sound policy, improve fire management decision making and grow community resilience and regional relationships.
Utilising a logical framework such as SDM guides investment effort and data collection and assists in the identification of suitable performance measures at the start of the decision-making process. The focus on deliberation in the process is a significant strength of this framework and gives stakeholders ownership of the outcomes. The SDM framework enables the stakeholder group to communicate why we apply fire in the way we do, which is partially facilitated through an emphasis on natural measures.
The selected strategy has subsequently been endorsed by the State of Victoria as the updated fuel management strategy for the Barwon Otway Landscape. The endorsed strategy ultimately provides a hypothesis or narrative that can be tested though monitoring over time. This project has demonstrated that an SDM approach can be successfully applied to fire management.
Conflict of interest
The authors declare no conflicts of interest.
Acknowledgements
The Deloitte Access Economics project team made a substantial contribution to the development of economic modelling methods that were critical to the outcomes of the project. We would like to acknowledge the input, guidance and deliberation undertaken by many agency staff and community members of the stakeholder advisory group. This study benefited from land manager and agency inputs from Department of Environment, Land, Water and Planning staff including David Rourke, Peter Codd, Garry Peterson, Andrew Morrow, Evan Lewis, Bo Campbell, Liam Fogarty, Laura Little, Sharon Rawlings and Trevor Dess, Parks Victoria staff including Ty Caling, Aaron Ledden and Kate McMahon, University of Melbourne staff Dr Julian Di Stefano and local government staff including Cheryl Nagel.
References
Ager AA, Vaillant NM, Finney MA (2010) A comparison of landscape fuel treatment strategies to mitigate wildland fire risk in the urban interface and preserve old forest structure. Forest Ecology and Management 259, 1556–1570.| A comparison of landscape fuel treatment strategies to mitigate wildland fire risk in the urban interface and preserve old forest structure.Crossref | GoogleScholarGoogle Scholar |
Ager AA, Day MA, Vogler K (2016) Production possibility frontiers and socioecological trade-offs for restoration of fire-adapted forests. Journal of Environmental Management 176, 157–168.
| Production possibility frontiers and socioecological trade-offs for restoration of fire-adapted forests.Crossref | GoogleScholarGoogle Scholar | 27033166PubMed |
Andersson TML, Dickman PW, Eloranta S, Lambe M, Lambert PC (2013) Estimating the loss in expectation of life due to cancer using flexible parametric survival models. Statistics in Medicine 32, 5286–5300.
| Estimating the loss in expectation of life due to cancer using flexible parametric survival models.Crossref | GoogleScholarGoogle Scholar |
Australian Safety and Compensation Council (2008) The health of nations: the value of a statistical life. Commonwealth of Australia (Canberra, ACT, Australia)
Baron J, Spranca M (1997) Protected values. Organizational Behavior and Human Decision Processes 70, 1–16.
| Protected values.Crossref | GoogleScholarGoogle Scholar |
Bedford T, Cooke R (2001) ‘Probabilistic risk analysis: foundations and methods.’ (Cambridge University Press: Cambridge, UK)
Bentley PD, Penman TD (2017) Is there an inherent conflict in managing fire for people and conservation? International Journal of Wildland Fire 26, 455–468.
| Is there an inherent conflict in managing fire for people and conservation?Crossref | GoogleScholarGoogle Scholar |
Blanchi R, Leonard J, Haynes K, Opie K, James M, Kilinc M, Dimer de Oliveira F, Van den Honert R (2012) Life and house loss database description and analysis. CSIRO, Bushfire Cooperative Research Centre report to the Attorney-General’s Department, CSIRO EP-129645. Available at http://www.bushfirecrc.com/sites/default/files/managed/resource/life_house_loss_report_final_0.pdf [Verified 7 August 2018]
Boer MM, Sadler RJ, Wittkuhn RS, McCaw L, Grierson PF (2009) Long-term impacts of prescribed burning on regional extent and incidence of wildfires – evidence from 50 years of active fire management in SW Australian forests. Forest Ecology and Management 259, 132–142.
| Long-term impacts of prescribed burning on regional extent and incidence of wildfires – evidence from 50 years of active fire management in SW Australian forests.Crossref | GoogleScholarGoogle Scholar |
Bond SD, Carlson KA, Keeney RL (2008) Generating objectives: can decision makers articulate what they want? Management Science 54, 56–70.
| Generating objectives: can decision makers articulate what they want?Crossref | GoogleScholarGoogle Scholar |
Bradstock RA, Price OF (2010) The effect of fuel age on the spread of fire in sclerophyll forest in the Sydney region of Australia. International Journal of Wildland Fire 19, 35–45.
| The effect of fuel age on the spread of fire in sclerophyll forest in the Sydney region of Australia.Crossref | GoogleScholarGoogle Scholar |
Butry DT, Prestemon JP, Abt KL, Sutphen R (2010) Economic optimisation of wildfire intervention activities. International Journal of Wildland Fire 19, 659–672.
| Economic optimisation of wildfire intervention activities.Crossref | GoogleScholarGoogle Scholar |
Cheal D (2010) Growth stages and tolerable fire intervals for Victoria’s native vegetation data sets. Department of Sustainability and Environment, Fire and Adaptive Management Report No. 84. (Melbourne, Vic., Australia)
Di Stefano J, McCarthy MA, York A, Duff TJ, Slingo J, Christie F (2013) Defining vegetation age class distributions for multispecies conservation in fire-prone landscapes. Biological Conservation 166, 111–117.
| Defining vegetation age class distributions for multispecies conservation in fire-prone landscapes.Crossref | GoogleScholarGoogle Scholar |
Driscoll DA, Lindenmayer DB, Bennett AF, Bode M, Bradstock RA, Cary GJ, Clarke MF, Dexter N, Fensham R, Friend G, Gill M, James S, Kay G, Keith DA, MacGregor C, Possingham HP, Russel-Smith J, Salt D, Watson JEM, Williams D, York A (2010) Resolving conflicts in fire management using decision theory: asset protection versus biodiversity conservation. Conservation Letters 3, 215–223.
| Resolving conflicts in fire management using decision theory: asset protection versus biodiversity conservation.Crossref | GoogleScholarGoogle Scholar |
Driscoll DA, Bode M, Bradstock RA, Keith DA, Penman TD, Price OF (2016) Resolving future fire management conflicts using multicriteria decision analysis. Conservation Biology 30, 196–205.
| Resolving future fire management conflicts using multicriteria decision analysis.Crossref | GoogleScholarGoogle Scholar | 26148692PubMed |
Duff TJ, Chong DM, Tolhurst KG (2015) Using discrete event simulation cellular automata models to determine multimode travel times and routes of terrestrial suppression resources to wildland fires. European Journal of Operational Research 241, 763–770.
| Using discrete event simulation cellular automata models to determine multimode travel times and routes of terrestrial suppression resources to wildland fires.Crossref | GoogleScholarGoogle Scholar |
Emergency Management Victoria (2016) Victorian bushfire handbook, edn 5.1 – December 2016 (Melbourne, Vic, Australia). Available at https://files-em.em.vic.gov.au/public/Doctrine/ManHand/VIC-BushfireHandbook.pdf [Verified 7 August 2018]
Failing L, Gregory R, Harstone M (2007) Integrating science and local knowledge in environmental risk management: a decision-focussed approach. Ecological Economics 64, 47–60.
| Integrating science and local knowledge in environmental risk management: a decision-focussed approach.Crossref | GoogleScholarGoogle Scholar |
Fernandes PM, Botelho HS (2003) A review of prescribed burning effectiveness in fire hazard reduction. International Journal of Wildland Fire 12, 117–128.
| A review of prescribed burning effectiveness in fire hazard reduction.Crossref | GoogleScholarGoogle Scholar |
Fischer GW, Carmon Z, Ariely D, Zauberman G (1999) Goal-based construction of preferences: task goals and the prominence effect. Management Science 45, 1057–1075.
| Goal-based construction of preferences: task goals and the prominence effect.Crossref | GoogleScholarGoogle Scholar |
Florec V, Pannell D, Burton M, Kelso J, Mellor D, Milne G (2013) Economic analysis of prescribed burning for wildfire management in Western Australia. In ‘Proceedings of the fourth international symposium on fire economics, planning, and policy; climate change and wildfires’. (Ed. A González-Cabán,) pp. 98–110. (USDA Forest Service, Pacific Southwest Research Station, General Technical Report PSW-GTR-245.Albany, CA)
Fraser H, Rumpff L, Yen JDL, Robinson D, Wintle BA (2017) Integrated models to support multi-objective ecological restoration decisions. Conservation Biology 31, 1418–1427.
| Integrated models to support multi-objective ecological restoration decisions.Crossref | GoogleScholarGoogle Scholar | 28339135PubMed |
Furlaud JM, Williamson GJ, Bowman DMJS (2018) Simulating the effectiveness of prescribed burning at altering wildfire behaviour in Tasmania, Australia. International Journal of Wildland Fire 27, 15–28.
| Simulating the effectiveness of prescribed burning at altering wildfire behaviour in Tasmania, Australia.Crossref | GoogleScholarGoogle Scholar |
Garrard GE, Rumpff L, Runge MC, Converse SJ (2017) Rapid prototyping for decision structuring: an efficient approach to conservation decision analysis. In ‘Decision-making in conservation and natural resource management: models for interdisciplinary approaches’. (Eds N Bunnefeld, E Nicholson, EJ Milner-Gulland) pp. 46–64 (Cambridge University Press: Cambridge, UK).
Gibbons P, van Bommel L, Gill AM, Cary GJ, Driscoll DA, Bradstock RA, Knight E, Moritz MA, Stephens SL, Lindenmayer DB (2012) Land-management practices associated with house loss in wildfires. PLoS One 7, e29212
| Land-management practices associated with house loss in wildfires.Crossref | GoogleScholarGoogle Scholar | 23227217PubMed |
Gregory R, Long G (2009) Using structured decision-making to help implement a precautionary approach to endangered species management. Risk Analysis 29, 518–532.
| Using structured decision-making to help implement a precautionary approach to endangered species management.Crossref | GoogleScholarGoogle Scholar | 19144073PubMed |
Gregory R, Fischhoff B, McDaniels T (2005) Acceptable input: using decision analysis to guide public policy deliberations. Decision Analysis 2, 4–16.
| Acceptable input: using decision analysis to guide public policy deliberations.Crossref | GoogleScholarGoogle Scholar |
Gregory R, Failing L, Harstone M, Long G, McDaniels T, Ohlson D (2012) ‘Structured decision making. A practical guide to environmental management choices.’ (Wiley-Blackwell: Chichester, UK)
Hawkins SA (1994) Information processing strategies in riskless preference reversals: the prominence effect. Organizational Behavior and Human Decision Processes 59, 1–26.
| Information processing strategies in riskless preference reversals: the prominence effect.Crossref | GoogleScholarGoogle Scholar |
Hinchey S (2016) ‘Wye River and Separation Creek, Victoria: finding into fire without inquest.’ (Victorian Coroners Court: Melbourne, Vic., Australia)
Kahneman D (2011) ‘Thinking fast and slow.’ (Farrar, Straus and Giroux: New York, NY, USA)
Keeney RL (2007) Developing objectives and attributes. In ‘Advances in decision analysis. From foundations to applications’. (Eds W Edwards, RF Miles Jr, D von Winterdfeldt) pp. 104–128. (Cambridge University Press: Cambridge, UK)
Keeney RL, Gregory RS (2005) Selecting attributes to measure achievement of objectives. Operations Research 53, 1–11.
| Selecting attributes to measure achievement of objectives.Crossref | GoogleScholarGoogle Scholar |
Kelly LT, Bennett AF, Clarke MF, McCarthy MA (2015) Optimal fire histories for biodiversity conservation. Conservation Biology 29, 473–481.
| Optimal fire histories for biodiversity conservation.Crossref | GoogleScholarGoogle Scholar | 25163611PubMed |
King KJ, Bradstock RA, Cary GJ, Chapman J, Marsden-Smedley JB (2008) The relative importance of fine-scale fuel mosaics on reducing fire risk in south-west Tasmania, Australia. International Journal of Wildland Fire 17, 421–430.
| The relative importance of fine-scale fuel mosaics on reducing fire risk in south-west Tasmania, Australia.Crossref | GoogleScholarGoogle Scholar |
Lêng CH, Chou MH, Lin SH, Yang YK, Wang JD (2016) Estimation of life expectancy, loss-of-life expectancy, and lifetime healthcare expenditures for schizophrenia in Taiwan. Schizophrenia Research 171, 97–102.
| Estimation of life expectancy, loss-of-life expectancy, and lifetime healthcare expenditures for schizophrenia in Taiwan.Crossref | GoogleScholarGoogle Scholar | 26811230PubMed |
Lichtenstein S, Gregory R, Irwin J (2007) What’s bad is easy: taboo values, affect and cognition. Judgment and Decision Making 2, 169–188.
Loehle C (2004) Applying landscape principles to fire hazard reduction. Forest Ecology and Management 198, 261–267.
| Applying landscape principles to fire hazard reduction.Crossref | GoogleScholarGoogle Scholar |
Luce MF, Payne JW, Bettman JR (1999) Emotional trade-off difficulty and choice. JMR, Journal of Marketing Research 36, 143–159.
| Emotional trade-off difficulty and choice.Crossref | GoogleScholarGoogle Scholar |
Marcot BG, Thompson MP, Runge MC, Thompson FR, McNulty S, Cleaves D, Tomosy M, Fisher LA, Bliss A (2012) Recent advances in applying decision science to managing national forests. Forest Ecology and Management 285, 123–132.
| Recent advances in applying decision science to managing national forests.Crossref | GoogleScholarGoogle Scholar |
Martinez-Harms MJ, Bryan BA, Balvanera P, Law EA, Rhodes JR, Possingham HP, Wilson KA (2015) Making decisions for managing ecosystem services Biological Conservation 184, 229–238.
| Making decisions for managing ecosystem servicesCrossref | GoogleScholarGoogle Scholar |
Mason C, Sheridan GJ, Smith H, Chong DM, Tolhurst KG (2011) Wildfire risk to water supply catchments: a Monte Carlo simulation model. In ‘MODSIM2011, 19th international congress on modelling and simulation’, Perth, WA, Australia, December 2011. (Eds F Chan, D Marinova, RS Anderssen) pp. 2831–2837. (Modelling and Simulation Society of Australia and New Zealand).
McArthur AG (1966) Weather and grassland fire behaviour. Commonwealth Forestry and Timber Bureau, Leaflet 100. (Canberra, ACT, Australia)
McCarthy MA (2012) Review of resilience concepts and their measurement for fire management. Department of Sustainability and Environment, Fire and Adaptive Management Report No. 90. (Melbourne, Vic., Australia)
McCarthy MA, Possingham HP, Gill AM (2001) Using stochastic dynamic programming to determine optimal fire management for Banksia ornata. Journal of Applied Ecology 38, 585–592.
| Using stochastic dynamic programming to determine optimal fire management for Banksia ornata.Crossref | GoogleScholarGoogle Scholar |
Mercer DE, Prestemon JP, Butry DT, Pye JM (2007) Evaluating alternative prescribed burning policies to reduce net economic damages from wildfire. American Journal of Agricultural Economics 89, 63–77.
| Evaluating alternative prescribed burning policies to reduce net economic damages from wildfire.Crossref | GoogleScholarGoogle Scholar |
Moore JL, Runge MC (2012) Combining structured decision making and value-of-information analyses to identify robust management strategies. Conservation Biology 26, 810–820.
| Combining structured decision making and value-of-information analyses to identify robust management strategies.Crossref | GoogleScholarGoogle Scholar | 22862796PubMed |
Papakosta P, Xanthopoulos G, Straub D (2017) Probabilistic prediction of wildfire economic losses to housing in Cyprus using Bayesian network analysis. International Journal of Wildland Fire 26, 10–23.
| Probabilistic prediction of wildfire economic losses to housing in Cyprus using Bayesian network analysis.Crossref | GoogleScholarGoogle Scholar |
Penman TD, Christie FJ, Andersen AN, Bradstock RA, Cary GJ, Henderson MK, Price O, Tran C, Wardle GM, Williams RJ, York A (2011a) Prescribed burning: how can it work to conserve the things we value? International Journal of Wildland Fire 20, 721–733.
| Prescribed burning: how can it work to conserve the things we value?Crossref | GoogleScholarGoogle Scholar |
Penman TD, Price O, Bradstock RA (2011b) Bayes nets as a method for analysing the influence of management actions in fire planning. International Journal of Wildland Fire 20, 909–920.
| Bayes nets as a method for analysing the influence of management actions in fire planning.Crossref | GoogleScholarGoogle Scholar |
Penman TD, Bradstock RA, Price OF (2014) Reducing wildfire risk to urban developments: simulation of cost-effective fuel treatment solutions in south-eastern Australia. Environmental Modelling & Software 52, 166–175.
| Reducing wildfire risk to urban developments: simulation of cost-effective fuel treatment solutions in south-eastern Australia.Crossref | GoogleScholarGoogle Scholar |
Penman TD, Nicholson AE, Bradstock RA, Collins L, Penman SH, Price OF (2015) Reducing the risk of house loss due to wildfires. Environmental Modelling & Software 67, 12–25.
| Reducing the risk of house loss due to wildfires.Crossref | GoogleScholarGoogle Scholar |
Penman SH, Price OF, Penman TD, Bradstock RA (2019) The role of defensible space on the likelihood of house impact from wildfires in forested landscapes of south-eastern Australia. International Journal of Wildland Fire 28, 4–14.
| The role of defensible space on the likelihood of house impact from wildfires in forested landscapes of south-eastern Australia.Crossref | GoogleScholarGoogle Scholar |
Price O (2012) The drivers of effectiveness of prescribed fire treatment. Forest Science 58, 606–617.
| The drivers of effectiveness of prescribed fire treatment.Crossref | GoogleScholarGoogle Scholar |
Price O, Borah R, Bradstock R, Penman T (2015a) An empirical wildfire risk analysis: the probability of a fire spreading to the urban interface in Sydney, Australia. International Journal of Wildland Fire 24, 597–606.
| An empirical wildfire risk analysis: the probability of a fire spreading to the urban interface in Sydney, Australia.Crossref | GoogleScholarGoogle Scholar |
Price OF, Penman TD, Bradstock RA, Boer MM, Clarke H (2015b) Biogeographical variation in the potential effectiveness of prescribed fire in south-eastern Australia. Journal of Biogeography 42, 2234–2245.
| Biogeographical variation in the potential effectiveness of prescribed fire in south-eastern Australia.Crossref | GoogleScholarGoogle Scholar |
Remsoft Inc. (2018) Woodstock forest modelling system. Available at https://www.remsoft.com/solutions [Verified 6 August 2018]
Richards SA, Possingham HP, Tizard J (1999) Optimal fire management for maintaining habitat diversity. Ecological Applications 9, 880–892.
| Optimal fire management for maintaining habitat diversity.Crossref | GoogleScholarGoogle Scholar |
Rodríguez y Silva F, González-Cabán A (2016) Contribution of suppression difficulty and lessons learned in forecasting fire suppression operations productivity: a methodological approach. Journal of Forest Economics 25, 149–159.
| Contribution of suppression difficulty and lessons learned in forecasting fire suppression operations productivity: a methodological approach.Crossref | GoogleScholarGoogle Scholar |
Smith GP, Rahman PF (2016) Approaches for estimating flood fatalities relevant to floodplain management. Water Research Laboratory Technical Report 2015/09. School of Civil and Environmental Engineering. (University of NSW: Manly Vale, NSW, Australia). Available at https://knowledge.aidr.org.au/media/2333/wrl-approches-for-estimating-flood-fatalities-september-2016.pdf [Verified 7 August 2018]
Stanovich KE, West RF (2000) Individual differences in reasoning: implications for the rationality debate. Behavioral and Brain Sciences 23, 645–665.
| Individual differences in reasoning: implications for the rationality debate.Crossref | GoogleScholarGoogle Scholar | 11301544PubMed |
State of Victoria (2015a) Strategic bushfire management plan: Barwon Otway. Available at https://www.safertogether.vic.gov.au/__data/assets/pdf_file/0022/128542/DELWP0016D_BMP15_BarwonOtway_web_v2.pdf [Verified 6 August 2018]
State of Victoria (2015b) Measuring bushfire risk in Victoria. Available at http://www.delwp.vic.gov.au/__data/assets/pdf_file/0009/318879/DELWP0017_BushfireRiskProfiles_rebrand_v5.pdf [Verified 7 August 2018]
State of Victoria (2018a) Governance of the Great Ocean Road region issues paper. Available at https://s3.ap-southeast-2.amazonaws.com/hdp.au.prod.app.vic-engage.files/2615/2158/9991/DELWP0072_GovernanceoftheGreatOceanRoadregion_IssuesPaper_v18.pdf [Verified 6 August 2018]
State of Victoria (2018b) Community information newsletter: South-West Complex Fires Monday 26 March 2018. Available at https://www.corangamite.vic.gov.au/Property/Emergency/South-West-Complex-Fire-March-2018/VicEmergency-Newsletter [Verified 6 August 2018]
Tetlock PE (2000) Coping with trade-offs: psychological constraints and political implications. In ‘Elements of reason. Cognition, choice and the bounds of rationality’. (Eds A Lupia, MD McCubbins, SL Popkin) pp. 239–263. (Cambridge University Press: Cambridge, NY, USA)
Tetlock PE (2003) Thinking the unthinkable: sacred values and taboo cognitions. Trends in Cognitive Sciences 7, 320–324.
| Thinking the unthinkable: sacred values and taboo cognitions.Crossref | GoogleScholarGoogle Scholar | 12860191PubMed |
Tetlock PE, Kristel OV, Elson SB, Green MC, Lerner JS (2000) The psychology of the unthinkable: taboo trade-offs, forbidden base rates, and heretical counterfactuals. Journal of Personality and Social Psychology 78, 853–870.
| The psychology of the unthinkable: taboo trade-offs, forbidden base rates, and heretical counterfactuals.Crossref | GoogleScholarGoogle Scholar | 10821194PubMed |
Thompson MP, Rodríguez y Silva F, Calkin DE, Hand MS (2017) A review of the challenges to determining and demonstrating efficiency of large fire management. International Journal of Wildland Fire 26, 562–573.
| A review of the challenges to determining and demonstrating efficiency of large fire management.Crossref | GoogleScholarGoogle Scholar |
Tolhurst K, Shields B, Chong D (2008) PHOENIX: development and application of a bushfire risk management tool. Australian Journal of Emergency Management 23, 47–54.
Tolhurst KG, Duff TJ, Chong DM (2013) From ‘wildland–urban interface’ to ‘wildfire interface zone’ using dynamic fire modelling. In ‘Proceedings of MODSIM2013, 20th international congress on modelling and simulation’, 1–6 December 2013, Adelaide, SA. (Eds J Piantadosi, RS Anderssen, J Boland) pp. 221–227. (Modelling and Simulation Society of Australia and New Zealand: Canberra, ACT, Australia)
USDA, USDI (2014) The National Strategy: the final phase of the development of the National Cohesive Wildland Fire Management Strategy (The National Strategy). Available at https://www.forestsandrangelands.gov/strategy/thestrategy.shtml [Verified 7 August 2018]
US National Research Council (1996) ‘Understanding risk: informing decisions in a democratic society.’ (National Academy Press: Washington, DC, USA)
Venn TJ, Calkin DE (2011) Accommodating non-market values in evaluation of wildfire management in the United States: challenges and opportunities. International Journal of Wildland Fire 20, 327–339.
| Accommodating non-market values in evaluation of wildfire management in the United States: challenges and opportunities.Crossref | GoogleScholarGoogle Scholar |
Vogler K, Ager A, Day M, Jennings M, Bailey J (2015) Prioritization of forest restoration projects: trade-offs between wildfire protection, ecological restoration and economic objectives. Forests 6, 4403–4420.
| Prioritization of forest restoration projects: trade-offs between wildfire protection, ecological restoration and economic objectives.Crossref | GoogleScholarGoogle Scholar |
von Winterfeldt D, Edwards W (1986) ‘Decision analysis and behavioural research.’ (Cambridge University Press: Cambridge, NY, USA)
Wilson BA, Aberton JG, Reichl T (2001a) Effects of habitat fragmentation and fire on the distribution and ecology of the swamp antechinus (Antechinus minimus maritimus) in the eastern Otways, Victoria. Wildlife Research 28, 527–536.
| Effects of habitat fragmentation and fire on the distribution and ecology of the swamp antechinus (Antechinus minimus maritimus) in the eastern Otways, Victoria.Crossref | GoogleScholarGoogle Scholar |
Wilson BA, Aberton JG, Reilly P, McDonald M (2001b) The distribution and ecology of the Rufous Bristlebird (Dasyornis broadbenti) at Airey’s Inlet, Victoria. Emu 101, 341–347.
| The distribution and ecology of the Rufous Bristlebird (Dasyornis broadbenti) at Airey’s Inlet, Victoria.Crossref | GoogleScholarGoogle Scholar |
World Health Organization (WHO) (2014) WHO methods for life expectancy and healthy life expectancy Global Health Estimates Technical Paper WHO/HIS/HSI/GHE/2014.5. Department of Health Statistics and Information Systems. (WHO: Geneva, Switzerland)
Yang S, Lai W, Chang H, Su W, Chen HHW, Wang J (2014) Estimation of loss of quality-adjusted life expectancy (QALE) for patients with operable versus inoperable lung cancer: adjusting quality-of-life and lead-time bias for utility of surgery. Lung Cancer 86, 96–101.
| Estimation of loss of quality-adjusted life expectancy (QALE) for patients with operable versus inoperable lung cancer: adjusting quality-of-life and lead-time bias for utility of surgery.Crossref | GoogleScholarGoogle Scholar | 25178685PubMed |


