

Impacts of wildland fire effects on resources and assets through expert elicitation to support fire response decisions
Colin B. McFayden A E , Den Boychuk B , Douglas G. Woolford C , Melanie J. Wheatley A and Lynn Johnston DA Ontario Ministry of Natural Resources and Forestry, Aviation, Forest Fire and Emergency Services, Dryden Fire Management Centre, 95 Ghost Lake Road, PO Box 850, Dryden, ON P2N 2Z5, Canada.
B Ontario Ministry of Natural Resources and Forestry, Aviation, Forest Fire and Emergency Services, 400 – 70 Foster Drive, Sault Sainte Marie, ON P6A 6V5, Canada.
C Department of Statistical and Actuarial Sciences, University of Western Ontario, 1151 Richmond Street, London, ON N6A 5B7, Canada.
D Natural Resources Canada, Great Lakes Forestry Centre, 1219 Queen Street East, Sault Sainte Marie, ON P6A 2E5, Canada.
E Corresponding author: Email: colin.mcfayden@ontario.ca
International Journal of Wildland Fire 28(11) 885-900 https://doi.org/10.1071/WF18189
Submitted: 15 February 2018 Accepted: 02 July 2019 Published: 19 September 2019
Journal Compilation © IAWF 2019 Open Access CC BY-NC-ND
Abstract
A modelling framework to spatially score the impacts from wildland fire effects on specific resources and assets was developed for and applied to the province of Ontario, Canada. This impact model represents the potential ‘loss’, which can be used in the different decision-making methods common in fire response operations (e.g. risk assessment, decision analysis and expertise-based). Resources and assets considered include point features such as buildings, linear features such as transmission lines, and areal features such as forest management areas. Three categories of fire impacts were included: social, economic and emergency response. Category-specific scores were determined through expert elicitation and then adjusted to account for fire intensity. Expert elicitation was shown to compare favourably with other methods in terms of the complexity, time, set-up cost and operational use. When compared with historical fire data from Ontario, it was found that impact model scores were associated with the objective to suppress or monitor fires. The model framework provides a consistent pre-fire impact assessment to support individual fire response decisions. The impact assessment can also represent the total impact for areas of Ontario that do not have prescriptive response in a formal fire response plan.
Additional keywords: decision-making, Delphi technique, forest fire, RamPART, risk, values, wildfire.
Introduction
Consideration of the effects of fire and the resulting impacts is central to response decision-making for wildland fires (Calkin et al. 2011; Scott et al. 2013). Wildland fire management agencies are tasked with preventing injury and loss of life, and mitigating social and economic impacts from such fires. When the capacity to respond to all fires that require suppression is exceeded due to high demand, prioritising suppression requires consideration of the potential impacts of each fire.
Not all wildland fires are suppressed, and some fire management agencies have complex landscapes and policies where fire response can range from allowing fire to burn naturally to aggressive exclusion of fire by suppression. For example, the Ontario Ministry of Natural Resources and Forestry’s (OMNRF) Wildland Fire Management Strategy for the province of Ontario, Canada, dictates the use of ‘appropriate response’ (OMNRF 2014). An appropriate response is to take actions over the life of a fire that are intended to produce the best outcome given the objectives of realising the benefits of fire, averting the detrimental impacts of fire and managing the response costs (Boychuk and McFayden 2017). In principle, an appropriate response will minimise the expected total cost plus net loss, accounting for constraints such as public and firefighter safety, and many other factors (e.g. Simard 1976).
Our study focuses on Ontario, Canada, where the OMNRF manages wildland fire on 107 million ha (an area larger than France). Approximately 20 million ha of this land is distributed in smaller parcels where there are fire management plans (e.g. OMNRF 2009) that have specific objectives to be achieved through fire response or prescribed burning. In the remaining ~87 million ha, there is a need to determine impacts to support the range of operational decisions made before and once a fire occurs. There is a timeframe when these decisions need to be made before a fire becomes too active or large to contain (Parks 1964).
In Ontario, there is a need to provide a quick, coarse-scale impact quantification to support appropriate response decision-making in the areas that do not have fire management plans. Assessment of impact provides essential information for decision-making within fire operations, whether for risk management applications (OMNRF, unpubl. data; Saskatchewan Wildfire Management Branch (SWMB), pers. comm.) or when applying techniques in operational research (e.g. Minas et al. 2012) and decision analysis (Winston 2003; Kahneman and Klein 2009; Clemen and Reilly 2013; Martell 2015; Xi et al. 2019). Quantifying the diverse possible impacts objectively and consistently is necessary but difficult to do (Finney 2005), and more research is needed (Fairbrother and Turnley 2005; Finney 2005; Calkin et al. 2011; Hyde et al. 2013). To address these needs, we developed an impact model that can be applied anywhere on the landscape, calculated ahead of time, and used for specific fire events to support operational fire response decisions.
We recognise that quantifying impact is only one element of wildland fire decision-making and often impact is presented alongside risk (Finney 2005; Scott 2006; Scott et al. 2013; Xi et al. 2019). However, we note that the purpose of the present study is not to address all the components of risk. Instead, our objective is to develop and apply a methodology for a practical assessment of the potential impact that will help inform decision-makers, who will ultimately consider the many other influencing factors in their determination of actual response to a fire.
Our model uses expert elicitation for identifying resources and assets, quantifying the potential fire impacts resulting from the effects of fire in Ontario, weighting different impact categories, and adjusting the impacts to account for fire intensity. The model can calculate impacts for a range of situations from individual fires to grid cells or to larger partitions of the province. This model, RamPART (Resources and Assets iMPAct Relative Total), quantifies impacts in a systematic and consistent fashion to support fire response decision-making.
Terminology
Hardy (2005) proposed that the language we use to characterise fire management has become less concise over time and therefore has less meaning. We see this with the existence of a variety of definitions for fire risk but also with other fire management terms being used inconsistently, such as ‘values’, ‘fire effects’ and ‘fire impacts’. The term ‘value’ is problematic because the word functions both as a verb and as a noun with two different meanings, as in the phrase ‘we value values because they have value’. We sometimes use ‘values-at-risk’, but ‘risk’ adds to the confusion because it is variously used to mean likelihood, occurrence or expected loss (among others; Miller and Ager 2013). ‘Value’ sometimes refers specifically to property and infrastructure (e.g. ‘value protection’ sprinkler kits are used mostly on structures). Similarly, ‘effects’ and ‘impacts’ are problematic because they are used somewhat synonymously, though with different connotations. To clarify our meaning, we explicitly define the terms used, and avoid using the term ‘value’, employing the following terminology herein:
-
Fire risk is the product of the impact of fire and the likelihood of the event occurring (Finney 2005). The risk framework used in insurance (Crichton 1999) is illustrated as a triangle with the three sides being hazard, vulnerability and exposure. This triangle has also been applied to wildland fire (Scott 2006) as fire probability, fire behaviour and fire effects. A more comprehensive approach to risk in wildland fire management was outlined by Xi et al. (2019), where they added elements of severity, exposure, value and vulnerability to the classic triangle. For consistency with such work, we view risk as the product of likelihood and impact: risk is the expected loss (or net loss). We recognise that it is possible for a fire to have positive impacts (and therefore positive risk). However, in first-order impacts, the negative impacts almost always exceed the benefits a fire response setting.
-
Resources and assets (RAs) are tangible, physical things present in the landscape, such as property, infrastructure and natural resources. They can, in principle, be represented by geospatial data. Resources include biological and other natural elements, such as timber, wildlife habitat, air and watersheds. Assets include objects built by people, such as transmission lines, railways and buildings. RAs can have functions (e.g. roadways provide travel, campsites provide recreation, trees provide habitat, and more).
-
Fire effects are physical, biological and ecological changes to RAs and their functioning caused by fire. For example, forest floor litter is consumed, a building is destroyed, particulate matter in the air is increased, roads are no longer usable, power is interrupted, trees are killed. In fire ecology, fire effects are often considered on two temporal scales: first-order effects, which occur during and immediately after a fire, and second-order effects, which occur after some time (Reinhardt et al. 2001; Ryan and Elliot 2005). For the purposes of the present study, we consider only first-order effects.
-
Fire impacts are the changes in worth, as judged by people, that are caused by fire effects. Impacts can be negative, neutral or positive depending on whether the changes decrease, have no effect on or improve the worth. Impact is also dependent on the stakeholder and different groups may view the impacts differently. Being a change in worth of some kind or another, ‘impact’ specifically refers to the loss or benefit that would occur if the RA is or were to be affected by fire. For the purposes of this study, we consider only first-order negative impacts (loss).
With the above terminology, we can rewrite the phrase ‘we value values because they have value’ as ‘we care about the fire effects on resources and assets because of the negative and positive impacts’.
The direct effects and impacts of a fire can cascade into indirect impacts and effects. For example, a fire can burn electrical poles, disrupting electricity transmission to users who are far from the fire; these effects may result in a variety of indirect impacts.
Regarding the scale of time and space for both effects and impacts, clear start and end points need to be established for assessments (Hardy 2005). This is particularly important given impacts may entirely change when a different scale is considered. For example, a burned building has immediate negative economic impacts (loss of the worth of the original home to the owner), but its reconstruction has positive economic impacts (e.g. the hiring of construction crews, and more). The effects and impacts during the time that fires are actively spreading tend to be the focus of fire management agencies because that is when most firefighting decisions take place.
To elaborate on these definitions, consider a fire killing a stand of mature, healthy trees. One effect is death of the trees, a resource. An impact of that effect is negative if the trees were scheduled for harvesting and there is a loss of monetary worth to the timber company, but positive for the land manager if the land management objective was to incorporate the role of fire in the ecological functioning of the forest. The fire effect is not framed as being negative, neutral or positive; it is simply an objective description of the physical, biological, ecological or functional changes. In this context, a forested area is not considered to have an intrinsic worth. Rather, the area is considered to have a worth as a product of human perception and judgement (Bingham et al. 1995).
Overview of previous impact modelling studies
Impacts can be assessed in various ways, each with differing degrees of complexity, timeliness and cost. Methods range from making a quick visual aerial survey performed by an expert when a fire is reported to determine the initial response to a fire (Thomas and McAlpine 2010), to creating a fire management plan for an area, to performing a quantitative economic analysis (e.g. Kent et al. 2003; OMNRF 2009) (Table 1). We focus on previous work that uses methods to quantify loss and those with similar approaches to our model: subjective quantitative impact assessments by experts.

|
Positive and negative impacts have been described in terms of net value change (NVC) (Food and Agriculture Organisation of the United Nations 1986), which is the sum of the fire impacts accounting for the relative losses and benefits (Finney 2005). When the costs of suppressing a fire are added, the sum is cost plus net value change (C + NVC), which is the theoretical foundation for wildland fire economics (e.g. Baumgartner and Simard 1982; Donovan and Rideout 2003) and equivalent in appropriate response (Boychuk and McFayden 2017). However, quantifying the market and non-market values for a C + NVC calculation is difficult (Finney 2005; Hyde et al. 2013) and judgment of experts has been used in wildland fire context (Scott et al. 2013).
One way to evaluate non-market value involves determining what people are willing to pay for that good or service (Vaux et al. 1984). We have found limited exploration of willingness to pay on a per RA basis or for fire response planning, with most studies focusing on policy and prescribed fire (Fried et al. 1999; Kaval et al. 2007). Inherently, willingness to pay is a subjective assessment to quantify the emotional response about non-market values in wildland fire risk assessment (Kaval et al. 2007).
Use of ‘response functions’ that quantify fire effects on specific RAs is another method to determine impacts through subjective expert input. This method was presented in a comprehensive framework for fire risk assessment (Scott et al. 2013) and applied in many studies (e.g. Thompson et al. 2013). Land managers identified the most highly valued resources and assets to be considered for analysis across categories such as investments, wildland–urban interface, critical habitat and timber. Scott et al.’s (2013) term, ‘highly valued resources and assets’ (HVRAs), approximately corresponds with our term, RAs. Their term ‘fire effects’ generally corresponds with our term fire impacts and represents NVC. They used expert judgment to evaluate and score the impact on HVRAs. Experts developed response functions for the effects of fires of different intensity levels on HVRAs with scoring to represent negative and beneficial effects (from −100 to +100). Fire likelihood and intensity were derived from simulation modelling, and the combination equated fire risk.
There are also subjective assessments of impacts by experts performed in a Canadian operational context. A model was developed to determine the cumulative risk of fire and negative impacts in one area of the Canadian province of Alberta (B. A. Blackwell, B. Baines, pers. comm.). The model asked experts to evaluate and score negative impacts (from 0 to 10) in several categories. Risk was evaluated by combining this impact assessment with a fire likelihood assessment, which was produced by a fire ignition and growth simulation model. In another study, the SWMB (SWMB, pers. comm.) developed a model that defined the expert-judged impact as the product of scores for degree, extent and duration of impact. This was done separately for each potential health, economic and social consequence. The degree, extent and duration scores are based on whether a consequence was negligible, low, moderate or high, with corresponding scores of 0 to 3, 0 representing no impact.
Compared with these modelling approaches, expertise-based decision-making is distinct in handling impacts. It is used in situations that have an adequate degree of regularity of system behaviour where decision-makers employ recognition-primed decision-making, which is when a person assess the situation in a holistic manner and often does not complete explicit comparison of alternatives (Kahneman and Klein 2009). Additional information about impacts can be used to improve the expert decision-makers’ situational awareness, thus assisting them in their decision-making processes. This support is particularly important in a complex, uncertain and variable system such as fire management (Sherry et al. 2019).
Methods
Our methodology for RamPART quantifies impacts in a systematic and consistent fashion to support fire response decision-making. Our method was adapted from several sources (Foley and Johnson 1988; Morton et al. 2003; San-Miguel-Ayanz et al. 2003; Black and Opperman 2005; Hardy 2005; Mercer and Prestemon 2005; Hyde et al. 2013; Scott et al. 2013; Taber et al. 2013; Thompson et al. 2013; B. A. Blackwell, B. Baines, pers. comm.; SWMB, pers. comm.). RamPART consists of the following five components (also see Fig. 1):
-
Selecting the RAs to assess
-
Categorising impacts with high-level aggregation
-
Scoring the potential impacts numerically and on a common scale
-
Weighting the impact categories
-
Calculating, classifying and mapping the category impacts and full impacts.

|
Part 1. Selecting the RAs to assess
RamPART uses spatial data about RAs that can be affected by fire resulting in negative impacts. Although this may appear to be straightforward conceptually, selecting the RAs calls for expert judgement (e.g. Calkin et al. 2010; Scott et al. 2013; Thompson et al. 2013). RAs are necessarily limited to those with available data in the provincial data warehouse (OMNRF 2019) and to data layers assembled and maintained internally by fire program staff for use in fire management work. It is not feasible or desirable to include all available digital geospatial data. There are hundreds of fields in the provincial data warehouse that would become a burden to elicit impact scores for, and in some cases the RA would be redundant. To ensure the RAs selected are appropriate to the task, like Scott et al. (2013), OMNRF staff with expertise in fire response, geographic information systems (GIS), software development, fire science and analytics identified the RAs for inclusion in the model.
Part 2. Categorising impacts with high-level aggregation
The effects of fire and the resulting impacts vary greatly in number and magnitude from fire to fire. For example, if a large stand of trees burns, the harvest plan must be revised, and wildlife habitat will change over time, causing different benefits or harms to different wildlife species. If a fire interrupts electricity transmission, it disrupts individual and group activities to differing degrees for varying durations. The total impact can be thought of as the degree of impact (e.g. severity of the impact per person per day) multiplied by the extent of the impact (e.g. number of people) multiplied by the duration of impact (e.g. number of days) (as in SWMB, pers. comm.).
Assembling information at such a high level of detail would, however, be difficult from a data collection and modelling perspective. Processing and comprehending such finely divided information to support decision-making would also be difficult. During real-time fire response decision-making (e.g. to prioritise multiple fires for initial attack), little time is available, and even a moderate amount of detail becomes impractical to consider. Furthermore, there is usually high uncertainty in fire behaviour and suppression outcomes and therefore effects and impacts. In the pre-fire expert elicitation process, more time is available, but the problems of comprehension and uncertainty remain. To make the problem tractable, we used a highly aggregated representation of impacts at a low level of detail.
Categorising impacts in this way has two benefits. First, expert elicitation is easier because the experts can reduce complexity by separately considering subsets of the many effects and corresponding impacts. Second, impacts can be assessed separately for each category of impact or in aggregate when using the results. Note that fires that affect RAs can have impacts in more than one category. For example, a fire that affects an airport can have social impacts (disruption of travel for pleasure) and economic impacts (disruption of travel for work and transportation of cargo).
In the literature, categories of impacts vary in terms of numbers of categories, types and levels of detail, for example, social, economic, ecological, ecosystem, geosystem, fire management, society (Morton et al. 2003; Hardy 2005; Mercer and Prestemon 2005). Several Canadian fire management agencies were canvassed (British Columbia, Alberta, Saskatchewan and Ontario) for operational processes used for impact and risk assessment. The level of detail and number of types of impacts that were assessed varied across agencies, with the types of impacts varying from specific human life to broader social, economic and ecological impacts. Some operational processes combined effects with impacts (e.g. private property, species at risk, water quality, habitat and infrastructure). The design and selection of categories in both literature and fire management agencies are typically based on priorities, preference and practicality.
Part 3. Scoring the potential impacts numerically and on a common scale
Within each impact category, the relative magnitude of the impacts must be represented on a common fixed numerical scale. Using an ordinal range is common, although the scale may differ between applications (e.g. Foley and Johnson 1988; Calkin et al. 2010; Chuvieco et al. 2010; Scott et al. 2013; Thompson et al. 2013; B. A. Blackwell, B. Baines, pers. comm.; SWMB, pers. comm.).
Expert judgment is used to quantify the impacts on each RA on this scale. The Delphi technique is a widely accepted way to gather data from domain experts to elicit their judgements and reach a consensus (Hasson et al. 2000; Hsu and Sandford 2007). This approach uses a set of procedures to elicit and refine the opinions from a group of people when there are insufficient data available to reach a more objective assessment (de las Heras et al. 2007) and has been used in areas of wildland fire research such as fire prevention (de las Heras et al. 2007). The Delphi technique has three main features: (1) anonymous questionnaires are used to gather opinions; (2) participants iterate between answering questionnaires and receiving feedback; and (3) the exercise terminates when predetermined criteria are met, e.g. three rounds (Cantrill et al. 1996).
Ideally, the Delphi technique is performed by people with experience with the relevant range of knowledge for the situation or question at hand. Assessing the impacts from wildland fires requires a very diverse range of experience and no one individual has all the relevant experience, but ideally the group of experts should.
Part 4. Weighting the impact categories
Within each impact category, scoring is relative on a fixed numerical scale. The score for each impact category is then individually assigned a weight representing the relative importance of that category compared with the other categories. This weighting is essential when impacts across multiple categories of RAs are combined to calculate the full impacts across the area of interest; this enables impacts to be conceptualised and mapped as a simple integrated measure (as in Scott et al. 2013). To determine the weights, we used the analytic hierarchy process (AHP) (Saaty 1980), which rates the relative magnitudes of impacts through a series of pairwise comparisons.
There are instances where a respondent can produce inconsistent rankings in an AHP because judgement is not always consistent. For example, an expert assesses that the economic impact is more important than social impact, and social impact is more important than emergency response impact. Inconsistency arises if the expert considers the emergency response impact as more important than economic impact (see Saaty and Vargas 2012).
In addition to the pairwise weights, AHP also can facilitate aggregation from individual respondents into an overall weighting scheme (e.g. Forman and Peniwati 1998). In practise, weighting impacts across multiple people is difficult, but rather than discard any inconsistent responses, we incorporate the inconsistency score to weight the individual responses. The more consistent a respondent was, the more influence their choices will have on the overall weighting.
Part 5. Calculating, classifying and mapping the category impacts and full impacts
The impact model has three basic assumptions:
-
Linearity of impacts in the affected RAs: the impact from fire on an RA is linearly proportional to the amount of the RA affected. For example, the economic impact of a fire of a given intensity that burns 6 ha of commercial timber is three times the impact of a fire that burns 2 ha of the same forest.
-
Linear additivity of the impacts to RAs within impact categories: the impact from a fire that affects multiple RAs equals the sum of the impacts from the effects on each individual RA. For example, the total economic impact of a fire that burns both 6 ha of commercial timber and a structure is calculated as the economic impact of burning 6 ha of commercial timber plus the economic impact of burning a structure.
-
Weighted additivity of the impacts between impact categories: the full impact of a fire equals the sum of the social, economic and emergency response impacts, each multiplied by a corresponding weight.
As the impacts are assumed to be linear for the affected RAs and because the impact scores are expressed relative to each other on a common scale, the physical units of the RAs must be specified to calculate impact scores.
-
Count of RAs represented as point data (e.g. 1 building, 1 airport)
-
1 km of RAs represented as linear data (e.g. 1 km of railway, 1 km of transmission line)
-
100 ha of RAs represented as areal data (e.g. 100 ha of provincial park, 100 ha of commercial timber).
An area must be defined to calculate impact within it, for example a grid cell of some dimension or other polygon that is suited to the purpose.
Categorising numerical models for interpretation is common. For example, the indices of the Canadian Fire Weather Index (FWI) System (Van Wagner 1987) are often categorised into levels from low to extreme for providing public fire information and for internal fire management operational uses (Stocks 1971). These are mapped daily for briefings and preparedness planning. Mapping impact requires a similar categorisation for a consistent province-wide classification system that covers the wide range of impact magnitudes.
The number of classes depends on the level of detail needed and how much a person can interpret given the time needed to make a decision. For example, a continuous gradient will show a lot of nuanced detail; however, four to six categories are typical in fire management spatial products for rapid assessment of ‘low–extreme’ (Stocks 1971; Alexander 1982; Forestry Canada Fire Danger Group 1992).
There are two technical issues to note where adjustment may need to be made:
-
Fractional cells whose area differs from other cells (e.g. at a jurisdictional boundary). The total impact per cell needs to be divided by the cell area in these cases.
-
A portion of a cell has no resources accounted for (such as a cell consisting of 75% water with the RAs concentrated in the remaining 25% of land). In this case, impact density on the land is not represented, as the model does not resolve the spatial distribution of RAs within cells.
Results
The outcomes of the application of the RamPART model in Ontario, using all five model components (Fig. 1), are outlined in this section.
Part 1. Selecting the resources and assets to assess
A meeting of OMNRF specialists with expertise in fire response, GIS, software development, wildland fire science and analytics was held to select RAs. RAs include those currently used in OMNRF situational awareness maps and operational effect and impact assessment processes. Data were derived from existing information (OMNRF 2019) except for three fields that were created to improve our representation of factors that are important for fire response, namely rail and road evacuation routes and single-path transmission lines. Ultimately, 42 RAs were selected for inclusion in the model (Table 2).

|
Part 2. Facilitating elicitation by using high-level aggregation and impact categories
Three categories of impact were selected by the authors: social, economic and emergency response impacts. Impact categories and definitions were adapted for RamPART from several sources (e.g. Morton et al. 2003; San-Miguel-Ayanz et al. 2003; Black and Opperman 2005; Hardy 2005; Mercer and Prestemon 2005; Hyde et al. 2013; Scott et al. 2013; Thompson et al. 2013; SWMB, pers. comm.).
-
Social impacts generally refer to non-market changes, such as in a community’s social fabric and the wellbeing of individuals and families. Examples include the consequences from losses of aesthetic and scenic beauty, recreation access and cultural uses.
-
Economic impacts generally refer to changes of the commercial worth of property and resources, of economic activity, of employment and of income. Examples include the cost of private property loss, infrastructure loss and business activity interruption.
-
Emergency response impacts refer to disruption of the ability to respond to wildland fires or other incidents (e.g. health emergencies) and related activities such as evacuations. Examples include the negative consequences resulting from a restriction or blockage of single-path evacuation routes for remote populations, damage to or disruption of Ontario’s Aviation Forest Fire and Emergency Services response infrastructure, loss of fire response fuel caches, and disruption of aircraft use. These could be viewed as social and economic impacts. However, we decided to create this category to be able to identify and better represent impacts to the normal functioning and efficiency of the fire management agency.
In this model, ecological impact is considered through the lens of its economic and social impacts. For example, from the perspective that our society cares about the state of the environment in terms of its functioning, its resemblance to its historic state, and its existence, people judge environmental state to have worth, so a change in its state caused by fire can readily be categorised as a social impact.
Part 3. Scoring the potential impacts numerically and on a common scale
The Delphi technique was employed and it consisted of three rounds of anonymous surveys plus feedback and discussion to reach a consensus on the impact scores. In each round, the respondents scored the potential social, economic and emergency response impacts for each RA from the perspective of the protection and stewardship roles required by the government. The first survey was open to OMNRF response staff at and above the rank Fire Management Technician and was completed by 47 respondents. We adopted a range of 0 (negligible) to 10 (greatest impact).
Next, we held a workshop with a 16-member subset of OMNRF staff from the initial group, all of whom were experts in wildland fire response decision-making or policy. Workshop participants received two forms of feedback to encourage reassessment of their judgements, working towards a consensus. One was the frequency distribution of scores from the previous survey results. The other was a series of real-world impact assessment scenarios to foster thinking about personal experiences with how wildland fire responses are prioritised, particularly with respect to the various RAs. After receiving this feedback, workshop participants completed the survey a second time. After completion, we showed participants the responses from the first two surveys and together discussed the differences between them. Finally, we administered the survey to all 16 participants for a third time. All surveys were completed anonymously. We used the median scores from the third survey to calculate the potential impacts per unit. Summaries of the median potential impact scores for each RA are given in Table 2.
We also asked respondents in the first survey to consider how different fire intensities affected RAs and the resulting impacts. We specified three fire intensity classes: low (<500 kW m−1), medium (500 to 2000 kW m−1) and high (>2000 kW m−1). Respondents scored each RA as the percentage of the potential impact realised at each fire intensity. The median percentages from the 47 respondents are also given in Table 2.
Part 4. Weighting the impact categories
To determine the impact category weights using AHP, we held a workshop with seven senior staff comprising Response Management, Regional Duty Officers and Incident Commanders, who worked independently to rate the impact categories through pairwise comparisons. In making the comparisons, each participant judged the relative importance of each impact category. The AHP results showed that economic impacts were least important for all but one respondent (Table 3). The final category weights for social, economic and emergency response impacts were 0.33, 0.25 and 0.42 respectively.

|
Part 5. Calculating, classifying, and mapping impacts
We calculated impacts within cells of a 1-ha grid; this grid dimension was selected to correspond with an OMNRF cellular fire growth model. The following equations were used to calculate fire impacts in each cell.
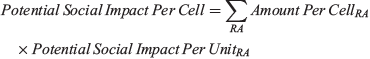
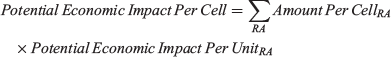
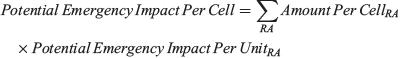
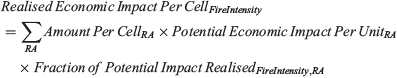
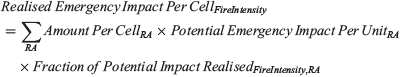
Potential impact: the potential impact in a cell for each impact category is calculated from the number of units of each RA in the cell and the potential impact per unit:
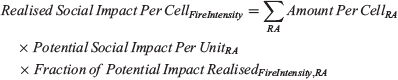
Realised impact: the realised impact in a cell for each impact category is calculated from the amount of each RA in the cell, the potential impact per unit, and the fraction of the potential impact realised by a fire of a given intensity:
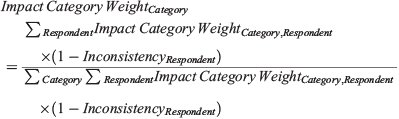
The impact category weights are the average of the impact category weights across all respondents, weighted by the consistency of each respondent:
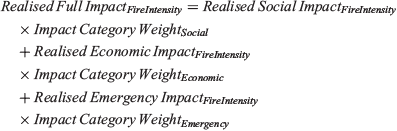
The realised full impact (for a given fire, cell, or unit of RA) is calculated using the above impact category weights:
The calculated impact for cells, fires and areas are arbitrary, unitless numbers. To facilitate interpretation of the impacts, the results are mapped, with the impact magnitudes grouped into six colour-coded classes: 0 to 1, >1 to 2.5, >2.5 to 5, >5 to 10, >10 to 40 and >40. The number and breakpoints of impact classification were designed with help from OMNRF fire management experts having been shown seven case studies of RamPART applied in Ontario and considering both the impact scores per unit for individual RAs and the total impact score potential in a 1-ha cell (an example of the 1-ha impact score grid is shown in Fig. 2).

|
Validation
We investigated RamPART performance two ways: (1) comparison between the ranking of fire priorities using RamPART with a previous, independent prioritisation training exercise completed by the OMNRF; and (2) a retrospective analysis between RamPART impact levels and historical response decisions to either suppress or monitor fires.
Validation 1: comparing the suppression priority rank of fires from RamPART with an OMNRF prioritisation training exercise
A previous OMNRF prioritisation training exercise involved simulating a situation where fire suppression capacity was insufficient for the current fire workload. In that exercise, OMNRF staff ranked the priority of three simulated fires (Table 4). Staff considered information such as the predicted fire behaviour, the probability of fire spread beyond current simulated perimeters, the RAs present, the effect of fire, and the resulting impacts. This emulated the kind of work that OMNRF staff routinely do during actual fire response operations.

|
Those same three locations were then processed with RamPART. The present work could not explicitly consider probabilities of further spread or fire intensities, so we used the potential rather than the realised impacts. We processed the simulated fire perimeters that were used in the exercises plus an additional 16-km buffer (adapted from the community protection area buffers used operationally by Ontario; OMNRF 2004) reflecting the potential for fire spread. For each fire, we calculate RamPART’s potential social, economic, emergency response and full potential impacts within that area. The fires were then ranked based on the potential full impact within the area (i.e. summing all 1-ha cells) (Table 4). Rankings produced from both approaches were in agreement, which supports model validity.
Validation 2: spatial correspondence between RamPART impact levels and historical responses
Presumably, potential impacts of a fire would have driven (at least in part contributed to) the historical decisions on whether to suppress or monitor a fire; therefore, in this validation, we performed a retrospective logistic regression analysis where the response variable was whether a fire received full suppression (1) or not (0), and the predictor variable was the RamPART potential full impact within the area of the fire. This validation was performed in the area of Quetico Provincial Park, a 4760-km2 wilderness park in north-western Ontario, Canada. The fire management plan of the park allows fires to be monitored rather than suppressed under specific burning conditions and fire behaviour and when there is a lack of threat to nearby RAs (OMNRF 2009).
Data for historic suppressed fires (Fig. 3) and monitored fires (Fig. 4) were obtained from the OMNRF fire archive for 2004 to 2017. For comparison, Fig. 3 and Fig. 4 also show the fire densities for the entire fire administrative unit that contains the park. Within the park, many fires were either monitored (80 fires) or suppressed (73 fires), whereas fires outside the park were primarily suppressed. RamPART impact levels were calculated using the potential full impact, instead of the realised impact owing to the lack of fire intensity data. To enable spatial analysis, hexagonal polygons were used for data aggregation (16 627 ha; 16 km wide, reflecting the same scale of community protection areas as in the first validation). Hexagons are used in Ontario’s Landscape Tool (Elkie et al. 2013) for visualising spatial information at a variety of scales. In each hexagon, historic fires were aggregated as density of fire ignitions, and the impact scores on the 1-ha grid were aggregated as a sum (Fig. 5).

|

|

|
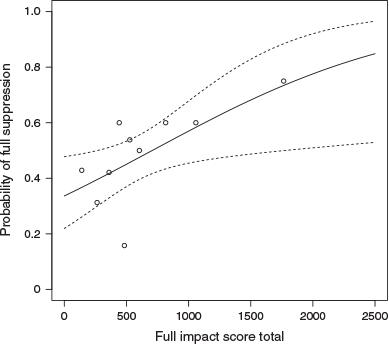
The fitted logistic regression model was statistically significant and indicates a positive relationship (intercept −0.67945, s.e. 0.30106, P value 0.0240; regression coefficient for the total impact score 0.00096, s.e. 0.00042, P value 0.0227), with the probability of full suppression increasing with the impact score (Fig. 6).
|
To visually assess the goodness of fit of the logistic regression model, we partitioned the impact level into 10 ordinal categories, with bins determined by deciles (i.e. anything below the 10th percentile of the impact level variable was category 1, anything between the 10th and 20th percentile was category 2, etc.). Within each of these categories, we calculated the empirical proportion of fires that received full suppression. These points were then plotted with the fitted logistic regression model. The fitted model and those empirical proportions both followed a similar trend: the probability of full suppression increases as a function of RamPART potential full impact.
This analysis demonstrates a statistically significant association between historical response decisions to suppress v. monitor fires and our RamPART potential full impact and this provides additional quantitative support for the validity of the RamPART model.
Discussion
Comparison with other impact assessment approaches
The methods from Scott et al. (2013) are advantageous in that they effectively handle positive and negative impacts, whereas the RamPART model used here only considers negative impacts. Further, Scott et al. (2013) go beyond impacts and present a complete framework for the quantitative characterisation of wildfire risk including likelihood, fire intensity, exposure and vulnerability.
We note that our method and the method of Scott et al. (2013) both produce total impact and impact per unit (terminology differs). However, there are significant differences between these two approaches. In the approach of Scott et al., for each category of RAs, they explicitly elicit the total impact for the entire analysis area. That total impact is then, by elicitation, apportioned to subcategories. Their algorithm then calculates impact per acre by dividing by the number of acres of each subcategory in the analysis area. In contrast, in our approach, we elicit impact per physical unit of each RA (count, 1 km or 100 ha). Our algorithm calculates total impact by multiplying by the amount (number or size) of entities in each cell in the province. That is, Scott et al. use a top–down approach, and RamPART uses a bottom–up approach.
Although the end results of the two approaches are equivalent arithmetically, they differ in terms of what can reasonably and reliably be elicited from experts for a large jurisdiction such as Ontario. Consider eliciting the full impact of the loss of all of RAs such as the tens of thousands of kilometres of electricity transmission lines and the hundreds of thousands of structures in an area larger than France. These large-scale losses are beyond the local scale impact that an individual can be expected to evaluate, and doing so is unnecessary in any case because they are well outside the range of what can happen. For a large jurisdiction such as Ontario, the benefits of RamPART’s bottom–up approach are:
-
Impacts are imagined on a small, physical scale for individual RAs, which is within the scope of experience of fire managers
-
Adding RAs or additional impact categories can be handled by additional elicitations for these, without needing to redo the existing elicitations
-
Elicitation is not location-specific, so it can be easily extended to other areas of interest by integrating the appropriate spatial datasets.
Furthermore, though both approaches used elicitation methods to determine impacts, we employed a Delphi technique in the RamPART model, thus imparting the benefit of response anonymity. Anonymity is beneficial in that it mitigates the bias introduced in group settings, such as the bandwagon effect, or deference to the opinion of a person with authority or to ‘the loudest person in the room’. Another benefit is that the respondents do not need to be physically brought together, thus lowering costs and increasing participation from a broader group of experts.
In fire management, a variety of methods of assessing impacts do exist, including helicopter flyovers, GIS maps and remote imagery, fire management plans, and economic valuation. In certain applications, RamPART can be more suitable for use than these traditional methods of assessing impacts (Table 1). Compared with the other methods, expert elicitation is highlighted here as a fairly easy, simple and low-cost method of supporting a variety of fire management decisions.
Future work and limitations
We plan to use RamPART in Ontario as part of a real-time risk-assessment system, Fire Growth Under Uncertainty for Appropriate Response (FireGUARD), that will combine RamPART’s impact maps with a burn probability map (e.g. Finney et al. 2011), thereby yielding a risk indicator (where risk = impact × likelihood).
In its current form, RamPART has limitations. First, the model depends on the availability of digital geospatial data on RAs, which is not as complete and current as desired for Ontario. Data acquisition, maintenance and enhancement are ongoing processes, yet decisions must be made now, and they are made based on the available data. In this study, we excluded some datasets from our analysis. We did this (1) to make the evaluations feasible for the experts who participated in our study, and (2) to focus on the key point, linear and areal features as listed in Table 2. We note that some other datasets could be useful for meeting different needs (e.g. wildlife conservation based on species-range data), and that our elicitation approach can easily be adapted to determine impact scores for such data to meet those needs. We are exploring the use of additional information sources such as those described by Johnston and Flannigan (2018) and the use of automated image processing.
A second limitation of the current version of RamPART arises from how impacts are currently represented. For example, transmission lines are scored based on the impact per unit length, but real-world impacts could be much higher because of downstream impacts on settlements. Future refinements of the representation of such offsite impacts are planned. Representation of smoke impacts is another important offsite impact that is not currently addressed. We plan to enhance fire growth modelling in FireGUARD by modelling smoke dispersal, after which it will be possible to introduce representation of offsite smoke impacts. Related to these offsite impacts are nearby impacts. For example, a fire coming near (but not directly damaging) homes can still result in effects when residents are evacuated. Risk in FireGUARD is calculated using just the direct impacts, with risk as the likelihood multiplied by impact, so in the example, the risk is zero (because there was no direct effect). We will therefore extend RamPART to elicit these kinds of proximate impacts and apply them to areas near fires.
Finally, wildland fire plays an important role in the natural functioning of wildlands (Moritz et al. 2014; Smith et al. 2016). This role can be considered a positive impact. RamPART currently represents only negative impacts; work is actively under way to extend the model and assessment process to account for the beneficial impacts of fire. This will require us to adapt the impact categories (e.g. ecological), expand the range of expertise used in the assessments, and perform additional modelling to reconcile conflicting preferences for locations where there are both negative and positive impacts.
Conclusions
Our objectives were to develop a process for eliciting impact scores and a model for summarising these scores across categories that can assist and inform operational fire management staff in their decision-making. Impact assessment requires the expertise of fire management staff, inclusion of local knowledge and the interests of stakeholders. However, we have produced a comprehensive model and process that provides practical support for fire response decision-making in real time. Our innovative approach can be easily implemented, used operationally and kept up to date at modest cost.
Conflicts of interest
The authors declare no conflicts of interest.
Acknowledgements
Support from the OMNRF and the participants of the Delphi surveys is gratefully acknowledged. We acknowledge the support of the Natural Sciences and Engineering Research Council of Canada (NSERC) (funding reference no. RGPIN-2015–04221). From the OMNRF, we thank B. Cole, R. Frech and A. Tithecott for support; J. Evens, M. Corbett, R. McAlpine, D. Pajunen and A. Stacey for technical assistance; K. DeMars and A. Reid for assistance with the Delphi workshops and case studies; B. Russo for preparing data, figures and editing; and D. Johnston and D. McLarty for insight and editorial assistance. From the University of Toronto, we thank D. Martell for helpful conversations. We also thank the Wildfire Management Branches from Alberta Agriculture and Forestry and the Saskatchewan Ministry of the Environment for sharing information about their impact assessment initiatives. G. Hart is thanked for editorial work. Finally, we thank the anonymous referees whose detailed and comprehensive comments and suggestions greatly contributed to the final form of this paper.
References
Alexander ME (1982) Calculating and interpreting forest fire intensities. Canadian Journal of Botany 60, 349–357.| Calculating and interpreting forest fire intensities.Crossref | GoogleScholarGoogle Scholar |
Baumgartner DC, Simard AJ (1982) Wildland fire management economics: a state of the art review and bibliography. USDA Forest Service, North Central Forest Experiment Station, General Technical Report NC-72. (Saint Paul, MN, USA)
Bingham G, Bishop R, Brody M, Bromley D, Clark E, Cooper W, Costanza R, Hale T, Hayden G, Kellert S, Norgaard R, Norton B, Payne J, Russell C, Suter G (1995) Issues in ecosystem valuation: improving information for decision-making. Ecological Economics 14, 73–90.
Black A, Opperman T (2005) Fire Effects Planning Framework: a user’s guide. USDA Forest Service, Rocky Mountain Research Station, General Technical Report RMRS-163. (Fort Collins, CO, USA) Available at https://www.fs.usda.gov/treesearch/pubs/21174 [Verified 19 June 2019]
Boychuk D, McFayden C (2017) Appropriate response – Ontario’s strategic approach to wildland fire. Canadian Wildland Fire and Smoke Newsletter. (Canada Wildfire: Edmonton, AB, Canada) Available at https://docs.wixstatic.com/ugd/90df79_bfcc500b532a4e38abaa78e1ecfdd26b.pdf [Verified 19 June 2019]
Calkin DE, Ager AA, Gilbertson-Day J (2010) Wildland fire risk and hazard: procedures for the first approximation. USDA Forest Service, Rocky Mountain Research Station, General Technical Report 235. (Fort Collins, CO, USA)
Calkin DE, Thompson MP, Finney MA, Hyde KD (2011) A real-time risk assessment tool supporting wildland fire decision-making. Journal of Forestry 109, 274–280.
Cantrill JA, Sibbald B, Buetow S (1996) The Delphi and nominal group techniques in health services research. International Journal of Pharmacy Practice 4, 67–74.
| The Delphi and nominal group techniques in health services research.Crossref | GoogleScholarGoogle Scholar |
Chuvieco E, Aguado I, Yebra M, Nieto H, Salas J, Martín MP, Vilar L, Martínez J, Martín S, Ibarra P, De La Riva J (2010) Development of a framework for fire risk assessment using remote sensing and geographic information system technologies. Ecological Modelling 221, 46–58.
| Development of a framework for fire risk assessment using remote sensing and geographic information system technologies.Crossref | GoogleScholarGoogle Scholar |
Clemen R, Reilly T (2013) ‘Making hard decisions’, 3rd edn. (Southwestern Publishing Group: Nashville, TN, USA)
Crichton D (1999) The risk triangle. In ‘Natural disaster management’. (Ed. J Ingleton) pp. 102–103. (Tudor Rose: London, UK)
de las Heras J, Salvatore R, Rodrigues MJ, Lovreglio R, Leone V, Giaquinto P, Notarnicola A (2007) Wildfire motivation survey through the Delphi method. In ‘Proceedings: 4th International Wildland Fire Conference’, 13–17 May 2007, Seville, Spain. (Minister of the Environment, Madrid, Spain and Junta de Andalucia, Seville, Spain) Available at http://www.eufirelab.org/toolbox2/library/upload/2301.pdf [Verified 17 July 2019]
Donovan GH, Rideout DB (2003) A reformulation of the cost plus net value change (C+ NVC) model of wildland fire economics. Forest Science 49, 318–323.
Elkie P, Smiegielski A, Gluck M, Elliott J, Rempel R, Kushneriuk R, Naylor B, Bowman J, Pond B, Hatfield D (2013) Ontario’s Landscape Tool. Ontario Ministry of Natural Resources and Forestry, Forest Policy Section. (Sault Sainte Marie, ON, Canada)
Fairbrother A, Turnley JG (2005) Predicting risks of uncharacteristic wildland fires: application of the risk assessment process. Forest Ecology and Management 211, 28–35.
| Predicting risks of uncharacteristic wildland fires: application of the risk assessment process.Crossref | GoogleScholarGoogle Scholar |
Finney MA (2005) The challenge of quantitative risk analysis for wildland fire. Forest Ecology and Management 211, 97–108.
| The challenge of quantitative risk analysis for wildland fire.Crossref | GoogleScholarGoogle Scholar |
Finney MA, Grenfel IC, McHugh CW, Seli RC, Tretheway D, Stratton RD, Brittain S (2011) A method for ensemble wildland fire simulation. Environmental Modeling and Assessment 16, 153–167.
| A method for ensemble wildland fire simulation.Crossref | GoogleScholarGoogle Scholar |
Foley LR, Johnson ER (1988) Alberta’s system for determining fire protection priorities. In ‘The art and science of fire management’. (Eds ME Alexander, GF Bisgrove) Forestry Canada, Northern Forestry Centre, Information Report NOR-X-309, pp. 235–242. (Edmonton, AB, Canada) Available at http://www.cfs.nrcan.gc.ca/pubwarehouse/pdfs/11562.pdf#page=241 [Verified 19 June 2019]
Food and Agriculture Organization of the United Nations (1986) Wildland fire management terminology. FAO Forestry Paper 70. Food and Agriculture Organization of the United Nations, Forest Resources Development Branch. Available at www.fao.org/docrep/016/ap456t/ap456t00.pdf [Verified 19 June 2019]
Forestry Canada Fire Danger Group (1992) Development and structure of the Canadian forest fire behavior prediction system. Forestry Canada, Science and Sustainable Development Directorate, Information Report ST-X-3. (Ottawa, ON, Canada)
Forman E, Peniwati K (1998) Aggregating individual judgments and priorities with the analytic hierarchy process. European Journal of Operational Research 108, 165–169.
| Aggregating individual judgments and priorities with the analytic hierarchy process.Crossref | GoogleScholarGoogle Scholar |
Fried JS, Winter GJ, Gilless JK (1999) Assessing the benefits of reducing fire risk in the wildland–urban interface: a contingent valuation approach. International Journal of Wildland Fire 9, 9–20.
| Assessing the benefits of reducing fire risk in the wildland–urban interface: a contingent valuation approach.Crossref | GoogleScholarGoogle Scholar |
Hardy CC (2005) Wildland fire hazard and risk: problems, definitions, and context. Forest Ecology and Management 211, 73–82.
| Wildland fire hazard and risk: problems, definitions, and context.Crossref | GoogleScholarGoogle Scholar |
Hasson F, Keeney S, McKenna H (2000) Research guidelines for the Delphi survey technique. Journal of Advanced Nursing 32, 1008–1015.
Hsu CC, Sandford BA (2007) The Delphi technique: making sense of consensus. Practical Assessment, Research & Evaluation 12, 1–8.
Hyde K, Dickinson MB, Bohrer G, Calkin D, Evers L, Gilbertson-Day J, Nicolet T, Ryan K, Tague C (2013) Research and development supporting risk-based wildland fire effects prediction for fuels and fire management: status and needs. International Journal of Wildland Fire 22, 37–50.
| Research and development supporting risk-based wildland fire effects prediction for fuels and fire management: status and needs.Crossref | GoogleScholarGoogle Scholar |
Johnston LM, Flannigan MD (2018) Mapping Canadian wildland fire interface areas. International Journal of Wildland Fire 27, 1–14.
| Mapping Canadian wildland fire interface areas.Crossref | GoogleScholarGoogle Scholar |
Kahneman D, Klein G (2009) Conditions for intuitive expertise; a failure to disagree. The American Psychologist 64, 515–526.
| Conditions for intuitive expertise; a failure to disagree.Crossref | GoogleScholarGoogle Scholar | 19739881PubMed |
Kaval P, Loomis J, Seidl A (2007) Willingness-to-pay for prescribed fire in the Colorado (USA) wildland urban interface. Forest Policy and Economics 9, 928–937.
| Willingness-to-pay for prescribed fire in the Colorado (USA) wildland urban interface.Crossref | GoogleScholarGoogle Scholar |
Kent B, Gebert K, McCaffrey S, Martin W, Calkin D, Schuster E, Martin I, Bender HW, Alward G, Kumagai Y, Cohn PJ, Carroll M, Williams D, Ekarius C (2003) Social and economic issues of the Hayman Fire. In ‘Hayman Fire case study’. (Ed. RT Graham) USDA Forest Service, Rocky Mountain Research Station, General Technical Report RMRS-GTR-114, pp. 315–395. (Ogden, UT, USA)
Martell DL (2015) A review of recent forest and wildland fire management decision-support systems research. Current Forestry Reports 1, 128–137.
| A review of recent forest and wildland fire management decision-support systems research.Crossref | GoogleScholarGoogle Scholar |
Mercer DE, Prestemon JP (2005) Comparing production function models for wildland fire risk analysis in the wildland–urban interface. Forest Policy and Economics 7, 782–795.
| Comparing production function models for wildland fire risk analysis in the wildland–urban interface.Crossref | GoogleScholarGoogle Scholar |
Miller C, Ager AA (2013) A review of recent advances in risk analysis for wildfire management. International Journal of Wildland Fire 22, 1–14.
| A review of recent advances in risk analysis for wildfire management.Crossref | GoogleScholarGoogle Scholar |
Minas JP, Hearne JW, Handmer JW (2012) A review of operations research methods applicable to wildfire management. International Journal of Wildland Fire 21, 189–196.
| A review of operations research methods applicable to wildfire management.Crossref | GoogleScholarGoogle Scholar |
Moritz MA, Batllori E, Bradstock RA, Gill AM, Handmer J, Hessburg PF, Leonard J, McCaffrey S, Odion DC, Schoennagel T (2014) Learning to coexist with wildfire. Nature 515, 58–66.
| Learning to coexist with wildfire.Crossref | GoogleScholarGoogle Scholar | 25373675PubMed |
Morton DC, Roessing ME, Camp AE, Tyrrell ML (2003) Assessing the environmental, social, and economic impacts of wildfire. Yale University, School of Forestry and Environmental Studies, Global Institute of Sustainable Forestry Research Paper 001. (New Haven, CT, USA) Available at https://gisf.yale.edu/sites/default/files/files/wildfire_report(1).pdf [Verified 19 June 2019]
OMNRF (2004) Forest fire management strategy for Ontario. (Queen’s Printer for Ontario: Toronto, ON, Canada)
OMNRF (2009) Quetico forest fire management plan. Ontario Parks. Available at http://www.ontla.on.ca/library/repository/mon/23007/294230.pdf [Verified 19 June 2019]
OMNRF (2014) Wildland fire management strategy. (Queen’s Printer for Ontario: Toronto, ON, Canada)
OMNRF (2019) Land Information Ontario (LIO). Available at https://www.ontario.ca/page/land-information-ontario [Verified 19 June 2019]
Parks GM (1964) Development and application of a model for suppression of forest fires. Management Science 10, 760–766.
| Development and application of a model for suppression of forest fires.Crossref | GoogleScholarGoogle Scholar |
Reinhardt ED, Keane RE, Brown JK (2001) Modeling fire effects. International Journal of Wildland Fire 10, 373–380.
| Modeling fire effects.Crossref | GoogleScholarGoogle Scholar |
Ryan K, Elliot WJ (2005) Fire effects and soil erosion models. Wildland fire in ecosystems: effects of fire on soils and water. USDA Forest Service, Rocky Mountain Research Station, General Technical Report RMRS-GTR-vol. 4. (Ogden, UT, USA)
Saaty TL (1980) ‘The analytic hierarchy process: planning, setting priorities, resource allocation.’ (McGraw-Hill: New York, NY, USA)
Saaty TL, Vargas LG (2012) ‘Models, methods, concepts and applications of the analytic hierarchy process.’ (Kluwer Academic Publishers: Boston, MA, USA)
San-Miguel-Ayanz J, Carlson JD, Alexander M, Tolhurst K, Morgan G, Sneeuwjagt R, Dudley M (2003) Current methods to assess fire danger potential. In ‘Wildland fire danger estimation and mapping. The role of remote sensing data’. (Ed. E Chuvieco) pp. 21–61. (World Scientific Publishing: Singapore)
Scott JH (2006) An analytical framework for quantifying wildland fire risk and fuel treatment benefit. In ‘Fuels management – how to measure success: conference proceedings’, 28–30 March 2006, Portland, OR, USA. (Eds PL Andrews, BW Butler) pp. 169–184. (USDA Forest Service: Washington, DC, USA) Available at https://www.fs.usda.gov/treesearch/pubs/25944 [Verified 17 July 2019]
Scott JH, Thompson MP, Calkin DE (2013) A wildland fire risk assessment framework for land and resource management. USDA Forest Service, Rocky Mountain Research Station, General Technical Report RMRS-GTR-315. (Ogden, UT, USA)
Sherry J, Neale T, McGee TK, Sharpe M (2019) Rethinking the maps: a case study of knowledge incorporation in Canadian wildfire risk management and planning. Journal of Environmental Management 234, 494–502.
| Rethinking the maps: a case study of knowledge incorporation in Canadian wildfire risk management and planning.Crossref | GoogleScholarGoogle Scholar | 30641360PubMed |
Simard AJ (1976) Wildland fire management the economics of policy alternatives. Environment Canada, Canadian Forestry Service, Forest Fire Research Institute, Technical Report 15. (Ottawa, ON, Canada)
Smith AM, Kolden CA, Paveglio TB, Cochrane MA, Bowman DM, Moritz MA, Kliskey AD, Alessa L, Hudak AT, Hoffman CM (2016) The science of firescapes: achieving fire-resilient communities. Bioscience 66, 130–146.
| The science of firescapes: achieving fire-resilient communities.Crossref | GoogleScholarGoogle Scholar | 29593361PubMed |
Stocks BJ (1971) Analysis of the Fire Weather Index in Ontario (1963 to 1968). Canadian Forestry Service Internal Report 0–23. (Sault Sainte Marie, ON, Canada)
Taber MA, Elenz LM, Langowski PG (2013) Decision-making for wildland fires: a guide for applying a risk management process at the incident level. USDA Forest Service, Rocky Mountain Research Station, General Technical Report RMRS-GTR-298. (Fort Collins, CO, USA)
Thomas PA, McAlpine RS (2010) ‘Fire in the forest.’ (Cambridge University Press: New York, NY, USA)
Thompson MP, Scott J, Helmbrecht D, Calkin DE (2013) Integrated wildland fire risk assessment: framework development and application on the Lewis and Clark National Forest in Montana, USA. Integrated Environmental Assessment and Management 9, 329–342.
| Integrated wildland fire risk assessment: framework development and application on the Lewis and Clark National Forest in Montana, USA.Crossref | GoogleScholarGoogle Scholar | 22987567PubMed |
Van Wagner CE (1987) Development and structure of the Canadian Forest Fire Weather Index System. Government of Canada, Canadian Forestry Service, Forestry Technical Report. (Ottawa, ON, Canada)
Vaux HJ, Gardner PD, Mills TJ (1984) Methods for assessing the impact of fire on forest recreation. USDA Forest Service, Pacific Southwest Forest and Range Experiment Station, General Technical Report PSW-079. (Berkeley, CA, USA)
Winston W (2003) ‘Operations research: applications and algorithms, 4th edn.’ (Duxbury Press: Boston, MA, USA)
Xi DD, Taylor SW, Woolford DG, Dean CB (2019) Statistical models of key components of wildfire risk. Annual Review of Statistics and Its Application 6, 197–222.