

Numerical simulation of aerial liquid drops of Canadair CL-415 and Dash-8 airtankers
Corentin Calbrix A B , Alexei Stoukov A , Axelle Cadiere B , Benoit Roig B and Dominique Legendre A *A
B
Abstract
Airtankers are able to drop volumes of liquid (suppressant or fire retardant) varying from less than 1 m3 to several tens of cubic metres directly on a fire or with the objective to form barriers of retardant to stop or reduce fire propagation.
The objective of this work is to demonstrate that Computational Fluid Dynamics can be used to provide a deep understanding of liquid fragmentation and dispersion when liquid is dropped from an aircraft.
A numerical investigation based on the Volume of Fluid method is used for the analysis of airtanker performance and applied here to the biggest airtankers used in Europe: the Canadair CL-415 and Dash-8.
Numerical simulations are used to provide an accurate description of tank discharge as well as to study liquid ejection, fragmentation and atomisation in air. From the results, the vertical penetration and lateral expansion of the liquid are described using simple modelling.
From the numerical simulation, the main characteristics of liquid atomisation and dispersion in air are described and modelled.
Computational Fluid Dynamics is an efficient tool that may help to optimise airtanker performance.
Keywords: aerial drop, airtanker, Canadair CL-415, Computational Fluid Dynamics (CFD), Dash-8, drop pattern, fluid mechanic, liquid atomisation and dispersion, tank discharge.
Introduction
Fighting wildland fires is a major issue for the protection of populations and environment. Since the 1950s, water-bomber aircraft have been developed and are able to drop volumes of liquid (water, suppressant or fire retardant) varying from less than 1 m3 to several tens of cubic metres, directly on fire or to establish barriers of retardant to stop or reduce fire propagation. Airtankers are often civilian or military airplanes converted using external or internal delivery systems, with dropping methods and systems developed empirically.
Airtanker performance is usually tested with the cup and grid method (Suter 2000) developed by the USDA Forest service in the USA and by the Centre d’Essais et de Recherche (CEREN) in Valabre, France. The airtanker drops liquid over a flat field with no vegetation where cups are distributed in a grid to collect the liquid. Depending on drop conditions and systems, the resulting liquid deposit can present some irregularities, resulting in zones of large concentration of product separated by zones of lower concentration, which offer lower protection against fire (Plucinski and Pastor 2013). The origin of this non-uniform deposit can be directly related to large-scale instabilities that develop during fragmentation of the liquid in air, as observed on videos. The fragmentation process in air should be optimised while minimising liquid dispersion to increase concentration on the ground. However, using the cup and grid method is time-consuming and expensive. It also reveals the airtanker performance after delivery system integration into the aircraft. If the airtanker performance is not good enough to pass certification for operating, solutions for improving the system can then require tank and/or aircraft structure modifications that significantly increase the cost of the solution and delay its commissioning. Efficient tools for tank design before their integration into the aircraft must therefore be developed.
Drop pattern data are also used to produce practical guides for fire agencies to discuss the effectiveness of airtanker drops and to compare different airtanker types (McFayden et al. 2023). Understanding the process of liquid atomisation and dispersion in air is of interest to understand differences in effectiveness and provide appropriate recommendations.
However, the dynamics of a fluid dropped from an airplane has received little attention in the recent scientific literature (Rimbert 2003; Ito et al. 2010; Amorim 2011; Legendre et al. 2014; Qureshi and Altman 2018; Zhao et al. 2018). Newtonian liquid jets from millimetric injectors in cross-flow have been extensively studied for combustion applications (Broumand and Birouk 2016). For airtankers, the size of the delivery system doors is of the order of 1 m, thus three orders of magnitude larger, resulting in fragmentation and atomisation over a larger range of spatial scales, with the driving effect of gravity resulting in the development of Rayleigh–Taylor instabilities (Rayleigh 1883; Abarzhi 2010). Understanding the development of these instabilities as well as proposing control methods to reduce their impact on liquid deposition on the ground is a major issue that still needs to be investigated. Few models integrating the full process from tank discharge up to liquid deposition on vegetation have been developed. The Aerial Drop Model (ADM) recently developed by Amorim (2008, 2011) is divided into four modules to address the entire process. A wind-flow module provides the air flow considering the canopy. The break-up module provides the droplet size distribution based on modelling obtained for millimetric liquid jets in a cross-flow. The deposition module calculates the motion, distortion and secondary break-up of the droplets through a trajectory equation solved considering the wind conditions provided by the wind-flow module and using experimental correlations for the drag force and break-up criteria. The great interest in such an approach is to provide near-real-time simulations of aerial drops. However, it is based on empirical results obtained mostly in situations not representative of fragmentation of a liquid volume over such a large range of sizes (from the aircraft tank to the smallest droplets). Thus, improvement of models such as the ADM is required to make progress in understanding the mechanisms involved when a liquid is dropped by an airtanker.
For that purpose, Computational Fluid Dynamics (CFD) that allows liquid evolution after its exit from the tank to be solved can offer a promising tool (Rimbert 2003; Zhao et al. 2018; Rouaix et al. 2023). Indeed, CFD consists in solving the unsteady equations that govern motion (the Navier–Stokes equations) for both the ejected liquid and the surrounding air. As a consequence, all the information on fluid evolution both in time and in space are available for an in-depth investigation requiring enough memory and CPU time to get both a time and space resolution able to describe liquid fragmentation up to the droplet size. In Rimbert (2003), numerical simulations of retardant release and dispersion were performed using the Fluent™ code (versions 6.0 and 6.1). The VoF (Volume of Fluid) Method was used and special attention was paid to turbulence modelling during the droplet cloud dispersion. The speed of the aircraft considered (a Conair Turbo Tracker) was set at 35 m/s and 4 m3 of water or retardant was dropped in 0.5 s. The simulations were conducted in two steps. Liquid evolution right after ejection was first simulated over a fine mesh of 4 million cells (400 × 100 × 100). The resulting liquid cloud was then used in a second simulation over a coarser mesh of 750 000 cells (150 × 50 × 100) used to describe a domain 150 m long and 50 m high and wide. When compared with real tests, the simulations apparently reproduced the global trajectory of the liquid droplet cloud in air but were not able to reproduce the liquid deposition on the ground and the large-scale structures that develop in the liquid column during its fragmentation. In Zhao et al. (2018), the multi-fluid VoF model of the Fluent software was also employed and coupled to a Euler–Euler two-fluid approach to simulate the liquid cloud with the droplet diameter fixed at 1 cm. Their study considered the AG-600, the largest firefighting amphibian in China, able to drop up to 12 tonnes of liquid at 230 km/h. Two domains were also considered: a moving and a fixed domain were coupled for the simulation, with the objective to provide a description of the fluid behaviour from the airtanker down to the ground. The airtanker was located in a moving zone 406 × 36.3 × 72.6 m in length, width and height divided into 54 000 grids. The stationary domain located below the moving zone was 553.5 × 72.6 × 118.7 m and discretised using 66 000 grids. These two studies based on CFD aim at providing an estimate of ground deposition with a coarse description of liquid fragmentation and dispersion because of the grid resolution. Typically, full resolution would require for most of the airtankers currently in service a domain of length 500 m × width 100 m × height 100 m. Considering a grid resolution of the order of 1 mm to be able to capture the small droplets resulting from atomisation, a full simulation of the system of equations that governs the fluid dynamics (the Navier–Stokes equations) would require 1010 millions of cells and a computer RAM memory of approximately 107 Tera Bytes, which is far too large to be accessible with actual supercomputers.
The objective of the work presented here is to investigate an alternative that makes possible a much finer resolution of liquid fragmentation and dispersion. For this purpose, a domain close to the airtanker is considered and extrapolation of the results to the ground is discussed.
This study considers the aerial fleet of the French Civil Protection, more specifically the Canadair CL-415 and Dash-8. These two airtankers use different delivery systems. The Canadair CL-415 is made with two tanks incorporated in its fuselage and can drop a maximum of 6000 L of liquid. It has scoops on its belly, and can slide along a water surface to fill its tanks. The Canadair CL-415 is mostly used for direct attack of fire with water. The Dash-8 is a reconverted airliner with a tank attached under its belly and can drop a maximum of 10 000 L of liquid. Its tank is filled at an airport and this airtanker is used to provide lines of retardant. The normal air speed for drops from these aircraft is ~55 to 60 m/s and 65 to 70 m/s for the CL-415 and Dash-8, respectively. A numerical approach based on CFD is used here to describe the tank discharge of these two airtankers in order to provide an accurate and representative description of the discharge flow rate as well as the liquid drop and atomisation in air.
The paper is organised as follows. First, the numerical method implemented in STAR-CCM+ and used for this study is presented. STAR-CCM+ is multiphysics CFD simulation software that enables the user to simulate fluid flows in complex problems (Siemens 2015). In particular, STAR-CCM+ makes possible the simulation of two-phase flows considered in the present study (Rouaix et al. 2023). The results concerning tank discharge of the two airtankers considered are then presented as well as liquid atomisation and dispersion in air for both water and retardant. The relevance of extrapolating liquid behaviour in a region close to the airtanker down up to the ground is finally discussed.
Methods
The results reported in this work for both the tank discharge and liquid atomisation under the two airtankers CL-415 and Dash-8 were obtained using numerical simulations performed with the CFD code Star-CCM+.
Numerical method
We consider a Newtonian fluid (for water and retardant) of density ρL and viscosity μL released at velocity UL in air of density ρG, viscosity μG and relative wind UG. For this purpose, we solve the 3D unsteady Navier–Stokes equations for two incompressible and immiscible Newtonian fluids. Considering the VoF approach, the interface between the two fluids is obtained by solving the transport equation of the VoF function (or liquid volume fraction) αL (0 ≤ αL ≤ 1):
The evolution of the fluids’ velocity v, with components denoted vx, vy, vz in the system of coordinates (x, y, z), and pressure P is given by the conservation of mass and momentum
with t the time, ρ = αLρL + (1 − αL)ρG the one-fluid density, the viscous stress tensor expressed using the one-fluid viscosity μ = αLμL + (1 − αL)μG and g gravity. As the resolution is larger than the capillary length of order 3 mm, the surface tension term is not considered in Eqn 3. The numerical solver of Star-CCM+ was used and turbulence was modelled with a standard k-ε model (Rouaix et al. 2023). The meshes built for the simulations are described in the following. For each case, at least two meshes of different resolution were considered in order to ensure that the reported results were not impacted by the grid resolution. The simulations were performed on the regional CALMIP supercomputer based in Toulouse (France).
Tank geometry
The first objective of the numerical strategy developed for this study is to provide a detailed description of the tank discharge. The tank geometries of the CL-415 and Dash-8 were designed and meshed. Their dimensions are presented in Figs 1 and 2, respectively.
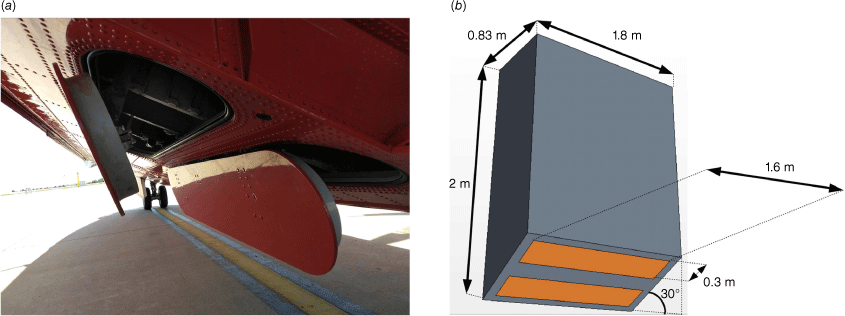
Canadair CL-415 tank: (a) photo of both open doors of the left tank of the two tanks of a Canadair CL-415 (photo credit: C. Calbrix). The bottom surface is inclined, making an angle of 30° with respect to the horizontal. (b) Dimensions of the Canadair tank used in the simulations.
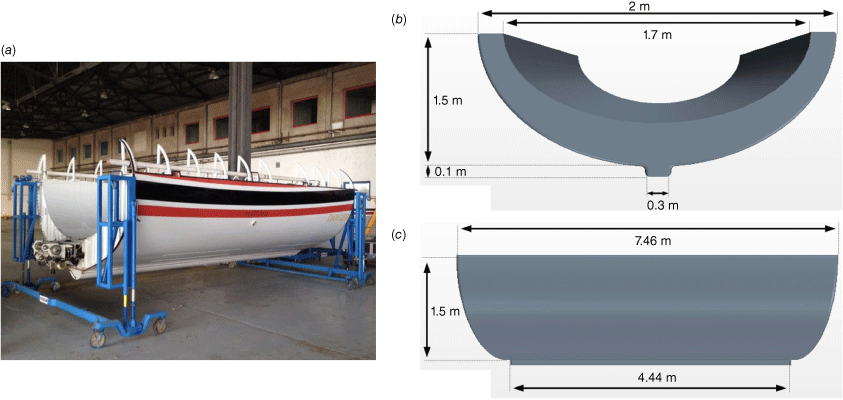
Dash-8 tank: (a) photo of the tank (https://spdu10.skyrock.com/3299702278-Le-DASH8-Q-400-MR.html); (b) front view, and (c) side view of the tank geometry used in the simulations.
For the geometry of the CL-415 tank (Fig. 1), a trimmed cell mesher was used. Owing to symmetry conditions, half the front part of the tank is considered for the calculation. For the half tank, the total number of cells is ~810 000 and their size ranges from 1 × 10⁻² m at the centre of the tank to 5 × 10⁻⁶ m at the walls.
For the more complex geometry of the Dash-8 tank (Fig. 2), a polyhedral mesher was used. The total number of cells is ~1.9 million, and their size ranges from 2 × 10⁻² m at the centre of the tank to 5 × 10⁻⁶ m at the walls.
Each tank discharge simulation corresponds to the ‘full load’ mode where the maximum exit section is imposed during all the drop. The tank discharge is characterised using the mean exit liquid velocity defined as UL = QL/S, where QL is the flow rate at the tank exit and S the corresponding section area.
As a preliminary step, validation of the ability of the code to correctly simulate a tank discharge was conducted. Such a simulation can be considered as standard for the Star-CCM+ code considering its extensive use and validation in studies related to the behaviour of a fluid in a tank in more complex geometries and/or in more complex flow conditions than considered here (see for example Gómez-Goñi et al. (2013), Rivas et al. (2014), Zheng et al. (2018), George and Cho (2020), to cite a few). The flow rate measurements of both the Dash-8 and CL-415 being confidential, we performed a simulation with a simplified geometry to make a direct comparison with the theoretical calculation of the tank discharge possible. The tank capacity and the ratio between the tank section and exit section were chosen to be representative of one of the two CL-415 tanks. Very good agreement (not shown here) was observed between the simulation and the theoretical model.
Domains and meshes
The second objective of our numerical approach is to simulate the dynamics of liquid ejection, fragmentation and dispersion in air once ejected from the tank. The liquid velocity profile obtained with the simulation of the tank discharge in the previous section is imposed as an inlet velocity condition at the tank exit, represented in red in Fig. 3. The two tanks are considered for the CL-415. The simulations are conducted in the frame of reference moving with the airplane. For each case, the air flow velocity UG is imposed at the domain inlet. A first set of simulations for the CL-415 and the Dash-8 both dropping water (density ρL = 1000 kg/m3 and viscosity μL = 0.001 Pa s) at the same air speed UG = 50 m/s (corresponding approximately to their operating ground speed in the absence of wind) is considered in order to make a comparison between the two airtankers possible. Then, simulations with the retardant (density ρL = 1100 kg/m3 and viscosity μL = 0.056 Pa s) are reported for a comparison with real tests made using the cup and grid method. The belly of each of the two studied airplanes is meshed in an adapted domain. The domain is selected in order to observe liquid fragmentation during its evolution in air while minimising the size of the computational domain to reduce the number of cells. Several domain shapes were tested and the selected ones are shown in Fig. 3 for both the CL-415 and the Dash-8.
Domain definition and main characteristics: (a) under a Canadair CL-415 belly with the four exits in red; (b) domain under a Dash-8 belly with the exit in red.
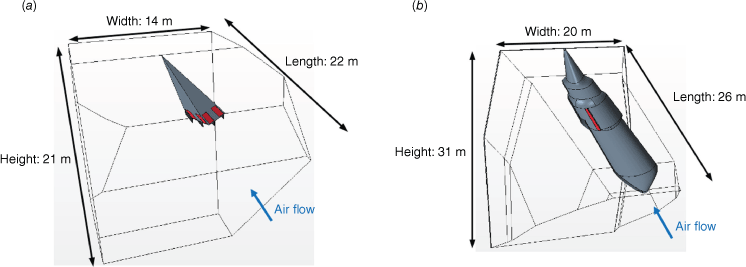
Owing to the complex geometry of the belly and the sharp angles on the corner of the domains, we chose in both cases a polyhedral mesher. The grid size ranges from 8 × 10⁻⁶ m at the walls to 8 × 10⁻² m in the centre of the domain. The total number of cells is 6.9 and 8.7 million for the CL-415 and Dash-8, respectively. Parallel simulations made use of 180 and 720 processors, with a total computation CPU time of 3240 and 28 800 h, respectively.
Liquid evolution in air is described in the following by considering its vertical penetration, lateral expansion and atomisation. The liquid interface being tracked with the VoF model, we are able to select different values of liquid volume fraction αL for the liquid cloud inspection. The ‘liquid core’ corresponds to 0.9 ≤ αL ≤ 1, whereas the envelope of the ‘liquid cloud’ can be described by considering 0.001 ≤ αL ≤ 1.
Results
Tank discharge
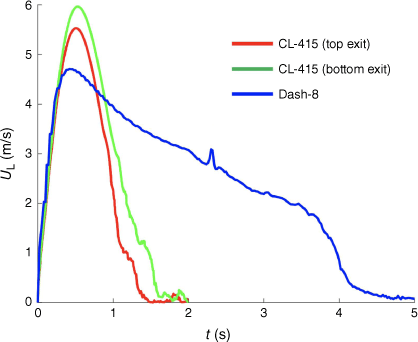
The time evolution of the Canadair maximum exit velocity UL(t) is shown in Fig. 4 for both the top and bottom exits as defined in Fig. 1. As observed, the liquid accelerates up to a maximum velocity, reached after 0.5 s for the two tanks. This maximum velocity is ~6 m/s for the Canadair and 4.8 m/s for the Dash-8, also shown in Fig. 4. The time to fully discharge the Canadair tank is ~1.5 s whereas it is ~4 s for the Dash-8. As observed, there is an ~0.2 s delay between the top exit (in blue) and the bottom exit (in red) for the CL-415.
Liquid evolution in air
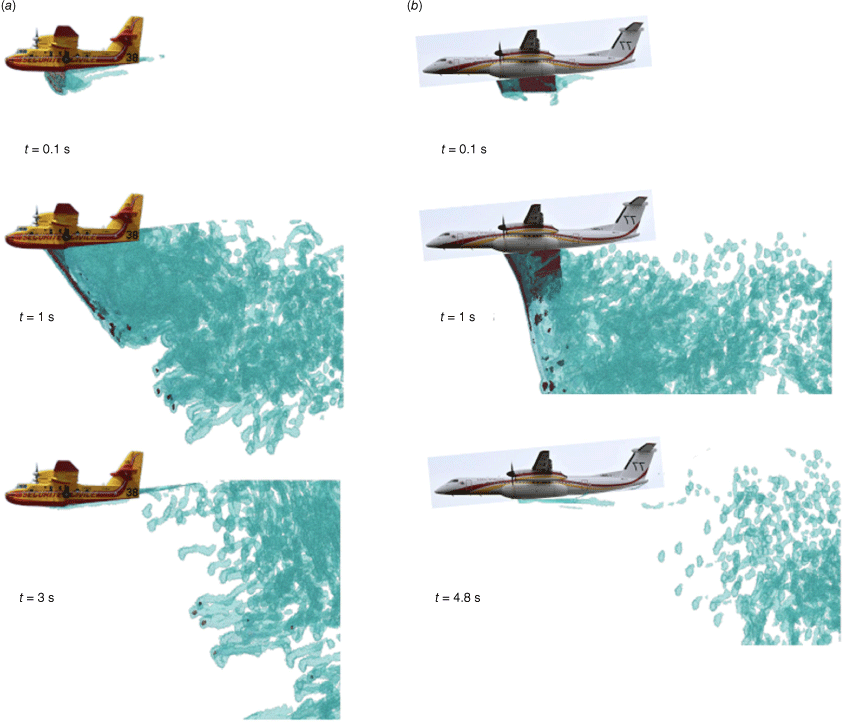
Fig. 5 shows the main steps of the liquid evolution after its ejection from the tank for the two airtankers. As observed, when released in the air, the liquid seems to follows a similar evolution for the two airtankers. When impacted by the relative horizontal air, the liquid trajectory is deflected streamwise and the liquid is dispersed in the transverse direction. We see here the mechanisms of surface break-up and column break-up extensively described for liquid jets in cross-flow (Broumand and Birouk 2016; Rouaix et al. 2023). Right after release (first row of Fig. 5), the liquid penetrates the air and intense atomisation is observed at the liquid surface. The second row of Fig. 5 illustrates the liquid column fragmentation process, with the formation and detachment of liquid structures of large size (in red). These liquid structures then themselves fragment into smaller droplets that are dispersed (third row of Fig. 5) to finally form a liquid cloud (in blue) transported downstream in the frame of reference travelling with the airtanker.
Water evolution in air after being released by a Canadair CL-415 (a), and a Dash-8 (b) at air speed UG = 50 m/s at different instants of liquid evolution. Two liquid volume fraction thresholds are shown: the cloud envelope in blue corresponds to αL = 0.001 and the cloud core in red to αL = 0.9. Three characteristic times t (reported in the plot) are shown: right after door opening with the onset of liquid penetration and atomisation; during the development of liquid penetration with a significant fragmentation process; and at the end of the drop with a large volume of liquid transported by the relative air flow outside the domain.
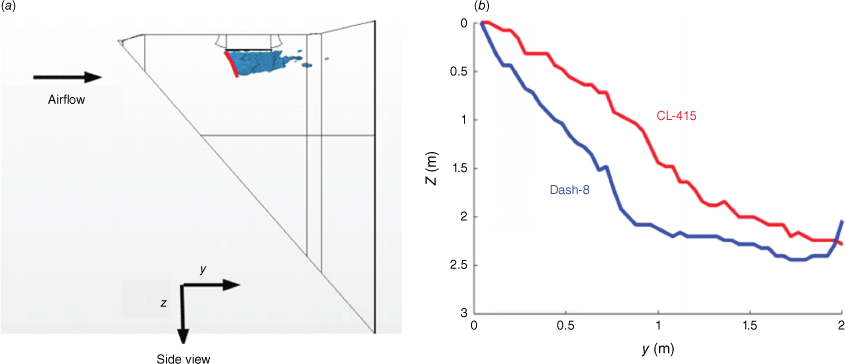
Liquid vertical penetration
Liquid vertical penetration is defined as the evolution of the vertical distance Z of the front of the liquid surface as a function of the streamwise distance y (Fig. 6). The shape of the corresponding curve indicates how the liquid front is deformed by the impact of the relative air flow. The liquid penetration Z of the CL-415 and Dash-8 is compared in Fig. 6 at t = 0.5 s corresponding to the maximum velocity of the liquid during tank discharge. As shown, the liquid penetration of the Dash-8 and the CL-415 is similar because the liquid exit velocity is of the same order of magnitude at t = 0.5 s, as shown in Fig. 3. This confirm results observed for liquid jets where penetration is controlled by the momentum ratio comparing the liquid inertia at exit with the relative air inertia impacting the liquid column. For liquid jets in air cross-flow, vertical penetration Z is usually reported as a function of the streamwise distance y and the momentum ratio q for both millimetric nozzles (Wu et al. 1997, 1998; Lin et al. 2002; Iyogun et al. 2006) and for nozzles of size comparable with airtanker systems (Rouaix et al. 2023). A huge list of correlations can be collected from the literature (No 2015; Rouaix et al. 2023) but they follow a similar evolution of the form:
where Lc is a characteristic length of the injection system (usually the nozzle diameter d). K, α and β are three constants that can differ owing the injection system and can also be sensitive to operating conditions. These correlations were obtained for a certain range of Weber number WeG:
where σ is the surface tension of the liquid. WeG compares the inertia of the impacting air on the liquid column with the surface tension contribution at the liquid–air interface. A large value of WeG indicates a strong atomisation process, whereas for values of WeG lower than unity, the interfacial effect dominates the inertia effect and the liquid column surface is not sufficiently deformed to be atomised. Some values for K, α and β obtained for millimetric liquid jet in cross-flow are reported in Table 1 with corresponding ranges for the Weber number WeG, the momentum ratio q and the nozzle diameter d.
Liquid penetration: (a) visualisation of the iso-surface of αL = 0.001 for the Dash-8 at t = 0.5 s when the flow rate is maximum. The red line shows the liquid penetration front Z. (b) Comparison at t = 0.5 s of liquid vertical penetration Z as a function of the streamwise distance y for a Canadair CL-415 (red) and a Dash-8 (blue).
| d (m) | WeG | q | KP = Kq α | K | α | β | ||
|---|---|---|---|---|---|---|---|---|
| Wu et al. (1997) | 0.0005, 0.001, 0.002 | 57–1180 | 3.4–185 | 2.5–18.6 | 1.37 | 0.5 | 0.5 | |
| Wu et al. (1998) | 0.0005 | 54–217 | 5.3–59.1 | 7.45–16.5 | 4.3 | 0.33 | 0.33 | |
| Lin et al. (2002) | 0.0005, 0.001, 0.002 | 40–475 | 2–40 | 3.4–14.2 | 2.42 | 0.48 | 0.24 | |
| Iyogun et al. (2006) | 0.001–0.0019 | 9.3–159 | 8.3–726 | 5.1–37.2 | 1.997 | 0.444 | 0.444 | |
| Rouaix et al. (2023) | 0.2, 0.4, 0.6 | 16 000–52 900 | 4.3–39 | 2.0–4.2 | 1.15 | 0.379 | 0.54 |
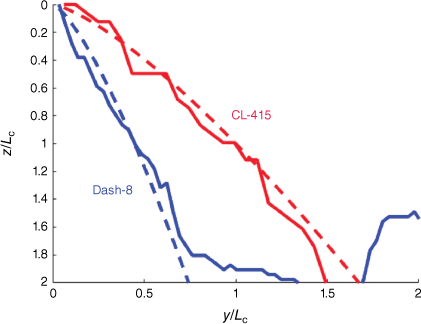
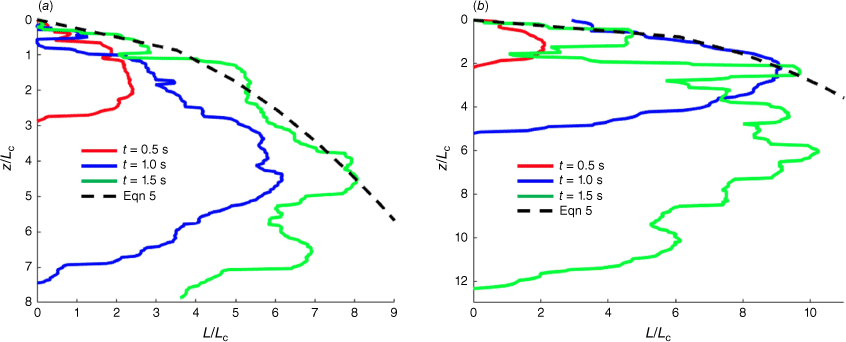
For the two airtanker delivery systems considered here, the characteristic length of the tank exit is taken as following Legendre et al. (2014), where this characteristic length has been shown to be the relevant characteristic length that makes possible the proposition of a unique evolution of the drop pattern width on the ground for very different airtankers. As shown in Fig. 7, relationship 4 is also able to describe jet penetration for the two airtankers when selecting appropriate values for KP = Kqα and β. The corresponding values are reported in Table 2. As shown, the values obtained for β are very close for the two airtankers, the difference between penetration being influenced by the value of the prefactor KP. We also note that β is larger than the values observed for jets (see Table 1), revealing more efficient penetration in the air for the airtankers.
Normalised liquid penetration Z as a function of the streamwise distance y at t = 0.5 s. Dash-8 liquid penetration from the simulation (blue) compared with Eqn 4 (blue dotted line) with KP (=Kqα) = 3 and β = 1.36. CL-415 liquid penetration from the simulation (red) compared with Eqn 4 (red dotted line) with KP (=Kqα) = 1.0 and β = 1.35.
| WeG | q | KP = Kq α | β | ||
|---|---|---|---|---|---|
| CL-415 | 85 020 | 10.52 | 1.0 | 1.35 | |
| Dash-8 | 23 643 | 7.90 | 3.0 | 1.36 |
Liquid lateral expansion
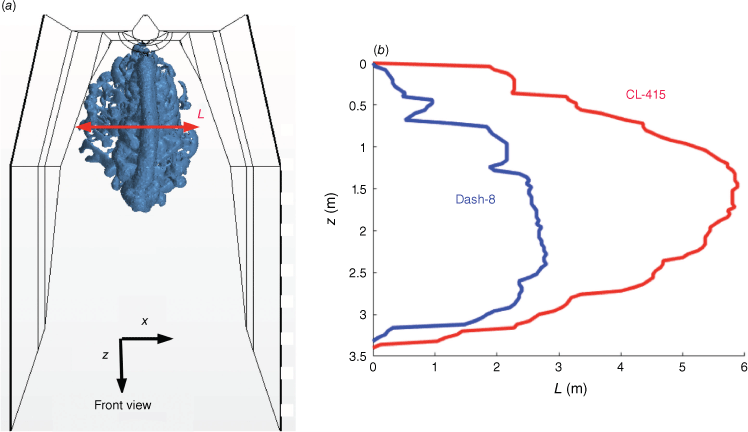
The lateral (or transverse) expansion L is defined as the maximum width of the dispersed liquid, as shown in Fig. 9. This parameter is of importance because its evolution is expected to control the final width of liquid deposition on the ground. The liquid lateral expansion L is compared for the CL-415 and Dash-8 in Fig. 8 at t = 0.5 s. As indicated above, this corresponds to the maximum velocity of the liquid during tank discharge resulting in the most efficient dispersion. As shown in Fig. 8, for the same relative wind velocity UG = 50 m/s considered here, the lateral expansion is reduced for the Dash-8 compared with the Canadair, resulting in a narrower liquid deposit on the ground, and thus a higher liquid concentration. This is a direct consequence of the exit geometry: a single narrow exit at the bottom of the tank of the Dash-8 compared with four exits used to discharge the two tanks of the CL-415.
Liquid lateral expansion: (a) front view of the iso-surface of α = 0.001 for the Dash-8 at t = 1 s. (b) Comparison at t = 1 s of liquid lateral expansion L as a function of the vertical distance z from the exit for a Canadair CL-415 (red) and a Dash-8 (blue).
Considering the studies for liquid jets atomisation in air cross-flow, the lateral expansion L is usually described as a function of the streamwise direction y and the momentum ratio q (Wu et al. 1998; Rouaix et al. 2023). Combined with Eqn 4, we obtain an expression for L as a function of the vertical distance z as:
with K′, α′ and β′ three other constants that differ from the values of K, α and β in Eqn 4 for the description of liquid penetration. As shown in Fig. 9, relationship 6 is also able to describe the maximum lateral expansion of the liquid observed during the drop for the two airtankers when selecting appropriate values for KL = K′qα′ and β′. The corresponding values are reported in Table 3. Again, close values of the power law exponent β′ are found for the two airtankers. As a comparison, Table 4 reports these parameters for the lateral expansion of liquid jets in cross-flow for a similar range of values of the momentum ratio q. Larger values for β’ are observed for the two airtankers, suggesting stronger dispersion than observed for jets in cross-flow, certainly the combined effect for airtankers of gravity, which accelerates the motion of the atomised liquid along the vertical direction, and a consequence of the system geometry (see Tables 3 and 4).
Evolution of the total liquid expansion L normalised by the characteristic length of the tank exit Lc, with the normalised vertical direction z/Lc at different times t during the drop. The dashed line shows Eqn 5 that fits the maximum lateral expansion of the liquid. (a) Dash-8, Eqn 6 with KL (=K′qα′) = 0.07 and β′ = 2.0. (b) Canadair CL-415, Eqn 6 with KL (=K′qα′) = 0.007 and β′ = 2.6.
| WeG | q | KL = K′q α′ | β′ | ||
|---|---|---|---|---|---|
| CL-415 | 85 020 | 10.52 | 0.007 | 2.6 | |
| Dash-8 | 23 643 | 7.90 | 0.07 | 2.0 |
| d (m) | WeG | q | KL = K′q α′ | K′ | α′ | β′ | ||
|---|---|---|---|---|---|---|---|---|
| Wu et al. (1998) | 0.0005 | 54–217 | 5.3–59.1 | 1.4–0.95 | 1.83 | −0.16 | 1. | |
| Rouaix et al. (2023) | 0.2, 0.4, 0.6 | 16 000–52 900 | 4.3–39 | 0.67–1.02 | 0.51 | 0.19 | 1.1 |
Liquid atomisation in air
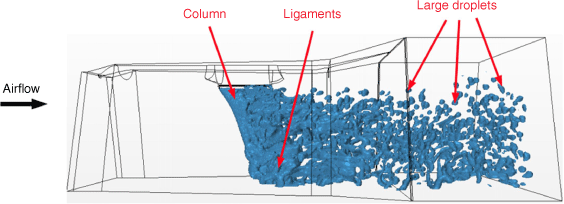
One important aspect of liquid evolution in air is obviously related to liquid fragmentation and dispersion. The objective is to finally obtain a uniform liquid deposit on the ground. We consider here the evolution of the number and size of liquid volumes produced, as depicted in Fig. 10 for the Dash-8. The formation of ligaments and droplets of large size (several tens of centimetres) is clearly seen. The shear stress from the air at the liquid surface tears off liquid ligaments, which are then fragmented into liquid volumes of different size. Their subsequent dynamics may differ and result in different contributions to the ground pattern.
Liquid atomisation process for a Dash-8 drop at t = 1 s. The iso-surface of the volume fraction is αL = 0.001.
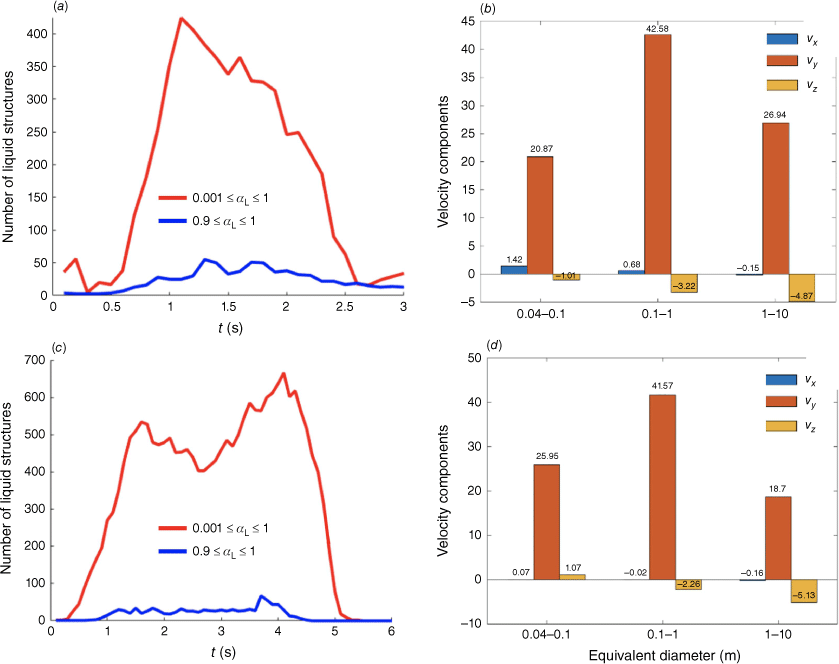
A Matlab code was developed to reconstruct the 3D liquid structures at each instant to characterise their respective velocities and sizes. Fig. 11a shows the time evolution of the number of identified liquid structures for the CL-415 for two thresholds of detection: αL ≥ 0.9 and αL ≥ 0.001. The first, αL ≥ 0.9, identifies liquid structures whereas the second, αL ≥ 0.001, also identifies fragmented liquid volumes smaller than the grid size in larger numbers. Fig. 11b shows the distribution of droplets with their respective velocities for three different classes of size. The velocity components vZ, vY and vX, for the vertical, streamwise and transverse components, respectively, are reported. As shown, the streamwise velocity is much larger because it is imposed by the relative airflow (50 m/s), and the vertical velocity of lower magnitude is controlled by the velocity at ejection (see Fig. 3). The order of magnitude of the transverse velocity is ~1 m/s, showing significant liquid dispersion in the transverse direction, explaining significant lateral dispersion as discussed in the previous section.
Liquid fragmentation for the Canadair CL-415 (a, b) and the Dash-8 (c, d). The time evolution of the number of identified liquid structures (a–c) shows the comparison for a detection using a liquid volume fraction αL between 0.001 and 1 (red), and between 0.9 and 1 (blue). The repartition of the droplets with their respective velocities and size (b–d) is reported at t = 1 s for a detection with a volume fraction αL between 0.001 and 1. Three classes of size are reported for equivalent diameters ranging between 0.04 and 0.1 m, between 0.1 and 1 m and between 1 and 10 m.
Field comparison
One important objective of this study is to find out if we are able to determine from the numerical simulation of liquid dispersion in a region close to the airtanker the resulting drop pattern characteristics on the ground, and in particular its width. The discussion is possible thanks to drop pattern characteristics of the CL-415 and Dash-8 measured with the cup and grid method by the CEREN in France (F. Giroud, pers. comm.). The conditions of the drop such as speed, altitude and drop volume are reported in Table 5. It is not possible to report here the corresponding drop footprints, and the maximum width of the drop pattern is used for comparison. The drops were made with the Fire-Trol 931 retardant currently used in Europe (density ρL = 1100 kg/m3 and viscosity μL = 0.056 Pa s). The two tanks of the CL-415 were half-full of retardant so that the corresponding dropped volume was 3 m3. The maximum width of the drop pattern obtained with the cup and grid method is reported on the x axis of Fig. 12 for three coverage levels expressed in liter per square meter (L/m2) or in US gallon per 100 square feet (GPC): 0.01 L/m2 (0.025 GPC), 0.8 L/m2 (2 GPC) and 1.6 L/m2 (4 GPC) shown using thick grey, red and yellow lines, respectively. These coverage levels are the coverage levels of reference used by CEREN when testing airtanker performance.
| Airtanker | Ground speed (m/s) | Wind speed (m/s) | Relative wind UG (m/s) | Altitude (m) | Volume (m3) | Width (m) > 1.6 L/m2 | Width (m) > 0.8 L/m2 | Width (m) > 0.01 L/m2 | |
|---|---|---|---|---|---|---|---|---|---|
| CL-415 | 59.2 | 12.0 | 71.2 | 35.1 | 3.092 | 10 | 20 | 70 | |
| Dash-8 | 66.4 | 6.2 | 72.6 | 41.2 | 8.840 | 10 | 30 | 70 |
The dropped liquid is Fire-Trol 931 (ρL= 1100 kg/m3 and μL= 0.056 Pa s). The maximum width of the drop pattern is reported for three coverage levels: 0.01 L/m2 (0.025 GPC), 0.8 L/m2 (2 GPC) and 1.6 L/m2 (4 GPC).
Retardant lateral expansion L as a function of the vertical distance z at different times during the drop for (a) Dash-8, and (b) CL-415. The origin z = 0 indicates the tank exit. The red dashed line shows Eqn 6 with a new fit corresponding to the retardant evolution with KL (=K′qα′) = 0.055 and β′ = 2.0 for Dash-8 and KL (=K′qα′) = 0.026 and β′ = 2.4 for CL-415. It is plotted down to the ground, z = 35.3 m for the Dash-8 and z = 35 m for the CL-415. The horizontal black dashed line is the limit of the computational domain. The thick lines on the x-axis represent the mean values of the pattern width measured with the cup and grid method by the CEREN in France (F. Giroud pers. comm.) for coverage levels 0.01 L/m2 (grey), 0.8 L/m2 (red) and 1.6 L/m2 (yellow).
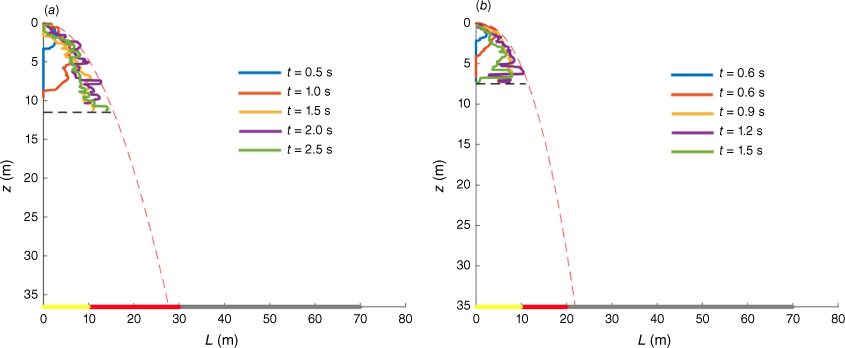
The simulation of the tank discharge for the two airtankers was first conducted with the volumes given in Table 5 in order to determine the inlet condition for the drop simulation following the methodology described above. Then, numerical simulations of liquid dispersion were conducted for the operating conditions reported in Table 5 for both the Dash-8 and the Canadair CL-415. The corresponding retardant lateral expansions are reported in Fig. 12, and Eqn 6 is used to describe the evolution of the liquid envelope. Values of KL (=K′qα′) = 0.055 and β′ = 2.0 for the Dash-8 and KL (=K′qα′) = 0.026 and β′ = 2.4 for the CL-415 are deduced from the numerical results. These relationships are extrapolated down to the ground level in order to make a comparison with the cup and grid results from Table 5 reported on the x axis of the figure. As shown, the envelope obtained with the volume fraction αL = 0.001 is approximately consistent with the coverage level >0.8 L/m2 (2 GPC).
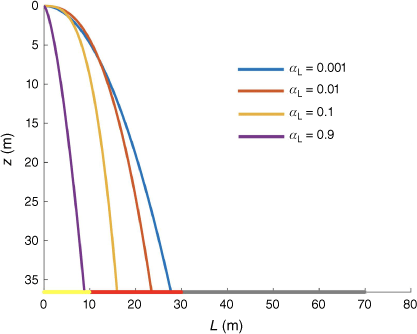
The analysis reported in Fig. 12 for αL = 0.001 was performed for the Dash-8 for increasing values of the volume fraction αL (αL = 0.001, 0.01, 0.1 and 0.9) and their corresponding envelopes are compared in Fig. 13. As expected, increasing the value of αL allows higher coverage levels to be described. Typically, the level of 1.6 L/m2 (4 GPC) is reproduced by considering the volume fraction αL = 0.9.
Envelope of the retardant lateral expansion L as a function of the vertical distance z for different values of the volume fraction αL for the Dash-8. Comparison with the mean values of the pattern width measured with the cup and grid method by the CEREN in France (F. Giroud pers. comm.) for coverage levels 0.01 L/m2 (grey), 0.8 L/m2 (red) and 1.6 L/m2 (yellow).
Concluding discussion
In this paper, a numerical methodology has been proposed to investigate in depth the drop of a liquid from an airtanker. For this study, we considered water and retardant drops from both the Canadair CL-415 and the Dash-8. The 3D unsteady numerical solver of the Navier–Stokes equations of the CFD code Star-CCM+ was used to characterise the tank discharge in order to provide the time evolution of the velocity at the tank exit. This velocity was then imposed as an inlet velocity in the frame of reference travelling with the airtanker for the simulation of liquid atomisation and dispersion in the air with the objective of providing a description of the main characteristics of the resulting liquid cloud. A compromise between domain size and spatial accuracy was made to optimise computational resources, resulting in a domain of study extending up to 10 m under the airtanker with a spatial resolution of 0.04 m. The development of the liquid column was characterised through three main parameters: vertical penetration, lateral expansion and the structure of the liquid cloud during the atomisation process. In addition, a simple model was proposed for both the vertical penetration and lateral expansion of the liquid in a domain close to the airtanker. The comparison with a liquid jet at millimetric scale (No 2015; Broumand and Birouk 2016) and at similar size (Rouaix et al. 2023) reveals that power laws of similar form can be used for airtankers. However, the values of the coefficients that fit the numerical simulations significantly differ because of the combined effect for airtankers of the tank design that shapes the flow at the exit, gravity, which accelerates liquid motion along the vertical direction, and the consequence of much larger Weber numbers resulting in more efficient liquid surface atomisation. Extension of the fitting relationship obtained for the liquid transverse dispersion down to the ground provides a good estimate of the real drop pattern width measured with the cup and grid method.
This work demonstrates the potential of the proposed methodology: an accurate description of liquid evolution in a region close to the airtanker allows discussion of the airtanker drop pattern expansion, as demonstrated by Fig. 12. This information is of great interest because the resolution of the liquid drop in the entire domain of study, i.e. from the airtanker down to the ground, is not accessible with actual available computational resources for a space resolution that allows capture of millimetric droplets. The next step will consist in developing appropriate post-processing of the numerical simulation to provide the liquid deposition pattern at the bottom of the domain and compare it with the ground pattern obtained with the cup and grid method. Based on the results reported here, we expect to be able to deduce the effective ground pattern from the simulation.
The approach proposed in this study can be applied to any type of airtanker such as Large Air Tankers and helicopter buckets. The potential of the method is of great interest for the design of new systems but also to compare the effectiveness of different airtankers to provide appropriate recommendations to fire agencies (McFayden et al. 2023). To be applied, the method requires the geometry of the tank and the operating conditions of the aircraft such as its speed and the drop altitude. The proposed approach can also be used to improve the understanding and characterisation of the fragmentation and dispersion process of a liquid when dropped from an airtanker, providing relevant information on the resulting deposit on the ground. In particular, the effect of different wind conditions can be easily investigated by just changing the air velocity field at the inlet of the computational domain. The wind is known to significantly impact the dispersion of the liquid cloud but it may also have a direct impact on the liquid column fragmentation process, resulting in both different liquid penetration and expansion. In addition, large-scale liquid column fragmentation is an important process to consider in future investigations because it can result, depending on the drop conditions, in a non-uniform liquid deposit on the ground, thus resulting in areas with low coverage that do not slow fire progression. Making progress on this crucial problem may help to provide technical solutions to control the fragmentation process for better airtanker firefighting.
Acknowledgements
This project is funded by Nîmes Métropole and used computation resources of the supercomputer CALMIP in Toulouse, France (Project P20015). The authors thank Frédérique Giroud, director of CEREN, Valabre, France, for providing the cup and grid results used in this paper and for fruitful discussions.
References
Abarzhi SI (2010) Review of theoretical modelling approaches of Rayleigh–Taylor instabilities and turbulent mixing. Philosophical Transactions of the Royal Society A: Mathematical, Physical and Engineering Sciences 368, 1809-1828.
| Crossref | Google Scholar | PubMed |
Amorim JH (2011) Numerical modelling of the aerial drop of firefighting agents by fixed-wing aircraft. Part I: model development. International Journal of Wildland Fire 20, 384-393.
| Crossref | Google Scholar |
Broumand M, Birouk M (2016) Liquid jet in a subsonic gaseous crossflow: Recent progress and remaining challenges. Progress in Energy and Combustion Science 57, 1-29.
| Crossref | Google Scholar |
George A, Cho IH (2020) Anti-sloshing effects of a vertical porous baffle in a rolling rectangular tank. Ocean Engineering 214, 107871.
| Crossref | Google Scholar |
Gómez-Goñi J, Garrido-Mendoza CA, Cercós JL, González L (2013) Two-phase analysis of sloshing in a rectangular container with Volume of Fluid (VOF) methods. Ocean Engineering 73, 208-212.
| Crossref | Google Scholar |
Ito T, Kato H, Goda Y, Tagawa S, Negishi E (2010) Water‐dropping aerodinamics for firefighting amphibian. In ‘Proceedings of the 27th International Congress of the Aeronautical Sciences, Nice, France, 19–24 September 2010’. Available at https://www.icas.org/ICAS_ARCHIVE/ICAS2010/PAPERS/333.PDF [Accessed 6 October 2022]
Iyogun C-O, Birouk M, Popplewell N (2006) Trajectory of water jet exposed to low subsonic cross-flow. Atomization and Sprays 16, 963-980.
| Crossref | Google Scholar |
Legendre D, Becker R, Alméras E, Chassagne A (2014) Air tanker drop patterns. International Journal of Wildland Fire 23(2), 272-280.
| Crossref | Google Scholar |
Lin K-C, Kennedy P-J, Jackson T-A (2002) A review on penetration heights of transverse liquid jet in high-speed flows. 40th AIAA Aerospace Sciences Meeting & Exhibit, Aerospace Sciences Meetings, American Institute of Aeronautics and Astronautics. https://doi.org/10.2514/6.2002-873
No SY (2015) A review on empirical correlations for jet/spray trajectory of liquid jet in uniform cross flow. International Journal of Spray and Combustion Dynamics 7, 283-313.
| Crossref | Google Scholar |
Plucinski MP, Pastor E (2013) Criteria and methodology for evaluating aerial wildfire suppression. International Journal of Wildland Fire 22, 1144-1154.
| Crossref | Google Scholar |
Qureshi S, Altman A (2018) Studying fluid breakup and dispersion to predict aerial firefighting ground drop patterns. AIAA Aerospace Sciences Meeting, AIAA SciTech Forum, American Institute of Aeronautics and Astronautics. https://doi.org/10.2514/6.2018-1047
Rayleigh L (1883) Investigation of the character of the equilibrium of an incompressible heavy fluid of variable density. Proceedings of the London Mathematical Society s1–14, 170-177.
| Crossref | Google Scholar |
Rivas E, Rojas E, Bayón R, Gaggioli W, Rinaldi L, Fabrizi F (2014) CFD Model of a Molten Salt Tank with Integrated Steam Generator. Energy Procedia 49, 956-964.
| Crossref | Google Scholar |
Rouaix C, Stoukov A, Bury Y, Joubert D, legendre D (2023) Liquid jet breakup in gaseous crossflow injected through a large diameter nozzle. International Journal of Multiphase Flow 163, 104419.
| Crossref | Google Scholar |
Siemens (2015) Star-CCM+ User Guide. Available at https://fr.scribd.com/doc/193836790/Star-CCM- User-Guide
Wu P-K, Kirkendall KA, Fuller RP, Nejad AS (1997) Breakup processes of liquid jets in subsonic crossflows. Journal of Propulsion and Power 13, 64-73.
| Crossref | Google Scholar |
Wu P-K, Kirkendall KA, Fuller RP, Nejad AS (1998) Spray structures of liquid jets atomized in subsonic crossflows. Journal of Propulsion and Power 14, 173-182.
| Crossref | Google Scholar |
Zhao X, Zhou P, Yan X, Weng Y, Yang X-L (2018) Numerical simulation of the aerial drop of water for fixed-wing airtankers. In ‘31st International congress of the aeronautical science (ICAS 2018)’ Available at https://www.icas.org/ICAS_ARCHIVE/ICAS2018/data/papers/ICAS2018_0474_paper.pdf
Zheng X, You Y, Ma Q, Khayyer A, Shao S (2018) A comparative study on violent sloshing with complex baffles using the ISPH method. Applied Sciences 8(6), 904.
| Crossref | Google Scholar |