

Remotely sensed vegetation phenology drives large fire spread in northwestern Europe
Tomás Quiñones A * , Cathelijne Stoof B , Fiona Newman-Thacker B , Adrián Jiménez A , Fernando Bezares A , Joaquín Ramírez A and Adrián Cardil A
A
B
Abstract
Increasing frequency of large fires in northwest Europe, a region under-represented in fire studies, with different ecosystem processes from those most studied, indicates the need to understand the drivers of hazardous fire behavior.
This study characterizes rate of spread variation in the region and delves into vegetation and weather drivers through remote sensing.
For 58 large fires, we analyzed phenology (using the temporal variation of satellite-measured vegetation indices) and weather (using as the Canadian Fire Weather Index System). Their relations and capability of predicting fire spread rates were assessed.
Low vegetation greenness correlated non-linearly with high rate of spread, and fires in the growing season showed a drastic reduction in spread. Low levels of weather-related danger were correlated with high rate of spread.
In NW Europe, the integration of phenology into fire behavior analyses helps predict spread rate. Analyzing vegetation indices variation can help estimate times when ignition could generate fast-spreading fires. Contrary to expectations, high danger related to fire weather was associated with low spread.
This study highlights the need for including timing of vegetation greenness in wildfire risk modeling and for a fire weather index systems tailored to regional conditions that relate to high-hazard fire behavior.
Keywords: Atlantic, Fire Weather, FWI, NW Europe, phenology, rate of spread, remote sensing, temperate, VIIRS, vegetation, vegetation index, wildfire.
Background
Wildfires are a major disturbance on a global scale, but the origin and development of wildfires vary drastically in different regions (Andela et al. 2019). There are three main factors in the development of a wildfire that have different impacts but also interact with each other: source of ignition (human or natural), amount of fuels, and fire weather that dries the fuels and shapes fire progression (Jones et al. 2022). These factors are highly variable and in each ecosystem of the world, a different combination of these can be found, reflecting different fire behavior and impact. In Mediterranean ecosystems, wildfires are widely documented (Jones et al. 2022) and in Europe, the impact of fires has historically been concentrated in this type of ecosystem, covering ~90% of burned area (Chuvieco 2009) and future increases are projected (Ruffault et al. 2020). Furthermore, global change is altering fire regimes across ecosystems (Huang et al. 2015).
Recently, there has been an increase of fire events of higher magnitude in northwestern (NW) Europe (San-Miguel-Ayanz et al. 2021), which has attracted attention amongst media, academia and practitioners. In this region, climate projections indicate an increase in fire frequency and severity, given the increase in temperature and drought periods (Lung et al. 2013; De Rigo et al. 2017). In 2020, the largest fire in the Netherlands in recent history was recorded in the Deurnese Peel nature reserve (Stoof et al. 2024). In the UK, 2018, 2019 and 2020 were the fire seasons with highest damage, accounting for most of the burned area in the past decade (Belcher et al. 2021), mainly in peatland and heathlands. Log et al. (2017) indicated the importance of describing fire behavior in temperate landscapes dominated by heathlands, as they are a complex phenomenon. In contrast to Mediterranean ecosystems, understanding fire regimes in European temperate ecosystems poses different challenges, given the scarce availability of fire events data (San-Miguel-Ayanz et al. 2021). National databases generally include information describing origin, burned area and fire suppression operations, but often lack information about fire behavior, as the costs of measuring it systematically is expensive. Nevertheless, it is important to have information on fire behavior to have a better understanding of danger. Rate of spread (ROS) is one of the key fire behavior descriptors, related to burned area and fire residence time, often not included in national databases (Gill and Allan 2008), but has recently been measured from satellite data for larger wildfires, bridging part of the gap for this problem (Cardil et al. 2023).
It is common knowledge that weather conditions are a key driver of fire activity. However, fuel structure and moisture content are also key variables for describing fire behavior, and the magnitude of the effect of each can vary depending on the ecosystem type (Pausas and Keeley 2021). In more arid or less productive ecosystems, flammability of fuels is limited to their growth and biomass available to burn (Pausas and Ribeiro 2013). In Mediterranean Europe, the direct relationship between meteorological risk conditions and increased fire damage is well known (Amatulli et al. 2013) and an increase in impact is expected according to climate change projections (Bedia et al. 2014). In humid regions, fuel biomass is not a limiting factor, and flammability is more related to the frequency of long-term climatic conditions such as droughts (Pausas and Bradstock 2007), which have a longer time span and can be reflected in the moisture content of both dead and live fuels.
Analyses at the global scale indicate that in the Atlantic biogeographic region of Europe, the Canadian Fire Weather Index (FWI) is not a good predictor of burned area (Bedia et al. 2015; Jones et al. 2022). As, in this region, recent work has shown that burned area is related to observed rates of spread (Cardil et al. 2023), it would be interesting to test the predictive power of common indicators of climate risk like the FWI not only on occurrence or burned area, but on the ROS of fires. This evidence is an interesting starting point for unraveling which variables could be most related to fire behavior in these ecosystems.
In NW Europe, heathlands and peatlands are dominant ecosystems (De Graaf et al. 2009) and generate a distinct dynamic in fire behavior. This type of vegetation exhibits its most extreme behavior in late winter and spring, when the highest ROS have been recorded, which could be exacerbated by increased dead fuel load due to a lack of management or decreases of the moisture content due to climate change (Log et al. 2017). In the United Kingdom, where most of the large fires in this region are concentrated (Cardil et al. 2023), fuel moisture can trigger drastic changes in fire spread rates when humidity thresholds of ~60% are exceeded (Davies and Legg 2011). Globally, models around the world address dead and live fuel moisture content as variables that must be considered in fire modeling. For shrubland-type NW European fuels, the necessity of adding Live Fuel Moisture Content (LFMC) in the creation of an appropriate fire hazard assessment has been noted (Davies and Legg 2008; Little et al. 2024).
LFMC is a key variable affecting both ignition and spread of fires, costly to measure on the ground but one that remote sensing allows us to deal with through various methods (Yebra et al. 2013). In other temperate areas of Europe such as Asturias and Galicia (Spain), it has been reported that the probability of fire occurrence is inversely related to several satellite-measured vegetation indices, such as the Enhanced Vegetation Index (EVI) and the Soil-Adjusted Vegetation Index (SAVI) (Bisquert et al. 2013), which are a proxy for LFMC (García et al. 2020). Abrupt seasonal changes in moisture content of shrub-type fuels have been documented in Scotland (Davies et al. 2010), which impacts fire behavior analyses and emphasizes the need to investigate temporal variation of LFMC at different time scales. Novel contributions from remotely sensed phenology could be used to model this type of change. Land Surface Phenology (LSP) is the study of the seasonal and continuous pattern of vegetation greenness based on satellite vegetation indices (Reed et al. 2009). It has served to improve the modeling of different ecosystem processes (Caparros-Santiago et al. 2021) and to predict variables such as LFMC in diverse types of ecosystems (Wang and Quan 2023). There are many studies linking wildfires and phenology, with the majority focused on the impact of wildfires on vegetation phenology after a fire (Van Leeuwen et al. 2010; Sankey et al. 2013; Walker and Soulard 2019; Potter 2020; Wang and Zhang 2020). Only a few studies have focused on how LSP is related to fire occurrence patterns and burned area (Bajocco et al. 2010, 2015; De Angelis et al. 2012; Nikonovas et al. 2024), and most of these describe conditions post-fire, but there are no previous studies analyzing the relationship between LSP before ignition and observed fire behavior key variables such as the ROS.
This research assesses ROS drivers in NW Europe, a region with rising fire frequency and size. ROS is our target variable, as it is judged to be the most significant factor to assess in operational and fire danger rating scenarios (Cruz et al. 2018). Previous work described large wildfire spread rate using remote sensing in NW Europe (Cardil et al. 2023) and was used as a baseline to further understand the drivers of fire spreading. Relationships between ROS and phenological indicators of greenness (as a proxy of LFMC) were evaluated. The same analysis method was used to describe relationships of fire weather indicators, such as the Canadian FWI system and ROS. The relative importance of phenological and fire weather indicators in predicting ROS of different fires in NW Europe was then jointly evaluated in a multivariate model, under the hypothesis that in this region, temporal variation in vegetation greenness is important and can explain more than fire weather.
Methods
Study area
We delineated NW Europe using the European Commission’s biogeographic regions categorization, specifically the Atlantic Biogeographic Region (Sundseth and European Commission Environment Directorate General 2009). The boundaries defined by this project were maintained, but for the purpose of this study, the southern boundary of this region was redefined by the Garonne River, at approximatley latitude 45. We chose this natural boundary because south of this river, there is heightened fire activity, distinct vegetation and a different fire regime. This region (Fig. 1) is characterized by an oceanic climate and encompasses a significant portion of the level lowlands adjacent to the Atlantic shoreline. It is characterized by a temperate climate, with mild winters and cool summers. The prevailing winds in this area are westerly, and there is a regular occurrence of rainfall throughout the year. Most of the land is flat and climatic conditions are primarily influenced by oceanic factors, leading to a consistently high level of humidity for a significant portion of the annual cycle (Sundseth and European Commission Environment Directorate General 2009). The landscape is characterized by intensive management practices, including significant agricultural zones and vast industrial and urban areas (Feranec et al. 2010). Natural habitats frequently exhibit isolation and discontinuity as a result of intertwined urban growth driven by high human habitation density. Vegetation types in the study exhibit a wide range of diversity, encompassing heathlands, forests, meadows and peat bogs, among other forms.
Fire behavior data
Visible Infrared Imaging Radiometer Suite (VIIRS) sensor data were used to detect fire incidents on a regional scale, with 375-m resolution (Schroeder et al. 2014). This product detects radiation anomalies on the Earth’s surface that allow capture of the spread of fires. These data gave us the location in space and time of each fire detection as a discrete point (i.e. hotspot) but did not identify each hotspot with an individual event and its spread. The method proposed by Cardil et al. (2023) allowed us to detect and classify these hotspots into separate incidents through a clustering process and quantify fire spread (i.e. ROS) according to their spatiotemporal patterns. Recognizing hotspot clusters allowed us to identify fire events, for which progression could be described at each satellite overpass. We focused on medium and large fires given the 375 m resolution of VIIRS pixels and temporal resolution with 12-h time steps. We acquired hotspot data from 2017 to 2022 as data input for the algorithm, as high-resolution remote-sensed phenological data were available from 2017 onwards. We first spatiotemporally clustered all input hotspot points. With this, every point was identified by its fire ID and the progressive timestep to which it belonged. The second step was to generate polygons from each of the labeled ID-timesteps, and subsequently derive 12-h fire growth isochrones. From temporally adjacent polygons vertices, progression vectors were generated. From the final outputs generated by this algorithm, it was possible to derive descriptive variables of the general behavior of each of the fires. Derived variables for each fire event were: fire occurrence or timing, burned area (km2) and mean ROS (km h−1). This study focuses on ROS as a main descriptor of fire behavior, represented as mean ROS: the average of the magnitude of all the spread vectors for each fire.
Land cover
We acquired land cover data with the purpose of filtering hotspots that were linked to burning vegetation, excluding false detections of fires. These data were also used to give a general characterization of the type of vegetation that was burned and to account for vegetation type effect within a final multivariate model. Pre-fire data from Copernicus CORINE Land cover 2012 (European Environment Agency 2019) at 100-m resolution were used for this purpose.
Wildfires distribution, land cover and seasonality
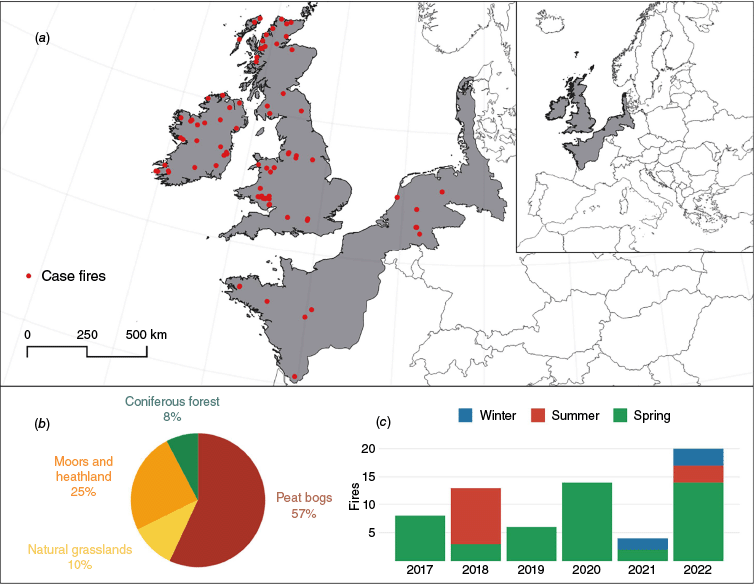
The hotspot clustering process identified 58 large-scale fires between 2017 and 2022, (Fig. 1). Although they are scattered throughout northern France, Belgium, the Netherlands, northern Germany, Denmark, the United Kingdom and Ireland, most are concentrated in the UK and Ireland. Most fires (54%) occurred on peatlands; 26% of fires occurred in moorland and heathlands. Fires in natural grasslands and coniferous woods represented 12 and 7%, respectively. Regarding the temporal distribution of the fires, 8 fires happened in 2017, 10 in 2018, 6 in 2019, 12 in 2020, 4 in 2021 and 18 in 2022. Seasonally, 47 occurred in spring, 8 in summer, 1 in autumn and 2 in winter.
Fire weather
Through the Copernicus Climate Change Service (Vitolo et al. 2020), subcomponents of the FWI System (Van Wagner 1987) were acquired: Fine Fuel Moisture Code (FFMC), Drought Code (DC), Duff Moisture Code (DMC), Initial Spread Index (ISI), Build Up Index (BUI) and FWI. Data were acquired for the study area plus 10 years retrospectively for historical values (i.e. from 2007 to 2022). Analyses were carried out both for raw subcomponents values and for the percentile position at the time of the fire (from 0 to 100) over the 10-year distribution. Statistical analyses were performed for each subcomponent, not just with the most frequently used aggregated variable (FWI), as it was expected that one of the subcomponents could be a better predictor of fire behavior depending on the region (Chelli et al. 2015).
Vegetation phenology
High Resolution Vegetation Phenology and Productivity (HR-VPP) data from the land monitoring service of the Copernicus program (Smets et al. 2021) were employed to describe fluctuations in plant growth or moisture levels. It has three levels of products, each related to variation of remotely sensed vegetation indices at different time scales. We used the second- and third-level products. The second-level product, named Seasonal Trajectory, is a gap-filled and smoothed weekly time series of the Plant Phenology Index (PPI) (Jin and Eklundh 2014), a modern vegetation index that has demonstrated efficacy as a reliable indicator for predicting vegetation growth and related phenology field observations. The third-level product, named Vegetation Phenological and Productivity Parameters, represents seasonal variation of vegetation and greenness and describes the timing of the start and end of seasonal growth. From this, we used both Start of Season (SOS) and End of Season (EOS) observations. For both second- and third-level products, we extracted the mean value for the vegetation that was burned in each fire event.
Modeling process
Our main aim was to assess relationships between ROS, fire weather and phenology. Then, analyses were separated in different steps: 1. Relationships between fire weather and ROS. In order to characterize the weather conditions of each fire, historical percentiles were estimated for all subcomponents of the FWI system and frequency curves were generated to characterize the range in which fires occur in the study area. Subsequently, direct relationships between ROS and gross value of the subcomponent when the fire occurred were analyzed to identify if there was a direct effect between real-time meteorological conditions and spread. 2. Relationships between fire weather and phenology. In order to analyze correlations between both variables, joint variation of all subcomponents of the FWI system and PPI was analyzed when each the fire was spreading. This was done also to describe vegetation conditions for different levels of fire weather risk. 3. Relationships between phenology and ROS. The variation of mean ROS and short-term vegetation conditions (PPI) before fire ignition was assessed. Then, groups of fires were generated according to whether the spread occurred within or outside the seasonal growth period, with the objective of testing whether this was an important factor describing differentiated spread. 4. Finally, a multivariate model was generated including phenology, fire weather and ROS, in order to evaluate which are significant and which best explain the variability of ROS in NW Europe.
Two simultaneous analyses were conducted on each of the subcomponents of the FWI system at different time scales, one for historical percentile-based records, and the other for the concurrent fire weather conditions. The first was conducted through the estimation of historical percentiles. Next, frequency curves were produced to represent the evolution of fire activity as a function of percentiles found in all the fires. This was done in order to provide a description of the potential impact of climatic extremes on the occurrence of these fires. The second involved linear models to analyze the variability of mean ROS based on the raw values of each subcomponent during the occurrence of each fire. Incorporation of season timing was employed in both analyses with the objective of identifying patterns that could describe an interaction between weather, phenology and fire behavior.
Variation between raw values of the subcomponents of the FWI system and the current state of the vegetation, expressed in PPI, was analyzed in a regression model in order to identify possible correlations between both variables.
Aiming to simplify and understand how fire spread is influenced by the short-term condition of vegetation, we analyzed PPI before the ignition of each of the fire events and its correlation with subsequent observed ROS. A simple linear model was built to explore the variation in ROS of each fire as a function of PPI. As a non-linear relation was found, variables were log-transformed.
In order to assess the effect of long-term variations in vegetation conditions, growing season time intervals had to be estimated. These were estimated both for (1) the period of time when each fire was spreading, and for (2) the periods in which vegetation inside the burn scar was growing or not, namely growing and dormant phases. Growing phase intervals were derived based on the mean SOS and EOS observations at each of the fire locations. Dormant phase intervals were the opposite time interval (i.e. period of time when vegetation is not in a growth interval). Hence, discrete and contiguous time intervals were produced that delineate two distinct stages of vegetation greenness or moisture, a variable named Season Timing (ST). Estimation of this variable was done by overlapping, for each fire, the fire occurrence interval and the growing or dormant interval, expressed as a binary factor where ST = 1 for fires occurring in the growing phase and ST = 0 for fires in the dormant phase. Central tendency and dispersion of burned area and mean ROS were compared among the groups, using this factor as potential explainer of variance. A Kruskal–Wallis test (Kruskal and Wallis 1952) was conducted to compare differences in the median of the two variables as a means of hypothesis testing, in order to assess the potential impact of vegetation seasonality on fire spread within our study area.
A generalized additive model (Hastie 2017) was developed in order to evaluate linear and non-linear relationships, and statistical significance on the variability of our response variable: mean ROS. Input variables were PPI (Seasonal Trajectory product), ST, FWI variables (FFMC, DC, DMC, ISI, BUI, FWI) and majority landcover, as we wanted to look for effects of vegetation type in these relationships. We compared different combinations of variables and smoothing functions. Best fit was elected as means of Akaike Information Criterion (AIC) and Bayesian Information Criterion (BIC), but also if the model residuals were homogeneous and normally distributed. For the best fitted model, Partial Explained Deviance (PED) was estimated for each input variable, as a relative measure of variable importance within the model. This was done based on the method proposed by Brunbjerg et al. (2018) by building nested models: (1) one with all the variables (Best model); (2) one with all the variables except from the target variable we wanted to measure PED; and (3) a null model, intercept only. Finally, PED was estimated using Eqn 1. All analyses were performed using R Statistical Software (v4.3.1; R Core Team 2023) and the mgcv package (Wood 2017). Partial Explained Variance (PED) expressed as percentage for each variable within the best fitted model:
Results
Relationships between fire weather and ROS
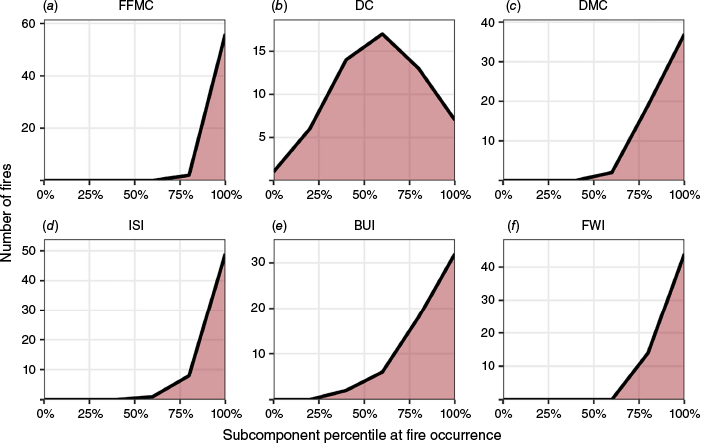
By characterizing the meteorological conditions under which the fires occurred according to their historical record, it is possible to describe certain patterns, shown in Fig. 2. For most of the fires, ignitions occurred above the 60th percentile of almost all subcomponents, except for DC. In particular, the FFMC was the subcomponent with the narrowest distribution, indicating that it is the best predictor of the ignition timing of these fires, which is different from behavior.
Frequency polygons indicating the number of fires observed at different historical percentile values. Percentiles were calculated at the fire level, over the historical record of the last 10 years (2012–2022). Labels indicate each subcomponent of the Fire Weather Index System: (a) Fine Fuel Moisture Code; (b) Drought Code; (c) Duff Moisture Code; (d) Initial Spread Index; (e) Build-Up Index; and (f) Fire Weather Index.
Regarding fire behavior, Fig. 3 describes the relationship between FWI subcomponents values at fire occurrence and the fires’ observed ROS. After log-transforming both variables, linear models were fitted that described different degrees of association, but all had a negative parameter on the subcomponent. FFMC and ISI showed a significant but weak association. However, DC, DMC, BUI and FWI did show a significant and relatively stronger relationship with ROS. The model that best predicted mean ROS was DC, with an R2 of 0.40. In summary, this indicates that the highest propagation rates were observed when the subcomponents recorded low levels of weather risk.
Log-transformed FWI subcomponents values and mean ROS observed. Each panel indicates on the x-axis the value of the FWI subcomponent and on the y-axis the mean ROS: (a) Fine Fuel Moisture Code (FFMC); (b) Drought Code (DC); (c) Duff Moisture Code (DMC); (d) Initial Spread Index (ISI); (e) Built-up Index (BUI); and (f) Fire Weather Index (FWI). Black lines represent linear model fitted for each case. P values for estimating the respective subcomponent and model adjusted R squared (R2) is shown for each case panel.

Relationships between fire weather and phenology
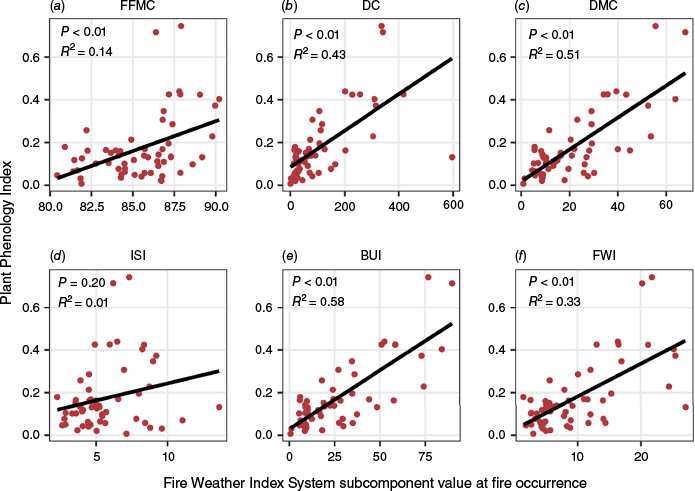
PPI exhibits a positive association with raw values of the FWI subcomponents at the time of the fire (Fig. 4). Non-linear relationships were not found so no transformation of variables was needed. Components that exhibit a significant linear model fit were DC, DMC, BUI and FWI. However, no statistically significant relationship could be established for FFMC and ISI, similarly to the pattern found between FWI subcomponents and ROS, where FFMC and ISI showed a significant but weak association with ROS. In this specific case, BUI demonstrated a stronger linear model fit with PPI, as seen by a positive correlation between elevated risk values and higher PPI values. Therefore, it can be argued that for these fire events, there exists a positive correlation between optimal humidity or vegetation growth conditions and top local levels of weather-related danger.
Fire Weather Index System subcomponent values at fire occurrence, separated in panels, and its respective PPI value. Each panel indicates on the x-axis the value of the subcomponent: (a) Fine Fuel Moisture Code (FFMC); (b) Drought Code (DC); (c) Duff Moisture Code (DMC); (d) Initial Spread Index (ISI); (e) Built-up Index (BUI); and (f) Fire Weather Index (FWI). Black lines represent linear model fitted for each case. P values for estimating the respective subcomponent and model adjusted R squared (R2) is shown for each case panel.
Relationships between phenology and ROS
Our findings indicate that when vegetation is greener or in better conditions (higher PPI), spread decreases, as shown in Fig. 5. Panel (a) displays the raw or untransformed magnitudes of both variables, illustrating a non-linear association between ROS and PPI. After log-transforming both variables, a significant linear model (Panel (b)) could be fitted, confirming its inverse relationship.
(a) Plant Phenology Index (PPI) and mean ROS (km h−1) scatterplot. (b) Linear model fitted for log-transformed PPI and mean ROS.

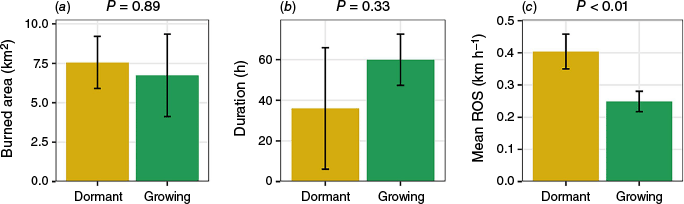
Classification of fires based on season timing (whether a fire spreads in the growing or the dormant phase of vegetation) resulted in the formation of groups with similar sample sizes. A total of 28 fires ignited and spread in the growing phase of vegetation and 30 in the dormant phase. Kruskal–Wallis hypothesis testing outputs indicated that burned area was not significantly different between these two groups (P = 0.90) and the same was observed for fire duration (P = 0.50). Regarding fire spread, our results suggest that the timing of the season is a significant factor in ROS (P < 0.01). Hence, fires spread significantly faster in the dormant phase than in the growing phase, as indicated in Fig. 6.
Multivariate model and explained variance
The model that minimized AIC and BIC, showing homogeneous and normally distributed residuals, was the model that included all the subcomponents of the FWI system in their raw values and that applied a smoothing function to PPI, as shown in Eqn 2. Summary results of this model are shown in Table 1. Generalized additive model formula adjusted to predict mean ROS:
| Variable | Estimate | P-value | Partial explained deviance | ||
|---|---|---|---|---|---|
| Season timing A | −0.203 | <0.01 | 8% | ||
| Fine Fuel Moisture Code (FFMC) | −0.061 | <0.01 | 22% | ||
| Drought Code (DC) | −0.001 | 0.40 | <0% | ||
| Duff Moisture Code (DMC) | 0.013 | 0.47 | <0% | ||
| Initial Spread Index (ISI) | 0.028 | 0.46 | <0% | ||
| Built-Up Index (BUI) | −0.001 | 0.94 | <0% | ||
| Fire Weather Index (FWI) | −0.009 | 0.78 | <0% | ||
| Land cover | Moorland/Heathland | 0.060 | 0.66 | 6% | |
| Grasslands | 0.056 | 0.71 | |||
| Peatbogs | 0.201 | 0.10 | |||
| s(Plant Phenology Index (PPI)) B | 0.02 | 16% | |||
Estimates for the linear terms, P-value, and partial explained deviance for both parametric and smoothed terms. Significant variables shaded in gray. Partial explained variances for each variable.
The model exhibits a coefficient of determination (R2) of 0.44 and an explained deviance of 59%. Residuals exhibit a distribution that follows a normal-type pattern and homogeneity of variance, as shown in Fig. 7. Statistical significance amongst variables was found for ST, FFMC and the smoothed term of PPI. No significance was found for any land cover type, hence no effect related to vegetation structure. The generation of nested models within this final model allowed us to identify those significant variables with the highest percentage of explained variation: FFMC, ST and PPI, in decreasing order.

Discussion
When fire weather indicators are higher, spread rates are lower – a mismatch between fire weather danger and fire behavior
The results of this study correspond to those reported by De Jong et al. (2016) in the UK, where fires occur at high percentiles of the Canadian FWI. All fires evaluated in the present work occurred above the 60th percentile of the historical record for all subcomponents except DC. Although this is a good indicator of occurrence, there is an interesting mismatch when attempting to predict subsequent fire behavior. The observed spread rates show an inverse association with DC, DMC, BUI and FWI, which is still weak. FFMC and ISI are well-known indicators of potential ROS and contrary to expectations, are the two subcomponents in this region that have no strong relationship with observed ROS. Although it has been shown that this system can be well adjusted for Mediterranean ecosystems in Europe (Bedia et al. 2018), there is little information associated with ROS in temperate heathland–peatland ecosystems; thus, this work may indicate that the subsequent development of larger-scale fires in this region is driven largely by other variables.
When fire weather indicators are higher, vegetation conditions are better: the need to build weather indicators for low levels of live fuel moisture
Regarding relationships between vegetation conditions and climatic variation, it is known that in Mediterranean shrublands in Europe, live fuel moisture decreases when subcomponents of FWI such as DC and DMC increase, a phenomenon that regularly occurs in periods close to summer (Viegas et al. 2001; Pellizzaro et al. 2007). In our study region, it was possible to observe the opposite effect, where PPI, as a proxy of greenness and vegetation moisture conditions, increases together with most of the subcomponents (DC, DMC, BUI and FWI). This agrees with what was recently reported by Little et al. (2024) in UK heathlands, where there is a considerable increase in LFMC between April and May, periods when there is also a considerable local increase in most subcomponents of FWI (De Jong et al. 2016). From these points, it is clear that it is important to adapt globally used fire weather indicators in order to adjust for regional live fuel moisture.
Inverse relationship between current vegetation conditions and observed rate of spread
This study highlights the need to study fire behavior drivers in regions with different ecosystem dynamics than most studied regions, specially where there is not much information available, because associations between potential covariates and ROS vary significantly between local and global scales (Schag et al. 2022). The inverse relationship between current vegetation greenness/moisture conditions and observed propagation rates is an interesting finding. This relates to what was observed by Rossa et al. (2016) and Davies and Legg (2008) in both laboratory experiments in Portugal and the field in Scotland, measuring different types of fuels and comparing moisture percentages with their ROS. It is also in agreement with findings made from remotely sensed data between propagation rates measured in real incidents and a live fuel moisture proxy in Italy (Maffei and Menenti 2019). In our work, a non-linear relationship between PPI (ST, smoothed function) and ROS can be seen. In high PPI ranges, ROS is not as sensitive to reductions of this variable. When crossing a threshold of ~0.2 PPI, the relationship becomes negative and almost linear, where PPI reductions imply a high increase in ROS. Even though PPI is a relative quantity, it still highlights this non-linear/threshold pattern. This could be related to the phenomenon of thresholds proposed by Pausas and Keeley (2021), where greater recurrence of extreme fire behavior can be found from certain environmental threshold values, in this case of humidity or greenness of the vegetation.
Phenology as a discrete and important indicator of fire spread
By analyzing the effect of vegetation greenness or wetness with this discrete approach (i.e. identifying dormant and growing periods by using start and end of growing season), we highlighted the importance of long-term, seasonal variation on fire behavior. For fires of similar final burned area and duration, there is significantly faster spread when vegetation in the general area is in the dormant period than in the growing period. The incorporation of this variable may be addressing the effect of sudden LFMC changes reported for shrublands within this same region (Davies et al. 2010). Within this, there may be an effect of fuel structure, as it has been shown that mature heathlands have greater variability in ROS and reach higher values (Davies et al. 2009). Therefore, it is likely that the fires evaluated in our study correspond to heathlands with more biomass available for incineration when fuel moisture values decay. However, incorporating vegetation structure into this research was outside the scope of this study. Nonetheless, it is important to note the need for regional-scale and open access data for describing vegetation structure and the potential for future research in this area.
Importance of fuel variability conditions and adapted fire weather indices
The most important variables in explaining ROS were PPI, ST and FFMC. The variables are significant and also have the highest explained deviance. It is noteworthy that FFMC increases in importance within a multivariate model when all the other variables are incorporated. Regarding phenology, a state of active growth in the vegetation (value factor 1 in the model) generates the greatest reduction in ROS. However, the highest propagation rates observed are related to the lowest FFMC values. It is also important to mention the non-significance of land cover within the model, contrary to what might be expected. This could indicate that in the range of vegetation types studied, variation in this does not imply substantial differences in the rate of fire spread as the other variables do.
The findings of this work highlight two important points when describing fire behavior in a region of changing fire regimes such as NW Europe: first, the importance of analyzing the variability of fuel conditions, especially using a phenological and seasonal approach, capturing moments when vegetation conditions change and when hazard conditions occur. This could have a greater explanatory effect than local climatic conditions. It is still necessary to explore these relationships, especially with field data. Second, it reinforces current efforts to create a new fire weather danger rating system tailored to this region. Results from this work support the idea of integrating live fuel moisture variability into current and future fire weather danger projects. This work serves as evidence of these two points, in order to better understand fire behavior in under-represented regions of increasing wildfire risk.
Data availability
The Canadian Fire Weather Index System data are publicly available through the Copernicus Climate Data Store (https://cds.climate.copernicus.eu, last accessed: 19 June 2023). The High-Resolution Vegetation Phenology and Productivity product is publicly available through the WekEO platform from the Copernicus project (https://www.wekeo.eu, last accessed: 12 June 2023). The CORINE 2012 land cover data are publicly available through the Copernicus Land Monitoring Service (https://land.copernicus.eu, last accessed 15 June 2023). Fires clustered events, isochrones and ROS vectors are available on the Zenodo platform (10.5281/zenodo.11119580). The processing codes used in this study are available from the corresponding authors on request.
Conflicts of interest
It has been affirmed by the corresponding author that no authors have conflicting interests related to the matter.
Declaration of funding
This project received funding from the European Union’s Horizon 2020 research and innovation program under the Marie Skłodowska-Curie grant agreement no. 860787: PyroLife Innovative Training Network; https://pyrolife.lessonsonfire.eu/, last accessed March 2024), a project in which a new generation of experts is trained in integrated fire management.
References
Amatulli G, Camia A, San-Miguel-Ayanz J (2013) Estimating future burned areas under changing climate in the EU Mediterranean countries. Science of The Total Environment 450–451, 209-222.
| Crossref | Google Scholar | PubMed |
Andela N, Morton DC, Giglio L, Paugam R, Chen Y, Hantson S, Van Der Werf GR, Anderson JT (2019) The Global Fire Atlas of individual fire size, duration, speed and direction. Earth System Science Data 11(2), 529-552.
| Crossref | Google Scholar |
Bajocco S, Rosati L, Ricotta C (2010) Knowing fire incidence through fuel phenology: a remotely sensed approach. Ecological Modelling 221(1), 59-66.
| Crossref | Google Scholar |
Bajocco S, Guglietta D, Ricotta C (2015) Modelling fire occurrence at regional scale: aoes vegetation phenology matter? European Journal of Remote Sensing 48, 763-775.
| Crossref | Google Scholar |
Bedia J, Herrera S, Camia A, Moreno JM, Gutiérrez JM (2014) Forest fire danger projections in the Mediterranean using ENSEMBLES regional climate change scenarios. Climatic Change 122(1–2), 185-199.
| Crossref | Google Scholar |
Bedia J, Herrera S, Gutiérrez JM, Benali A, Brands S, Mota B, Moreno JM (2015) Global patterns in the sensitivity of burned area to fire-weather: implications for climate change. Agricultural and Forest Meteorology 214–215, 369-379.
| Crossref | Google Scholar |
Bedia J, Golding N, Casanueva A, Iturbide M, Buontempo C, Gutiérrez JM (2018) Seasonal predictions of Fire Weather Index: paving the way for their operational applicability in Mediterranean Europe. Climate Services 9, 101-110.
| Crossref | Google Scholar |
Belcher CM, Brown B I, Clay GD, Doerr D SH, Elliott A, Gazzard R, Kettridge N, Morison J, Perry M, Santin C, Smith TEL, Research F, Holt A, Lodge AH (2021) UK Wildfires and their Climate Challenges. Available at https://research.manchester.ac.uk/en/publications/uk-wildfires-and-their-climate-challenges-expert-led-report-prepa
Bisquert M, Sánchez JM, Caselles V (2013) Modeling fire danger in Galicia and Asturias (Spain) from MODIS images. Remote Sensing 6(1), 540-554.
| Crossref | Google Scholar |
Brunbjerg AK, Hale JD, Bates AJ, Fowler RE, Rosenfeld EJ, Sadler JP (2018) Can patterns of urban biodiversity be predicted using simple measures of green infrastructure? Urban Forestry & Urban Greening 32, 143-153.
| Crossref | Google Scholar |
Caparros-Santiago JA, Rodriguez-Galiano V, Dash J (2021) Land surface phenology as indicator of global terrestrial ecosystem dynamics: a systematic review. ISPRS Journal of Photogrammetry and Remote Sensing 171, 330-347.
| Crossref | Google Scholar |
Cardil A, Tapia VM, Monedero S, Quinones T, Little K, Stoof CR, Ramirez J, De-Miguel S (2023) Characterizing the rate of spread of large wildfires in emerging fire environments of northwestern Europe using Visible Infrared Imaging Radiometer Suite active fire data. Natural Hazards and Earth System Sciences 23(1), 361-373.
| Crossref | Google Scholar |
Chelli S, Maponi P, Campetella G, Monteverde P, Foglia M, Paris E, Lolis A, Panagopoulos T (2015) Adaptation of the Canadian Fire Weather Index to Mediterranean forests. Natural Hazards 75(2), 1795-1810.
| Crossref | Google Scholar |
Cruz MG, Alexander ME, Sullivan AL, Gould JS, Kilinc M (2018) Assessing improvements in models used to operationally predict wildland fire rate of spread. Environmental Modelling and Software 105, 54-63.
| Crossref | Google Scholar |
Davies GM, Legg CJ (2008) Developing a live fuel moisture model for moorland fire danger rating. WIT Transactions on Ecology and the Environment 119, 225-236.
| Crossref | Google Scholar |
Davies GM, Legg CJ (2011) Fuel moisture thresholds in the flammability of Calluna vulgaris. Fire Technology 47(2), 421-436.
| Crossref | Google Scholar |
Davies GM, Legg CJ, Smith AA, MacDonald AJ (2009) Rate of spread of fires in Calluna vulgaris-dominated moorlands. Journal of Applied Ecology 46(5), 1054-1063.
| Crossref | Google Scholar |
Davies GM, Legg CJ, O’Hara R, MacDonald AJ, Smith AA (2010) Winter desiccation and rapid changes in the live fuel moisture content of Calluna vulgaris. Plant Ecology and Diversity 3(3), 289-299.
| Crossref | Google Scholar |
De Angelis A, Bajocco S, Ricotta C (2012) Modelling the phenological niche of large fires with remotely sensed NDVI profiles. Ecological Modelling 228, 106-111.
| Crossref | Google Scholar |
De Graaf MCC, Bobbink R, Smits NAC, Van Diggelen R, Roelofs JGM (2009) Biodiversity, vegetation gradients and key biogeochemical processes in the heathland landscape. Biological Conservation 142(10), 2191-2201.
| Crossref | Google Scholar |
De Jong MC, Wooster MJ, Kitchen K, Manley C, Gazzard R, McCall FF (2016) Calibration and evaluation of the Canadian Forest Fire Weather Index (FWI) System for improved wildland fire danger rating in the United Kingdom. Natural Hazards and Earth System Sciences 16(5), 1217-1237.
| Crossref | Google Scholar |
De Rigo D, Libertà G, Durrant TH, Vivancos A, San-Miguel-Ayanz J (2017) ‘Forest fire danger extremes in Europe under climate change: variability and uncertainty.’ (Publications Office of the European Union) 10.2760/13180
European Environment Agency (2019) Corine Land Cover (CLC) 2012. Version 20b. Available at https://land.copernicus.eu/pan-european/corine-land-cover/clc-2012
Feranec J, Jaffrain G, Soukup T, Hazeu G (2010) Determining changes and flows in European landscapes 1990-2000 using CORINE land cover data. Applied Geography 30(1), 19-35.
| Crossref | Google Scholar |
García M, Riaño D, Yebra M, Salas J, Cardil A, Monedero S, Ramirez J, Martín MP, Vilar L, Gajardo J, Ustin S (2020) A live fuel moisture content product from landsat TM satellite time series for implementation in fire behavior models. Remote Sensing 12(11), 1714.
| Crossref | Google Scholar |
Gill AM, Allan G (2008) Large fires, fire effects and the fire-regime concept. International Journal of Wildland Fire 17(6), 688-695.
| Crossref | Google Scholar |
Huang Y, Wu S, Kaplan JO (2015) Sensitivity of global wildfire occurrences to various factors in the context of global change. Atmospheric Environment 121, 86-92.
| Crossref | Google Scholar |
Jin H, Eklundh L (2014) A physically based vegetation index for improved monitoring of plant phenology. Remote Sensing of Environment 152, 512-525.
| Crossref | Google Scholar |
Jones MW, Abatzoglou JT, Veraverbeke S, Andela N, Lasslop G, Forkel M, Smith AJP, Burton C, Betts RA, van der Werf GR, Sitch S, Canadell JG, Santín C, Kolden C, Doerr SH, Le Quéré C (2022) Global and regional trends and drivers of fire under climate change. Reviews of Geophysics 60(3), e2020RG000726.
| Crossref | Google Scholar |
Kruskal WH, Wallis WA (1952) Use of ranks in one-criterion variance analysis. Journal of the American Statistical Association 47(260), 583-621.
| Crossref | Google Scholar |
Little K, Graham LJ, Flannigan M, Belcher CM, Kettridge N (2024) Landscape controls on fuel moisture variability in fire-prone heathland and peatland landscapes. Fire Ecology 20(1), 14.
| Crossref | Google Scholar |
Log T, Thuestad G, Velle LG, Khattri SK, Kleppe G (2017) Unmanaged heathland – A fire risk in subzero temperatures? Fire Safety Journal 90, 62-71.
| Crossref | Google Scholar |
Lung T, Lavalle C, Hiederer R, Dosio A, Bouwer LM (2013) A multi-hazard regional level impact assessment for Europe combining indicators of climatic and non-climatic change. Global Environmental Change 23(2), 522-536.
| Crossref | Google Scholar |
Maffei C, Menenti M (2019) Predicting forest fires burned area and rate of spread from pre-fire multispectral satellite measurements. ISPRS Journal of Photogrammetry and Remote Sensing 158, 263-278.
| Crossref | Google Scholar |
Nikonovas T, Santín C, Belcher CM, Clay GD, Kettridge N, Smith TEL, Doerr SH (2024) Vegetation phenology as a key driver for fire occurrence in the UK and comparable humid temperate regions. International Journal of Wildland Fire 33(10), WF23205.
| Crossref | Google Scholar |
Pausas JG, Bradstock RA (2007) Fire persistence traits of plants along a productivity and disturbance gradient in mediterranean shrublands of south-east Australia. Global Ecology and Biogeography 16(3), 330-340.
| Crossref | Google Scholar |
Pausas JG, Keeley JE (2021) Wildfires and global change. Frontiers in Ecology and the Environment 19(7), 387-395.
| Crossref | Google Scholar |
Pausas JG, Ribeiro E (2013) The global fire–productivity relationship. Global Ecology and Biogeography 22(6), 728-736.
| Crossref | Google Scholar |
Pellizzaro G, Cesaraccio C, Duce P, Ventura A, Zara P (2007) Relationships between seasonal patterns of live fuel moisture and meteorological drought indices for Mediterranean shrubland species. International Journal of Wildland Fire 16(2), 232-241.
| Crossref | Google Scholar |
Potter C (2020) Changes in growing season phenology following wildfires in Alaska. Remote Sensing in Earth Systems Sciences 3, 95-109.
| Crossref | Google Scholar |
R Core Team (2023) R: A Language and Environment for Statistical Computing. Vienna, Austria. Retrieved from https://www.R-project.org/
Reed BC, Schwartz MD, Xiao X (2009) Remote Sensing Phenology. In ‘Phenology of Ecosystem Processes: Applications in Global Change Research’. (Ed. A Noormets) pp. 231–246. (Springer: New York, NY, USA) 10.1007/978-1-4419-0026-5_10
Rossa CG, Veloso R, Fernandes PM (2016) A laboratory-based quantification of the effect of live fuel moisture content on fire spread rate. International Journal of Wildland Fire 25(5), 569-573.
| Crossref | Google Scholar |
Ruffault J, Curt T, Moron V, Trigo RM, Mouillot F, Koutsias N, Pimont F, Martin-StPaul N, Barbero R, Dupuy J-L, Russo A, Belhadj-Khedher C (2020) Increased likelihood of heat-induced large wildfires in the Mediterranean Basin. Scientific Reports 10(1), 13790.
| Crossref | Google Scholar | PubMed |
Sankey JB, Wallace CSA, Ravi S (2013) Phenology-based, remote sensing of post-burn disturbance windows in rangelands. Ecological Indicators 30, 35-44.
| Crossref | Google Scholar |
Schag GM, Stow DA, Riggan PJ, Nara A (2022) Spatial-statistical analysis of landscape-level wildfire rate of spread. Remote Sensing 14(16), 3980.
| Crossref | Google Scholar |
Schroeder W, Oliva P, Giglio L, Csiszar IA (2014) The New VIIRS 375m active fire detection data product: algorithm description and initial assessment. Remote Sensing of Environment 143, 85-96.
| Crossref | Google Scholar |
Smets B, Cai Z, Eklundh L, Tian F, Bonte K, Van Hoost R, De Roo B, Jacobs T, Camacho F, Sanchez-Zapero J, Martinez-Sanchez E, Swinnen E, Scheifinger H, Hufkens K, Jonsso P (2021) Copernicus Land Monitoring Service. High Resolution Vegetation Phenology and Productivity (HR-VPP). Seasonal Trajectories and VPP Parameters. Available at https://land.copernicus.eu/en/technical-library/product-user-manual-of-seasonal-trajectories/@@download/file
Stoof CR, Kok E, Cardil Forradellas A, Van Marle M (2024) In temperate Europe, fire is already here: the case of The Netherlands. Ambio 53, 604-623.
| Crossref | Google Scholar | PubMed |
Sundseth K European Commission Environment Directorate General (2009) ‘Natura 2000 in the Atlantic Region.’ (Publications Office) 10.2779/82343
Van Leeuwen WJD, Casady GM, Neary DG, Bautista S, Alloza JA, Carmel Y, Wittenberg L, Malkinson D, Orr BJ (2010) Monitoring post-wildfire vegetation response with remotely sensed time-series data in Spain, USA and Israel. International Journal of Wildland Fire 19(1), 75-93.
| Crossref | Google Scholar |
Van Wagner C (1987) Development and Structure of the Canadian Forest Fire Weather Index System. Available at https://ostrnrcan-dostrncan.canada.ca/entities/publication/d96e56aa-e836-4394-ba29-3afe91c3aa6c
Viegas DX, Piñol J, Viegas MT, Ogaya R (2001) Estimating live fine fuels moisture content using meteorologically based indices. International Journal of Wildland Fire 10(2), 223-240.
| Crossref | Google Scholar |
Vitolo C, Di Giuseppe F, Barnard C, Coughlan R, San-Miguel-Ayanz J, Libertá G, Krzeminski B (2020) ERA5-based global meteorological wildfire danger maps. Scientific Data 7(1), 216.
| Crossref | Google Scholar | PubMed |
Walker JJ, Soulard CE (2019) Phenology patterns indicate recovery trajectories of ponderosa pine forests after high-severity fires. Remote Sensing 11(23), 2782.
| Crossref | Google Scholar |
Wang W, Quan X (2023) Estimation of live fuel moisture content from multiple sources of remotely sensed data. IEEE Geoscience and Remote Sensing Letters 20, 1-5.
| Crossref | Google Scholar |
Wang J, Zhang X (2020) Investigation of wildfire impacts on land surface phenology from MODIS time series in the western US forests. ISPRS Journal of Photogrammetry and Remote Sensing 159, 281-295.
| Crossref | Google Scholar |
Yebra M, Dennison PE, Chuvieco E, Riaño D, Zylstra P, Hunt ER, Danson FM, Qi Y, Jurdao S (2013) A global review of remote sensing of live fuel moisture content for fire danger assessment: moving towards operational products. Remote Sensing of Environment 136, 455-468.
| Crossref | Google Scholar |