

Comparing biomass consumption estimated from point cloud data versus long-wave infrared imagery during prescribed growing season burns in pine woodlands of the southeastern United States
Benjamin C. Bright A * , Andrew T. Hudak A , Nuria Sánchez-López A , E. Louise Loudermilk B , Christie M. Hawley B , Eric Rowell C , Joseph J. O’Brien B , Steven A. Flanagan B , Kevin Robertson D , Akira Kato E , Chad Hoffman F , David R. Weise G and J. Kevin Hiers H
A
B
C
D
E
F
G
H
Abstract
Researchers have developed technologies for fine-scale characterization of fuels via laser scanning and fine-scale measurement of surface fire behavior via terrestrial long-wave infrared (LWIR) imaging. Few studies have compared these technologies for their ability to estimate fuel consumption.
Here we compare fuel consumption estimated from point cloud data with fuel consumption estimated from LWIR imagery collected during prescribed burns of pine woodlands in the southeastern United States.
We adapted existing methods to estimate and map pre- and post-fire fuels and fuel consumption across several prescribed burn units. We related mapped estimates of fuel consumption to coincident estimates of fuel consumption based on energy release calculations derived from LWIR imaging.
Fuel consumption estimated from point cloud data was positively and significantly related to LWIR-derived consumption estimates at LWIR plots (R2 = 0.72, n = 14).
We demonstrate a methodology for mapping fuel consumption from laser scanning data that provides consumption estimates comparable to those of LWIR imagery.
Our findings highlight the relative importance of both surface and understory fuels to fire effects in fire-dependent pine woodlands of the southeastern United States, and the need for more research examining relationships between LWIR imagery and combusted fuels.
Keywords: airborne laser scanning, fire radiative energy, fuel consumption mapping, fuel mapping, litter, long-wave infrared imagery, North America, pine woodlands, predictive modeling, prescribed fire, remote sensing, southeastern United States, surface fire, terrestrial laser scanning, understory fuel.
Introduction
Spatially explicit, fine-scale (0.01–1 m spatial resolution) characterization of fuel, fire behavior and fuel consumption is needed in the many ecosystems where fine-scale heterogeneity in fuels drives fire behavior and its many ecological effects (Hiers et al. 2009; O’Brien et al. 2016; Ritter et al. 2020). Such characterization is particularly challenging in surface fire-maintained grassy or shrubby savannas and woodlands where trees influence the spatial distribution of fire. In pine woodlands of the southeastern United States, high-resolution remote sensing methods have been demonstrated for (1) mapping understory fuels (defined here as shrubs and grass 0.1–2 m aboveground) and surface fuels (defined here as litter and fine woody debris 0–0.1 m aboveground) at fine scales, especially via terrestrial laser scanning (TLS) trained with field observations (e.g. Loudermilk et al. 2009, 2023), (2) modeling and mapping surface fuels from airborne laser scanning (ALS) (Sánchez-López et al. 2023), and (3) measuring fine-scale surface fire behavior via terrestrial longwave infrared (LWIR) thermography (Loudermilk et al. 2014; O’Brien et al. 2015, 2016). However, few studies have examined relationships between point cloud-derived fuel estimates and surface fire behavior as measured by high-resolution LWIR thermography (Hiers et al. 2009; Loudermilk et al. 2012; O’Brien et al. 2016). These two alternative approaches can be used to estimate fuel consumption either indirectly (derived from pre-and post-fire point clouds and field observations; French and Hudak 2023) or directly (derived from active fire thermography). More studies evaluating both direct and indirect methods for estimating fuel consumption are needed.
Here we describe a methodology for estimating fuel consumption by combining TLS-derived estimates of understory fuels, defined here as grass and shrubs 0.1–2 m aboveground, with ALS-derived estimates of surface fuels, defined here as downed woody debris, leaf litter and other herbaceous material 0–0.1 m aboveground. We compare these point cloud estimates of fuel consumption with fuel consumption estimated from fire radiative energy measured via high-resolution LWIR thermography in frequently burned pine woodlands in the southeastern United States. Our goal is to validate indirect laser scanning methods with more established direct LWIR methods and to demonstrate an alternative method for estimating fuel consumption that does not require real-time LWIR imagery.
Several studies have shown how TLS, in which the light detection and ranging (lidar) scanning instrument is mounted above the vegetation layer on a ground-based tripod or pole, can be used to estimate subcanopy and near-ground vegetation and fuels (see table 1 of Maxwell et al. 2023). In these approaches, field observations are used to train statistical models relating field-measured vegetation attributes to TLS point cloud data. Statistical models can then be applied across point cloud extents to estimate fine-scale (0.01–1 m spatial resolution) vegetation characteristics for areas that are larger than could be realistically sampled via field measurements alone (Pokswinski et al. 2021). Multitemporal TLS applied before and after disturbance events can be used to assess fine-scale vegetation change, such as consumption by fire (Hudak et al. 2020; Loudermilk et al. 2023). However, challenges remain in using TLS sensors to accurately estimate shrubs, herbaceous and small trees in the subcanopy as well as litter and dead down woody fuels near the surface. First, TLS point cloud data in vegetative areas usually include occlusion artifacts. Occlusion occurs when an object nearer the TLS sensor obstructs an object behind it from detection by the laser. In other words, the TLS laser needs a clear line of sight to sense objects, and occlusion occurs when this line of sight is obstructed. An example of occlusion is a tree bole near the TLS blocking vegetation behind the tree bole from being sensed by the laser. Occlusion can lead to ‘no data’ voids or incomplete measurement of vegetation (Wallace et al. 2017). Occlusion can partly be overcome by imaging areas of interest from multiple angles, although in areas of dense vegetation occlusion in TLS point cloud data will still be present. Second, directly measuring variation in surface fuels is challenging because of the difficulty in discriminating the ground surface returns from the near-surface fuel layer returns for reliable estimates of surface fuel bed depth. This limitation can partly be overcome by predicting surface fuels indirectly from overstory and biophysical correlates and an understanding of spatial associations (Lydersen et al. 2015; Hudak et al. 2016b; Chen et al. 2017; Bright et al. 2022; Hoffman et al. 2023; McDanold et al. 2023; Sánchez-López et al. 2023).
LWIR thermography, in which sensors measure LWIR radiation emitted by burning surfaces, is a remote sensing technology that can be used to quantify fire behavior and effects through space and time at submeter to fire-size (thousands of hectares) scales (Dickinson et al. 2015; O’Brien et al. 2015). Fire-emitted LWIR has been shown to be related to burn severity (Heward et al. 2013), combusted fuel type (Loudermilk et al. 2012) and fuel consumption (Wooster et al. 2005; Freeborn et al. 2008; Kremens et al. 2012; Hudak et al. 2016a). A strong positive correlation (R2 = 0.88–0.98) between fire radiative energy (FRE, the integral of fire radiative power (FRP)) and fuel consumption has been demonstrated in small fire experiments, as predicted by theory (e.g. Wooster et al. 2005; Freeborn et al. 2008). However, certain limitations to interpreting LWIR data can cause discrepancies between observed LWIR radiation and expected consumption at fire-size (thousands of hectares) scales, specifically related to properly calibrating LWIR imagery to FRP by LWIR sensor view angle, atmospheric absorption of LWIR, and the assumption of blackbody radiation from fires (Dickinson et al. 2015). Other possible LWIR limitations that have been described are (1) LWIR undersampling that can result in underprediction of expected consumption (Hudak et al. 2016a), which can be partially overcome through LWIR interpolation (Boschetti and Roy 2009; Klauberg et al. 2018), and (2) occlusion of fire-emitted LWIR by vegetation that can lead to LWIR measurement bias in estimates of consumption (Hudak et al. 2016a). Thus, the relationship between LWIR imagery and imaged phenomena should be thoroughly examined when used in remote sensing analyses, and more work is needed to investigate how LWIR imagery relates to fire effects at multiple scales.
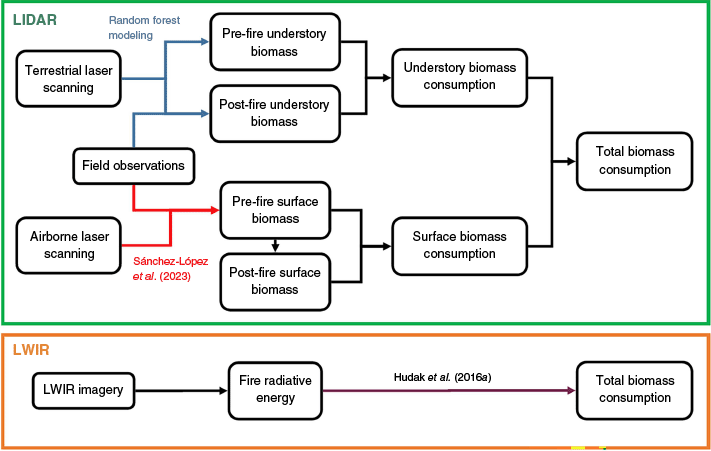
Here, we investigate the relationship between high-resolution estimates of understory and surface fuel consumption derived from TLS and ALS point cloud data and LWIR imagery in frequently burned pine woodlands of the southeastern United States. To the degree that results from these approaches correspond to one another, we may gain confidence in both and benefit from the potential advantages of using lidar-based methods in future applications. Our research objectives were to: (1) develop models predicting understory fuel and understory fuel consumption from pre- and post-fire TLS point cloud data, following the methodology of Hudak et al. (2020), (2) improve upon the methods of Hudak et al. (2020) by combining these TLS-derived understory fuel estimates with ALS-derived surface fuel estimates derived from the approach of Sánchez-López et al. (2023), and (3) compare these mapped estimates of fuel consumption with those derived from LWIR thermography (Fig. 1); our goal for this comparison was to evaluate which indirect point cloud-based method provides more comparable consumption estimates to the direct LWIR-based method. Our hypothesis is that accounting for all fuel components consumed (both understory and surface) should produce a closer 1:1 relationship than considering only understory alone.
Methodological workflows used in this study for estimating biomass consumption with light detection and ranging (lidar) and long-wave infrared (LWIR) imagery. In the lidar method, field measurements of biomass are used to train a random forest model with terrestrial laser scanning (TLS) data as input to predict spatial distribution of understory biomass. Understory biomass is defined here as biomass residing between 0.1 and 2 m aboveground. Surface biomass, defined as biomass residing between 0 and 0.1 m aboveground, is estimated using the method of Sánchez-López et al. (2023), in which leaf litter biomass is estimated from airborne laser scanning (ALS) data and years since fire using models they established. Consumption is calculated indirectly by differencing pre- and post-fire biomass estimates. In the LWIR method, LWIR imagery is integrated and converted to fire radiative energy, from which biomass consumption is estimated directly with the equation of Hudak et al. (2016a). Colored arrows and text indicate modeling methodologies.
Materials and methods
Study areas
The study was conducted on three burn units (PHP1, PHP2, PHP3) within Pebble Hill Plantation (PHP), which covers 1222-ha in southwestern Georgia, USA, near the Florida border (30.76349°N, 84.09093°W, Fig. 2). Pine woodlands at Pebble Hill are maintained by frequent prescribed burning, usually every 1–2 years. Native upland longleaf pine (Pinus palustris Mill.) with a wiregrass (Aritistida stricta Michx.) understory dominates areas undisturbed by previous tilling for row crop agriculture (Carr et al. 2010; Florida Natural Areas Inventory 2010; Ostertag and Robertson 2007). Terrain is gently sloping with well-drained sandy and loamy soils over clay- and sand-dominated subhorizons (Ostertag and Robertson 2007). Annual precipitation averages 1390 mm. Average minimum and maximum July temperatures at PHP are 22.2 and 30.0°C, respectively. Average minimum and maximum January temperatures are 4.3 and 16.8°C, respectively (1991–2020 climate normals from 800 m PRISM grids, https://prism.oregonstate.edu/normals/).
Burn unit boundaries and locations of field observation plots and long-wave infrared (LWIR) imagery plots within Pebble Hill Plantation (PHP), Georgia and Fort Jackson, South Carolina (Panel a). Unit ‘PHP1’ in PHP was burned and measured in 2018, and units ‘PHP1’, ‘PHP2’, and ‘PHP3’ were burned and measured in 2019 (Panel b). Units ‘16D1’, ‘16D5’, ‘24A7’, and ‘24B8’ in Fort Jackson were burned in 2018 (Panels c–e). Both pre- and post-fire terrestrial laser scanning (TLS) data were gathered across each unit. Background imagery is true-color National Agriculture Imagery Program (NAIP) imagery.
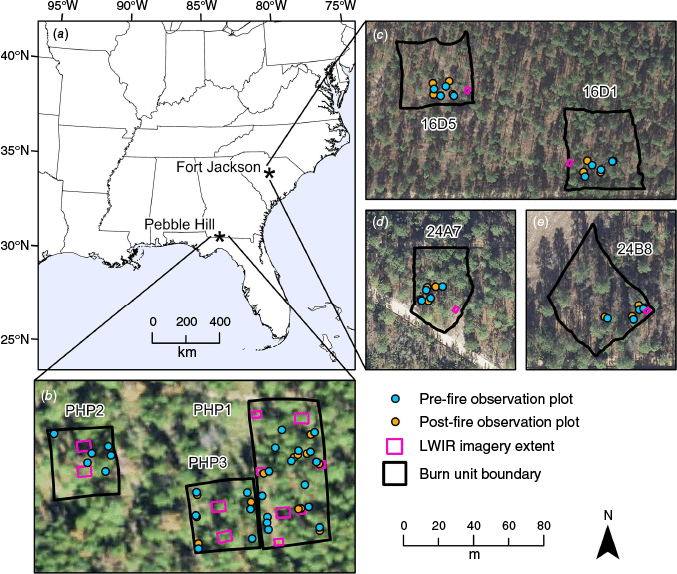
To increase the sample size in our point cloud- and LWIR-derived consumption comparison, we included data from the study of Hudak et al. (2020), where TLS-derived estimates of biomass consumption, ALS-derived estimates of surface fuel consumption and LWIR-estimated consumption were available within four burn units (16D1, 16D5, 24A7, 24B8) in a similar frequently burned southern pine woodland in Fort Jackson, South Carolina (34.045263°N, 80.833969°W, Fig. 2). Like PHP, Fort Jackson contains pine woodlands dominated by longleaf and slash pine (Pinus elliottii Engelm.), which are maintained by frequent (2–5 year) prescribed burning, with the goal of facilitating military training and conserving red-cockaded woodpecker (Picoides borealis) habitat. Fort Jackson occurs in the Carolina Sandhills region, which is characterized by low topographic relief and well-drained sandy soils (Swezey et al. 2016). Hudak et al. (2020) details the process of estimating understory (0.1–2 m aboveground) biomass consumption from TLS data at Fort Jackson. We summarize their methods and describe our process for imitating their methods at PHP, in the following methods descriptions.
In April 2018, PHP unit ‘PHP1’ was prescribed burned (Fig. 2b). On 17 and 18 June 2019, the ‘PHP1’ unit was again prescribed burned, along with units ‘PHP2’ and ‘PHP3’, which had been burned 2 years prior in 2017. Units ‘16D1’, ‘16D5’, ‘24A7’, and ‘24B8’ within Fort Jackson were prescribed burned in May 2018 after not being burned for 2 years (Fig. 2c–e). For each fire, crews established black lines downwind and lit variably spaced head fires across units.
Field observations of biomass
We made three-dimensional (3D) field observations of biomass for various heights above ground on 14 plots across ‘PHP1’ in April 2018 and 26 plots across ‘PHP1’, ‘PHP2’, and ‘PHP3’ in June 2019 following the methodology of Hawley et al. (2018) (Fig. 2a). 3D plot dimensions were 0.5 m wide, 0.5 m deep, and 2 m high. We destructively harvested biomass in 10 cm height strata for the 10 height strata between 0 and 1 m aboveground, i.e. each stratum had a volume of 0.5 m × 0.5 m × 0.1 m = 0.025 m3. We also harvested biomass between 1 and 2 m aboveground but not in 10cm height strata; we therefore did not include biomass measurements between 1 and 2 m aboveground in models. Understory biomass was practically nonexistent above 2 m and was therefore ignored. We marked the northwestern corners of plots with conduits and recorded conduit locations with global navigation satellite system (GNSS) receivers, so that we could later visually identify and adjust plot locations to align with coincident georeferenced TLS-derived point clouds. In 2018, we sampled seven plots pre-fire and seven plots post-fire. In 2019, we sampled 20 plots pre-fire, but because of a heavy precipitation and wind event that occurred immediately post fire and disturbed post-fire conditions, we destructively sampled only six of 20 planned post-fire plots. Following fieldwork, we dried biomass samples at 70°C for 48 h and weighed them immediately afterwards. At Fort Jackson in 2018, we also used the sample protocol of Hawley et al. (2018) to collect 32 (16 pre-fire and 16 post-fire) 3D plot observations of biomass (Fig. 2c–e).
We collected fuel moisture samples of both surface and understory components at several locations within or immediately adjacent to burn units on the day of the burns to calculate fuel water content. Targeted sample weights in PHP in 2018 and 2019 were 400 and 25 g, respectively; the targeted sample weight at Fort Jackson was 100 g. We recorded wet weights of fuel moisture samples within 1 h of collection in the field; samples were stored in plastic bags during this time. We later oven-dried fuel moisture samples at 70°F for 48 h and recorded dry weights. We then calculated fuel water content (FWC) for each sample using the following equation:
where FWC is fuel water content (%), WW is wet weight (g) and DW is dry weight (g).
Terrestrial laser scanning
In both 2018 and 2019, we used a RIEGL VZ-2000 TLS to collect point cloud data across burn units at PHP both before and after prescribed burning. We conducted TLS scans at several locations across each burn unit pre- and post-fire, placing scan locations in a systematic grid that ensured complete and consistent coverage of burn units. In 2018, we took 15 scans pre-fire and 14 scans post-fire across burn unit ‘PHP1’. In 2019, we took 29 scans pre-fire and 30 scans post-fire across burn units ‘PHP1’, ‘PHP2’, and ‘PHP3’. Pre- and post-fire scan locations were the same. We registered individual scans automatically in RiSCAN Pro 2.8, then filtered for noise. Points closer than 2 m or farther than 30 m from the scanner head were removed. We merged individual scans by burn unit, deleting duplicate points, defined as points from different scans that were within 6 mm of each other. We clipped the ensuing point clouds by hand in the CloudCompare software package to each burn unit extent plus a ~5 m buffer. This resulted in a total of two point clouds in 2018 (one pre-fire and one post-fire point cloud covering burn unit ‘PHP1’) and six point clouds in 2019 (pre-fire and post-fire point clouds for burn units ‘PHP1’, ‘PHP2’, and ‘PHP3’).
We classified point clouds as ground and non-ground using the ‘classify_ground’ and ‘csf’ (cloth simulation filtering) functions of the ‘lidR’ R package (Zhang et al. 2016; Roussel et al. 2020; R Core Team 2022; Roussel and Auty 2022). To optimize ground classification accuracy, we ran many iterations of the ‘classify_ground’ function, varying the class threshold, cloth resolution, rigidness parameters of the ‘csf’ function. We identified parameters that maximized agreement, as measured by Pearson’s correlation coefficient, between TLS point cloud density and 3D biomass observations. We found that a class threshold of 0.01 m, a cloth resolution of 0.1 m, and a rigidness value of one maximized agreement, and therefore used these cloth simulation filtering parameters for ground classification. We then normalized point cloud heights to heights above ground using the ‘normalize_height’ function of the ‘lidR’ R package; we used the ‘tin’ algorithm and ground-classified points to create the underlying ground surface with which point heights were height normalized. We located tree boles and manually digitized bole extents via 5 cm digital surface models created from points with aboveground heights between 0 and 2 m. We then clipped tree bole points within this stratum from point clouds using the ‘clip_roi’ function of the ‘lidR’ R package to exclude these points from analysis and mapping.
Because of GNSS error, 3D biomass plot locations measured via GNSS in the field differed from 3D biomass plot locations as recorded in TLS point clouds by 0–1 m. However, GNSS-measurements were useful in locating 3D biomass plot conduits in TLS point clouds. After adjusting the GNSS plot locations accordingly following Hudak et al. (2020), we used these ‘corrected’ locations of biomass plot conduits in TLS point clouds clip out points coincident with each of the 40 3D biomass plots (14 2018 plots and 26 2019 plots).
We created three TLS point cloud voxel metrics from point clouds clipped to the 40 3D biomass plot extents, to be used for modeling (Table 1), using the ‘voxelized_points’, ‘cloud_metrics’ and ‘pixel_metrics’ functions of the ‘lidR’ R packages (Roussel et al. 2020; Roussel and Auty 2022). Occupied Voxel Density is a measure of occupied space (Hudak et al. 2020), whereas porosity is a measure of unoccupied space (Rowell et al. 2020). We created TLS height metrics at a resolution identical to the 0.025 m3 (0.5 m × 0.5 m × 0.1 m) observed biomass sampling resolution. We also created Voxel metric grids across TLS point cloud extents, at a resolution of 0.025 m3 (0.5 m × 0.5 m × 0.1 m) for 10-cm height increments between 0.1 and 2 m aboveground, to be used for biomass mapping.
| Metric name | Metric description | |
|---|---|---|
| Occupied voxel density | Density of 0.001 m3 (0.1 m × 0.1 m × 0.1 m) occupied voxels (Hudak et al. 2020) | |
| Porosity | (1 − (sum of 1 cm3 (1 cm × 1 cm × 1 cm) occupied voxels/25,000 cm3)) × 1000 (Rowell et al. 2020) | |
| Height | Voxel height above ground (cm) |
We considered voxel metrics, created at a resolution of 0.025 m3 (0.5 m × 0.5 m × 0.1 m), as predictors of field-observed biomass.
At Fort Jackson, Hudak et al. (2020) used an LMS 511 (SICK Inc.) TLS to collect pre- and post-fire point cloud data across the four 2018 burn units. See Hudak et al. (2020) for details of the Fort Jackson TLS data processing. Briefly here, they took TLS scans at the corners and midpoints of each of the four burn units pre- and post-fire. To merge scans, they positioned four to eight reflective targets around the periphery of the scan locations, to be used as tie points. One notable difference between Hudak et al. (2020) and this study was that occupied voxel density was the only predictor metric created by Hudak et al. (2020) for predicting field-observed biomass, while this study also considered porosity and height (Table 1).
Long-wave infrared imagery
We acquired terrestrial LWIR imagery during PHP prescribed burning at four locations in 2018 and six locations in 2019 (Fig. 2). At each of the 10 locations, we mounted a LWIR camera with a 480 × 640 pixel array on a jibboom pointed downward. In 2018, we mounted cameras at each location 5.2 m aboveground to image areas of approximately 17.8 m2 (3.65 m × 4.88 m, pixel resolution of 0.76 cm) from nadir. In 2019, we mounted cameras at each location 8.2 m aboveground to image areas of approximately 44.4 m2 (5.77 m × 7.69 m, pixel resolution of 1.20 cm) from nadir. We took LWIR images within each extent at 1 Hz intervals as the burn progressed. Burning durations within the LWIR extents varied from 3 to 31 min, with visually estimated flame lengths that ranged from 0.3 to 2 m and visually estimated rates of spread of 0.01–0.02 m s−1.
We calibrated LWIR imagery from digital numbers to watts, then integrated images in units of watts per pixel to create fire radiative energy density (FRED) rasters in units of megajoules (MJ) m−2. We collected GNSS locations of LWIR extents so that FRED imagery could be related to TLS data products. At Fort Jackson, we gathered LWIR imagery at four locations using the same process as described above, except the same LWIR cameras were mounted on shorter poles, such that smaller areas of approximately 7.1 m2 (2.3 m × 3.1 m, pixel resolution of 0.48 cm) were imaged for creation of FRED rasters. We accounted for differing LWIR imagery extents and resolutions caused by different LWIR camera heights by normalizing with differing areas when calculating FRED.
We averaged FRED rasters by LWIR extent and converted average FRED to consumption estimates using the equation of Hudak et al. (2016a):
where FC is fuel consumption in g m−2, FRED is fire radiative energy density in MJ m−2, rf is a fire radiative fraction constant of 0.18, and hc is a heat of combustion constant of 0.017552 MJ g−1. We initially attempted to use the equation of Smith et al. (2013) for this conversion, as it accounts for the effect of fuel moisture when estimating fuel consumption from fire radiative energy, and we observed much greater fuel moisture in the understory fuels (mean FWC of 52 that ranged from 31 to 73%) compared to the surface fuels (mean FWC of 12 that ranged from 4 to 33%). However, the high understory fuel FWCs we observed for these growing season burns resulted in spurious consumption estimates when using the equation of Smith et al. (2013), which they developed using dead pine needles with FWCs ranging from 0 to 14% and hence is only valid for FWCs <57%. We therefore ignored the effect of fuel moisture on observed fire radiative energy. We also estimated consumption from FRED with the equations of Wooster et al. (2005) and Freeborn et al. (2008). Because the equations of Wooster et al. (2005), Freeborn et al. (2008) and Hudak et al. (2016a) effectively multiply FRED by a scalar to calculate consumption, they all gave consumption estimates that were identically strongly correlated with laser-estimated consumption. We ultimately chose to use the equation of Hudak et al. (2016a) because we were working in the same ecosystem as Hudak et al. (2016a) and it resulted in the smallest root mean squared error (RMSE) between laser- and LWIR-estimated consumption.
Training terrestrial laser scanning predictions with observed understory biomass
We created models for PHP predicting field-observed biomass from 3D TLS point cloud metrics, in which each 0.025 m3 volume was a modeling sample. We trained predictive models with field-observed biomass and corresponding 3D TLS metrics in only the 0.1–1 m height strata, because (1) we could not find a strong relationship between field-observed biomass and TLS metrics in the surface (0–0.1 m aboveground) stratum and (2) field-observed biomass was not resolved into 10 cm height strata above 1 m. Therefore, the total number of 0.025 m3 biomass/TLS metric pairs available for model creation was 359 (40 plots × 9 height strata – 1 missing field observation). Of these, 242 were pre-fire pairs and 117 were post-fire pairs. We used R (R Core Team 2022) to create the models. We explored creating a parametric linear model versus a nonparametric random forest (RF) model (Breiman 2001; Liaw and Wiener 2002). We assessed model performance with the coefficient of determination (R2) and RMSE between observed versus predicted biomass. We assessed the performance of models in predicting new observations with 10-fold cross validation implemented in the ‘caret’ R package (Kuhn 2022).
We applied final biomass models to TLS metric grids of the 0.1–2 m height strata to map biomass at these heights across TLS extents. We summed pre- and post-fire biomass predictions for each 0.1 m height stratum for each 0.5 m × 0.5 m grid cell, to create two-dimensional maps of biomass density in units of g m−3. By differencing pre- and post-fire biomass maps, we also mapped predicted biomass consumption in units of g m−3. R, along with the ‘terra’ R package, was used for map creation (R Core Team 2022; Hijmans 2022).
At Fort Jackson, Hudak et al. (2020) related field-observed biomass to occupied voxel density via a least-squares fit in which biomass was natural log transformed (fig. 8 of Hudak et al. 2020). They applied this model (R2 = 0.32) to pre- and post-fire TLS extents to map pre- and post-fire biomass, which they then differenced to map biomass consumption. Because no clear relationship existed between observed surface biomass (0–0.1 m) and occupied voxel density, they did not include surface biomass in their models. Mapped estimates therefore represented understory biomass consumption 0.1–2 m aboveground.
Surface fuel biomass estimated from airborne laser scanning
As described above, we were unable to predict biomass from TLS data in the near-ground 0–0.1 m height strata, where a large portion of field-observed biomass resided (averaging 72% and ranging from 29 to 100% across our 40 3D biomass plots at PHP). Rather than ignore this important fuel stratum at ground level, we used mapped leaf litter estimates of Sánchez-López et al. (2023), which were developed and available for both PHP and Fort Jackson. In this approach, ALS data are segmented into tree objects, for which crown foliage biomass and annual leaf litterfall is estimated and mapped at 5 m spatial resolution. Leaf litter accumulation is then estimated through a spatially explicit implementation of the accumulation model of Olson (1963), which accounts for years since last fire and decomposition (Gholz et al. 2000; Senay and Kagone 2019) as additional model parameters.
The litter maps of Sánchez-López et al. (2023) represent tree leaf litter, which is only one surface fuel component. The total surface fuels could include fine dead materials from shrubs and herbs, bark tissue, reproductive buds, etc. and fine downed woody material (<2.6 cm diameter). To more realistically represent total surface fuel and consumption, we applied multipliers to the litter maps of Sánchez-López et al. (2023). Field observations showed that the proportion of tree leaf litter to total surface fuel consistently averaged 0.5 1–2 years post-fire for several study areas within pine woodlands of the southeastern United States (Strategic Environmental Research and Development Program (SERDP) Project RC19-1064). Furthermore, field data showed a positive linear relationship between leaf litter and other fine surface fuel components suggesting that tree canopy inputs drive total surface fuel loads in these ecosystems; we therefore multiplied the litter maps of Sánchez-López et al. (2023) at Fort Jackson by 2 (1/0.5) to account for all surface fuel components, as we did not have data on litter type proportion specific to Fort Jackson. At PHP, we had access to 179 0.25 m2 (0.5 × 0.5 m) litter plots that were measured within or in the vicinity of PHP burn units ‘PHP1’, ‘PHP2’, and ‘PHP3’ 1–2 years post-fire between 2006 and 2019. We were therefore able to calculate a PHP-specific proportion of tree leaf litter to total surface fuels; that proportion averaged 0.20. We therefore multiplied the tree leaf litter maps of Sánchez-López et al. (2023) at PHP by 5 (1/0.2) to account for all surface fuel components. Although varying this multiplier affected the magnitude of laser-estimated surface fuels and consumption, it did not have a significant effect on the positive relationship between laser- and LWIR-estimated consumption; thus we feel our methodology is robust to a specific multiplier, which might vary by study area and time since fire.
Rather than use a post-fire surface fuel value of 40 g m−2 assumed by the modeling approach of Sánchez-López et al. (2023), we calculated average consumption of biomass in the 0–0.1 m height stratum for our 40 3D biomass plots at PHP, which was 66%, and multiplied the pre-fire surface fuel maps by the inverse of this proportion (0.34) to generate post-fire surface fuel maps. At Fort Jackson, average observed consumption of surface fuels was 78%, so we multiplied pre-fire surface fuel maps by 0.22 to generate post-fire surface fuel maps. Pre- and post-fire surface fuel maps were differenced to map surface fuel consumption, resampled to a spatial resolution of 0.5 m, and added to TLS-derived maps of biomass consumption in the 0.1–2 m height strata to estimate total consumption 0–2 m aboveground. The same approach was used to generate post-fire surface fuel and consumption maps at Fort Jackson.
Relationship between LWIR- and laser-estimated biomass consumption
We mapped estimates of biomass consumption for the 10 LWIR extents at PHP where we had estimated FRED, and we compared laser-estimated consumption and average LWIR-estimated consumption via scatterplot. Because of this small number of sample points (n = 10), we also included the four additional LWIR images from Fort Jackson for corroboration (Hudak et al. 2020). We compared LWIR-estimated consumption to both (1) understory fuel consumption (0.1–2 m aboveground, estimated from TLS) and (2) the summation of understory fuel consumption (0.1–2 m aboveground) and surface fuel consumption (0–0.1 m aboveground, estimated with the methodology of Sánchez-López et al. (2023)).
Results
Field observations of biomass
At PHP, field observed pre-fire biomass density (0.1–1 m aboveground) across the 27 pre-fire plots averaged 316 g m−3 for the 0.025 m3 cells and ranged from 0 to 2166 g m−3. Field observed post-fire biomass density (0.1–1 m aboveground) across the 13 post-fire plots was lower, averaging 149 g m−3 and ranging from 0 to 1057 g m−3. We therefore estimated average observed consumption between 0.1 and 1 m aboveground to be 167 g m−3 (53%) at PHP. At Fort Jackson, field observed pre-fire biomass density (0.1–2 m aboveground) averaged 556 g m−3 and ranged from 8 to 3166 g m−3, while field observed post-fire biomass density averaged 379 g m−3 and ranged from 14 to 1614 g m−3. We therefore estimated average understory fuel consumption to be 177 g m−3 (32%) at Fort Jackson (Hudak et al. 2020).
As expected, observed biomass density was greatest near the ground and decreased with increasing height. Surface (0–0.1 m aboveground) pre-fire biomass density at PHP averaged 713 g m−3 and ranged from 284 to 1500 g m−3. Surface (0–0.1 m aboveground) post-fire biomass density averaged 243 g m−3 and ranged from 25 to 909 g m−3. We therefore estimated average surface (0–0.1 m aboveground) observed biomass consumption at PHP to be 469 g m−3 (66%). At Fort Jackson, surface fuel density averaged 1012 and 220 g m−2 pre- and post-fire, respectively. We therefore estimated average surface fuel consumption to be 792 g m−2 (78%) at Fort Jackson (Hudak et al. 2020). Observed FWC of the understory live shrub and herbaceous fuel averaged 52% and ranged from 31 to 73% (Table 2). Observed FWC of surface fuels was less, averaging 12% and ranging from 4 to 33%. FWC of both the understory and surface fuels was greater at Fort Jackson.
| Site | Year | Surface fuel | Understory fuel | |||||
|---|---|---|---|---|---|---|---|---|
Mean (s.d.) biomass consumption (g m−2) | Relative biomass consumption (%) A | Mean (s.d.) fuel water content (%)A a | Mean (s.d.) biomass consumption (g m−3) | Relative biomass consumption (%) | Mean (s.d.) fuel water content (%)A | |||
| Fort Jackson | 2018 | 611 (281) | 78 | 15 (10) | 212 (183) | 50 | 62 (11) | |
| Pebble Hill | 2018 | 385 (132) | 66 | 11 (4) | 31 (45) | 32 | 48 (13) | |
| Pebble Hill | 2019 | 473 (199) | 66 | 12 (4) | 19 (37) | 29 | 53 (7) | |
Predicted consumption map statistics and observed fuel water content summarized by site and year. Surface indicates near-ground fuel 0–0.1 m aboveground (units of g m−2), as predicted using the approach of Sánchez-López et al. (2023). Understory indicates fuel 0.1–2 m aboveground (units of g m−3), as predicted from terrestrial laser scanning (TLS) data and field observations. Fuel water content was measured from field collections. We excluded ‘no data’ cells when calculating means and standard deviations (s.d.).
Training terrestrial laser scanning predictions with observed understory biomass
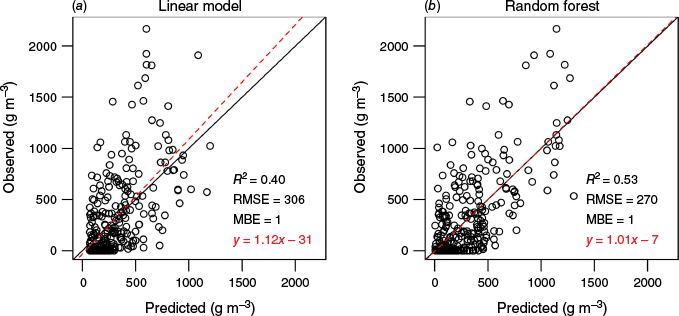
All three predictor variables (occupied voxel density, porosity and height) were significant and important in both parametric linear and nonparametric RF models trained with PHP data. The RF model outperformed the linear model in terms of R2 and RMSE, with linear and RF models explaining 40 and 53% of the variation in observed biomass, respectively (Fig. 3). Moreover, the parametric linear model required that the response variable be square-root transformed to distribute model residuals more normally, which subsequently required back-transformation that added back-transformation bias when applying models; RF had the advantage of not requiring transformation. We therefore chose to use RF for modeling and mapping. All three predictor variables (occupied voxel density, porosity, and height) were significant and important in both linear and RF models.
Predicted versus observed biomass density using parametric linear modeling (Panel a) and nonparametric random forest (RF) modeling (Panel b). Terrestrial laser scanning (TLS) predictions of biomass were compared to field-observed biomass. Coefficient of determination (R2), root mean square error (RMSE), and mean bias error (MBE) values were calculated with 10-fold cross validation. The least-square fit equations for observed versus predicted models are given in red and shown with a red dashed line.
Predicted biomass and consumption maps
Predicted pre- and post-fire biomass 0–2 m aboveground averaged 793 and 296 g m−2, respectively, when mapped across the three PHP burn units (Table 3, Fig. 4). Mapped biomass consumption averaged 497 g m−2 (63%). At Fort Jackson, pre- and post-fire biomass averaged 1270 and 581 g m−2, respectively, and biomass consumption averaged 689 g m−2 (67%). We were unable to compute complete biomass and biomass consumption map totals because 3% of the cells in pre-fire TLS-derived biomass maps contained ‘no data’ values (Fig. 4). These ‘no data’ cells in pre-fire biomass maps were likely where biomass was present but not measured by TLS because of occlusion by other vegetation. However, ‘no data’ cells in post-fire biomass maps where TLS sensed pre-fire biomass were assumed to be true zeros where biomass consumption was complete. Understory fuel consumption maps contained some impossible negative values, where mapped post-fire fuels were greater than mapped pre-fire fuels, likely caused by TLS occlusion in pre-fire point clouds where pre-fire fuels were measured incompletely. Most impossible negative understory consumption values were near zero, with 95% of negative understory consumption estimates being <67 g m−2, and adding negative understory consumption estimates to surface consumption estimates resulted in no impossible negative consumption values 0–2 m aboveground. Thus, we concluded that TLS occlusion had an insignificant impact on overall (0–2 m aboveground) consumption estimates.
| Burn unit | Year | Mean (s.d.) pre-fire biomass (g m−2) | Mean (s.d.) post-fire biomass (g m−2) | Mean (s.d.) biomass consumption (g m−2) | Mean biomass consumption (%) | |
|---|---|---|---|---|---|---|
| PHP1 | 2018 | 669 (213) | 256 (86) | 414 (143) | 62 | |
| PHP1 | 2019 | 651 (195) | 243 (74) | 408 (136) | 63 | |
| PHP2 | 2019 | 947 (344) | 348 (122) | 598 (228) | 63 | |
| PHP3 | 2019 | 903 (303) | 337 (106) | 566 (208) | 63 | |
| 16D1 | 2018 | 1260 (383) | 564 (296) | 814 (259) | 65 | |
| 16D5 | 2018 | 1160 (345) | 525 (313) | 753 (263) | 65 | |
| 24A7 | 2018 | 1826 (417) | 929 (208) | 1131 (361) | 62 | |
| 24B8 | 2018 | 833 (480) | 306 (265) | 691 (313) | 83 |
Predicted biomass and consumption (0–2 m aboveground) map statistics for each burn unit in Pebble Hill Plantation (PHP1, PHP2, PHP3) and Fort Jackson (16D1, 16D5, 24A7, 24B8). We created maps by summing mapped surface (0–0.1 m aboveground) and understory (0.1–2 m aboveground) fuel estimates. We excluded ‘no data’ cells when calculating means and standard deviations (s.d.).
Mapped estimates of pre-fire biomass (Panel a), post-fire biomass (Panel b) and biomass consumption (Panel c) for PHP burn units ‘PHP1’, ‘PHP2’, and ‘PHP3’ in 2019. Pre-fire and post-fire maps of 0.1–2 m aboveground biomass were created by applying random forest (RF) models to terrestrial laser scanning (TLS) metric grids. These maps were added to surface biomass maps indirectly derived from airborne laser scanning (ALS) (Sánchez-López et al. 2023) to map total biomass 0–2 m aboveground. Consumption maps (summarized in Table 3) were created by differencing pre- and post-fire biomass maps.
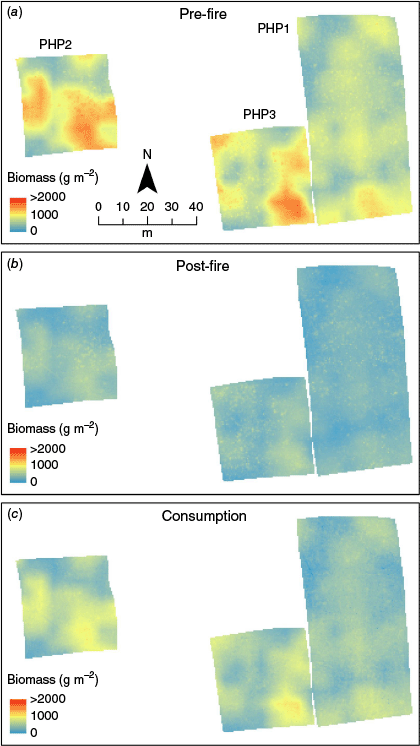
Like field observations, mapped surface (0–0.1 m aboveground) fuel density predictions were much higher than mapped understorey (0.1–2 m aboveground) fuel density predictions (Table 2); relative surface fuel consumption was also greater than relative understory fuel consumption. Higher fuel densities were predicted at Fort Jackson compared to Pebble Hill (Table 2).
Relationship between LWIR- and laser-estimated biomass consumption
We examined the relationship between LWIR-estimated biomass consumption and both (1) estimated understory (0.1–2 m aboveground) fuel consumption (Fig. 5a) and (2) total fuel consumption from summing understory and surface (0–2 m aboveground) consumption estimates (Fig. 5b). LWIR-estimated biomass consumption averaged 324 and 1014 g m−2 at PHP and Fort Jackson, respectively.
Laser- versus long-wave infrared (LWIR)-derived estimates of biomass consumption at 14 locations within burn units where fire radiative energy density (FRED) was measured via LWIR imagery. Laser-estimated consumption was significantly and positively related to LWIR-estimated consumption. When only TLS-based understory fuel consumption (0.1–2 m aboveground, Panel a) was considered, laser-based estimates greatly underestimated consumption. The inclusion of ALS-based consumption of surface biomass (0–0.1 m aboveground) strengthened the relationship between laser-estimated consumption and LWIR-estimated consumption. The black line represents the 1:1 relationship, and the dashed black line represents the linear regression between laser-estimated consumption and LWIR-estimated consumption.
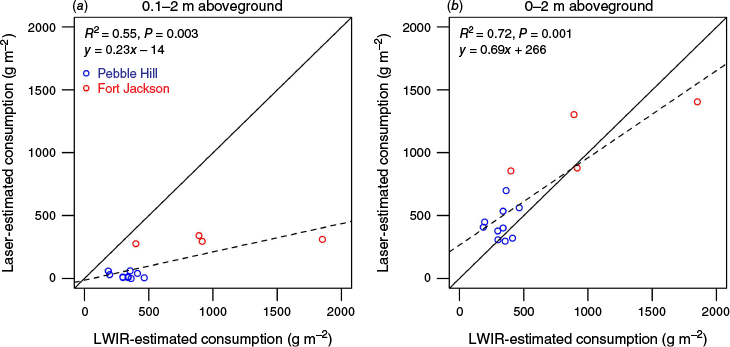
Understory fuel (0.1–2 m aboveground) consumption, derived from TLS point cloud data, was significantly correlated with LWIR-estimated consumption (R2 = 0.55, P = 0.003). However, LWIR imagery estimated much more consumption than TLS-based estimates when only understory fuel consumption was considered (Fig. 5a). This underestimation was expected, as field-observed biomass density was greatest near the surface (0–0.1 m aboveground), and surface biomass produced the greatest fire radiative energy (Fig. 6).
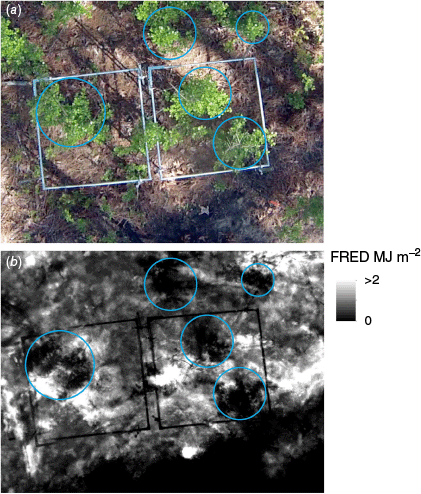
A pre-fire true-color image (a) and a fire radiative energy density (FRED) image (b) of the same extent of a long-wave infrared plot at Fort Jackson. Blue circles highlight where shrubs coincided with areas of relatively lower FRED. More fire radiative energy was observed coming from surface fuels between shrubs.
When ALS-derived consumption estimates were combined with TLS-based estimates to estimate total consumption 0–2 m aboveground, the significant relationship between mapped consumption and LWIR-estimated consumption increased (R2 = 0.72, P = 0.0001). Moreover, the relationship became less biased (Fig. 5b) such that the best-fit regression line between LWIR- and laser-estimated consumption more closely matched the 1:1 line; the RMSE decreased from 540 to 250 g m−2 and the absolute value of the mean bias error decreased from 418 to 107 g m−2. This improvement in the fit supported our hypothesis. The best-fit regression between laser- and LWIR-estimated consumption had a positive intercept of 266 g m−2 and a slope of 0.69, i.e. lasers tended to estimate greater consumption at lower values, whereas LWIR tended to estimate greater consumption at higher values (Fig. 5b).
Discussion
We compared two methodologies for estimating surface fuel consumption for a prescribed-burned longleaf pine woodland in Georgia, USA. Our lidar-based estimates of understory and surface fuel consumption were comparable to consumption estimated from LWIR imagery. This result indicates that point cloud-based methods can provide reasonable estimates of fuel consumption if calibrated using field measurements from that community type. These separate methods can complement and serve to validate one another where both point cloud data and LWIR imagery are available.
We improved upon the methodology of Hudak et al. (2020) by (1) including the additional predictor variables of unoccupied volume (Rowell et al. 2020) and height above ground, which improved model performance and, more importantly, (2) estimating surface fuel consumption using the methodology of Sánchez-López et al. (2023). We relied upon the methodology of Sánchez-López et al. (2023) because, like Hudak et al. (2020) and Cova et al. (2023), we were unable to find meaningful relationships between point cloud metrics and measured fuel loads 0–0.1 m aboveground, and therefore did not attempt to predict and map fuel and fuel consumption in this near-ground height stratum using TLS. The approach of Sánchez-López et al. (2023), which was developed to map the spatial variability of leaf litter in fire-maintained southern pine woodlands, indirectly estimates litter fuels from tree crown foliar biomass characterized with ALS, tree litter deposition and decomposition rates, and time since last fire. Indirect approaches such as these account for the surface fuel originating from overstory tree canopies (Chen et al. 2017; Blaydes et al. 2023; McDanold et al. 2023).
One advantage of our indirect methodology, which makes use of remotely sensed data, over traditional methodologies that rely solely upon field observations, is that fuel can be mapped across remotely sensed data extents. Traditional methodologies for estimating consumption via field sampling alone are also challenged by the fact that destructive pre- and post-fire plots cannot be collocated; this is particularly problematic when fuel beds are highly variable in space, which can result in impossible negative consumption estimates (Hudak et al. 2020). It should be noted, however, that field observations were a vital part of our methodology that were necessary for creating a statistical model predicting field-observed fuel from TLS point cloud data. Through differencing mapped pre- and post-fire fuel maps, we were able to estimate fuel consumption across management units. However, mapped consumption estimates are only as reliable and consistent as the point cloud data that is used to predict them. Our mapped understory fuel consumption was likely less than field-observed understory fuel consumption because of occlusion in pre-fire TLS point clouds, so that pre-fire biomass was measured incompletely via TLS across the burn units. Although this underestimation was likely insignificant when considered with surface fuel estimates, occlusion in TLS point clouds will continue to challenge understory biomass mapping efforts. One possible solution is the use of mobile scanning lidar systems, where the scanner moves around, as opposed to being stationary on tripods. Another possible solution is spatial interpolating between adjacent observations to fill in the point cloud data voids, although this unnaturally smooths the fuel distribution. Close-range photogrammetry, in which point clouds are derived from images taken from various vantages, has also shown promise for accurately representing understory vegetation (Cova et al. 2023). Although occlusion can still occur with this approach, using images taken from multiple view angles to construct point clouds might minimize occlusion.
Another possible advantage of the point cloud approach, by virtue of the vertical measurement capability of lidar, is the ability to differentiate surface consumption and understory fuel consumption, so that the relative contribution of each fuel component could be measured. We found that the summation of surface (0–0.1 m aboveground) and understory (0.1–2 m aboveground) fuel consumption most significantly and positively correlated with LWIR-estimated consumption, which strongly supports our hypothesis. The greatest biomass, and therefore biomass consumption, was observed and predicted in the surface stratum 0–0.1 m aboveground, confirming the importance of this near ground fuel strata to fire behavior and effects in this ecosystem. O’Brien et al. (2016) likewise found that canopy-derived fuels in the surface fuel bed, especially pinecones, contributed more to fire radiative energy compared to non-canopy-derived fuels, (e.g. grass, forb and shrub fuels), which is largely what our maps of the 0.1–2 m height strata represented. This relative high importance of the near ground fuel stratum is likely also true for other forest ecosystems characterized by frequent low-severity fires; more studies are needed to see how this importance might vary for different ecosystems and fire regimes. Our findings suggest that future fuel consumption estimation methods should account for consumption in the near-ground stratum, and methods that can better measure consumption within this near-ground stratum would be useful contributions. We acknowledge that the coarser horizontal spatial resolution of the near-ground stratum derived from ALS would degrade the spatial precision of the understory fuel stratum derived from TLS, upon merging of the two strata into a combined consumption map.
Vertical separation of consumption by fuel component by the direct, LWIR method is less clear. FRED estimates provide no vertical resolution (Fig. 6), but temporally parsing the LWIR observations from which FRED is temporally integrated could allow for some differentiation, for instance when the surface fuel bed combusts moments before the understory shrub layer above it. We could not temporally differentiate surface vs shrub consumption with these burns because they were observed to burn nearly simultaneously, but such an approach might be more feasible in crown fires, where more time can elapse between surface and canopy fuel ignition.
The close-range LWIR imagery that we used here was not subject to many of the limitations described in literature for airborne and spaceborne LWIR imagery, which include sensor view angle, atmospheric absorption and undersampling (Dickinson et al. 2015; Hudak et al. 2016a). Nevertheless, our close-range LWIR imagery technique was limited to small spatial extents and was likely affected by some degree of occlusion, like most forms of remote sensing. Techniques estimating consumption from LWIR imagery depend upon the strong relationship between fire radiative energy and fuel consumed. This relationship likely varies by fuel type and condition, as evidenced by the different equations of Wooster et al. (2005), Freeborn et al. (2008), Smith et al. (2013) and Hudak et al. (2016a). More studies conducted for a variety of fuel types and spatial scales would result in fire radiative energy to consumption equations specific to those situations.
It should be noted that the litter maps of Sánchez-López et al. (2023) were originally generated at a lower spatial resolution (5 m) compared to the LWIR and the TLS-derived grids (0.5 m) used in this study. As a result, some variability in the distribution of the surface fuel on the forest floor, which can vary at sub-meter spatial scales in these ecosystems (Hiers et al. 2009), might not have been captured. Better accounting for this likely spatial variability in surface fuel would possibly have resulted in even stronger agreement between laser- and LWIR-estimated consumption, but such accounting was limited in our study by the coarser horizontal resolution of the airborne laser data from which the surface fuel layer was derived. The methodology of Sánchez-López et al. (2023) could potentially be adjusted to map surface fuel inputs at higher spatial resolutions so that the spatial variability of surface fuel combustion is more precisely characterized. In other words, the surface fuel estimates derived from ALS by Sánchez-López et al. (2023) could in theory also be derived from TLS data collected across smaller spatial domains, such as the burn units considered in this study. However, the occlusion problem already described discouraged us from pursuing that approach in this study.
Fig. 6 suggests that canopy-derived surface fuels and associated fuel consumption is greater between shrubs than beneath them. In addition, or alternatively, percentage consumption of surface fuels was likely greater in the gaps between shrubs than beneath the shrubs themselves, which serve to break the continuity of the surface fuel bed (by locally outcompeting grass), and consequently the fire spread. This begs the question of how shrub density is related to tree canopy cover. Other studies at Ft. Jackson (Herzog et al. 2022) and a longleaf pine-wiregrass community near PHP (Mugnani et al. 2019) found no relationship between shrub density or biomass and tree canopy cover, likely because of a general lack of shade in longleaf pine communities and low variance in light levels in response to canopy cover (Brockway and Outcalt 1998). Nevertheless, variation in canopy cover and shade might still be important in determining overall productivity of sites (McGuire et al. 2001).
Accounting for the energy required to vaporize water from fuel can result in less biased estimates of fuel consumption via LWIR imagery (Smith et al. 2013). Hence, we first attempted to account for fuel moisture in LWIR consumption estimates via the equation of Smith et al. (2013). However, we were unable to use this equation because it was not valid for the higher FWCs >14% that we observed. We therefore ignored the effect of fuel moisture when converting fire radiative energy to consumption via the equation of Hudak et al. (2016a). Factoring in high understory fuel FWC would have had the effect of increasing LWIR consumption estimates, thereby decreasing the bias we observed when comparing laser- and LWIR-estimated fuel consumption (Fig. 5b). The bias should be proportional to the FWC, but high FWC also prevents consumption, as evidenced by scorched but unconsumed live shrubs, especially following growing season burns (Fig. 6). Fig. 6 reinforces this by illustrating that surface fuel consumption exceeded understory shrub fuel consumption. There were growing season burns of live, green shrubs, which would absorb a lot of heat to vaporize the water content, thus reducing FRED relative to the much drier surface fuels. More work quantifying the effect of higher FWCs (>14%) on fire radiative energy release across a greater variety of live and dead fuels is needed.
The prescribed burn experimental designs at Pebble Hill and Ft. Jackson were very similar and thus highly compatible for this study. The burn units within each study area were by design replicate burns, so fuels variation between the two study areas exceeds the variation within each study area (Fig. 5). It would be advantageous for future research to compare indirect, lidar-based consumption estimates to direct, FRED-based consumption estimates across a greater range of fuel types than just the two considered in this study. In theory, consumption estimates by the two independent methods should align across all ecosystems, so where the alternative methods do not align can provide insights on potential shortcomings of either method, and stimulate ideas for methodological improvements.
Conclusions
This study builds on previous applications of TLS point cloud data for estimating understory fuels at fine scales. Because we were unable to directly estimate near-ground surface fuels from TLS reliably, we developed a methodology for combining TLS estimates of understory fuels with estimates of surface fuels indirectly predicted from ALS. We then examined the relationship fuel consumption estimated from point cloud data and that estimated using the more established LWIR method. Including indirect surface fuel estimates from ALS data substantially strengthened the relationship between independent LWIR consumption estimates, confirming the theory and strongly suggesting that the combined understory and surface fuel estimate was closer to the true total fuel load that combusted. Our analysis confirms that surface fuels largely derived from the overstory can be most important to fire behavior in the frequently burned pine woodlands of the southeastern United States and highlights the need for more work examining how LWIR imagery relates to consumed fuel in a variety of burning conditions.
Data availability
Field observations of biomass, TLS point cloud data, and derived fuel maps are available on the Wildfire Science Initiative (WFSI) Data Portal (https://wfsi-data.org/) in the data products of Weise et al. (2024) (Fort Jackson) and Bright et al. (2025) (Pebble Hill).
Conflicts of interest
Coauthors Andrew Hudak and Joseph O’Brien served as guest editors for this special issue but were not involved in the peer review or any decision-making process for this paper. The authors declare no other conflicts of interest.
Declaration of funding
This project was funded by the U. S. Department of Defense (DoD), Strategic Environmental Research and Development Program (SERDP) Projects RC20-1346 ‘Object-based aggregation of fuel structures, physics-based fire behavior and self-organizing smoke plumes for improved fuel, fire, and smoke management on military lands’ and RC19-1119 ‘Characterizing Multiscale Feedbacks between Forest Structure, Fire Behavior and Effects: Integrating Measurements and Mechanistic Modeling for Improved Understanding of Pattern and Process’.
Acknowledgements
We thank the field personnel who gathered field observations of biomass and the technicians who acquired and preprocessed TLS point cloud data, both at Fort Jackson and Pebble Hill Plantation. We also thank Fort Jackson for accommodating our research.
References
Blaydes SH, Cannon JB, Aubrey DP (2023) Modeling spatial patterns of longleaf pine needle dispersal using long‑term data. Fire Ecology 19, 56.
| Crossref | Google Scholar |
Boschetti L, Roy DP (2009) Strategies for the fusion of satellite fire radiative power with burned area data for fire radiative energy derivation. Journal of Geophysical Research: Atmospheres 114(D20), D20302.
| Crossref | Google Scholar |
Breiman L (2001) Random forests. Machine Learning 45, 5-32.
| Crossref | Google Scholar |
Bright BC, Hudak AT, McCarley TR, Spannuth A, Sánchez-López N, Ottmar RD, Soja AJ (2022) Multitemporal lidar captures heterogeneity in fuel loads and consumption on the Kaibab Plateau. Fire Ecology 18(1), 18.
| Crossref | Google Scholar | PubMed |
Bright B, Hudak A, Sánchez-López N, Hawley C, Loudermilk L, Rowell E, O’Brien J, Flanagan S, Robertson K (2025) Biomass field observations, terrestrial laser scanning point clouds, and fuel consumption maps for prescribed burns in Pebble Hill Plantation, Georgia, in 2018 and 2019. [Dataset] WFSI Data Portal. 10.60594/W4H01S
Brockway DG, Outcalt KW (1998) Gap-phase regeneration in longleaf pine wiregrass ecosystems. Forest Ecology and Management 106, 125-139.
| Crossref | Google Scholar |
Carr SC, Robertson KM, Peet RK (2010) A vegetation classification of fire-dependent pinelands of Florida. Castanea 75(2), 153-189.
| Crossref | Google Scholar |
Chen Y, Zhu X, Yebra M, Harris S, Tapper N (2017) Development of a predictive model for estimating forest surface fuel load in Australian eucalypt forests with LiDAR data. Environmental Modelling & Software 97, 61-71.
| Crossref | Google Scholar |
Cova GR, Prichard SJ, Rowell E, Drye B, Eagle P, Kennedy MC, Nemens DG (2023) Evaluating close-range photogrammetry for 3D understory fuel characterization and biomass prediction in pine forests. Remote Sensing 15(19), 4837.
| Crossref | Google Scholar |
Dickinson MB, Hudak AT, Zajkowski T, Loudermilk EL, Schroeder W, Ellison L, Kremens RL, Holley W, Martinez O, Paxton A, Bright BC (2015) Measuring radiant emissions from entire prescribed fires with ground, airborne and satellite sensors – RxCADRE 2012. International Journal of Wildland Fire 25(1), 48-61.
| Crossref | Google Scholar |
Freeborn PH, Wooster MJ, Hao WM, Ryan CA, Nordgren BL, Baker SP, Ichoku C (2008) Relationships between energy release, fuel mass loss, and trace gas and aerosol emissions during laboratory biomass fires. Journal of Geophysical Research: Atmospheres 113(D1), D01301.
| Crossref | Google Scholar |
Gholz HL, Wedin DA, Smitherman SM, Harmon ME, Parton WJ (2000) Long‐term dynamics of pine and hardwood litter in contrasting environments: toward a global model of decomposition. Global Change Biology 6(7), 751-765.
| Crossref | Google Scholar |
Hawley CM, Loudermilk EL, Rowell EM, Pokswinski S (2018) A novel approach to fuel biomass sampling for 3D fuel characterization. MethodsX 5, 1597-1604.
| Crossref | Google Scholar | PubMed |
Herzog M, Hudak AT, Weise DR, Bradley AM, Tonkyn RG, Banach CA, Myers TL, Bright BC, Batchelor J, Kato A, Johnson TJ (2022) Point cloud based mapping of understory shrub fuel distribution, estimation of fuel consumption and relationship to pyrolysis gas emissions on experimental prescribed burns. Remote Sensing 5, 118.
| Crossref | Google Scholar |
Heward H, Smith AM, Roy DP, Tinkham WT, Hoffman CM, Morgan P, Lannom KO (2013) Is burn severity related to fire intensity? Observations from landscape scale remote sensing. International Journal of Wildland Fire 22(7), 910-918.
| Crossref | Google Scholar |
Hiers JK, O’Brien JJ, Mitchell RJ, Grego JM, Loudermilk EL (2009) The wildland fuel cell concept: an approach to characterize fine-scale variation in fuels and fire in frequently burned longleaf pine forests. International Journal of Wildland Fire 18(3), 315-325.
| Crossref | Google Scholar |
Hijmans R (2022) _terra: Spatial Data Analysis_. R package version 1.6-7. Available at https://CRAN.R-project.org/package=terra
Hoffman CM, Ziegler JP, Tinkham WT, Hiers JK, Hudak AT (2023) A comparison of four spatial interpolation methods for modeling fine-scale surface fuel load in a mixed conifer forest with complex terrain. Fire 6(6), 216.
| Crossref | Google Scholar |
Hudak AT, Dickinson MB, Bright BC, Kremens RL, Loudermilk EL, O’Brien JJ, Hornsby BS, Ottmar RD (2016a) Measurements relating fire radiative energy density and surface fuel consumption–RxCADRE 2011 and 2012. International Journal of Wildland Fire 25(1), 25-37.
| Crossref | Google Scholar |
Hudak AT, Bright BC, Pokswinski SM, Loudermilk EL, O’Brien JJ, Hornsby BS, Klauberg C, Silva CA (2016b) Mapping forest structure and composition from low-density LiDAR for informed forest, fuel, and fire management at Eglin Air Force Base, Florida, USA. Canadian Journal of Remote Sensing 42(5), 411-427.
| Crossref | Google Scholar |
Hudak AT, Kato A, Bright BC, Loudermilk EL, Hawley C, Restaino JC, Ottmar RD, Prata GA, Cabo C, Prichard SJ, Rowell EM (2020) Towards spatially explicit quantification of pre-and postfire fuels and fuel consumption from traditional and point cloud measurements. Forest Science 66(4), 428-442.
| Crossref | Google Scholar |
Klauberg C, Hudak AT, Bright BC, Boschetti L, Dickinson MB, Kremens RL, Silva CA (2018) Use of ordinary kriging and Gaussian conditional simulation to interpolate airborne fire radiative energy density estimates. International Journal of Wildland Fire 27(4), 228-240.
| Crossref | Google Scholar |
Kremens RL, Dickinson MB, Bova AS (2012) Radiant flux density, energy density and fuel consumption in mixed-oak forest surface fires. International Journal of Wildland Fire 21(6), 722-730.
| Crossref | Google Scholar |
Kuhn M (2022) _caret: Classification and Regression Training_. R package version 6.0-93. Available at https://CRAN.R-project.org/package=caret
Liaw A, Wiener M (2002) Classification and regression by randomForest. R News 2, 18-22.
| Google Scholar |
Loudermilk EL, Hiers JK, O’Brien JJ, Mitchell RJ, Singhania A, Fernandez JC, Cropper WP, Slatton KC (2009) Ground-based LIDAR: a novel approach to quantify fine-scale fuelbed characteristics. International Journal of Wildland Fire 18(6), 676-685.
| Crossref | Google Scholar |
Loudermilk EL, O’Brien JJ, Mitchell RJ, Cropper WP, Hiers JK, Grunwald S, Grego J, Fernandez-Diaz JC (2012) Linking complex forest fuel structure and fire behaviour at fine scales. International Journal of Wildland Fire 21(7), 882-893.
| Crossref | Google Scholar |
Loudermilk EL, Achtemeier GL, O’Brien JJ, Hiers JK, Hornsby BS (2014) High-resolution observations of combustion in heterogeneous surface fuels. International Journal of Wildland Fire 23(7), 1016-1026.
| Crossref | Google Scholar |
Loudermilk EL, Pokswinski S, Hawley CM, Maxwell A, Gallagher MR, Skowronski NS, Hudak AT, Hoffman C, Hiers JK (2023) Terrestrial laser scan metrics predict surface vegetation biomass and consumption in a frequently burned southeastern US ecosystem. Fire 6(4), 151.
| Crossref | Google Scholar |
Lydersen JM, Collins BM, Knapp EE, Roller GB, Stephens S (2015) Relating fuel loads to overstorey structure and composition in a fire-excluded Sierra Nevada mixed conifer forest. International Journal of Wildland Fire 24(4), 484-494.
| Crossref | Google Scholar |
Maxwell AE, Gallagher MR, Minicuci N, Bester MS, Loudermilk EL, Pokswinski SM, Skowronski NS (2023) Impact of reference data sampling density for estimating plot-level average shrub heights using terrestrial laser scanning data. Fire 6(3), 98.
| Crossref | Google Scholar |
McDanold JS, Linn RR, Jonko AK, Atchley AL, Goodrick SL, Hiers JK, Hoffman CM, Loudermilk EL, O’Brien JJ, Parsons RA, Sieg CH (2023) DUET-Distribution of Understory using Elliptical Transport: a mechanistic model of leaf litter and herbaceous spatial distribution based on tree canopy structure. Ecological Modelling 483, 110425.
| Crossref | Google Scholar |
McGuire JP, Mitchell RJ, Moser EB, Pecot SD, Gjerstad DH, Hedman CW (2001) Gaps in a gappy forest: plant resources, longleaf pine regeneration, and understory response to tree removal in longleaf pine savannas. Canadian Journal of Forest Research 31, 765-778.
| Crossref | Google Scholar |
Mugnani MP, Robertson KM, Miller DL, Platt WJ (2019) Longleaf pine patch dynamics influence ground-layer vegetation in old-growth pine savanna. Forests 10, 389.
| Crossref | Google Scholar |
O’Brien JJ, Loudermilk EL, Hornsby B, Hudak AT, Bright BC, Dickinson MB, Hiers JK, Teske C, Ottmar RD (2015) High-resolution infrared thermography for capturing wildland fire behaviour: RxCADRE 2012. International Journal of Wildland Fire 25(1), 62-75.
| Crossref | Google Scholar |
O’Brien JJ, Loudermilk EL, Hiers JK, Pokswinski SM, Hornsby B, Hudak AT, Strother D, Rowell E, Bright BC (2016) Canopy-derived fuels drive patterns of in-fire energy release and understory plant mortality in a longleaf pine (Pinus palustris) sandhill in northwest Florida, USA. Canadian Journal of Remote Sensing 42(5), 489-500.
| Crossref | Google Scholar |
Olson JS (1963) Energy storage and the balance of producers and decomposers in ecological systems. Ecology 44(2), 322-331.
| Crossref | Google Scholar |
Ostertag TE, Robertson KM (2007) A comparison of native versus old-field vegetation in upland pinelands managed with frequent fire, South Georgia, USA. Tall Timbers Fire Ecology Conference Proceedings 23, 109-120.
| Google Scholar |
Pokswinski S, Gallagher MR, Skowronski NS, Loudermilk EL, Hawley C, Wallace D, Everland A, Wallace J, Hiers JK (2021) A simplified and affordable approach to forest monitoring using single terrestrial laser scans and transect sampling. MethodsX 8, 101484.
| Crossref | Google Scholar | PubMed |
R Core Team (2022) ‘R: A language and environment for statistical computing.’ (R Foundation for Statistical Computing: Vienna, Austria) Available at https://www.R-project.org/
Ritter SM, Hoffman CM, Battaglia MA, Stevens‐Rumann CS, Mell WE (2020) Fine‐scale fire patterns mediate forest structure in frequent‐fire ecosystems. Ecosphere 11(7), e03177.
| Crossref | Google Scholar |
Roussel JR, Auty D (2022) Airborne LiDAR Data Manipulation and Visualization for Forestry Applications. R package version 4.0.1. Available at https://cran.r-project.org/package=lidR
Roussel JR, Auty D, Coops NC, Tompalski P, Goodbody TRH, Sánchez Meador A, Bourdon JF, De Boissieu F, Achim A (2020) lidR: An R package for analysis of Airborne Laser Scanning (ALS) data. Remote Sensing of Environment 251, 112061.
| Crossref | Google Scholar |
Rowell E, Loudermilk EL, Hawley C, Pokswinski S, Seielstad C, Queen L, O’Brien JJ, Hudak AT, Goodrick S, Hiers JK (2020) Coupling terrestrial laser scanning with 3D fuel biomass sampling for advancing wildland fuels characterization. Forest Ecology and Management 462, 117945.
| Crossref | Google Scholar |
Sánchez-López N, Hudak AT, Boschetti L, Silva CA, Robertson K, Loudermilk EL, Bright BC, Callaham Jr MA, Taylor MK (2023) A spatially explicit model of tree leaf litter accumulation in fire maintained longleaf pine forests of the southeastern US. Ecological Modelling 481, 110369.
| Crossref | Google Scholar |
Senay G, Kagone S (2019) Daily SSEBop Evapotranspiration Data from 2000 to 2018. 10.5066/P9L2YMV
Smith AM, Tinkham WT, Roy DP, Boschetti L, Kremens RL, Kumar SS, Sparks AM, Falkowski MJ (2013) Quantification of fuel moisture effects on biomass consumed derived from fire radiative energy retrievals. Geophysical Research Letters 40(23), 6298-6302.
| Crossref | Google Scholar |
Swezey CS, Fitzwater BA, Whittecar GR, Mahan SA, Garrity CP, González WBA, Dobbs KM (2016) The Carolina Sandhills: Quaternary eolian sand sheets and dunes along the updip margin of the Atlantic Coastal Plain province, southeastern United States. Quaternary Research 86(3), 271-286.
| Crossref | Google Scholar |
Wallace L, Hillman S, Reinke K, Hally B (2017) Non‐destructive estimation of above‐ground surface and near‐surface biomass using 3D terrestrial remote sensing techniques. Methods in Ecology and Evolution 8(11), 1607-1616.
| Crossref | Google Scholar |
Weise DR, Hao WM, Baker S, Lincoln E, Hudak AT, Bright BC, Princevac M, Aminfar AH, Ottmar RD, O’Brien JJ, Kato A, Batchelor JL, Herzog MM, Chong J, Corcoran BM, Burke GM (2024) Pyrolysis Gases Measured by Gas Chromatography and Mass Spectrometry from Fires in a Wind Tunnel and at Ft. Jackson, SC. [Dataset] WFSI Data Portal. 10.60594/W48G6B
Wooster MJ, Roberts G, Perry GLW, Kaufman YJ (2005) Retrieval of biomass combustion rates and totals from fire radiative power observations: FRP derivation and calibration relationships between biomass consumption and fire radiative energy release. Journal of Geophysical Research: Atmospheres 110(D24), D24311.
| Crossref | Google Scholar |
Zhang W, Qi J, Wan P, Wang H, Xie D, Wang X, Yan G (2016) An easy-to-use airborne LiDAR data filtering method based on cloth simulation. Remote Sensing 8(6), 501.
| Crossref | Google Scholar |