
Hospital admissions to a major wildlife hospital in south-east Queensland, Australia, over a 10-year period, 2012–2022
Kate J. Dutton-Regester A *
A *
A
Abstract
Wildlife hospitals play a critical role in the rehabilitation of injured wildlife; the data they collect offer valuable insights into the major threats affecting local species. This study analysed 10 years of admissions data from the RSPCA Wildlife Hospital in Wacol, Brisbane, Australia, to identify trends in causes of admission and temporal changes. The primary causes of admission were orphaning, vehicle collisions (MVAs), disease, and dog attacks, with orphaning being the leading cause, particularly among avian species. MVAs were the most significant cause of admission for mammals, including the endangered koala; disease and dog attacks also emerged as key contributors across various species. Over the study period, total wildlife admissions increased 2.5-fold, with a 12-fold rise in koala admissions, likely reflecting both heightened public awareness and escalating threats. The analysis also highlighted important gaps in data collection, including lack of context regarding orphaned animals and specific disease diagnoses. These findings underscore the need for targeted conservation strategies, including measures to mitigate MVAs, reduce dog attacks, and improve public education on wildlife care and reporting. Enhanced data collection and focused conservation efforts are essential to address the growing threats to wildlife in urban environments and to improve long-term conservation outcomes.
Keywords: Australian wildlife, causes, conservation, endangered species, hospital admissions, mortality, threats, wildlife.
Introduction
Currently we are witnessing an unprecedented decline in wildlife populations, with countless species either extinct or currently threatened with extinction, resulting in significant biodiversity loss (Ceballos and Ehrlich 2002; Ceballos et al. 2010). Preserving wildlife stands as a paramount concern, given the intricate connections among humans, the environment, and animals that are fundamental to human health and longevity (Gross 2023). Wildlife diversity serves a crucial role in upholding ecosystem equilibrium, managing pest populations, and facilitating plant pollination (Katumo et al. 2022). The decline of wildlife jeopardises ecosystem function, setting off a chain reaction that can detrimentally affect human well-being. However, wildlife decline is largely attributed to human activities, including habitat destruction, urbanisation, climate change, pollution, and illegal wildlife trade (Wolfe et al. 2005, 2007; Mozer and Prost 2023).
Wildlife hospitals and veterinary clinics that treat wildlife provide valuable insights into some of the key threats faced by wildlife populations, particularly those resulting in injury or illness. As injured and sick animals are admitted and treated, these facilities offer a unique window into the broader environmental pressures and emerging challenges affecting wildlife. By documenting injuries, diseases and treatment outcomes observed in admitted wildlife, these facilities can aid in identifying emerging threats and environmental stressors in a specific locality. Studies are already demonstrating that anthropogenic factors (e.g. car strikes, dog attacks, entanglements) are significant threats to native fauna in Australia (Griffith et al. 2013; Taylor-Brown et al. 2019; Schlagloth et al. 2022; Dutton-Regester 2024a, 2024b); and elsewhere (Wendell et al. 2002; Rodríguez et al. 2010; Schenk and Souza 2014).
Situated in south-east Queensland, Australia, Brisbane had the most substantial positive population shift among all Australian states and territories for the financial year 2021–2022, increasing by 2.3% (Australian Bureau of Statistics 2023). This trend of substantial growth persists, with the population anticipated to increase by 20% by the year 2036 (Deptartment of the Premier and Cabinet 2024). The Royal Society for the Prevention of Cruelty to Animals (RSPCA) Queensland, located in Wacol, Brisbane, houses the major wildlife hospital in the Southeast Queensland region, standing as a vital hub for studying the health status and survival challenges of diverse species residing in the area. Considering Brisbane’s significant and projected population growth, a thorough analysis of wildlife hospital admissions data is vital. This analysis will provide valuable insights into these admissions, empowering the formulation of well-informed strategies and interventions designed to address these risks and minimise their impact on the distinctive biodiversity of the region.
Here I present the results of a 10-year analysis of admissions data collected from the RSPCA Wildlife Hospital, Brisbane. The objectives of this study were to examine trends in species admissions, causes, outcomes, and temporal patterns in order to better understand the types of threats leading to wildlife presentation at a major hospital in south-east Queensland.
Methods
Study site and data collection
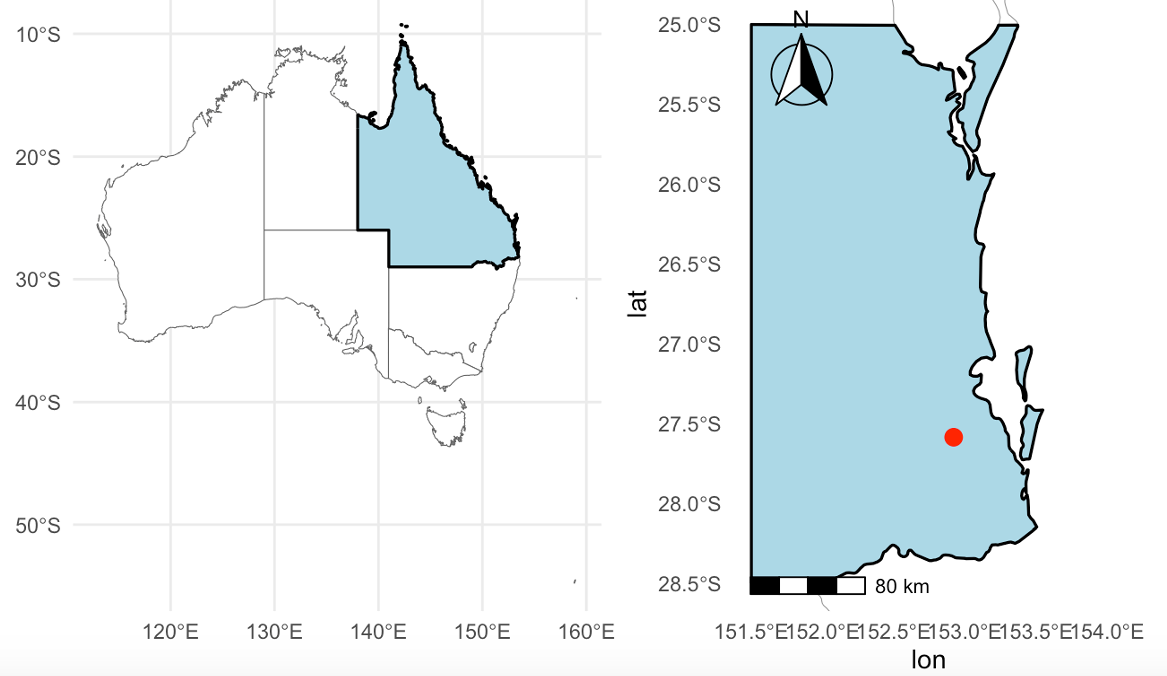
The data for this study were obtained from the RSPCA Wildlife Hospital, located in Wacol, Brisbane, Australia (−27.586132°, 152.922067°). Brisbane, covering an approximate area of 15,826 km2, has a recorded population of 1,242,825 as of the last census in 2021 (Australian Bureau of Statistics 2021a). The RSPCA Wildlife Hospital is currently the largest wildlife hospital in Queensland, providing veterinary care to over 20,000 animals in the south-east Queensland region, annually (Fig. 1). The majority of admissions originate from an area approximately 152 km to the north (e.g. Noosaville), 105 km to the west (e.g. Toowoomba), and 106 km to the south (e.g. Springbrook), extending into greater Brisbane regions (Moreton Bay, Ipswich, Logan, Redland City). However, there are also sporadic admissions from NSW, reaching as far as Quirindi, which is more than 600 km to the south. Further information about the hospital’s facilities, services, and public outreach is available at https://www.rspcaqld.org.au/locations/brisbane.
Map of Australian states and territories, with a zoomed-in image of south-east Queensland, showing the location of RSPCA Wacol Wildlife Hospital.
In addition to RSPCA Wacol, wildlife rescue and care in south-east Queensland are supported by a network of major wildlife hospitals, including Currumbin Wildlife Hospital, Australia Zoo Wildlife Hospital, and smaller facilities such as Moggill Koala Rehabilitation Centre and Eumundi Wildlife Rehabilitation Centre. Licensed wildlife carer groups and individuals also contribute to wildlife care under permits issued by the Department of Environment, Science and Innovation (DESI), in accordance with the Nature Conservation Act 1992. Annual reporting to DESI is a condition of these permits and contributes to broader state-level insights into wildlife admissions and outcomes. While RSPCA Wacol is the largest facility in the region, wildlife may also be admitted to other hospitals depending on factors such as location of rescue, facility capacity, and clinical needs. The RSPCA also collaborates with specialist carers, particularly for species requiring specialised care, such as flying-foxes.
Hospital admission records of 230,755 wildlife patients admitted to the RSPCA wildlife hospital between 1 January 2012 and 31 December 2022 were compiled in an electronic database (Microsoft Excel, ver. 16.73) for organisation and analysis. Information contained in the records included: patient identification number, admission date, species, cause of admission (COA), outcome, and incident suburb and post code; although age and sex were included in the hospital records, data were not recorded consistently and were therefore not included in the analysis. Prior to analysis, data were cleaned. This included identifying and removing any duplicate rows in the dataset, ensuring correct data types for each variable and simultaneously cleaning data text to address inconsistencies and errors, such as typos or variations in case. Of the 230,755 cases, 3155 were excluded either because the record was incomplete (missing information regarding species) or it was of a species for which there were fewer than 100 records, unless they could be suitably pooled with species of another taxonomic, ecological or behavioural group (see below).
Where data on a single species were insufficient (i.e. <100 admissions) for meaningful analysis following the exclusion criteria above, but the species was part of a larger taxonomic or ecological group of interest, these were pooled to create a ‘multi-species group’. For birds, where a species did not fit into a broader multi-species group (e.g. sea birds, waterbirds, bird of prey, night bird, flightless bird), species were grouped according to their Class (e.g. Passeriformes, Psittaciformes, Charadriiformes, Columbiformes, Coraciiforms or Cuculiformes). Other multi-species groups formed were ‘frogs’, ‘bats’, ‘gliders’, ‘kangaroos’, ‘possums’, ‘small macropods’, ‘lizards’, ‘snakes’, and ‘turtles’.
The resulting data (227,600 hospital admissions) were analysed for admission and outcome trends. Where trends were assessed per season, seasons were referred to as: summer (December, January, February), autumn (March, April, May), winter (June, July, August), spring (September, October, November). COA was used as a nominal outcome variable with 21 categories: ‘barbed wire’, ‘cat attack’, ‘disease’, ‘displaced’, ‘dog attack’, ‘entanglement’, ‘electrocution’, ‘entrapment’, ‘fall’, ‘gardening equipment’, ‘motor vehicle accident’ (MVA), ‘human interference’, ‘on road’, ‘orphaned’, ‘poisoned’, ‘pool incident’, ‘bird attack’, ‘tree felling’, ‘window collision’, ‘other’ (causes of admission with less than 100 entries) and ‘unknown’. Animal outcomes following admission were grouped into either ‘positive outcome’ (released into wild or into care) or ‘mortality’ (dead on arrival, natural death, or euthanasia on welfare grounds). Brisbane human population data were obtained from the Australian Bureau of Statistics (Australian Bureau of Statistics 2021a).
Statistical analysis
Statistical analysis was performed using ‘R’ ver. 2022.12.0 + 353 and Prism ver. 9.5.1. Descriptive statistics were used to determine the frequency of cases for each season, cause of admission, and outcome during the study period. Linear regression was used to explore temporal trends, including total number of admissions and causes of admission. One-way ANOVA was performed to compare the average number of cases by season, utilising Tukey’s post hoc analysis to explore pair-wise comparisons and investigate significant relationships. Logistic regression was used to produce odds and risk ratios with 95% confidence intervals. Finally, data were visualised using choropleth maps in Quantum Geographic Information System (QGIS), (https://qgis.org/). Each admission that included a post code or suburb name was included in the dataset. Coordinates (latitude and longitude in decimal degrees format) were obtained from Google Earth Pro (ver. 7.3.6.9345). In total, 195,913 (86%) of admissions were included in the mapping dataset.
Results
Animal admissions
A total of 510 species were included in this study. Under the Nature Conservation Act 2002, one species was listed as critically endangered (Sandpiper curlew, Calidris ferruginea), eight species were listed as endangered (Australasian bittern, Botaurus poiciloptilus; koala, Phascolarctos cinereus; ghost bat, Macroderma gigas; brushtailed bettong, Bettongia penicillata; bilby, Macrotis lagotis; eastern bristlebird, Dasyornis brachypterus; eastern curlew, Numenius madagascariensis; loggerhead turtle, Caretta caretta), and eight species were listed as vulnerable (death adder, Acanthophis antarcticus; yellow nosed albatross, Thalassarche chlororhynchos; greater long-eared bat, Nyctophilus timoriensis; black-breasted buttonquail, Turnix melanogaster; glossy black cockatoo, Calyptorhynchus lathami; beach stone curlew, Esacus magnirostris; flatback turtle, Natator depressus; green turtle, Chelonia mydas).
A summary of admissions (per species or multi-species group) over the study period is presented in Table 1 and Fig. 2. All admissions were from Queensland, except for 16 cases originating in New South Wales. These may reflect unique care arrangements, proximity to the RSPCA Wildlife Hospital, or specific treatment needs not available locally. Admissions were predominantly birds, which accounted for 62.2% (n = 141,600/227,600) of all admissions (Table 1). Among avians, Passeriformes comprised the largest multi-species group, with 22.9% (n = 52,200) of total admissions, followed by Psittaciformes at 16.6% (n = 37,880). The three most frequently admitted passeriform species were the Australian magpie (Gymnorhina tibicen), the noisy miner (Manorina melanocephala) and the Australasian figbird (Sphecotheres vieilloti) which together constituted 49.9% of passeriform admissions (n = 9878, 9851, 6330 respectively). The three most frequently admitted Psittaciformes were the rainbow lorikeet (Trichoglossus moluccanus), the scaly breasted lorikeet (Trichoglossus chlorolepidotus), and the sulfur crested cockatoo (Cacatua galerita), together accounting for 71.1% of Psittaciformes’ admissions (n = 21,588 3015 2345 respectively).
| Animal class | Animal group | Number of admissions | % of total admissions | % of animal taxa | % positive outcome | Mortality | Top 2 causes of admission | |
|---|---|---|---|---|---|---|---|---|
| Birds | Bird of prey | 941 | 0.4 | 0.7 | 45.7 | 54.3 | Hit by car, Orphaned | |
| Charadrriiformes | 2489 | 1.1 | 1.7 | 36.3 | 63.7 | Orphaned, Hit by car | ||
| Colmbiformes | 6110 | 2.7 | 4.3 | 32.6 | 67.4 | Orphaned, Cat attack | ||
| Caraciiformes | 10,039 | 4.4 | 7.1 | 41.1 | 58.9 | Hit by car, Orphaned | ||
| Cuculiformes | 2083 | 0.9 | 1.5 | 44.1 | 55.9 | Orphaned, Window collision | ||
| Flightless birds | 5888 | 2.6 | 4.2 | 22.9 | 77.1 | Hit by car, Cat attack | ||
| Nightbirds | 9287 | 4.1 | 6.5 | 35.3 | 64.7 | Hit by car, Orphaned | ||
| Passeriformes | 52,200 | 22.9 | 26.7 | 32.6 | 67.4 | Orphaned, HBC | ||
| Psittaciformes | 37,800 | 16.6 | 36.9 | 23.5 | 76.5 | Disease, Hit by car | ||
| Seabirds | 1336 | 0.6 | 0.9 | 44.6 | 55.4 | Entanglement, Disease | ||
| Waterbirds | 13,347 | 5.9 | 9.4 | 60.2 | 39.8 | Orphaned, Hit by car | ||
| Total | 141,600 | 62.2 | 38.1 | 61.9 | Orphaned, Hit by car | |||
| Amphibians | Frogs | 546 | 0.24 | 100 | 44.9 | 55.1 | Dog attack, Cat attack, | |
| Total | 546 | 0.24 | 44.9 | 55.1 | Dog attack, Cat attack, | |||
| Mammals | Antechinus | 154 | 0.1 | 0.2 | 73.4 | 26.6 | Orphaned, Cat attack | |
| Bandicoot | 636 | 0.3 | 0.9 | 45.9 | 54.1 | Hit by car, Orphaned | ||
| Bats | 4932 | 2.2 | 6.8 | 43.8 | 56.2 | Barbed wire, Orphaned | ||
| Echidna | 1125 | 0.5 | 1.5 | 60.4 | 39.6 | Hit by car, Dog attack | ||
| Gliders | 1770 | 0.8 | 2.4 | 52.5 | 47.5 | Orphaned, Cat attack | ||
| Kangaroos | 4431 | 1.9 | 6.1 | 16.9 | 83.1 | Hit by car, Orphaned | ||
| Koala | 4969 | 2.2 | 6.8 | 37.9 | 62.1 | Disease, Hit by car | ||
| Possums | 51,185 | 22.5 | 70 | 0.4 | 99.6 | Orphaned, Disease | ||
| Small macropods | 3520 | 1.5 | 4.8 | 27.6 | 72.4 | Hit by car, Orphaned | ||
| Total | 72,722 | 32 | 36 | 64.3 | Orphaned, Hit by car | |||
| Reptiles | Lizards | 7204 | 3.2 | 56.6 | 32.4 | 67.6 | Dog attack, Hit by car | |
| Snakes | 3278 | 1.4 | 25.7 | 37.6 | 62.4 | Hit by car, Cat attack | ||
| Turtles | 2250 | 0.1 | 17.7 | 60.5 | 39.5 | Hit by car, On road | ||
| Total | 12,732 | 4.7 | 43.5 | 56.5 | Hit by car, Dog attack | |||
| Total | 227,600 | 40.7 | 59.3 |
Bolded text indicates totals.
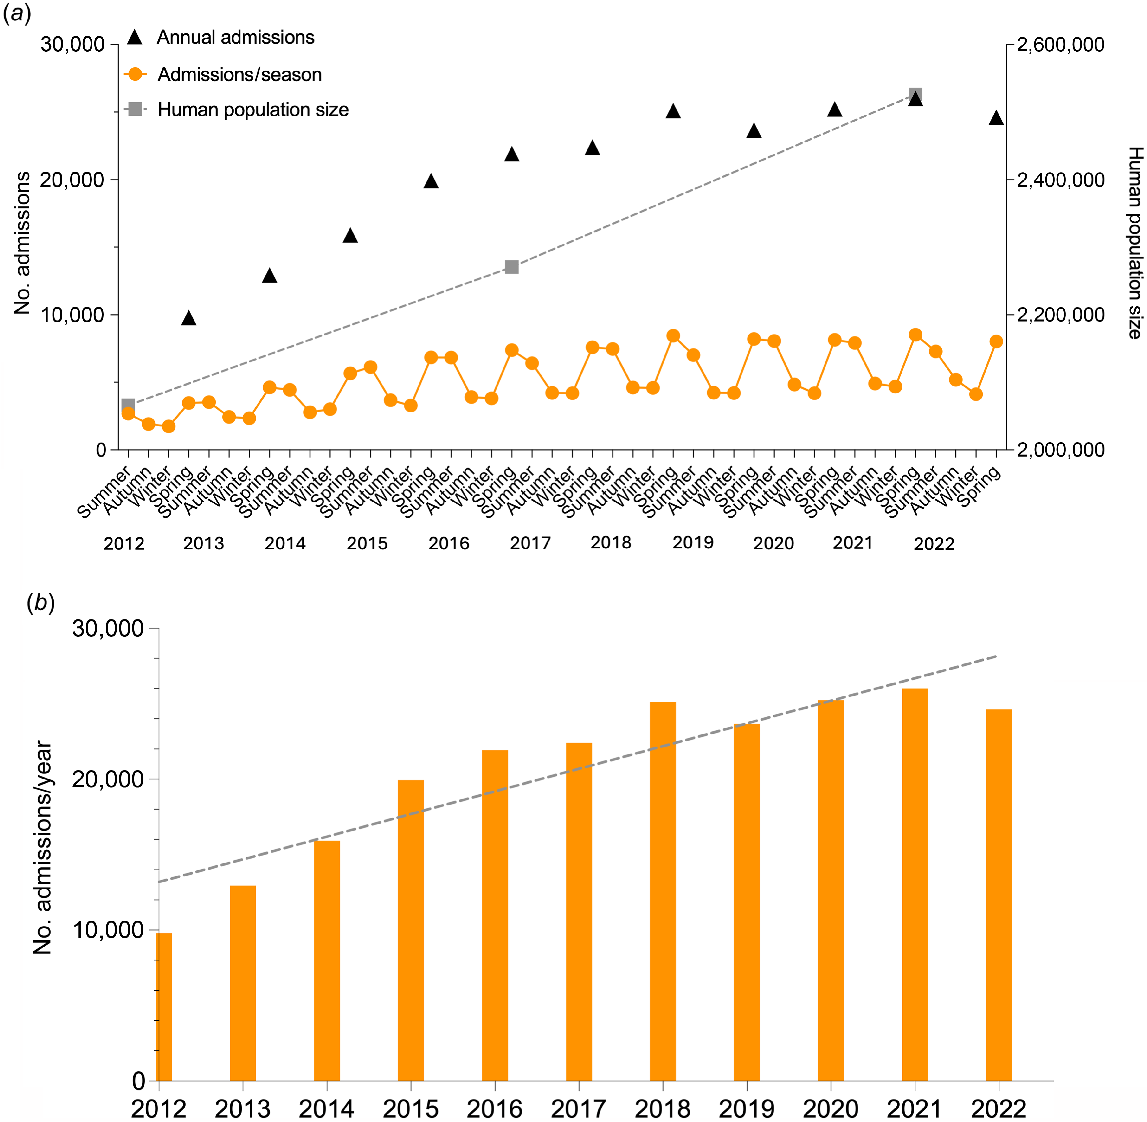
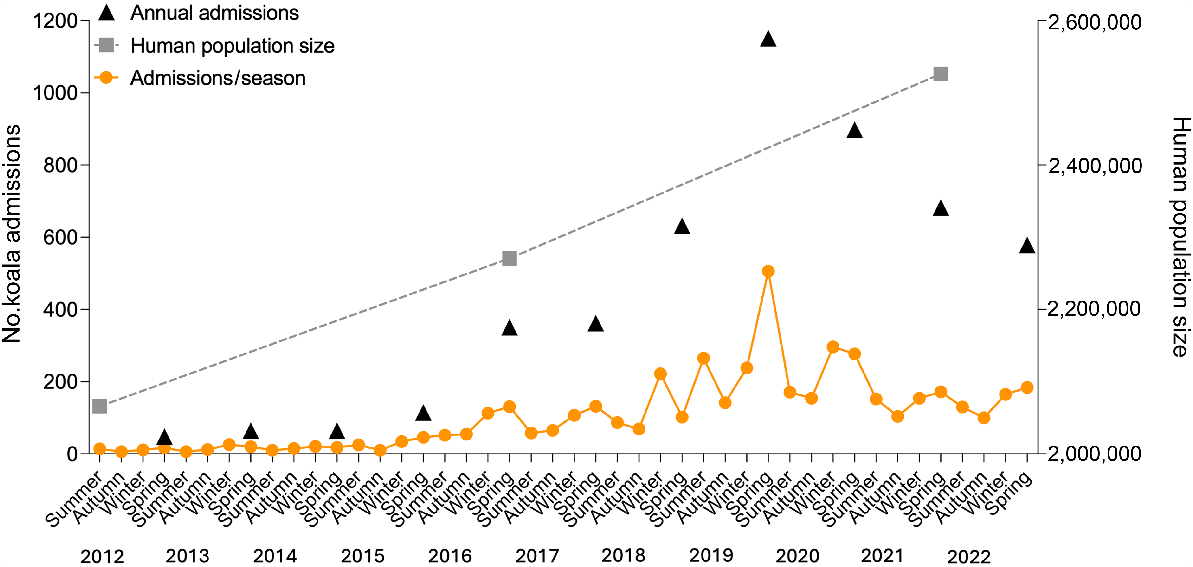
(a) Overall number of wildlife admissions to the RSPCA Wildlife Hospital, Wacol, per year and season, with human population in the region overlaid. (b) Number of wildlife admissions to the RSPCA Wildlife Hospital, Wacol, per species or multi-species group per year.
Mammals represented the second most admitted animal group, comprising 32% (n = 72,722/227,600) of all admissions (Table 1). The most frequently admitted mammalian multi-species group were possums, accounting for 22.5% (n = 51,185) of all admissions, followed by koalas (2.2%, n = 4969), bats (2.1%, n = 4932), and kangaroos (1.9%, n = 4431). Among possums, the common ringtail possum (Pseudocheirus peregrinus, n = 22,436, 43.8%) and the common brushtail possum (Trichosurus vulpecula, n = 22,226, 43.4%) constituted the majority of admissions. The most frequently admitted bat species were flying foxes (Pteropus alecto, P. poliocephalus, P. scapulatus, n = 3053), accounting for 63.2% of bat admissions and 2.2% of admissions overall. The most frequently admitted kangaroo species was the eastern grey kangaroo (Macropus giganteus, n = 3421), accounting for 77.2% of kangaroo admissions and 1.5% of admissions overall.
Reptiles contributed 5.6% of all admissions, represented by lizards (3.2%, n = 7204), snakes (1.4%, n = 3278) and turtles (1%, 2250). The lizards, snakes and turtle’s multi-species groups were dominated by blue-tongued skinks (Tiliqua scincoides, n = 2059/7204, 28.6%), carpet pythons (Morelia spilota, n = 1750/3278, 53.4%) and the Brisbane short-necked turtle (Emydura macquarii, n = 505/2250, 22.4%) respectively. The remaining 0.2% (n = 546) of admissions were attributed to amphibians, represented by 16 frog species, of which the green tree frog (Litoria caerula) was the most common species presenting at the hospital (n = 435, 79.7%).
Causes of admission (COA)
Interpretation of causes of admission must be approached with caution due to two major limitations in the dataset. First, a cause of admission was not recorded for 62% of all cases (n = 141,440 of 227,600 total admissions), meaning all cause-related analyses are based on the remaining 38% (n = 86,160) of admissions with a known cause. Second, causes are not mutually exclusive and may not capture the full context of each case. For instance, an animal recorded as a motor vehicle victim or dog attack case may have had underlying conditions (e.g. disease or poor body condition) that contributed to its vulnerability. As such, the reported causes should be interpreted as the apparent primary reason for admission rather than a complete medical history.
Causes of admission are summarised in Supplementary Table S1 and Fig. 3. Among the 86,160 cases with a recorded COA, the most common was ‘orphaned’ (26,887 admissions), representing 31% of known cases and 12% of total admissions. This was followed by ‘MVA’ with 15,437 admissions (18% of known; 7% of total), ‘disease’ with 7861 admissions (9% of known; 3% of total), ‘dog attack’ with 6570 (8% of known; 3% of total), ‘on road’ with 5046 (6% of known; 2% of total), and ‘cat attack’ with 4845 (6% of known; 2% of total). Together, these six causes accounted for 66,646 of the known admissions, equating to 77% of known cases and 29% of total admissions.

‘Orphaned’ was the leading COA for 8 of the 24 species or multi-species groups (Table 1). Birds were the most commonly admitted taxa under this category (n = 16,629; 19% of known), particularly Passeriformes (n = 8845) and waterbirds (n = 3703). Mammals were also heavily affected (n = 10,014; 12% of known), especially possums (n = 7842). ‘Orphaned’ was also the fifth most common COA for koalas (n = 209).
‘MVA’ was the second-most frequent cause and was the leading or second-ranked COA for 16 species or multi-species groups. Birds again comprised the largest group (n = 7597), including Psittaciformes (n = 2074) and Passeriformes (n = 1690). Mammals were also strongly represented (n = 6484), with the most common admissions involving possums (n = 2390), kangaroos (n = 1278), small macropods (n = 1053), and koalas (n = 1035).
‘Disease’ was most commonly recorded in possums (n = 2694), koalas (n = 1275), and Psittaciformes (n = 2981). ‘Dog attack’ admissions were concentrated among possums (n = 2049), lizards (n > 1000), and koalas (n = 390). ‘On road’ admissions mainly involved birds (n = 3568), particularly Psittaciformes and Passeriformes. ‘Cat attack’ admissions disproportionately affected possums (n = 1235) and Passeriformes (n = 1150).
Among less frequently admitted groups, bats were most often admitted due to barbed wire entanglements (n = 514) and other forms of entanglement (n = 335). Gliders were primarily admitted for orphaning (n = 222), barbed wire injuries (n = 106), and cat attacks (n = 199). Snake admissions were primarily due to MVAs (n = 402), cat attacks (n = 249), and dog attacks (n = 200). Turtles were often brought in due to MVAs (n = 487), and echidnas were frequently admitted following MVAs (n = 359) and dog attacks (n = 110). Amphibians were most frequently admitted for dog (n = 19) and cat (n = 16) attacks.
Injury types such as window collisions (n = 2306 of 2416) were predominantly associated with birds, especially Psittaciformes (n = 809) and Passeriformes (n = 581). Pool-related incidents most often involved Coraciiformes (n = 277) and waterbirds (n = 189), with smaller numbers of lizards (n = 72) and possums (n = 52). Gardening-related injuries were largely seen in lizards (n = 82), snakes (n = 54), and possums (n = 17).
Outcomes of admission
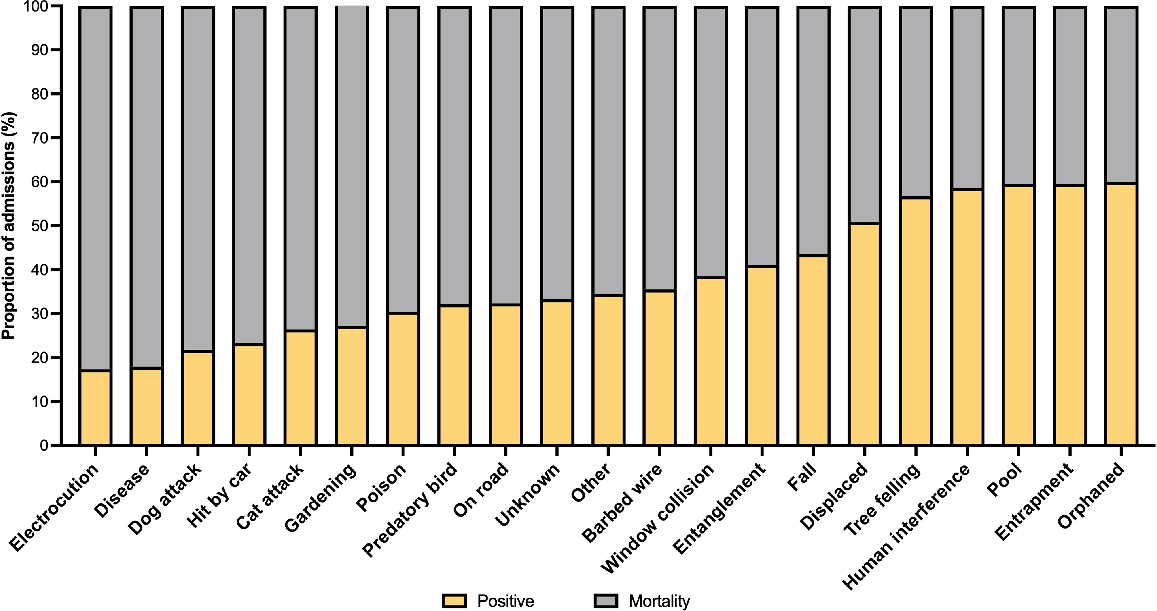
The majority of wildlife admissions resulted in mortality (61.4%), with the remaining 38.6% resulting in positive outcomes, such as successful release or placement in care (Table 1). Among causes of admission, ‘electrocution’ had the highest mean mortality rate (82.7%), followed by ‘disease’ (82.0%), ‘dog attack’ (78.3%), ‘MVA’ (76.7%), ‘cat attack’ (73.6%), and ‘poison’ (69.6%) (Fig. 4). ‘Electrocution’ also had the highest odds ratio (OR) for mortality at 2.64 (CI = 2.06–3.37), followed by ‘disease’ (OR = 2.52, CI = 2.37–3.67), ‘MVA’ (OR = 1.82, CI = 1.75–1.89), and ‘dog attack’ (OR = 1.54; CI = 1.44–1.64). In contrast, ‘orphaned’ animals had the highest rate of positive outcomes (60%), followed by ‘entrapment’ (59.5%) and ‘pool incident’ (59.5%). Other causes with >50% success included ‘human interference’, ‘tree felling’, and ‘displaced’.
Outcomes of admissions to the RSPCA Wildlife Hospital, Wacol, presented as a proportion of total admissions for each species or multi-species group.
At the species or species-group level, high mortality rates (>65%) were observed in Charadriiformes, Columbiformes, flightless birds, nightbirds, Psittaciformes, Passeriformes, kangaroos, lizards, and snakes for causes such as MVA, disease, dog attack, and ‘on road’ (Table 2). Koalas showed high mortality rates for ‘MVA’ (70%), ‘disease’ (79%), and ‘dog attack’ (62%). ‘Disease’ also resulted in high mortality rates in turtles (82%) and lizards (94%). Bats had particularly high mortality following ‘dog attack’ (83%), ‘MVA’ (75%), and ‘barbed wire’ entanglement (64%). Amphibians were highly susceptible to ‘on road’ (85%), ‘MVA’ (77%), and ‘dog attack’ (68%). Among all combinations, kangaroos affected by MVA had the highest odds of mortality (OR = 6.09, CI = 4.99–7.43), followed by Psittaciformes with disease (OR = 4.25, CI = 4.26–5.39) and possums with dog attack (OR = 3.72, CI = 2.81–4.92). Koalas had high odds of mortality for disease (OR = 2.09, CI = 1.82–2.39) and MVA (OR = 1.28, CI = 1.12–1.46). For lizards, MVA (OR = 2.78, CI = 2.17–3.56) and dog attack (OR = 2.14, CI = 1.82–2.39) also produced high mortality odds.
| Species | Orphaned | MVA | Disease | Dog attack | On road | Cat attack | |||||||
|---|---|---|---|---|---|---|---|---|---|---|---|---|---|
| % Positive (n) | % Mortality (n) | % Positive (n) | % Mortality (n) | % Positive (n) | % Mortality (n) | % Positive (n) | % Mortality (n) | % Positive (n) | % Mortality (n) | % Positive (n) | % Mortality (n) | ||
| Birds | |||||||||||||
| Bird of prey | 100 (1) | 0 (0) | 39 (45) | 61 (71) | 0 (0) | 100 (1) | 60 (3) | 40 (2) | 48 (16) | 52 (17) | 0 (0) | 100 (2) | |
| Charadriiformes | 54 (282) | 46 (241) | 14 (19) | 86 (118) | 0 (0) | 100 (2) | 33 (5) | 67 (10) | 28 (11) | 72 (28) | 30 (10) | 70 (23) | |
| Colmbiformes | 53 (278) | (245) | 21 (35) | 79 (134) | 13 (2) | 87 (14) | 22 (29) | 78 (102) | 27 (26) | 73 (72) | 16 (65) | 84 (349) | |
| Caraciiformes | 66 (3180) | (161) | 55 (837) | 45 (698) | 27 (4) | 73 (11) | 20 (22) | 80 (87) | 39 (151) | 61 (239) | 19 (27) | 81 (117) | |
| Cuculiformes | 70 (198) | (85) | 25 (32) | 75 (53) | 100 (1) | 0 (0) | 44 (8) | 56 (10) | 37 (15) | 63 (26) | 39 (12) | 61 (19) | |
| Flightless birds | 51 (89) | (85) | 13 (52) | 87 (350) | 15 (8) | 85 (47) | 19 (40) | 81 (167) | 19 (14) | 71 (58) | 28 (91) | 72 (229) | |
| Nightbirds | 76 (437) | (141) | 25 (284) | 75 (836) | 13 (2) | 87 (14) | 23 (12) | 77 (40) | 24 (111) | 76 (350) | 28 (17) | 72 (43) | |
| Passeriformes | 53 (4354) | 47 (3938) | 26 (450) | 74 (1295) | 15 (71) | 85 (422) | 22 (101) | 78 (353) | 34 (323) | 66 (626) | 19 (206) | 81 (862) | |
| Psittaciformes | 49 (434) | 51 (457) | 27 (440) | 73 (1213) | 14 (247) | 86 (1529) | 17 (98) | 83 (475) | 20 (172) | 80 (678) | 17 (36) | 83 (181) | |
| Seabirds | 67 (2) | 33 (1) | 4 (40) | 6 (60) | 55 (32) | 45 (26) | 43 (3) | 57 (4) | 15 (2) | 85 (11) | 0 (0) | 100 (1) | |
| Waterbirds | 82 (3032) | 18 (671) | 28 (198) | 72 (518) | 14 (6) | 76 (36) | 26 (24) | 74 (70) | 62 (135) | 38 (83) | 52 (51) | 48 (47) | |
| Amphibians | |||||||||||||
| Frogs | 100 (1) | 0 (0) | 23 (3) | 77 (10) | 40 (2) | 60 (3) | 32 (6) | 68 (13) | 15 (2) | 85 (11) | 38 (6) | 62 (10) | |
| Mammals | |||||||||||||
| Antechinus | 76 (71) | 24 (23) | 0 (0) | 0 (0) | 0 (0) | 0 (0) | 0 (0) | 100 (2) | 100 (1) | 0 (0) | 71 (5) | 29 (2) | |
| Bandicoot | 72 (56) | 28 (22) | 33 (28) | 67 (57) | 50 (1) | 50 (1) | 28 (9) | 72 (23) | 29 (4) | 71 (10) | 44 (27) | 56 (34) | |
| Bats | 75 (216) | 25 (72) | 25 (69) | 75 (209) | 38 (13) | 62 (21) | 17 (40) | 83 (200) | 49 (37) | 51 (38) | 38 (50) | 62 (81) | |
| Echidna | 64 (14) | 36 (8) | 45 (162) | 55 (196) | 0 (0) | 100 (5) | 83 (91) | 17 (19) | 62 (39) | 38 (24) | 0 (0) | 0 (0) | |
| Gliders | 78 (173) | 22 (49) | 67 (4) | 33 (2) | 40 (2) | 60 (3) | 23 (12) | 77 (40) | 57 (13) | 43 (10) | 39 (78) | 61 (121) | |
| Kangaroos | 46 (275) | 54 (319) | 8 (106) | 92 (1172) | 5 (4) | 95 (80) | 10 (4) | 90 (37) | 30 (18) | 70 (42) | 100 (1) | 0 (0) | |
| Koala | 67 (140) | 33 (69) | 30 (311) | 70 (724) | 21 (266) | 79 (1009) | 38 (148) | 62 (242) | 56 (47) | 44 (37) | 75 (3) | 25 (1) | |
| Possums | 60 (4669) | 40 (3173) | 15 (370) | 85 (2020) | 25 (672) | 75 (2022) | 17 (349) | 83 (1700) | 24 (188) | 76 (608) | 25 (308) | 75 (927) | |
| Small macropods | 54 (361) | 46 (304) | 16 (169) | 84 (884) | 8 (3) | 92 (37) | 19 (11) | 81 (47) | 44 (22) | 56 (28) | 63 (5) | 37 (3) | |
| Reptiles | |||||||||||||
| Lizards | 66 (118) | 34 (62) | 17 (75) | 83 (379) | 6 (1) | 94 (15) | 21 (319) | 79 (1237) | 14 (10) | 86 (61) | 39 (157) | 61 (249) | |
| Snakes | 1 (33) | 2 (67) | 21 (84) | 79 (318) | 33 (6) | 67 (12) | 25 (51) | 75 (149) | 29 (14) | 71 (35) | 38 (94) | 62 (155) | |
| Turtles | 52 (87) | 8 (13) | 37 (180) | 63 (307) | 18 (2) | 82 (9) | 36 (10) | 64 (18) | 78 (140) | 22 (39) | 100 (3) | 0 (0) | |
Spatial and temporal patterns
During the study period, 38 suburbs had more than 1000 hospital admissions (Fig. 5). Among these, the six suburbs with the highest admission rates were Wacol (n = 3010), Brisbane City (n = 2792), Forest Lake (n = 2732), Redbank (n = 2186), Noosaville (n = 2027), and Logan City (n = 1668). In Wacol, admissions were predominantly for mammals (n = 1726) and birds (n = 1123), with kangaroos being the dominant species (n = 1129), followed by species of the Passeriformes group (n = 386). In Brisbane City, birds were the most admitted group (n = 1827), followed by mammals (n = 833); overall, possums accounted for the highest number of admissions (n = 709). A similar pattern emerged in Forest Lake, Redbank, Noosaville, and Logan Village, with Psittaciformes being the most common avian group admitted in Redbank, Noosaville, and Logan Village. ‘MVA’ and ‘orphaned’ were consistently within the top three causes of admission across all suburbs. In Forest Lake, ‘dog attack’ ranked as the second most common cause of admission. Redbank reported ‘dog attack’ as the fourth most common cause of admission. In Logan Village and Noosaville, ‘disease’ commonly contributed to wildlife hospital admissions. ‘On road’ was common in Wacol, Brisbane City, and Redbank.
Choropleth map of wildlife hospital admissions to the RSPCA Wildlife Hospital, Wacol, between 2012 and 2022.
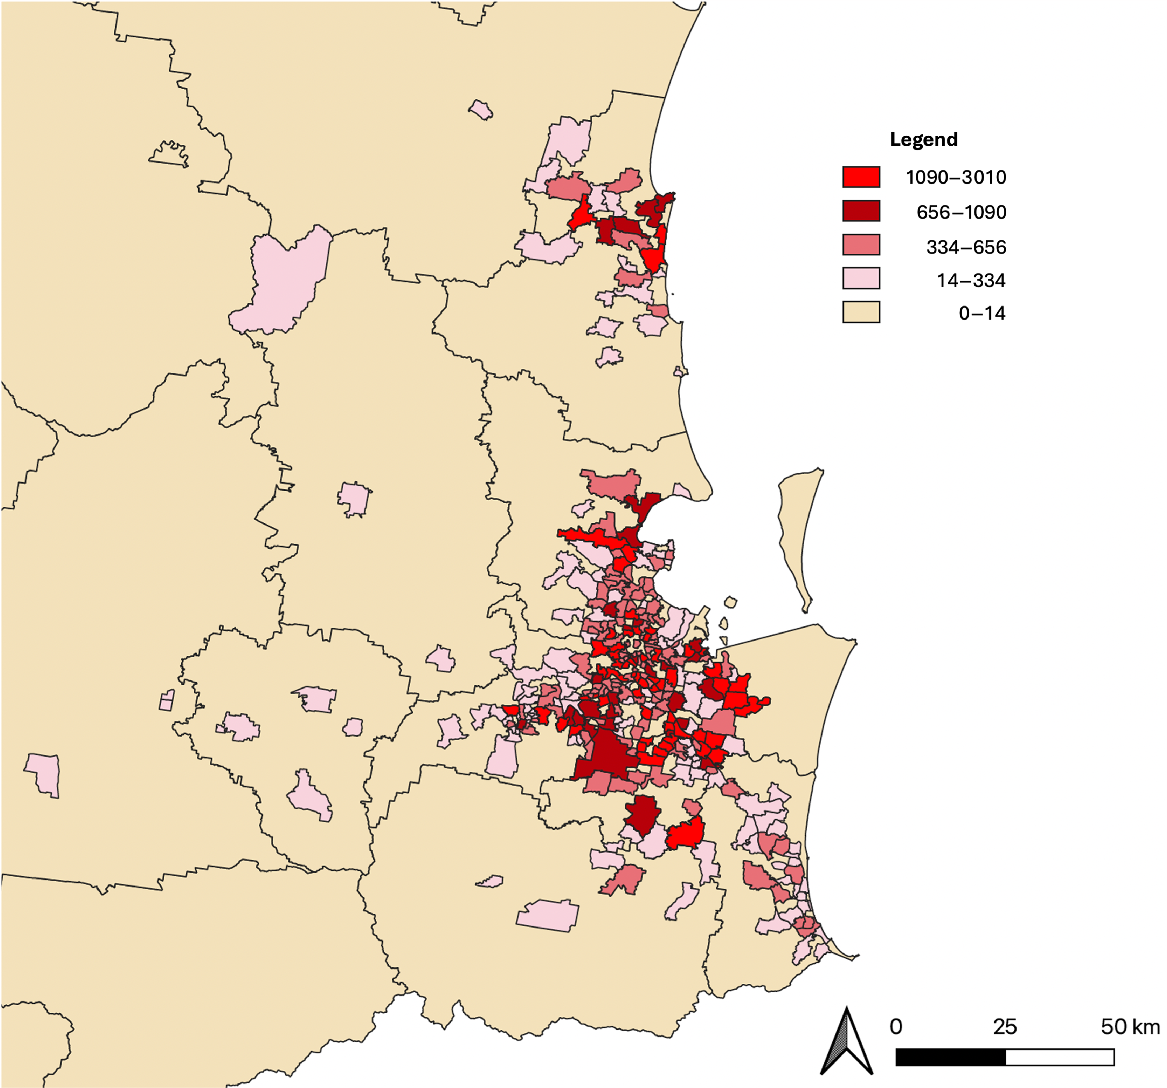
For koalas, the only endangered species with considerable admission numbers in the dataset (n = 4969), admissions were highest in Amity Point (n = 192), Lawnton (n = 112), and Kurwongbah (n = 93). When the cause was known, admissions were primarily attributed to MVA (n = 31.3%), disease (n = 24.4%) and ‘orphaned’ (n = 13.3%) in these locations.
Over the study period, the total number of animals admitted per year significantly increased (F1,9 = 42.89, P > 0.001) with almost a 2.5-fold increase in annual admissions from 2012 (n = 9803) to 2022 (n = 24,618). This was concomitant with an increase in human population size (Fig. 1a). There was a significant increase in koala admissions over the study period (F1,9 = 14.48, P > 0.001), with a 12-fold increase (Fig. 6). The average annual admission rate equated to 20,690.9 animals per year (±5216.9).
Overall number of koala admissions to the RSPCA Wildlife Hospital, Wacol, per year and season, with human population in the region overlaid.
Of the top six COA, admissions due to ‘disease’, ‘MVA’, ‘dog attack’ and ‘orphaned’ increased over the study period (disease, F1,9 = 20.03, P < 0.05; MVA, F1,9 = 20.34, P < 0.01; dog attack, F1,9 = 16.80, P < 0.05; orphaned, F1,9 = 28.15, P < 0.01). Admissions due to window collision (n = 2416), pool incident (n = 1180) and gardening equipment (n = 202) also increased over the study period (window collision, F1,9 = 46.78, P < 0.01; pool incident, F1,9 = 27.29, P < 0.01; gardening equipment, F1,9 = 23.27, P < 0.01). For koalas, the four of the five most common COA significantly increased over the study period (‘Disease’, ‘HBC’, ’Dog attack’, ‘Orphaned’). Koala admissions in which the cause was unknown (n = 1282) also significantly increased over the study period.
Overall, the highest number of hospital admissions occurred in spring (n = 76,904, 33.8%), followed by summer (n = 67,756, 29.8%), autumn (n = 42,746, 18.8%), and winter (n = 40,194, 17.7%) with the number of admissions in spring (P < 0.001), and summer (P < 0.001), statistically higher than in winter. ‘Orphaned’ was the leading cause of admission in spring (n = 10,954/76,904, 14.2%), summer (n = 7994/67,756, 11.8%), and winter (n = 4728/40,194, 11.8%). The leading cause of admission in autumn was ‘MVA’ (n = 3329/42,746, 7.8%). Incidences of ‘on road’ and ‘dog attack’ peaked in spring, whereas ‘disease’ and ‘cat attack’ peaked in summer. Cases of ‘barbed wire’ and ‘entanglement’ also peaked during the warmer months (spring and summer). Admissions for most species/multi-species groups peaked in spring and/or summer. Echidna, kangaroo and small macropod admissions peaked in winter whereas admissions for turtles peaked in autumn.
Discussion
This study presents a comprehensive analysis of 10 years of wildlife hospital admission data from the RSPCA Wildlife Hospital, Brisbane, Australia. Primary causes of admission were ‘orphaned’, ‘MVA’, ‘disease’, and ‘dog attack’. These causes exhibited increasing trends throughout the study period. However, the high proportion of admissions with unknown causes (62%) substantially limits the robustness of COA data, highlighting the need for improved data capture and standardisation in future hospital records. Overall, there was a 2.5-fold increase in admissions, with a notable 12-fold increase in admissions for the endangered koala. Geographically, the suburbs with the highest admission rates were Wacol, Brisbane City, and Forest Lake. These findings reflect threats identifiable through hospital admissions data, which capture specific types of injury, illness, and human–wildlife interaction, but do not represent the full spectrum of threats to wildlife populations. The implications of these findings are discussed below.
Orphaned animals frequently present to wildlife clinics (Tribe and Brown 2000; Taylor-Brown et al. 2019; Long et al. 2020; Hanson et al. 2021; Kwok et al. 2021; Dutton-Regester 2024a, 2024b; Mullineaux and Pawson 2024). In the present study, ‘Orphaned’ was identified as the leading cause of admission overall and for 8 of the 24 species or multi-species groups, with birds being the most commonly admitted taxon. However, information regarding the context in which each individual animal was brought into the hospital was not collected, making it challenging to determine the necessity of these admissions. Without such context, it is impossible to ascertain if these animals truly needed rescue. For instance, in New York State, approximately 1000 animals per year are unnecessarily presented to rehabilitators (Hanson et al. 2021), suggesting that unnecessary admissions likely occur in other regions as well.
With increasing urbanization and human population sizes, some wildlife species are increasingly challenged in finding suitable shelter, nesting sites, and food sources. This can lead to parent animals abandoning nests or young due to disruptions caused by construction, landscaping, or other human activities (Soulsbury and White 2015; Kwok et al. 2021; Molinari-Jobin et al. 2024). The increasing trend in the number of orphaned wildlife admissions observed in this study may be attributed to these and other habitat disruptions. However, measuring the extent of truly orphaned wildlife versus those temporarily misplaced requires the collection of contextual data. These data are essential to assess the impact of habitat disruptions and determine if there is a need for improved conservation messaging and public awareness regarding the appropriate actions to take when encountering young animals.
Vehicle collisions consistently emerge as a leading cause of wildlife admissions both in Australia (Tribe and Brown 2000; Taylor-Brown et al. 2019; Charalambous and Narayan 2020; Hanson et al. 2021; Kwok et al. 2021; Mo et al. 2021; Lunney et al. 2022a; Dutton-Regester 2024a, 2024b; Gårdebäck et al. 2024; Mullineaux and Pawson 2024) and overseas (Trombulak and Frissell 2000; Fahrig and Rytwinski 2009; Glista et al. 2009; Loss et al. 2014; van der Ree et al. 2015). Indeed, this study observed that ‘MVA’ was the first or second COA for 10 and 6 species or multi-species groups, respectively. As observed in other populations (Scheelings 2015; Taylor-Brown et al. 2019; Dutton-Regester 2024a, 2024b) MVA has a high mortality rate for a wide range of species and multi-species groups, including Charadriiformes, Columbiformes, flightless birds, nightbirds, Psittaciformes, Passeriformes, kangaroos, lizards, and the endangered koala.
Concomitant with an increasing human population size in Brisbane, there was an increasing trend in MVA during the study period. However, it is unclear whether this is a function of increasing human population and therefore an increase in vehicle presence, or increased awareness and reporting. Research suggests people are becoming increasingly concerned about wildlife and the biodiversity crisis (Bardales Salguero et al. 2024), which could account for a proportion of the rise in MVA admissions, particularly for the iconic koala, which has recently acquired endangered status in Queensland and other states (Department of Agriculture Water and the Environment 2022). Regardless, an estimated 10 million animals die each year in Australia due to MVAs (Ramp et al. 2005; Hobday and Minstrell 2008; Englefield et al. 2018), and 1 million per day in the USA (Derrick et al. 2021), demonstrating the significant impact of MVAs on wildlife. Studies in the USA and Europe show a 14–45% reduction in wildlife MVAs when traffic flow is reduced (Shilling et al. 2021; Bil et al. 2024). A study in Victoria, Australia (Visintin et al. 2017), found that traffic volumes and traffic speed were predictors of vehicle collision risk for six native mammal species, including the koala. Dissanayake et al. (2023) found that koala deaths due to vehicle collisions were positively associated with road density (road length per square kilometre) and Lunney et al. (2022b) identified that road type is important to consider for koala vehicle strikes, with primary roads having the highest likelihood of koala morbidity. Consequently, primary roads provide a good opportunity for mitigation strategies for this endangered species (Lunney et al. 2022b), in addition to identifying hotspots along these roads (Bil et al. 2024). Studies indicate that drivers can effectively reduce the likelihood of MVAs by reducing their driving speed and remaining alert while driving through areas where animals are more abundant (Laurance et al. 2014). Mitigating road-related wildlife impacts is an ongoing and multifaceted ecological challenge. Ongoing research is needed regarding vehicle strike deterrents, including the incorporation of mitigation techniques, such as wildlife crossing structures, into roadway construction planning (Dissanayake et al. 2023) and education to increase driver awareness across a range of species (Lunney et al. 2022b), with particular emphasis on those that are endangered.
Disease is a common cause of admission for various wildlife species (Taylor-Brown et al. 2019; Kwok et al. 2021; Schlagloth et al. 2022; Dutton-Regester 2024b). In the present study, the most common species presenting for disease were Psittaciformes, possums, and koalas. However, the dataset lacked a specific diagnosis for each admitted animal. Identifying the specific diseases diagnosed in each animal is crucial for several reasons: it allows for comparisons with other studies; it enhances our understanding of disease status, progression, and temporal changes; and it is essential for determining the impact of disease on a species, particularly those that are endangered. For example, koalas are often admitted to wildlife hospitals for chlamydial infections (Gonzalez-Astudillo et al. 2017; Taylor-Brown et al. 2019; Charalambous and Narayan 2020; Kerlin et al. 2022; Lunney et al. 2022a; Dutton-Regester 2024b). However, responses to chlamydial infections vary among koala populations, resulting in differences in disease prevalence and severity (Quigley and Timms 2020; Robbins et al. 2020; Lunney et al. 2024). These variations may be influenced by factors such as chlamydial strain differences, infection loads, and genetic predispositions (Robbins et al. 2020). Flying-foxes, including the grey-headed flying-fox (listed as threatened in south-east Queensland), are another ecologically important taxon often admitted to wildlife hospitals. While not a focus of the present discussion, they are known to be affected by extreme environmental stressors such as heat events. Their role as pollinators and seed dispersers, combined with their climate sensitivity, highlights the importance of ongoing monitoring and further targeted research.
Another issue in data collection was the inconsistent reporting of animal sex and age. This information is important as it allows for inferences about specific age and sex cohorts at risk for particular causes of admission, as well as identifying changes over time in disease presentation or risk factors. For example, Griffith et al. (2013) reported that older koalas were primarily admitted for chlamydia symptoms in Port Macquarie. In contrast, Dutton-Regester (2024b) found a higher prevalence of chlamydiosis signs among young koalas in the same region using more recent data (2014–2022). Understanding these trends can help determine disease persistence and shifts in affected demographics and populations most at risk.
Dog attacks were the fourth major cause of admission, with over 6500 cases reported during the study period. Interestingly, admissions due to cat attacks were 30% lower than those caused by dogs. Other studies have similarly found that dog attack admissions outnumber those caused by cat attacks (Holderness-Roddam 2011; Long et al. 2020; Franklin et al. 2021). Moreover, Franklin et al. (2021) found that dogs capture a greater proportion of threatened species than cats (120 versus 20 species, respectively). Data from the NSW Wildlife Rehabilitation website, which tracks native animal rescues, echo these findings (Department of Environment and Heritage 2024). Between 2018 and 2022 (inclusive), dogs were responsible for more injuries to native animals (n = 10,187) than cats (n = 7401). Similarly, dogs were implicated in the admission of more threatened animals (n = 503) compared with cats (n = 132) (Department of Environment and Heritage 2024). However, it is important to consider potential biases in these data. Cats, being nocturnal, and sometimes, free roaming, might have a portion of their activities go unnoticed; indeed, studies suggest owners only observe around 23% of what a cat kills (Loyd et al. 2013). Additionally, the results could be skewed by biases in the types of animals people rescue, favouring those that are more noticeable or valued. For example, cats tend to target smaller species, including reptiles, whereas dogs often prey on larger species, including the iconic, endangered koala (Franklin et al. 2021; Department of Environment and Heritage 2024).
Importantly, wildlife hospital data cannot capture the full ecological impact of any threat, including predation, vehicle strike, disease or habitat loss, as these data only reflect cases where an animal is both found by a person and brought in for care. As such, these figures are not intended to quantify population-level impacts or total wildlife mortality, but to provide insight into observable patterns in hospital admissions. Regardless, dogs and cats play a role in wildlife hospital admissions, necessitating targeted wildlife education efforts and consideration in conservation decision-making. As reported elsewhere (Taylor-Brown et al. 2019; Long et al. 2020; Department of Environment and Heritage 2024), dog and cat attacks were seasonal. In the present study, dog and cat attacks were more prevalent in spring and summer, respectively, likely due to seasonal changes in local wildlife biology. This seasonal pattern may also coincide with domestic pets spending more time outdoors, increasing the likelihood of encounters with wildlife (Long et al. 2020; Simmons et al. 2023), during warmer months. As suggested by Long et al. (2020), this highlights the importance of owners remaining vigilant by closely monitoring pets outdoors during certain times of the year to minimise attacks on wildlife.
The 12.5-fold increase in koala admissions over the study period may reflect a combination of factors. One possible explanation is increased public awareness and concern following the koala’s 2022 classification as an endangered species. This heightened awareness could have led to more people recognising and reporting distressed or injured koalas, contributing to the rise in admissions. However, it is also possible that there has been a true increase in threats to koalas, including vehicle collisions, disease, and dog attacks, all of which were implicated in the primary causes of admission in this study. A notable peak in koala admissions occurred in 2019, which coincided with the onset of the COVID-19 pandemic and changes in human behaviour, such as increased time spent at home and potentially greater vigilance in reporting wildlife encounters. While this may have led to more frequent rescues or sightings, it is unclear whether this peak reflects a genuine increase in koala welfare issues or an artifact of more people at home, noticing and reporting koalas more often. To distinguish between increased threats versus changes in reporting behaviour, future studies should integrate hospital data with parallel monitoring of wild koala populations.
A quarter of koala admissions had an unknown cause of admission, which raises questions about whether some koalas were brought in unnecessarily due to overvigilance or misreporting. This is particularly important for an endangered species, as it is essential to determine whether these admissions were warranted. In addition, inconsistencies in data entry, such as difficulties in accurately recording the cause of admission or challenges related to the ease of inputting data, may have contributed to this uncertainty. Simplifying and streamlining the data entry process could improve the accuracy of cause-of-admission documentation and provide clearer insights into the true threats facing this species. Further analysis of regional differences in koala threats across south-east Queensland, particularly in relation to disease prevalence and spatial patterns in vehicle strikes, is warranted and is encouraged to be explored in future work.
The spatial distribution of wildlife hospital admissions reveals notable patterns in relation to human population density and suburban characteristics. Among the suburbs with the highest admission rates, areas with denser populations, such as Brisbane City (997.7 people per km2: Council of Mayors 2023) and Forest Lake (2290 people per km2: Australian Bureau of Statistics 2021b; Raine and Horne 2024), showed correspondingly higher rates of wildlife admissions. This is consistent with the expectation that urbanisation and increased human activity often lead to more frequent wildlife encounters, resulting in higher incidences of injury or distress (Fahrig and Rytwinski 2009; Benitez-Lopez et al. 2010) as seen in these suburbs. The predominance of avian and mammal species in these areas, particularly in Brisbane City where possums were most commonly admitted, reflects the types of wildlife most likely to come into conflict with human development (Gehrt et al. 2010; Russell et al. 2011). Possums, especially common brushtail and ringtail species, were among the most frequently admitted mammals overall, with leading causes including orphaning and disease. Mortality rates were high across multiple causes, including motor vehicle collisions (85%) and dog attacks (85%), highlighting the need for further investigation into the threats facing this group. Interestingly, Wacol, where the hospital is located, had a lower population density (234 people per km2: Property 2024) but still reported some of the highest admission numbers. This may be attributed to the proximity of the wildlife hospital itself, suggesting that the hospital’s location may play a role in increasing awareness and encouraging reporting of wildlife incidents, regardless of the surrounding population size.
Beyond population density, the identification of key suburbs with high admission rates offers valuable insights for targeted conservation and management efforts. These areas, in which human–wildlife interactions are frequent, could benefit from localised interventions. For example, educational campaigns and community engagement initiatives focused on responsible pet ownership and training, safe driving practices, and wildlife awareness could help mitigate the anthropogenic causes of admission, such as dog attacks and vehicle collisions (Seydel et al. 2023; Lin et al. 2024). In particular, Wacol and Brisbane City saw high numbers of admissions related to ‘MVA’ and ‘dog attack’, indicating that these issues may be more prevalent in areas with higher traffic or population concentrations. Moreover, addressing habitat quality and connectivity in these high-admission suburbs will be crucial for supporting wildlife populations and reducing further threats (Gilbert-Norton et al. 2010).
Conclusion
This study analysed a decade of wildlife admission data from the RSPCA Wildlife Hospital in Brisbane, identifying orphaning, vehicle collisions, disease, and dog attacks as the primary causes of wildlife hospital admissions. A notable increase in koala admissions was observed, particularly in the context of vehicle collisions and disease. These trends suggest growing threats to wildlife, especially in urbanised areas where human–wildlife interactions are more frequent. The findings highlight the importance of improving data collection, especially regarding the context of orphaned animals and specific disease diagnoses, to better understand the underlying causes of wildlife hospital admissions. Improving standardisation of record keeping, including minimising the use of ‘unknown’ as a cause of admission, will strengthen the value of hospital data for wildlife monitoring. Furthermore, measures of success should extend beyond survival to release, incorporating long-term postrelease survival and welfare outcomes wherever possible. The rising number of vehicle collisions and dog attacks calls for targeted conservation efforts, including road safety measures and educational campaigns to promote responsible pet ownership. Enhanced management strategies are necessary to mitigate these threats and support wildlife conservation in urban environments.
Data availability
The data that support this study will be shared upon reasonable request to the author.
Acknowledgements
I thank Dr Mandy Patterson and Dr Uttara Kennedy from the RSPCA Wildlife Hospital, Wacol (Qld), for generously providing the data used in this study and valuable context regarding the hospital’s wildlife care operations.
References
Australian Bureau of Statistics (2021a) Brisbane. Available at https://abs.gov.au/census/find-census-data/quickstats/2021/LGA31000 [Retrieved 10 September 2024]
Australian Bureau of Statistics (2021b) Forest lake – 2021 census all persons QuickStats. Available at https://abs.gov.au/census/find-census-data/quickstats/2021/SAL31064 [Retrieved 10 September 2024]
Australian Bureau of Statistics (2023) Regional population. Available at https://www.abs.gov.au/statistics/people/population/regional-population/latest-release [Retrieved 10 march 2024]
Bardales Salguero R, Bogueva D, Marinova D (2024) Australia’s university Generation Z and its concerns about climate change. Sustainable Earth Reviews 7, 8.
| Crossref | Google Scholar |
Benitez-Lopez B, Alkemade R, Verweij PA (2010) The impacts of roads and other infrastructure on mammal and bird populations: a meta-analysis. Biological Conservation 143(6), 1307-1316.
| Crossref | Google Scholar |
Bil M, Andrasik R, Bilova M (2024) Wildlife–vehicle collisions: the disproportionate risk of injury faced by motorcyclists. Injury 55(5), 111301.
| Crossref | Google Scholar |
Ceballos G, Ehrlich PR (2002) Mammal population losses and the extinction crisis. Science 296(5569), 904-907.
| Crossref | Google Scholar |
Ceballos G, García A, Ehrlich PR (2010) The sixth extinction crisis loss of animal populations and species. Journal of Cosmology 8, 1821-1831.
| Google Scholar |
Charalambous R, Narayan E (2020) A 29-year retrospective analysis of koala rescues in New South Wales, Australia. PloS ONE 18(10), e0292911.
| Crossref | Google Scholar |
Council of Mayors (2023) City of Brisbane. Available at https://profile.id.com.au/comseq/about?WebID=100 [Retrieved 30 July 2024]
Department of Environment and Heritage (2024) NSW wildlife rehabilitation data dashboard. Available at https://www.environment.nsw.gov.au/topics/animals-and-plants/native-animals/rehabilitating-native-animals/wildlife-rehabilitation-data-and-reporting/wildlife-rehabilitation-data-dashboard [Retrieved 27 May 2024]
Deptartment of the Premier and Cabinet (2024) Population growth underlines need to create and plan for jobs. Available at https://statements.qld.gov.au/statements/77775 [Retrieved 10 march 2024]
Dissanayake RB, Stevenson M, Astudillo VG, Allavena R, Henning J (2023) Anthropogenic and environmental factors associated with koala deaths due to dog attacks and vehicle collisions in South-East Queensland, Australia, 2009–2013. Scientific Reports 13, 14275.
| Crossref | Google Scholar |
Dutton-Regester KJ (2024a) Hospital admissions to Phillip Island Wildlife Clinic, Victoria, Australia, over a 10-year period, 2012–2021. Australian Veterinary Journal 102(6), 316-323.
| Crossref | Google Scholar |
Dutton-Regester KJ (2024b) Koala admissions to a wildlife hospital in coastal New South Wales, Australia, over a nine-year period, 2014–2022. Australian Journal of Zoology 71, ZO23023.
| Crossref | Google Scholar |
Englefield B, Starling M, McGreevy P (2018) A review of roadkill rescue: who cares for the mental, physical and financial welfare of Australian wildlife carers? Wildlife Research 45(2), 103-118.
| Crossref | Google Scholar |
Fahrig L, Rytwinski T (2009) Effects of roads on animal abundance: an empirical review and synthesis. Ecology & Society 14(1), 21.
| Crossref | Google Scholar |
Franklin M, Rand J, Marston L, Morton J (2021) Do pet cats deserve the disproportionate blame for wildlife predation compared to pet dogs? Frontiers in Veterinary Science 8, 731689.
| Crossref | Google Scholar |
Gårdebäck A, Joäng M, Andersson M (2024) Common causes for veterinary visits among Australian wildlife. Animals 14(18), 2662.
| Crossref | Google Scholar |
Gilbert-Norton L, Wilson R, Stevens JR, Beard KH (2010) A meta-analytic review of corridor effectiveness. Conservation Biology 24(3), 660-668.
| Crossref | Google Scholar |
Glista D, DeVault TL, DeWoody JA (2009) A review of mitigation measures for reducing wildlife mortality on roadways. Landscape and Urban Planning 91(1), 1-7.
| Crossref | Google Scholar |
Gonzalez-Astudillo V, Allavena R, McKinnon A, Larkin R, Henning J (2017) Decline causes of koalas in south east Queensland, Australia: a 17-year retrospective study of mortality and morbidity. Scientific Reports 7, 42587.
| Crossref | Google Scholar |
Griffith JE, Dhand NK, Krockenberger MB, Higgins DP (2013) A retrospective study of admission trends of koalas to a rehabilitation facility over 30 years. Journal of Wildlife Diseases 49(1), 18-28.
| Crossref | Google Scholar |
Gross M (2023) Human population at the crossroads. Current Biology 33(1), R1-R15.
| Crossref | Google Scholar |
Hanson M, Hollingshead N, Schuler K, Siemer WF, Martin P, Bunting EM (2021) Species, causes, and outcomes of wildlife rehabilitation in New York State. PLoS ONE 16(9), e0257675.
| Crossref | Google Scholar |
Hobday AJ, Minstrell ML (2008) Distribution and abundance of roadkill on Tasmanian highways: human management options. Wildlife Research 35(7), 712-726.
| Crossref | Google Scholar |
Katumo DM, Liang H, Ochola AC, Lv M, Wang Q-F, Yang C-F (2022) Pollinator diversity benefits natural and agricultural ecosystems, environmental health, and human welfare. Plant Diversity 44(5), 429-435.
| Crossref | Google Scholar |
Kerlin DH, Grogan LF, McCallum HI (2022) Insights and inferences on koala conservation from records of koalas arriving to care in south east Queensland. Wildlife Research 50(1), 57-67.
| Crossref | Google Scholar |
Kwok ABC, Hearing R, Travers SK, Stathis P (2021) Trends in wildlife rehabilitation rescues and animal fate across a six-year period in New South Wales, Australia. PLoS ONE 16, e0257209.
| Crossref | Google Scholar |
Laurance WF, Clements GR, Sloan S, O’Connell CS, Mueller ND, Goosem M, Venter O, Edwards DP, Phalan B, Balmford A, Van Der Ree R, Arrea IB (2014) A global strategy for road building. Nature 513, 229-232.
| Crossref | Google Scholar |
Lin H, Wu D, Gu J (2024) Citizen science as a tool to increase residents’ tolerance towards urban wildlife: a case study of raccoon dogs in Shanghai. Frontiers in Environmental Science 12, 1395829.
| Crossref | Google Scholar |
Long RB, Krumlauf K, Young AM (2020) Characterizing trends in human–wildlife conflicts in the American Midwest using wildlife rehabilitation records. PLoS ONE 15, e0238805.
| Crossref | Google Scholar |
Loss SR, Will T, Marra PP (2014) Estimation of bird–vehicle collision mortality on US roads. The Journal of Wildlife Management 78(5), 763-771.
| Crossref | Google Scholar |
Loyd KAT, Hernandez SM, Carroll JP, Abernathy KJ, Marshall GJ (2013) Quantifying free-roaming domestic cat predation using animal-borne video cameras. Biological Conservation 160, 183-189.
| Crossref | Google Scholar |
Lunney D, Cope H, Sonawane I, Stalenberg E, Haering R (2022a) An analysis of the long-term trends in the records of Friends of the Koala in north-east New South Wales: I. Cause and fate of koalas admitted for rehabilitation (1989–2020). Pacific Conservation Biology 29(3), 177-196.
| Crossref | Google Scholar |
Lunney D, Predavec M, Sonawane I, Moon C, Rhodes JR (2022b) Factors that drive koala roadkill: an analysis across multiple scales in New South Wales, Australia. Australian Mammalogy 44(3), 328-337.
| Crossref | Google Scholar |
Lunney D, Cope H, Griffith J, Orscheg C, Bryant J, Haering R (2024) Trends in the rescue and fate of koalas in New South Wales (1973-2020), with a focus on disease and trauma. Australian Zoologist 44(1), 205-219.
| Crossref | Google Scholar |
Mo M, Roache M, Haering R, Kwok A (2021) Using wildlife carer records to identify patterns in flying-fox rescues: a case study in New South Wales, Australia. Pacific Conservation Biology 27, 61-69.
| Crossref | Google Scholar |
Molinari-Jobin A, Zimmermann F, Borel S, Le Grand L, Iannino E, Anders O, Belotti E, Bufka L, Ćirović D, Drouet-Hoguet N, Engleder T, Figura M, Fuxjäger C, Gregorova E, Heurich M, Idelberger S, Kubala J, Kusak J, Melovski D, Middelhoff TL, Mináriková T, Molinari P, Mouzon-Moyne L, Moyne G, Mysłajek RW, Nowak S, Ozolins J, Ryser A, Sanaja B, Shkvyria M, Sin T, Sindičić M, Slijepčević V, Stauffer C, Tám B, Trajce A, Volfová J, Wölfl S, Zlatanova D, Vogt K (2024) Rehabilitation and release of orphaned Eurasian lynx (Lynx lynx) in Europe: implications for management and conservation. PLoS ONE 19(3), e0297789.
| Crossref | Google Scholar |
Mozer A, Prost S (2023) An introduction to illegal wildlife trade and its effects on biodiversity and society. Forensic Science International: Animals and Environments 3, 100064.
| Crossref | Google Scholar |
Mullineaux E, Pawson C (2024) Trends in admissions and outcomes at a British wildlife rehabilitation centre over a ten-year period (2012–2022). Animals 14(1), 86.
| Crossref | Google Scholar |
Property (2024) Wacol. Available at https://www.yourinvestmentpropertymag.com.au/top-suburbs/qld/4076-wacol#:~:text=The%20size%20of%20Wacol%20is,nearly%208.9%25%20of%20total%20area [Retrieved 30 July 2024]
Quigley BL, Timms P (2020) Helping koalas battle disease – recent advances in Chlamydia and koala retroviruses (KoRV) disease understanding and treatment in koalas. FEMS Microbiology Reviews 44(5), 583-605.
| Crossref | Google Scholar |
Raine and Horne (2024) Forest lake QLD. Core logic. Available at https://s3-ap-southeast-2.amazonaws.com/attachedfiles.clientvault.com/2658/1719797449.SuburbReportForestLakeQLD4078Mo292024.pdf
Ramp D, Caldwell J, Edwards KA, Warton D, Croft DB (2005) Modelling of wildlife fatality hotspots along the Snowy Mountain Highway in New South Wales, Australia. Biological Conservation 126(4), 474-490.
| Crossref | Google Scholar |
Robbins A, Hanger J, Jelocnik M, Quigley BL, Timms P (2020) Koala immunogenetics and chlamydial strain type are more directly involved in chlamydial disease progression in koalas from two south east Queensland koala populations than koala retrovirus subtypes. Scientific Reports 10, 15013.
| Crossref | Google Scholar |
Rodríguez B, Rodríguez A, Siverio F, Siverio M (2010) Causes of raptor admissions to a wildlife rehabilitation center in Tenerife (Canary Islands). Journal of Raptor Research 44(1), 30-39.
| Crossref | Google Scholar |
Russell TC, Herbert CA, Kohen JL (2011) High possum mortality on urban roads: implications for the population viability of the common brushtail and the common ringtail possum. Australian Journal of Zoology 57(6), 391-397.
| Crossref | Google Scholar |
Scheelings TF (2015) Morbidity and mortality of reptiles admitted to the Australian wildlife health centre, Healesville Sanctuary, Australia, 2000–13. Journal of Wildlife Diseases 51(3), 712-718.
| Crossref | Google Scholar |
Schenk AN, Souza MJ (2014) Major anthropogenic causes for and outcomes of wild animal presentation to a wildlife clinic in East Tennessee, USA, 2000–2011. PLoS ONE 9(3), e93517.
| Crossref | Google Scholar |
Schlagloth R, Santamaria F, Melzer A, Keatley MR, Houston W (2022) Vehicle collisions and dog attacks on Victorian koalas as evidenced by a retrospective analysis of sightings and admission records 1997–2011. Australian Zoologist 42(3), 655-666.
| Crossref | Google Scholar |
Shilling F, Nguyen T, Saleh M, Kyaw MK, Tapia K, Trujillo G, Bejarano M, Waetjen D, Peterson J, Kalisz G, Sejour R, Croston S, Ham E (2021) A reprieve from US wildlife mortality on roads during the COVID-19 pandemic. Biological Conservation 256, 109013.
| Crossref | Google Scholar |
Simmons RE, Seymour CL, George ST, Peters K, Morling F, O’Riain MJ (2023) Seasonal movement patterns of urban domestic cats living on the edge in an African city. Animals 13(6), 1013.
| Crossref | Google Scholar |
Soulsbury CD, White PCL (2015) Human–wildlife interactions in urban areas: a review of conflicts, benefits and opportunities. Wildlife Research 42(7), 541-553.
| Crossref | Google Scholar |
Taylor-Brown A, Booth R, Gillett A, Mealy E, Ogbourne SM, Polkinghorne A, Conroy GC (2019) The impact of human activities on Australian wildlife. PLoS ONE 14, e0206958.
| Crossref | Google Scholar |
Tribe A, Brown PR (2000) The role of wildlife rescue groups in the care and rehabilitation of Australian fauna. Human Dimensions of Wildlife 5(2), 69-85.
| Crossref | Google Scholar |
Trombulak SC, Frissell CA (2000) Review of ecological effects of roads on terrestrial and aquatic communities. Conservation Biology 14(1), 18-30.
| Crossref | Google Scholar |
Visintin C, Van der Ree R, McCarthy MA (2017) Consistent patterns of vehicle collision risk for six mammal species. Journal of Environmental Management 201, 397-406.
| Crossref | Google Scholar |
Wendell MD, Sleeman JM, Kratz G (2002) Retrospective study of morbidity and mortality of raptors admitted to Colorado State University Veterinary Teaching Hospital during 1995 to 1998. Journal of Wildlife Diseases 38(1), 101-106.
| Crossref | Google Scholar |
Wolfe ND, Daszak P, Kilpatrick AM, Burke DS (2005) Bushmeat hunting, deforestation, and prediction of zoonotic disease. Emerging Infectious Diseases 11(12), 1822-1827.
| Crossref | Google Scholar |
Wolfe ND, Dunavan CP, Diamond J (2007) Origins of major human infectious diseases. Nature 447, 279-283.
| Crossref | Google Scholar |