

Analysis of adoption of genetic tools in the northern Australia beef industry
Patricia Menchon A * , Jaime K. Manning A , Dave L. Swain A B and Amy Cosby A
A
B
Abstract
Genetic improvement of beef production systems has become a priority for beef cattle producers in northern Australia. However, reports from across Australia indicate that 76% and 59% of commercial and stud cattle beef cattle producers, respectively, use genetic evaluation services, which is considerably higher than the current levels of northern Australian beef producers.
This study aims to identify the demographic and productive variables that influence decision-making regarding the use of genetic tools, and identify the motivations, limitations and preferences of northern Australia beef cattle producers.
An online survey was completed by 97 beef producers in northern Australia. Participants were classified into seedstock and commercial beef cattle producers. The data were analysed with logistic regression and nonparametric tests.
The results demonstrate that for seedstock beef cattle producers, each additional year of age increased the likelihood of adopting genetic tools by 6.4%. In contrast, for commercial beef cattle producers, each additional year of age decreased the likelihood by 5.2%. However, commercial beef cattle producers who collect phenotypic data are more likely to adopt genetic tools. Beef cattle producers preferred records of fertility and growth traits of beef cattle. Furthermore, recording data at the birth of beef cattle in northern Australia emerges as a barrier to the adoption of genetic tools. A key motivation for adoption is understanding genetic tools and their impact on the business.
Understanding genetic tools and their impact on beef enterprises is critical to motivating their adoption by beef cattle producers. Demographic, production and profitability factors associated with their use affect the likelihood of adoption of genetic tools in the northern Australian beef industry.
An understanding of genetic tools, the impact on the economic benefits of beef cattle enterprises by producers and the reasons for change in complex decision-making related to animal genetic improvement are fundamental in the process of developing extension strategies. Future research is needed to understand the training demands and delivery methods under northern Australian conditions.
Keywords: adoption, attitudes, beef, breeding, extension, genetic, preferences, traits.
Introduction
Genetic improvement of beef cattle has emerged as a fundamental priority for producers in northern Australia because of its potential to increase productivity through selection processes (Greenwood et al. 2018; Chilcott et al. 2020). However, only 22% and 23% of commercial and stud breeders in northern Australia, respectively, rely on genetic information to select animals with desired traits for their herds (Agricultural Business Research Institute 2015). Currently, Sloane and Walker (2023) reported across Australia that 76% and 59% of stud and commercial producers, respectively, use genetic assessment services, which is considerably higher than current levels for northern Australia beef cattle producers. Therefore, increased awareness and adoption of genetic tools (use of genetic and genomic data for informed decision-making regarding animal selection), especially in northern Australia, are important to improve beef cattle genetics, such as adaptability, fertility, body size and meat quality to further contribute to the local economy (Greenwood et al. 2018; Campbell and King 2022). Banks (2022b) summarises the decision process that determines genetic improvement in three steps: defining the objective (what traits are important and the direction of change desired); identifying animals with superior genetics according to the objectives; and selecting those animals, mating them and producing offspring. In this sequence, livestock genetic improvement programs play a crucial role, which begin with selective breeding using statistical prediction methods, such as multi-trait genetic evaluation technologies (BREEDPLAN 2023). This method was developed for the beef industry by the Animal Genetics and Breeding Unit in 1985 (AGBU 2023) and, more recently, incorporates genomic selection, which has made more precise selection possible (Johnston et al. 2018). Additionally, more intensive use of genetically superior parents for the next generation leads to faster rates of genetic gain (Mueller and Van Eenennaam 2022). Furthermore, the combination of genetic and genomic tools with reproductive technologies (such as artificial insemination, sperm or embryo cryopreservation, oestrus synchronisation, multiple ovulations and in vitro embryo production) further accelerates the genetic gain (Miller 2022; Miller 2023; Mueller and Van Eenennaam 2022).
Genetic evaluations that incorporate genomic estimated breeding values (EBVs) as a selection tool for desired traits, such as fertility and growth, allow selection earlier in the animal’s life than genetic evaluations that use only pedigree information (Cole and VanRaden 2018; Moore et al. 2019; Hayes et al. 2022). Successful results were reported in estimating genomic EBVs of commercial herds in Brahmans (Reverter et al. 2016; Johnston et al. 2017) and between breeds (Angus, Belmont Red, Brahman, Charolais, Droughtmaster, Hereford, Limousin, Santa Gertrudis, Shortorn, Wagyu, Boran) in northern Australia (Hayes et al. 2022). Furthermore, genomics can only improve traits that have been measured (Cole and VanRaden 2018). Therefore, the continuous phenotyping of traits in reference populations is a fundamental part of the genetic improvement process through genomics. The reference population is composed of animals with known genotypes and measured phenotypes, whereas animals that are not from the reference population can be genetically evaluated based on their genotype. Therefore, the precision of the genetic merit of non-phenotyped animals depends largely on the size of the reference population. Banks (2022b) argues that the decoupling between measurement and selection presents important advantages, such as the evaluation of a large number of animals without the operational and economic cost of phenotypic measurements, and evaluating animals whose traits cannot be measured. This could be a particularly important advantage that encourages increased levels of adoption of genetic tools that allow genetic improvement in northern Australian herds.
Genetic improvement tools are used to support the selection of animals with the desired characteristics and facilitate the subsequent transmission of these characteristics to the offspring. Extension activities specific to genetic tools are based on cattle producers being aware not only of the tools, but also of the importance of the traits to be chosen in the genetic selection of animals for commercial use. Analysing the factors that promote the adoption of technologies or processes is crucial for designing extension programs aimed at promoting genetic improvement through both traditional and new technologies (Menchon et al. 2024). Consideration of the productive and economic conditions, as well as the social behaviour of producers, is essential for extension services to play an important role in disseminating information and promoting technology use on-farms (Dill et al. 2015; Gebre et al. 2020; Nettle et al. 2022; Quddus 2022).
Effective extension activities may increase the willingness of producers to use technologies or management strategies to obtain benefits through genetic improvement programs. In comparison with southern Australia, the northern Australia beef industry has been a slow adopter of technology (Griffith et al. 2008; Bell 2019). This lag can be attributed to several factors, including connectivity in remote areas, the cost of emerging technologies, accessibility to support services and reduced knowledge (Chilcott et al. 2020; Jakku et al. 2022; Bell and Sangster 2023). The North Australian Beef Research Council has identified increasing the understanding and utilisation of both current and new genetic technologies as a priority for research, development and adoption for the 2023–2024 period (NABRC 2022). Therefore, understanding the motivating factors that encourage northern Australian cattle producers to adopt genetic selection is required to develop and deliver effective extension programs.
This study aims to identify the demographic and productive variables that influence decision-making regarding the use of genetic tools, and identify the motivations, limitations and preferences of northern Australia beef producers deciding to adopt. To achieve this, we seek to answer the following research questions: ‘How do producers make decisions to adopt genetic tools, and why do some producers adopt them and others not?’ and ‘What are the genetic tools used by beef producers in northern Australia and why?’. An initial report of this work has been published (Menchon et al. 2025).
Materials and methods
This research was conducted in 2024 through surveys with stud and commercial beef cattle producers in northern Australia. This research was approved by CQUniversity Australia Human Research Ethics Committee (approval number 24882).
Data collection
An online survey instrument comprising of open and closed ended questions had multiple distribution methods, including direct email, newsletters and ads on social media targeted to northern Australia (see Supplementary material). The questionnaire was hosted on Qualtrics (Qualtrics 2024) and consisted of 32 questions in total. The survey was designed in a staggered and flexible manner, where the questions that arose were conditioned by answers to the previous question. The survey was anonymous and confidential to guarantee privacy for producers, and had different sections to answer the research questions. First, the survey contained four questions about the respondent’s role and geographical location of the farm. The answers were used to determine if they were eligible (only beef producers from northern Australia with beef production systems as their main agricultural activity were considered for this research).
Second, 11 demographic and farm enterprise questions were asked related to social factors (age, education, gender, role on the farm) and production systems factors (the main focus of the enterprise, number of employees, breeding systems, herd size, breeding methods and mustering rounds). Participants’ response to the main focus of their farming enterprise allowed for classification into two groups: seedstock or commercial. Thereby, seedstock beef producers breeding and market bulls and heifers intended for use as breeding stock in the production systems, and commercial beef producers, raise and fatten animals for human consumption. They were then asked different questions according to this classification. A set of questions related to the data recorded on the farm was asked and, finally, a set of questions related to the use of genetic tools. The type of questions that the survey contained was mostly multiple choice or a Likert matrix table question (Supplementary material).
Sample size and sampling
To determine a statistically robust sample size for estimating proportions, the formula used by Dill et al. (2015) and proposed by (Daniel and Cross 2018) was used:
Where n = sample size, z = desired confidence level (e.g. 95%, z = 1.96), p = proportion of a characteristic of the population to be sampled, the number of beef cattle producers related to the total number of farms in northern Australia, q = (1−p) and d = desired precision.
According to Australian Bureau of Agricultural and Resource Economics and Sciences (2023), in 2022 there were 9739, 147 and 5716 broadacre businesses, and 7624, 144 and 1130 beef businesses in Queensland, the Northern Territory and Western Australia, respectively. This research only considers the area of northern Australia, and therefore, 40% of Western Australia met the inclusion criteria (Government of Western Australia 2021). This corresponds to P-values of 0.675 and q of 0.325. Considering a 90% desired precision (d = 0,1), the sample size to be collected should be 84. To reach the required number of participants, one of the proposed methods for collecting survey data is the snowball method (Dill et al. 2015), where participants are asked to share the survey with other potential participants. This method of sampling is selected because it presents an advantage in assuming that beef cattle producers in northern Australia know each other. However, the drawback of this method of data collection is the potential bias that may result from it being distributed and completed in a greater proportion among cattle producers who have connectivity and interest in participating. Through initial contacts, it was possible to reach producers who are difficult to access, either because of their geographical location or because they are not linked to networks that promote the genetic improvement of livestock. Contacts across the whole of northern Australia held by the CQUniversity Agri-Tech Education and Extension Research team were consulted to identify and contact beef cattle producers, and initiate first purposive sampling and then the snowball process. New social networks and direct email provided through industry and extension agencies were utilised to achieve the target sample size.
Data analysis
Methodologies to analyse factors that explain the level of adoption vary in the literature. For example, Quddus (2022) applied binary logistic regression and precision index, Sitienei et al. (2018) and Dill et al. (2015) applied Poisson regression and multivariate probit regression. In this research, the binary logistic regression model (Field 2018) was used to identify the variables that influence the adoption of genetic tools by beef cattle producers. This method was chosen because it is used to obtain the odds ratio in the presence of more than one explanatory variable with binary dependent variables.
Adoption of genetic tools
To answer the research question, ‘How do cattle producers make decisions to adopt genetic tools and why do some cattle producers adopt them and others not?’, the survey had questions that allowed producers to be classified into different categories related to their level of adoption of genetic improvement technologies. Seedstock and commercial beef cattle producers were classified according to the use of genetic tools in their herds into two sub-categories, Adopters and Non-Adopters (Quddus 2022). To have an objective classification of producers, questions were structured to allow their responses to be coded. Commercial cattle producers were considered an ‘Adopter’ (Quddus 2022) when they had utilised any of the following tools in the past 5 years: participation in breeding programs, purchase of heifers with genetic evaluation or pedigree, or purchase of bulls or use of artificial intelligence from bulls with genetic evaluations, provided they also engaged in both breeding programs and purchasing heifers with genetic evaluation or pedigree. Seedstock producers were considered an Adopter when participating in breeding programs (e.g. BREEDPLAN, TACE, International Genetic Solutions, Leachman, Ingenity) and offering bulls or heifers for sale with EBV data. A Non-Adopter (Quddus 2022) was when a commercial or seedstock producer had not used any of the above-mentioned tools.
Because the dependent variables are essentially qualitative and categorised, it is proposed to follow the binary logistic model used by Quddus (2022):
Where Y takes the value of 1 if the beef cattle producer uses genetic tools in their herd (Adopters); the probability that the producer adopts any of the genetic tools is p, (1−p) is the probability that the producer does not use genetic tools (Non-Adopters), Z is the vector of the independent variables, δ is the coefficient to be estimated and α is a constant. The independent variables used in the model were demographic and productive variables (Table 1).
| Variables | Definition/data | Categories | |
|---|---|---|---|
| Level of adoption | Dependent; categorical | Adopter; Non-Adopter | |
| Age | Age in years; independent; continuous | >18 | |
| Gender | Independent; categorical | Male, female; non-binary/third gender; prefer not to say | |
| Education | Highest level of education; independent; categorical | Year 12 level or less; certificate/diploma; bachelor degree; postgraduate degree; prefer not to say | |
| Role | Role in decision-making; independent; categorical | Employee (you follow the instructions of the owner or manager) Manager (you don’t own the herd of cattle, but you make decisions) Owner (you own the herd of cattle and make decisions) | |
| Employees | No. of employees who work full time in the company, independent; categorical | 0; 1–2; 3–5; >6 | |
| Herd size | No.of female animals mated; independent; categorical | <200–499; 500–1499; >1500 | |
| Breeding Systems | Independent; categorical | Straight-breeding; mixture of both; crossbreeding/composite | |
| Breeding methods used for female mating | Independent; categorical | Natural mating; artificial insemination; embryo transfer | |
| Data collection | Data is collected on the farm and how it is done, independent; categorical | Yes; no | |
| Manually (e.g. in yards, in notebook); automatically (e.g. walk over weighing); manually and automatically |
Genetic tools and data collection on-farm
To answer the research question, ‘What are the preferred genetic tools used by beef cattle producers in northern Australia and why?’, Chi-squared tests (Field 2018) were performed to analyse whether there is a relationship between the adoption of genetic tools and preferences regarding data recorded on-farm, genetic tools used and reasons for using them within each group of cattle producers (commercial and seedstock). The null hypotheses tested were:
A. H0: There is no significant association between the adoption of genetic tools (Ai) and phenotype data recorded on-farm (Tj).
Where i is Adopter and Non-Adopter, and j includes the following data recorded: calving ease, fertility/% calving/% weaning, milk supply/udder development, scrotal circumference, birthweight, weaning weight, 200/400/600-day weight, sale weight, weight gain/growth rates, carcass weight, structure/conformation/appearance and temperament/docility/flight time with dichotomic values according to the answer of participants (1 selected, 0 non-selected).
B. H0: There is no significant association between the adoption of genetic tools (Ai) and genetic tool used (Gj).
Where i is Adopter and Non-Adopter, and j includes the following genetic tools: use of EBVs (BREEDPLAN); use of economic selection indices; crossbreeding; multibreed evaluations (International Genetic Solutions); genomics; own data (collection traits data on the farm); and none of the above.
C. H0: There is no significant association between the adoption of genetic tools (Ai) and reasons for using genetic tools (Rj).
Where i is Adopter and Non-Adopter, and j includes the following reasons: I understand the genetic tool; it’s easy to use; I can see the impact of using it in my herd; the cost:benefit ratio is appropriate; it doesn’t demand much of my time; other producers are using genetic tools, and I perceive it is important to use them too; it is important for the business; I have received advice on how to use it; and I have the facilitating conditions to use them (resources, digital services).
Finally, participants were asked about their level of agreement (5-point Likert scale) about different reasons for starting or continuing to use genetic information in their herds. To analyse the distribution of the level of agreement between Adopters and Non-Adopters by group of cattle producers on the reasons for starting or continuing to use genetic tools (non-normal distribution; P < 0.001, Shapiro test), a non-normal Mann–Whitney test was used (Corder and Foreman 2014; Field 2018).
D. H0: The distribution of the ‘Reason to start or continue using genetic tools’ (RCi) is the same across categories of the level of adoption of genetic tools (Ai).
Where i is Adopter and Non-Adopter, and j includes the following reasons: increase in economic profits; reduce age at first calving in heifers; increase animal health; increase herd fertility; crossbreeding; marketing.
The results of the survey were ordered and managed in a Microsoft Excel spreadsheet. To analyse the logistic regression, Chi-squared test and descriptive analyses, the Statistical Package of Social Science (SPSS ver. 28.0.0.0 (190)) was used.
Results and discussion
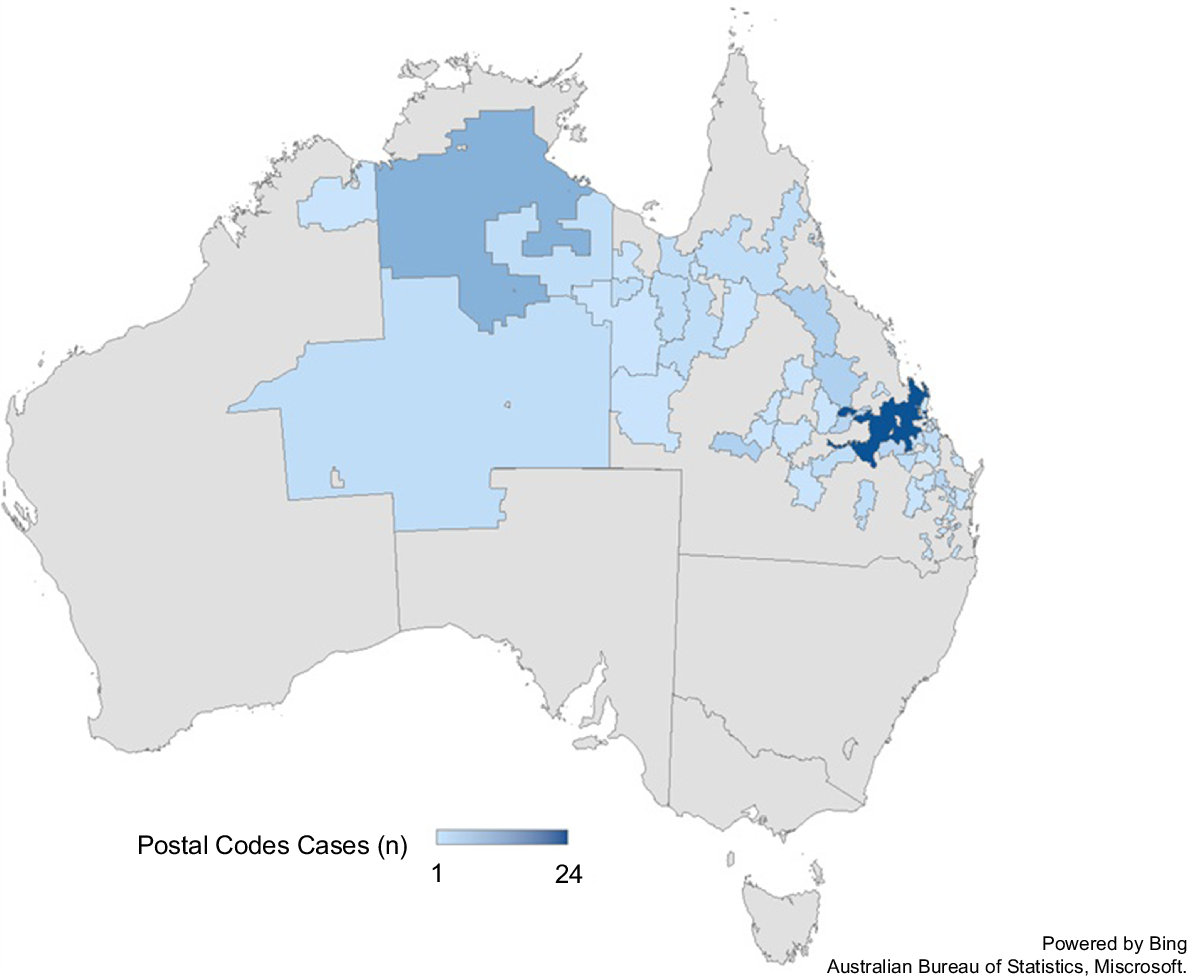
The survey was completed by 137 beef cattle producers, of which 97 were considered because they met the conditions required for this study; that is, a beef producer located in northern Australia. Participants were asked to provide the postcode(s) of the property(ies). A total of 116 postcodes were registered, distributed between Queensland (86.2%), Northern Territory (12.9%) and north Western Australia (0.9%; Fig. 1). This distribution is in line with the values used for the sample size estimation (Government of Western Australia 2021; Australian Bureau of Agricultural and Resource Economics and Sciences 2023), where 91.46% of the beef farming population is located in Queensland and 8.54% between the Northern Territory and north Western Australia. Regarding the breed type of cattle, 45.36% of the producers responded that their enterprises have both tropical (Bos Indicus) and temperate (Bos Taurus) cattle, with 44.33% indicating that tropical (Bos Indicus) are the majority, and only 10.31% indicating that temperate (Bos Taurus) is the main breed. Of the participants, 55.67% answered that the main focus in their enterprise is commercial, followed by seedstock (44.33%).
The proportion of seedstock producers in this study is higher than the 33% reported in previous surveys that investigated the barriers to adopting genetic tools in northern Australia (Agricultural Business Research Institute 2015), and 18% reported in genetics insights analysis across Australia (Sloane and Walker 2023). For seedstock producers, 67.44% were men, with an average age of 48 years (±13.13 years; range 28–79 years), and 32.56% were women, with an average age of 42 years (±13.17 years; years 20–70 years). Regarding their education, 23.26%, 25.58%, 32.56% and 18.60% attained the educational level of Year 12 level or less, certificate/diploma, bachelor’s degree and postgraduate degree, respectively. Regarding the role of the participant in the beef farm, 88.37% of the respondents described themselves as the owner and decision-maker, 9.30% described themselves as the manager of the herd, who makes decisions despite not being the owner, and 2.33% described themselves as employees, who only follow the instructions of the owner or manager. The majority of participants (58.14%) reported having <500 mated females on their farms, 25.58% reported having between 500 and 1500 females, and 16.28% reported having >1500.
For commercial producers, 47.17% were men, with an average age of 47 years (±14.76 years; range 20–84 years), and 52.83% were women, with an average age of 45 years (±13.23 years; range 18–64 years). Regarding their education, 25.93%, 35.19%, 33.33% and 5.56% attained the educational level of Year 12 level or less, certificate/diploma, bachelor’s degree and postgraduate degree, respectively. Regarding the role of the participant in the beef farm, 72.22% of the respondents described themselves as the owner of the herd and the one who makes the decisions on the farm, 20.37% described themselves as the manager of the herd, who makes decisions despite not being the owner, and 7.41% described themselves as employees. Regarding the herd size, 22.22% of the participants reported having <500 mated females on their farms, 38.89% reported having between 500 and 1500 females, and 38.89% reported having >1,500. Compared with the previous report (Agricultural Business Research Institute 2015), the age range is wider in this study (approximately 18–84 vs 36–65), and the participation of women is also higher (43% vs 18%).
In this study, the ratio between Adopters:Non-Adopters differed for each group of producers, being 69.77:30.23% and 48.15:51.85% for seedstock and commercial cattle producers, respectively. These values are slightly higher than those reported by Sloane and Walker (2023), where breeding livestock producers involved in tropical or both (tropical and temperate) livestock were between 56% and 62% for BREEDPLAN users. Additionally, the proportion of commercial producers in Queensland, Western Australia and North Territory using EBV was 70%, 87% and 73%, respectively (Sloane and Walker 2023). Therefore, this study has a higher representation of commercial producers who were classified as non-users of genetic tools. The proportion of adopters was lower than national reported values of 76% and 78% across Australia for seedstock and commercial producers (Sloane and Walker 2023). Therefore, this study provides new information on potential users of genetic tools that could be used in the design of extension activity.
Adoption of genetic tools
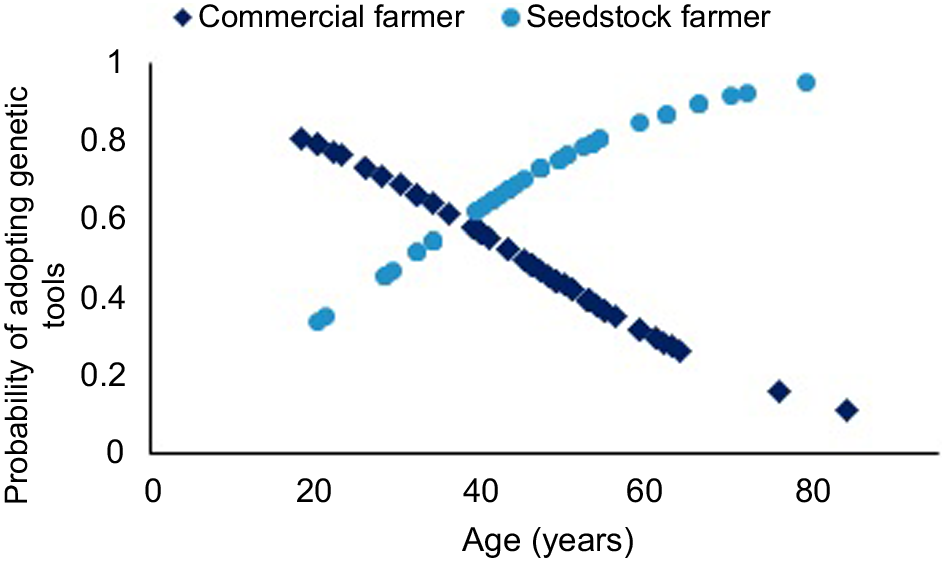
Results from the logistic models are shown in Table 2 for demographics variables by group of cattle producers. Gender, level of education attained and the role that respondents play in the farm did not have any effect on the adoption of genetic tools. Age was the only factor that had a significant effect on the odds ratio of adopting genetic tools for seedstock and commercial producers (Table 2). The goodness of fit of the models for age was similar across producer groups, with 14.9% and 14.1% of the variance in the dependent variables (Adopter/Non-Adopter) for seedstock and commercial producers, respectively. The odds ratio (Exp(B)) for age was 1.06 for seedstocks, indicating that for every 1-year increase in age, the odds of adopting genetic tools increased by 6.4%. Conversely, the odds ratio (Exp(B)) for the predictor was 0.95 for commercial producers, indicating that for every 1-year increase in age, the odds of adopting genetic tools decreased by 5.2%.
| n | Nagelkerke R2 | B | s.e. | Significance | Exp(B) | 95% CI for Exp(B) | |||
|---|---|---|---|---|---|---|---|---|---|
| Lower | Upper | ||||||||
| Seedstock producer | |||||||||
| Age | 43 | 0.15 | 0.06 | 0.03 | 0.05* | 1.06 | 1.00 | 1.13 | |
| Gender | 43 | 0.05 | 0.86 | 0.69 | 0.22 | 2.36 | 0.61 | 9.16 | |
| Education | |||||||||
| Year 12 level or less | 43 | 0.03 | 0.83 | ||||||
| Certificate/diploma | −0.27 | 0.93 | 0.76 | 0.75 | 0.12 | 4.66 | |||
| Bachelor degree | 0.45 | 0.95 | 0.63 | 1.57 | 0.24 | 10.09 | |||
| Postgraduate degree | −0.34 | 1.00 | 0.74 | 0.71 | 0.10 | 5.12 | |||
| Role on farm | |||||||||
| Owner | 43 | 0.03 | 0.96 | ||||||
| Employee | 20.430 | 40,192.97 | 1.00 | 7.46E + 08 | 0.00 | ||||
| Manager | 0.325 | 1.21 | 0.79 | 1.385 | 0.13 | 14.73 | |||
| Commercial producer | |||||||||
| Age | 53 | 0.14 | −0.05 | 0.02 | 0.03* | 0.95 | 0.90 | 0.99 | |
| Gender | 53 | 0.00 | 0.22 | 0.55 | 0.69 | 1.25 | 0.42 | 3.68 | |
| Education | |||||||||
| Year 12 level or less | 54 | 0.01 | 0.90 | ||||||
| Certificate/diploma | 0.18 | 0.71 | 0.80 | 1.20 | 0.30 | 4.82 | |||
| Bachelor degree | 0.29 | 0.72 | 0.69 | 1.33 | 0.33 | 5.43 | |||
| Postgraduate degree | 0.98 | 1.34 | 0.46 | 2.67 | 0.19 | 36.76 | |||
| Role on farm | |||||||||
| Owner | 54 | 0.05 | 0.39 | ||||||
| Employee | −0.94 | 1.20 | 0.43 | 0.39 | 0.04 | 4.07 | |||
| Manager | 0.71 | 0.7.0 | 0.31 | 2.04 | 0.51 | 8.12 | |||
*Level of significance: P < 0.05.
Therefore, age is a factor that impacts the adoption of genetic tools in opposite directions across groups (Fig. 2). Age affects the decision-makers’ ability to deal with complexity (Martin-Collado et al. 2018). However, in the agricultural sector, age has been shown to have diverse impacts on the adoption of technology (Menchon et al. 2024). For instance, Montes de Oca Munguia and Llewellyn (2020) concluded that age had a negative influence on the adoption of technologies, but Martin-Collado et al. (2021) found that although age did not generally affect cattle producers’ attitudes towards breeding across all breeds analysed, it was significant for certain breeds and breeding systems. Considering other aspects of beef production, Sitienei et al. (2018) noted that the impact of cattle producers’ age varied depending on beef management practices (e.g. animal identification systems, castration, access shade to during summer), but also found that the more increased producers’ age, the less likelihood to search for information on the internet (e.g. nutrition).
Predicted probability of adopting genetic tools by age and by group of cattle producers (commercial cattle producers; seedstock cattle producers).
The results of the logistic regression of productive variables, such as herd size, breeding systems and data collection on the farm as factors explaining the probability of adoption of genetic tools, are shown in Table 3. In this study, herd size and breeding system do not explain the odds ratio of adoption of genetic tools by different groups of cattle producers. Survey results indicate that most participants record phenotypic data on-farm (88.37% and 74.1% for seedstock and commercial cattle producers, respectively). This could indicate a bias in the results due to a high level of participation towards cattle producers with a particular business perspective. However, data collection on farms presents differences between cattle producers’ groups. Data collection on commercial farms had a statistically significant effect (P = 0.005), and explained 32% of the variation in the adoption levels of genetic tools in this group. The odds ratio indicates that the chances of the event occurring are 21.67 times greater when data is collected than when it is not collected. Data collection is critical, because it could be used to understand opportunities for improvement, and measure progress or change over time (Bell and Sangster 2023), although the environment in northern Australia creates a difficult condition to collect data. The environment, remote distances, large properties with low stocking rates and lack of connectivity are some examples that make the process of collecting data difficult. However, automating data recording could be a potential solution to the difficulty of collecting data on farms (Awasthi et al. 2024). Standardisation in data collection to conduct cross-sectional analysis and/or monitoring of factors that explain productivity in the northern Australia beef industry would assist (Chang et al. 2020).
| n | Nagelkerke R square | B | s.e. | Significance | Exp(B) | 95% CI for Exp(B) | |||
|---|---|---|---|---|---|---|---|---|---|
| Lower | Upper | ||||||||
| Seedstock prroducer | |||||||||
| Herd size | 43 | 0.12 | |||||||
| <200–499 | 0.23 | ||||||||
| 500–1499 | 1.90 | 1.12 | 0.09 | 6.67 | 0.73 | 60.52 | |||
| >1500 | 0.51 | 0.93 | 0.58 | 1.67 | 0.27 | 10.33 | |||
| Breeding system | 43 | 0.07 | |||||||
| Straight-breeding | 0.10 | ||||||||
| Mixture of both | −0.06 | 0.70 | 0.93 | 0.94 | 0.24 | 3.68 | |||
| Crossbreeding/composite | 20.45 | 2.32E + 04 | 0.99 | 7.60E + 08 | 0.00 | ||||
| Data collection | 43 | 0.07 | 1.43 | 0.98 | 0.14 | 4.20 | 0.61 | 28.92 | |
| Commercial producer | |||||||||
| Herd size | 54 | 0.04 | |||||||
| <200–499 | 0.47 | ||||||||
| 500–1499 | −0.49 | 0.73 | 0.51 | 0.61 | 0.15 | 2.58 | |||
| >1500 | 0.29 | 0.73 | 0.69 | 1.33 | 0.32 | 5.54 | |||
| Breeding system | 54 | 0.09 | 0.15 | ||||||
| Straight-breeding | 0.29 | ||||||||
| Mixture of both | 0.80 | 0.77 | 0.55 | 2.23 | 0.50 | 9.99 | |||
| Crossbreeding/composite | −0.45 | 0.75 | 0.15 | 0.64 | 0.15 | 2.77 | |||
| Data collection | 54 | 0.32 | 3.08 | 1.09 | 0.005* | 21.67 | 2.57 | 182.74 | |
*Level of significance: P < 0.05
Cattle producers’ preference
Participants were surveyed about preferences for recording phenotypic data. Relationships between selected traits and the adoption of genetic tools by the cattle producer group were analysed. For the seedstock producer group, 88.37% of participants reported that they recorded data. Associations were found between the adoption of genetic tools and on-farm recorded data, such as scrotal circumference (P = 0.031), birthweight (P = 0.002), weaning weight (P = 0.012) and 200/400/600-day weight (P < 0.001; Table 4). Of all seedstock cattle producers, 84.2%, 86.8% and 81.6% selected the traits scrotal circumference, weaning weight and 200/400/600-day weight, respectively, and >80% of them were considered an Adopter. However, only 42.1% selected birthweight, with 100% categorised as Adopters. This highlights how crucial it is to record calf birthweight and a possible barrier to adoption (Chang et al. 2020).
Furthermore, property management within and between different types of beef enterprises varies widely across northern Australia in terms of management structure and level of development (McCosker et al. 2020). Therefore, the development of prediction models or remote data recording could be an alternative to face this challenge (Chang et al. 2021; Moore et al. 2023).
The majority of commercial cattle producers (74.1%) indicated that they record traits on-farm, weaning weight (90.0%) and fertility traits (82.5%). Only the structure/conformation and appearance record showed a significant difference (P = 0.01) in commercial cattle producers’ adoption of genetic tools. Although 47.5% indicated that they registered these traits, most (84.2%) were classified as Adopters. This could suggest that from the commercial producer’s perspective, the appearance and structure of the animal are important, and could be supplemented by genetic information. Consistent with what was results reported by Martin-Collado et al. (2018), who claimed that cattle producers are likely to use simple strategies (e.g. visual features), consciously or unconsciously, to facilitate their choices in information-intensive decision-making.
| Variable, n (%) A | Overall | A | NA | P-value | |
|---|---|---|---|---|---|
| Seedstock producer | (n = 38) | (n = 28) | (n = 10) | ||
| Calving ease | 26 (68.4%) | 19 (73.1%) | 7 (26.9%) | 1.000 B | |
| Fertility/% calving/% weaning | 29 (76.3%) | 22 (75.9%) | 7 (24.1%) | 0.673 B | |
| Milk supply/udder development | 19 (50.0%) | 14 (73.7%) | 5 (26.3%) | 1.000 C | |
| Scrotal circumference | 32 (84.2%) | 26 (81.2%) | 6 (18.8%) | 0.031 B* | |
| Birthweight | 16 (42.1%) | 16 (100.0%) | 0 (0.0%) | 0.002 B* | |
| Weaning weight | 33 (86.8%) | 27 (81.8%) | 6 (18.2%) | 0.012 B* | |
| 200/400/600-day weight | 31 (81.6%) | 27 (87.1%) | 4 (12.9%) | <0.001 B* | |
| Sale weight | 24 (63.2%) | 18 (75.0%) | 6 (25.0%) | 1.000 B | |
| Weight gain/growth rates | 28 (73.7%) | 22 (78.6%) | 6 (21.4%) | 0.404 B | |
| Carcass weight | 15 (39.5%) | 13 (86.7%) | 2 (13.3%) | 0.259 B | |
| Structure/conformation/appearance | 24 (63.2%) | 16 (66.7%) | 8 (33.3%) | 0.268 B | |
| Temperament/docility/flight time | 25 (65.8%) | 17 (68.0%) | 8 (32.0%) | 0.441 B |
| Commercial producer | (n = 40) | (n = 25) | (n = 15) | ||
|---|---|---|---|---|---|
| Calving ease | 8 (20.0%) | 6 (75.0%) | 2 (25.0%) | 0.686 B | |
| Fertility/% calving/% weaning | 33 (82.5%) | 21 (63.6%) | 4 (57.1%) | 1.000 B | |
| Milk supply/udder development | 5 (12.5%) | 3 (60.0%) | 2 (40.0%) | 1.000 B | |
| Scrotal circumference | 28 (70.0%) | 17 (60.7%) | 11 (39.3%) | 1.000 B | |
| Birthweight | 8 (20.0%) | 6 (75.0%) | 2 (25.0%) | 0.686 B | |
| Weaning weight, | 36 (90.0%) | 24 (66.7%) | 12 (33.3%) | 0.139 B | |
| 200/400/600-day weight | 22 (55.0%) | 14 (63.6%) | 8 (36.4%) | 1.000 C | |
| Sale weight | 30 (75.0%) | 21 (70.0%) | 9 (30.0%) | 0.135 B | |
| Weight gain/growth rates | 29 (72.5%) | 18 (62.1%) | 11 (37.9%) | 1.000 B | |
| Carcass weight | 15 (37.5%) | 9 (60.0%0 | 16 (64.0%) | 1.000 C | |
| Structure/conformation/appearance | 19 (47.5%) | 16 (84.2%) | 3 (15.8%) | 0.010 C* | |
| Temperament/docility/flight time | 21 (52.5%) | 14 (66.7%) | 7 (33.3%) | 0.745 B |
A high association was found between the use of BREEDPLAN and the adoption of genetic tools for both seedstock and commercial cattle producers (Table 5). This result is expected, as the classification of participants between Adopters and Non-Adopters is related to the use of BREEDPLAN EBVs. However, an association was found between the use of economic selection indices (P = 0.006) and the use of genomics (P = 0.024) with the level of adoption among seedstock cattle producers. This is different from commercial cattle producers, where there was an association between the collection of their own data on the farm and the adoption of genetic tools (P = 0.010).
| Variable, n (%) A | Overall | A | NA | P-value | |
|---|---|---|---|---|---|
| Seedstock producer | (n = 43) | (n = 31) | (n = 12) | ||
| Use of EBVs (BREEDPLAN) | 31 (72.1%) | 28 (90.3%) | 2 (16.7%) | <0.001 B* | |
| Use of economic selection indices | 17 (39.5%) | 16 (94.1%) | 1 (5.9%) | 0.006 C* | |
| Crossbreeding | 7 (16.3%) | 6 (85.7%) | 1 (14.3%) | 0.412 B | |
| Multibreed evaluations (International Genetic Solutions) | 5 (11.6%) | 5 (16.7%) | 0 (0.0%) | 0.301 B | |
| Genomics | 31 (72.1%) | 25 (80.6%) | 6 (19.4%) | 0.024 B* | |
| Own data (collection traits data on the farm) | 32 (74.4%) | 22 (68.8%) | 10 (31.3%) | 1.000 B | |
| None of the above | 1 (2.3%) | 0 (0.0%) | 1 (100.0%) | 0.302 B |
| Commercial producer | (n = 54) | (n = 26) | (n = 28) | ||
|---|---|---|---|---|---|
| Use of EBVs (BREEDPLAN) | 35 (64.8%) | 22 (62.9%) | 13 (37.1%) | 0.004 C* | |
| Use of economic selection indices | 19 (35.2%0 | 12 (63.2%) | 7 (36.8%) | 0.155 C | |
| Crossbreeding | 34 (63.0%) | 19 (55.9%) | 15 (44.1%) | 0.167 C | |
| Multibreed evaluations (International Genetic Solutions) | 7 (13.0%) | 4 (57.1%) | 3 (42.9%) | 0.699 B | |
| Genomics | 16 (29.6%) | 11 (68.7%) | 5 (31.3%) | 0.0741 C** | |
| Own data (collection traits data on the farm) | 36 (66.7%) | 22 (61.1%) | 14 (38.9%) | 0.010 C* | |
| None of the above | 4 (7.4%) | 1 (25.0%) | 3 (75.0%) | 0.612 B |
A, Adopter; NA, Non-Adopter.
Although seedstock cattle producers reported more use of genomics than commercial cattle producers (72.1% vs 29.6%), commercial Adopter cattle producers also show a trend in the use of genomics (P = 0.0741). This trend of more widespread use of genomics among seedstock versus commercial is aligned with what was published by Sloane and Walker (2023). The advancement of genomics as a genetic tool could be the result of research and extension projects that have been implemented in northern Australia to develop novel methods of presenting genomic information and its practical implications for commercial herds (Hayes et al. 2022). It also means improved accuracy and allows for greater genetic progress (Banks 2022a), particularly for economic traits that often have low accuracy at the time of selection (Johnston et al. 2023). This is crucial, because low heritability in fertility traits, such as conception, pregnancy and weaning rates, which have had low selection intensity and longer generation intervals, have contributed to the low levels of recording of reproductive performance (Johnston et al. 2014).
Among the seedstock producer’s group, the main reason (83.3%) was that they saw the impact of using genetic tools on their herds, followed by understanding the genetic tool (66.7%; Table 6). The reasons for using genetic tools that are related to the level of adoption (Adopters and Non-Adopters) are that they understand the genetic tools (P = 0.009), that they are important for their business (P = 0.001) and have received advice on how to use them (P = 0.041). Although only 21.4% of seedstock cattle producers selected the reason that they received advice on how to use the genetic tool, all of them were Adopters. This could be an indication of the crucial and positive effect that extension activities and training systems have had in recent years in northern Australia (MLA 2022).
Within the commercial cattle producers group, the main reason for using genetic tools was that it is important for the business (69.4%, P = 0.005), followed by they saw the impact on their herd (63.3%) and understanding the genetics tool (59.2%, P = 0.004). As with seedstock cattle producers, understanding the genetics tool and the impact on their business is associated with the adoption of genetics tools (e.g. 85.4% and 69.9% of those who selected to have the genetics tool are adopters for seedstock and commercial cattle producers, respectively) (Table 6). Several authors have also highlighted that understanding genetic tools plays a fundamental role in the adoption process (Dill et al. 2015; Greenwood et al. 2018; Martin-Collado et al. 2021; Jakku et al. 2022; Sloane and Walker 2023). This could be explained by the fact that understanding genetic tools could reduce the gap between the producer’s decision-making competence and the complexity in the selection of breeding animals (Martin-Collado et al. 2018).
| Variable, n (%) A | Overall | A | NA | P-value | |
|---|---|---|---|---|---|
| Seedstock producer | (n = 42) | (n = 30) | (n = 12) | ||
| I understand the genetic tool | 28 (66.7%) | 24 (85.7%) | 4 (14.3%) | 0.009 B* | |
| It’s easy to use | 15 (35.7%) | 11 (73.3%) | 4 (26.7%0 | 1.000 B | |
| I can see the impact of using it in my herd | 35 (83.3%) | 25 (71.4%) | 10 (28.6%) | 1.000 B | |
| The cost:benefit ratio is appropriate | 14 (33.3%) | 11 (78.6) | 3 (21.4%) | 0.719 B | |
| It doesn’t demand much of my time | 6 (14.3%) | 4 (66.7%) | 2 (33.3%) | 1.000 B | |
| Other farmers are using genetic tools | 9 (21.4%0 | 8 (88.9%0 | 1 (11.1%) | 0.247 B | |
| It is important for the business | 27 (64.3%0 | 24 (88.9%) | 3 (11.1%) | 0.001 B* | |
| I have received advice on how to use it | 9 (21.4%) | 9 (100.0%) | 0 (0.0%) | 0.041 B* | |
| I have the facilitating conditions to use them | 16 (38.1%) | 13 (81.3%) | 3 (18.8%) | 0.316 B | |
| Others | 10 (23.8%) | 9 (90.0%) | 1 (10.0%0 | 0.233 B |
| Commercial producer | (n = 49) | (n = 25) | (n = 24) | ||
|---|---|---|---|---|---|
| I understand the genetic tool | 29 (59.2%) | 20 (69.0%) | 9 (31.0%) | 0.004 C* | |
| It’s easy to use | 23 (46.9%) | 12 (52.2%) | 11 (47.8%) | 1.000 C | |
| I can see the impact of using it in my herd | 31 (63.3%) | 18 (58.1%) | 13 (41.9%) | 0.244 C | |
| The cost:benefit ratio is appropriate | 24 (49.0%0 | 11 (45.8%) | 13 (54.2%0 | 0.572 C | |
| It doesn’t demand much of my time | 18 (36.7%) | 10 (55.6%) | −44.40% | 0.769 C | |
| Other farmers are using genetic tools | 5 (10.2%) | 2 (40.0%) | 3 (60.0%) | 0.667 B | |
| It is important for the business | 34 (69.4%) | 22 (64.7%) | 12 (35.3%) | 0.005 C* | |
| I have received advice on how to use it | 15 (30.6%) | 8 (53.3%) | 7 (46.7%) | 1.000 C | |
| I have the facilitating conditions to use them | 14 (28.6%) | 9 (64.3%) | 5 (35.7%) | 0.345 C |
Reasons for starting or continuing to use genetic information
To analyse the reasons for intention to change in decision-making, participants by group were asked about the level of agreement with six probable reasons. The level of agreement (5-Likert scale) of the reason for continuing to use or starting to use genetic tools with respect to increasing economic benefits showed a statistically different distribution with the level of adoption for seedstock (P = 0.021). No statistical differences were found in the distribution of the other reasons for both groups (Table 7). However, although Adopters (both groups) strongly agree with starting or continuing to use genetic tools if it increases economic benefit, for Non-Adopter commercial cattle producers, this would be more relevant than for Non-Adopter seedstock cattle producers. This could suggest the importance of the diffusion of genetic tools from an economic perspective to increase adoption levels.
| Strongly disagree | Somewhat disagree | Neither agree nor disagree | Somewhat agree | Strongly agree | Strongly disagree | Somewhat disagree | Neither agree nor disagree | Somewhat agree | Strongly agree | ||
|---|---|---|---|---|---|---|---|---|---|---|---|
| Seedstock producer | Commercial producer | ||||||||||
| Increase in economic profits (P = 0.021)* | Increase in economic profits (P = 0.0.865) | ||||||||||
| NA | 0.0% | 7.7% | 7.7% | 46.2% | 38.5% | 0.0% | 3.7% | 18.5% | 18.5% | 59.3% | |
| A | 0.0% | 3.4% | 0.0% | 13.8% | 82.8% | 3.8% | 0.0% | 0.0% | 42.4% | 53.8% | |
| Reduce age at first calving in heifers (P = 1.000) | Reduce age at first calving in heifers (P = 0.444) | ||||||||||
| NA | 0.0% | 15.4% | 23.1% | 30.8% | 30.8% | 3.7% | 14.8% | 25.9% | 33.4% | 22.2% | |
| A | 0.0% | 6.9% | 34.5% | 31.0% | 27.6% | 3.8% | 11.5% | 19.2% | 34.7% | 30.8% | |
| Increase animal health (P = 0.629) | Increase animal health (P = 0.867) | ||||||||||
| NA | 0.0% | 7.7% | 15.4% | 53.8% | 23.1% | 0.0% | 11.1% | 37.0% | 14.9% | 37.0% | |
| A | 3.4% | 6.9% | 34.5% | 24.1% | 31.0% | 0.0% | 7.7% | 34.6% | 34.6% | 23.1% | |
| Increase herd fertility (P = 0.167) | Increase herd fertility (P = 0.637) | ||||||||||
| NA | 0.0% | 0.0% | 7.7% | 53.8% | 38.5% | 0.0% | 3.7% | 11.1% | 25.9% | 59.3% | |
| A | 0.0% | 3.4% | 10.3% | 13.8% | 72.4% | 0.0% | 0.0% | 3.8% | 34.7% | 61.5% | |
| Crossbreeding (P = 0768) | Crossbreeding (P = 0.504 | ||||||||||
| NA | 0.0% | 0.0% | 53.8% | 30.8% | 15.4% | 3.7% | 7.4% | 25.9% | 22.3% | 40.7% | |
| A | 6.9% | 6.9% | 44.8% | 13.8% | 27.6% | 7.7% | 3.8% | 42.3% | 7.7% | 38.5% | |
| Marketing (P = 0.293) | Marketing (P = 0.780) | ||||||||||
| NA | 0.0% | 0.0% | 15.4% | 30.8% | 53.8% | 3.7% | 3.7% | 33.3% | 22.3% | 37.0% | |
| A | 3.4% | 0.0% | 0.0% | 24.1% | 72.4% | 7.7% | 3.8% | 26.9% | 30.8% | 30.8% | |
Independent samples Mann–Whitney U-test, level of significance: P < 0.05. The cells are coloured with colour intensity according to the values: from red (low), yellow (intermediate), to green (high).
A, Adopter; NA, Non-Adopter.
Increasing herd fertility would also seem to be a crucial reason for the adoption of genetic tools (Burns et al. 2010). Copley et al. (2024) reported that selection for fertility traits can be performed accurately regardless of environment due to the lack of convincing evidence of interaction between genotype and environment. In this study, 53.8% of Non-Adopter seedstock cattle producers stated that they were somewhat in agreement with starting to use genetic tools to increase fertility, and 72.4% strongly agreed to continue using them if they were able to increase fertility. In line with that, among commercial cattle producers, approximately 60% strongly agreed to continue using it and to start using it if it increases fertility in the herd. It is highlighted that commercial herd registration could also provide data that allow the herd to benchmark its performance. This is consistent with what was previously presented, where 76.3% and 82.4% of seed and commercial cattle producers recorded fertility data on the farm regardless of the degree of adoption (Table 4).
Marketing appears to be a more important reason for the adoption of genetic tools for seedstock cattle producers (strongly agreed by 72.4% and 53.8% of seedstock Adopters and Non-Adopters) when compared with commercial cattle producers (strongly agree by 30.8% and 37.0% of seedstock Adopters and Non-Adopters).
Research limitations and implications
The limitations of this research are the possible bias in the northern Australian beef cattle producers’ responses, as those who had the facilities to access an online instrument participated. The potential bias present in the survey responses could distort the results from reality and not accurately reflect it. Another limitation lies in the effect on the quality of responses of the survey instrument when it contains multiple options and information overload. Another limitation is that the collection of data from cattle producers through the survey does not consider the risk of bias associated with assuming that those surveyed know, understand and make decisions based on data from defined production objectives
This study has practical implications that could be used in the design of extension activities in northern Australia aimed at beef cattle producers and the adoption of genetic tools. Age should be considered, especially in commercial cattle producers who showed a negative effect of age on the adoption of genetic tools. Extension activities aimed at the young public (e.g. aged <40 years) would be a good medium-term strategy to increase the adoption of genetic tools, because the results show that younger people are more likely to adopt genetic tools among commercial cattle producers.
On-farm data recording appears to be a predictor of the likelihood of genetic tool adoption in commercial farming systems. Designing extension strategies that promote and train in data recording by demonstrating the real achievable benefits could have a positive impact on the adoption of genetic tools. Not surprisingly, cattle producers have expressed particular interest in growth and fertility traits, because they are key determinants of an enterprise’s economic performance. Finally, an understanding of genetic tools and the impact on the economic benefits of beef cattle enterprises by cattle producers, and the reasons for change in complex decision-making related to animal genetic improvement are fundamental in the process of developing extension strategies. Future research is needed to understand the training demands and delivery methods under northern Australian conditions.
Conclusions
This study aimed to investigate the demographic and productive variables that influence decision-making regarding the use of genetic tools, and identify the motivations, limitations and preferences of northern Australian beef cattle producers deciding to adopt. The results analysed by cattle producer group (seedstock and commercial) showed that there are differences between some factors, such as age and on-farm data collection, in the probability of adopting genetic tools. Gender, educational level, role in the enterprise and productive variables did not have an effect on the probability of adopting genetic tools. The results also show that economic motivations arise in both types of cattle producers, and the traits of the animals they prefer would be associated with it. These findings are important, because they provide new insights into possible extension strategies. Future research could be developed to determine the preferences regarding training and extension systems preferred by cattle producers. This research could be integrated with these findings to develop extension programs that aim to increase the adoption of genetic tools under the productive conditions of northern Australia.
Data availability
All data used in the current study are confidential. This research was approved by CQUniversity Australia Human Research Ethics Committee (approval number 24882).
Declaration of funding
This research received external funding from Meat and Livestock Australia (P.PSH.1186).
Author contributions
Conceptualisation: P.M., J.K.M., A.C. and D.L.S.; Methodology: P.M., J.K.M. and A.C.; formal analysis: P.M.; writing original draft preparation: P.M.; writing, review and editing: P.M., J.K.M., D.L.S. and A.C. All authors have read and agreed to the published version of the manuscript.
Acknowledgements
The authors express their acknowledgement to all the beef cattle producers of this study for their valuable time, enlightening perspectives and cooperative spirit to improve beef production in northern Australia. The authors also thank William Pinzon Perez of The Queensland Cyber Infrastructure Foundation for his assistance with the statistical analysis.
References
AGBU (2023) Animal genetics and breeding unit. Available at https://www.une.edu.au/research/research-centres-institutes/agbu-animal-genetics-and-breeding-unit [Retrieved September]
Agricultural Business Research Institute (2015) Barriers to adoption of genetic improvement technologies in northern Australia beef herds. B.NBP.0753 Final Report – Meat and Livestock Australia. Available at https://www.mla.com.au/contentassets/9a8bc22ebb634d089ce0af851db65bad/b.nbp.0753_final_report.pdf
Australian Bureau of Agricultural and Resource Economics and Sciences (2023) Farm data portal - beta. Available at https://www.agriculture.gov.au/abares/data/farm-data-portal [Retrived 15 May]
Banks R (2022b) Evolution of genetics organisations’ strategies through the implementation of genomic selection: learnings and prospects. Agriculture 12(10), 1524.
| Crossref | Google Scholar |
Bell AW (2019) Animal science down under: a history of research, development and extension in support of Australia’s livestock industries. Animal Production Science 60(2), 193-231.
| Crossref | Google Scholar |
Bell A, Sangster N (2023) Research, development and adoption for the north Australian beef cattle breeding industry: an analysis of needs and gaps. Animal Production Science 63(1), 1-40.
| Crossref | Google Scholar |
BREEDPLAN (2023) Accelerate genetic progress. Available at https://breedplan.une.edu.au/ [Retrieved September 2023]
Burns BM, Fordyce G, Holroyd RG (2010) A review of factors that impact on the capacity of beef cattle females to conceive, maintain a pregnancy and wean a calf–implications for reproductive efficiency in northern Australia. Animal Reproduction Science 122(1–2), 1-22.
| Crossref | Google Scholar | PubMed |
Campbell A, King AEH (2022) Choosing sustainability: decision making and sustainable practice adoption with examples from US great plains cattle grazing systems. Animals 12(3), 286.
| Crossref | Google Scholar | PubMed |
Chang AZ, Swain DL, Trotter MG (2020) Calf loss in northern Australia: a systematic review. The Rangeland Journal 42(1), 9-26.
| Crossref | Google Scholar |
Chang AZ, Imaz JA, Gonzalez LA (2021) Calf birth weight predicted remotely using automated in-paddock weighing technology. Animals 11(5), 1254.
| Crossref | Google Scholar |
Cole JB, VanRaden PM (2018) Symposium review: possibilities in an age of genomics: the future of selection indices. Journal of Dairy Science 101(4), 3686-3701.
| Crossref | Google Scholar | PubMed |
Copley JP, Hayes BJ, Ross EM, Speight S, Fordyce G, Wood BJ, Engle BN (2024) Investigating genotype by environment interaction for beef cattle fertility traits in commercial herds in northern Australia with multi-trait analysis. Genetics Selection Evolution 56(1), 70.
| Crossref | Google Scholar | PubMed |
Dill MD, Emvalomatis G, Saatkamp H, Rossi JA, Pereira GR, Barcellos JOJ (2015) Factors affecting adoption of economic management practices in beef cattle production in Rio Grande do Sul state, Brazil. Journal of Rural Studies 42, 21-28.
| Crossref | Google Scholar |
Gebre KT, Yfter KA, Teweldemedhn TG, Gebremariam T (2020) Participatory definition of trait preferences and breeding practices of goats in Aba’ala, Afar region: as input for designing genetic improvement program. Tropical Animal Health and Production 52(1), 41-52.
| Crossref | Google Scholar | PubMed |
Government of Western Australia (2021) The western Australian beef industry. Department of Primary Industries and Regional Development. Available at https://www.agric.wa.gov.au/export-services/western-australian-beef-industry?page=0%2C0#smartpaging_toc_p0_s0_h2 [Retrieved 15 May]
Greenwood PL, Gardner GE, Ferguson DM (2018) Current situation and future prospects for the Australian beef industry – a review. Asian-Australasian Journal of Animal Sciences 31(7), 992-1006.
| Crossref | Google Scholar | PubMed |
Griffith GR, Parnell PF, Clark RA, Timms J, Hyland PW, Mulholland C (2008) Paper 1: the cooperative research centre for beef genetic technologies and the “accelerated adoption through sustainable beef profit partnerships” project. Australian Farm Business Management Journal 5(1/2), 1-10 Available at https://search.informit.org/doi/10.3316/informit.202615911075687.
| Google Scholar |
Hayes B, Speight S, Ross E, Dodd E, Fordyce G (2022) Accelerating genetic gain for productivity and profitability in Northern beef cattle with genomic technologies. Final Report P.PSH.0833. Meat and Livestock Australia. Availabe at https://www.mla.com.au/research-and-development/reports/2023/P.PSH.0833-accelerating-genetic-gain-for-productivity-and-profitability-in-northern-beef-cattle-with-genomic-technologies-final-report/
Johnston DJ, Barwick SA, Fordyce G, Holroyd RG, Williams PJ, Corbet NJ, Grant T (2014) Genetics of early and lifetime annual reproductive performance in cows of two tropical beef genotypes in northern Australia. Animal Production Science 54(1), 1-15.
| Crossref | Google Scholar |
Johnston DJ, Grantt TP, Schatz TJ, Burns BM, Fordyce G, Lyons RE (2017) The Repronomics project–enabling genetic improvement in reproduction in Northern Australia. Proceedings of the Association for the Advancement of Animal Breeding and Genetics 22, 385-388.
| Google Scholar |
Johnston DJ, Ferdosi MH, Connors NK, Boerner V, Cook J, Girard CJ, Swan AA, Tier B (2018) Implementation of single-step genomic BREEDPLAN evaluations in Australian beef cattle. Proceedings of the World Congress on Genetics Applied to Livestock Production 11, 269.
| Google Scholar |
Johnston DJ, Ferdosi MH, Connors NK, Cook J, Girard C, Swan A (2023) BREEDPLAN single-step genomic evaluations deliver increased accuracies across all breeds and EBVs. Association for the Advancement of Animal Breeding and Genetics 25, 111-114.
| Google Scholar |
Martin-Collado D, Byrne TJ, Diaz C, Amer PR (2018) Complexity of animal breeding choice making. Journal of Animal Breeding and Genetics 135(6), 395-409.
| Crossref | Google Scholar |
Martin-Collado D, Díaz C, Benito-Ruiz G, Ondé D, Rubio A, Byrne TJ (2021) Measuring farmers’ attitude towards breeding tools: the livestock breeding attitude scale. Animal 15(2), 100062.
| Crossref | Google Scholar |
McCosker KD, Jephcott S, Burns BM, Smith DR, Fordyce G, O’Rourke PK, McGowan MR (2020) Reproductive performance of northern Australia beef herds. 1. Survey of nutritional, breeding and herd health management practices and of the environment. Animal Production Science 63(4), 301-310.
| Crossref | Google Scholar |
Menchon P, Manning JK, Swain DL, Cosby A (2024) Exploration of extension research to promote genetic improvement in cattle production: systematic review. Animals 14(2), 231.
| Crossref | Google Scholar | PubMed |
Menchon P, Manning JK, Swain DL, Cosby A (2025) Exploring adoption factors, preferences to the use of beef genetic tools in Northern Australia. Association for the Advancement of Animal Breeding and Genetics 26, 447-450.
| Google Scholar |
Miller S (2022) Genomic selection in beef cattle creates additional opportunities for embryo technologies to meet industry needs. Reproduction, Fertility and Development 35(2), 98-105.
| Crossref | Google Scholar | PubMed |
Miller SP (2023) Livestock breeding, where have we been and what lies ahead? Association for the Advancement of Animal Breeding and Genetics 25, 10-22.
| Google Scholar |
MLA (2022) Producer adoption outcomes report: 2021–2022. Meat and Livestock Australia. Available at https://www.mla.com.au/globalassets/mla-corporate/research-and-development/documents/mla-adoption-outcomes-report-2021-2022-web.pdf
Montes de Oca Munguia O, Llewellyn R (2020) The adopters versus the technology: which matters more when predicting or explaining adoption? Applied Economic Perspectives and Policy 42(1), 80-91.
| Crossref | Google Scholar |
Moore KL, Girard CJ, Grant TP, Johnston DJ (2019) Increases in accuracy of female reproduction genetic evaluations for beef breeds in northern Australia. Association for the Advancement of Animal Breeding and Genetics 23, 366-369.
| Google Scholar |
Moore KL, Johnston DJ, Grant TP (2023) An investigation into potential genetic predictors of birth weight in tropically adapted beef cattle in northern Australia. Animal Production Science 63(11), 1105-1112.
| Crossref | Google Scholar |
Mueller ML, Van Eenennaam AL (2022) Synergistic power of genomic selection, assisted reproductive technologies, and gene editing to drive genetic improvement of cattle. CABI Agriculture and Bioscience 3(1), 13.
| Crossref | Google Scholar |
Nettle R, Major J, Turner L, Harris J (2022) Selecting methods of agricultural extension to support diverse adoption pathways: a review and case studies. Animal Production Science 64, AN22329.
| Crossref | Google Scholar |
Qualtrics (2024) Qualtrics survey software. Available at https://www.qualtrics.com [accessed April 2024]
Quddus A (2022) Dissemination of technological innovations of livestock in bangladesh: adoption levels and behavioral precision. Proceedings of the National Academy of Sciences 92(2), 461-472.
| Crossref | Google Scholar |
Reverter A, Porto-Neto LR, Fortes MRS, McCulloch R, Lyons RE, Moore S, Nicol D, Henshall J, Lehnert SA (2016) Genomic analyses of tropical beef cattle fertility based on genotyping pools of Brahman cows with unknown pedigree. Journal of Animal Science 94, 4096-4108.
| Crossref | Google Scholar |
Sitienei I, Gillespie J, Scaglia G (2018) Adoption of management practices and breed types by US grass-fed beef producers. The Professional Animal Scientist 34(6), 571-580.
| Crossref | Google Scholar |
Sloane B, Walker L (2023) MLA genetics insights. Finall Report L.GEN.2205. Meat and Livestock Australia. Available at https://www.mla.com.au/contentassets/f0758d90686b48eca21cebbfd2d03000/.gen.2205---genetics-insights-final-report-public.pdfl