

In-crop fertiliser application improved nitrogen recovery in irrigated cotton: a multi-year field study with 15N-labelled urea
Jonathan Baird A * , Graeme Schwenke B , Greg C C , Ben Macdonald D and Helen Suter A
A
B
C
D
Handling Editor: Victor Sadras
Abstract
Plant recovery of nitrogen (N) fertiliser applied to alkaline soils for irrigated cotton ranges from 20% to 50%. Aligning the application timing to synchronise N availability with plant requirements should lead to greater crop yield and N use efficiency (NUE).
Identify the fate of N fertiliser when applied either pre-sow or in-crop to an irrigated cotton system.
Field investigations were conducted using isotope-labelled N fertiliser (15N-urea), applied either pre-sow (100:0) or in-crop (0:100). Sampling during the crop growth identified the fate of N fertiliser, both within the soil profile and within the plant.
Applying N in-crop (0:100) improved N fertiliser recovery by 10% as measured at plant maturity, compared with when N fertiliser was applied pre-sow (100:0). Most of the additional N was recovered in the cotton seed. The period of greatest loss for the 0:100 treatment (45%) occurred between N fertiliser application and first square. Irrigation water mobilised the fertiliser-derived N laterally through the planting hill, with N fertiliser being recovered between the application point and the non-irrigated furrow. In contrast, the 0:100 treatment had a more uniform distribution of N throughout the planting hill. Inherent soil N (non-15N) supplied 60–75% of plant N than did the applied N fertiliser.
Applying N fertiliser in-crop gave greater fertiliser N use efficiency and recovery, reducing N loss to the environment.
The synchronising of N fertiliser delivery with cotton uptake improved efficiency, allowing for reduced application rates while maintaining high yields.
Keywords: Australia, fertiliser application timing, furrow irrigation, nitrogen leaching, nitrogen loss, nitrogen use efficiency, plant nitrogen use, soil nitrogen.
Introduction
The application of nitrogen (N) fertiliser and irrigation water to cotton systems provides an ideal environment for high productivity. Unfortunately, the combination of irrigating frequently, i.e. saturating the soil multiple times, and high N fertiliser rates provides an environment that can exacerbate N loss pathways, particularly when N fertiliser rates exceed plant requirements or are applied when plants do not require large amounts of N.
Soil-applied N fertiliser predominantly cycles to nitrate-N in typical cotton growing soils. The majority of cotton growing soils in Australia are alkaline grey Vertosols, containing 60% clay, 20% sand and 20% silt (Isbell 2021). When the alkaline soils become enriched with nitrate-N, there is the potential for high gaseous emissions via denitrification. Rochester (2003) estimated that 50–60% of applied N fertiliser was lost from Australian irrigated cotton systems, primarily owing to denitrification and lateral leaching. A field-based lysimeter study by Macdonald et al. (2017) using 15N-labelled urea, found that vertical subsoil leaching was minor in cotton soils from a singular season of N fertiliser (<1%), but atmospheric losses were the greatest N loss process from a cotton system (approximately 35% of applied N). The emissions were greatest at the start of the season when plant use of N is low (<1 kg/ha.day) and coincided with the first irrigation event after applying N fertiliser. Antille (2018) found that the maximum flux of N gas emissions (including N2, N2O and NO) occurred within 5 days after N fertiliser application or after an irrigation event. When in-crop applications of N fertiliser occur later in the season, N2O emissions spiked again, but were substantially lower than the first flux (Grace et al. 2016).
Fertiliser loss owing to field run-off followed a pattern similar to gaseous emissions. The majority of N loss from the field within the tail water occurred at the first irrigation event of the season or the first irrigation after applying N fertiliser (Macdonald et al. 2017). Over the course of the season, which included seven irrigations, 24 kg N/ha or 11% of the applied N fertiliser was collected from the field run-off tail water. An implication for the Australian cotton industry is that N fertiliser is predominantly applied pre-sow, either the total amount for the season or the majority (Sparks 2019). The high proportion of pre-sow fertilisation was driven by historical research (Constable and Rochester 1988). The research was conducted prior to modern high-yielding transgenic varieties, where N requirements have increased to over 300 kg N/ha (Baird et al. 2024).
Improving crop utilisation and recovery of applied fertiliser can help reduce N fertiliser loss from a cotton system. In Australian cropping systems, the recovery rate of applied N fertiliser varies between 6% and 59% (Chen et al. 2008). A search of published cotton crop experiments found that 15N fertiliser recovery ranged from 47% to 80% (Table 1). In these studies, recovered N fertiliser in plant matter ranged from 20% to 54%, whereas the proportion of N fertiliser recovered in the soil was between 21% and 46%. The large range can be attributed to various factors, including N fertiliser application rate (Rochester et al. 2001), N application timing and method (Constable et al. 1992), legacy of cropping rotations (Rochester et al. 1997), and soil fertility (Rochester 2011).
| Reference | Labelled 15N form (atom% 15N) | N fertiliser rate (kg N/ha) | N fertiliser timing | Plant N-fertiliser recovery (%) | Plant Ndff (%) | Soil N fertiliser recovery (%) | Unaccounted for N fertiliser (%) | |
|---|---|---|---|---|---|---|---|---|
| Rochester et al. (1993) | Urea (5%) | 125 | Pre-sow | 28 | 32 | 28.4 | 32 | |
| Freney and Hearn (1991) | Urea (5%) | 50 | Pre-sow | 26 | 21 | 53 | ||
| Macdonald et al. (2017) | Urea (8%) | 180 | Pre-sow | 37 | 17 | 34 | 29 | |
| Scheer et al. (2023) | Urea (10%) | 87–207 | Grower practice | 25 ± 3 | 17 | 28 ± 4 | 47 ± 5 | |
| Karlen et al. (1996) | Ammonium nitrate (5%) | 84 | 33% pre-sow/66% in-crop | 20.5 | 21.7 | 57.8 | ||
| Craig (2002) | Ammonium nitrate (5%) | 112 | Pre-sow | 43 ± 1 | 48 ± 5 | |||
| Fritschi et al. (2004) | Urea (10%) | 168 | In-crop | 54 ± 5 | 38 ± 4 | 8 | ||
| Silvertooth et al. (2001) | Ammonium sulfate (5%) | 168 | In-crop | 34 ± 2 | 46 ± 3 | 20 ± 5 | ||
| Mean | 33.4 ± 2.9 | 28.5 ± 6.6 | 31.0 ± 2.6 | 35.3 ± 5.3 |
Ndff is the plant N derived from fertiliser. Mean and standard error (s.e.) were determined for all values given by the authors.
On average, 35.3% of applied N fertiliser was lost or unaccounted for from these experiments. Greater knowledge of N fertiliser movement and availability during the season is required (Rochester et al. 1992). Currently, assumptions are used to describe the movement and availability of N fertiliser once applied into the soil, because N fertiliser may move vertically or laterally with irrigation water and rainfall, or be utilised by growing plants.
Since recent research has shown that the majority of N fertiliser loss occurs early in the cotton season, the hypothesis of this paper is that N fertiliser applied in-crop will have better recovery than N fertiliser applied pre-sow. In addition, in-crop applied N fertiliser should remain more concentrated at the application point within the planting hill for longer during the season compared to N fertiliser applied pre-sow.
Materials and methods
Two field experiments were conducted at Myall Vale, New South Wales (Australia) in 2018–19 (Experiment 1) and 2020–21 (Experiment 2). The experiments were planted in a typical flood furrow irrigation system, with cotton planted on hills every 1 m, and water being applied to every alternate furrow. Transgenic cotton cultivar Sicot 748BRF, containing Helicoverpa proteins and glyphosate herbicide tolerance, was grown in both seasons. Treatments were field length (210 m) and 4 m wide. The N timing ratios were replicated four times, with plant harvest and soil sampling occurring in the centre rows of the plots.
N fertiliser application treatments
The study contained two timings of N fertiliser application, namely, 100% pre-sow (100:0) and 100% in-crop (0:100). Treatment 100:0 was sampled four times in both years, whereas the 0:100 N fertiliser timing treatment was sampled only once in Experiment 1, and four times in Experiment 2. Both treatments were applied using urea enriched with the stable isotope 15N. The background atom 15N% was measured from the control treatment containing non-labelled fertiliser. Micro-plots (4.5 m length) for the isotope labelled urea were incorporated into the larger field-length plots described above. The budgeted N supply (soil mineral N + N fertiliser) for experiments was 200 kg N/ha, just below the researched ideal rate of 225 ± 25 kg N/ha (Rochester 2011). The lower application rate was used to increase the probability of fertiliser treatment response. The N fertiliser application rates were 155 kg N/ha in Experiment 1 and 152 kg N/ha in Experiment 2. The application rate varied to account for mineral N (down to 900 mm depth) recovered in the winter, prior to the growing season (Experiment 1 = 45 kg N/ha; and Experiment 2 = 48 kg N/ha).
The 15N stable isotope was dissolved in reverse osmosis-purified water and mixed with laboratory urea (CO(NH2)2) to a final atom enrichment of 7.1 atom%. The 15N-labelled N fertiliser solution was applied using an automatic pipette, with aliquots of 2 mL every 20 mm along the fertiliser line. The fertiliser line was situated in the centre of the 1 m plant hill at a depth of 250–300 mm for the 100:0 treatment, and 200 mm deep and 150 mm to the irrigated-furrow-side of the plant line for the 0:100 treatment. The two application methods and placement were identical to the application of the corresponding urea fertiliser by commercial crop machinery to the remainder of the field experiment.
The micro-plots were unconfined with no physical barrier, allowing a true representation of the irrigation water effect on the fate of N fertiliser. A 250 mm buffer was applied with the enriched urea solution at each end of the micro-plots to minimise edge effects.
In-crop sampling
Plant and soil sampling was conducted multiple times during the growing season to investigate the plant growth response to the N fertiliser treatments. Sampling occurred at the following four key growth stages: first square, early bolls, cut out and maturity (Fig. 1).
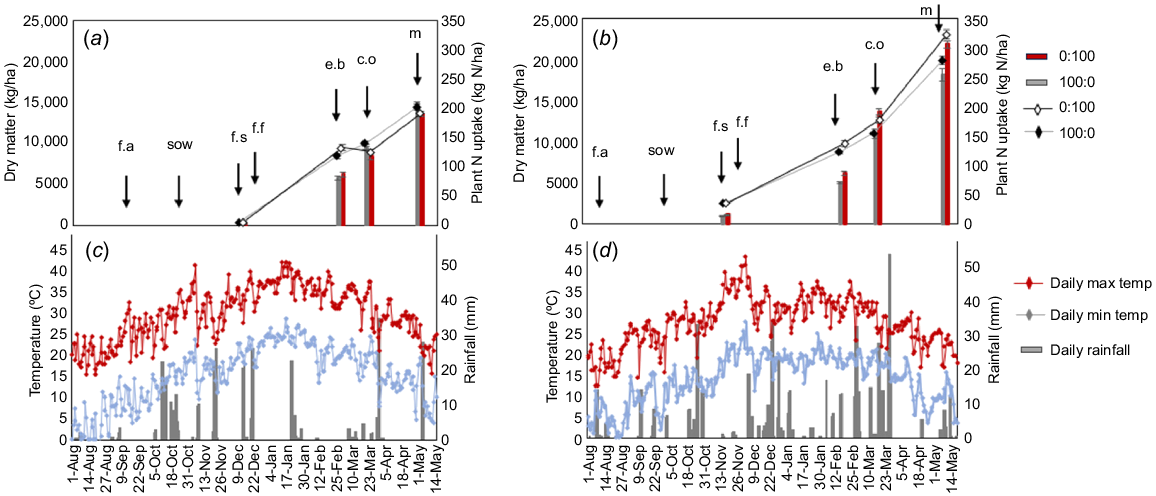
Plant productivity when N fertiliser was applied pre-sow (100:0) or in-crop (100:0), and corresponding weather observations for Experiments 1 and 2. Plant dry matter production (100:0 is grey column, 0:100 is red column) and N uptake (100:0 is grey line and black marker, 0:100 is black line with white marker) at the four harvesting dates for (a) Experiment 1 and (b) Experiment 2. Error bars signify standard errors of four means: f.a, the date of fertiliser application for the 100:0 treatment; sow, sowing date; f.s, the first square stage (and the application date for the 0:100) treatment; f.f, the first flower; e.b early bolls; c.o, plant cut-out; and m, plant maturity. Daily weather observations include maximum temperature (red line), minimum temperature (blue line) and rainfall (grey column) for (c) Experiment 1 and (d) Experiment 2.
At each growth stage, three whole plants were harvested from the micro-plots. The plants were partitioned into stem/petioles, leaf, and fruiting matter (square, flowers and bolls – lint and seed). Plant components (not lint) were dehydrated at 60°C until dry, weighed and then milled to pass through a 0.5 mm sieve. Plant matter containing lint fibre was ginned using a saw tooth gin (Continental Eagle, Pratteville, AL, USA). Ginning is the process where the seed is separated from the lint fibre. Once ginned, the seed was de-linted using dilute sulfuric acid. The cotton seed was washed with distilled water, dried at 60°C and milled. The milled plant matter was subsampled and weighed into 8 mm tin cups for N analysis by the Dumas combustion method (EA1112, ThermoFinnigan, San Jose, CA, USA) and atom %15N by an ANCA GSL elemental analyser was paired to an isotope ratio mass spectrometry (Sercon IRMS Hydra 20-20, Crewe, UK). Plant N uptake was calculated by multiplying dry matter by the N% of individual plant components. Plant roots were not excavated because of the high clay content of the soil, instead root matter was captured in the soil sampling detailed below.
Coinciding with plant harvests, soil coring to a depth of 900 mm and 75 mm diameter occurred at the four sampling dates. Nine soil cores were arranged in a zigzag pattern across the 1 m planting hill spaced every 40 mm. Cores were segmented by depth (0–150 mm, 150–300 mm, 300–600 mm, and 600–900 mm). The soil was dried at 35°C for 3–4 days, subsampled, milled to <0.5 mm and weighed into 10 mm tin foil cups for analysis of total N concentration and %15N, as described for the plant material.
The recovered amount of N fertiliser at each growth stage for both plant and soil during the experiments was calculated using methods outlined by (Zapata 1990).
The proportion of 15N fertiliser recovered for each sample was calculated as follows:
where sample N is the N uptake of the plant (kg N/ha) or soil (mg N/kg), dw is sample mass for plant (kg/ha) or soil (kg/m3), %15Na.e. (atom percentage excess) = sample %15N – natural abundance %15N, Nfert rate is the applied N fertiliser rate (kg N/ha) and %15Nfert is the 15N atom% enrichment of the applied N fertiliser.
The proportion of soil recovered 15N was calculated for each soil depth (down to 900 mm depth) at each core location within the plot. To determine the amount of N between the removed cores, the authors calculated the mean of the neighbouring cores:
where p1 is the c15N of position one and p2 is the c15N of the neighbouring position. This was replicated for each partition between removed cores across the 1 m planting hill.
Statistical analysis
ANOVA was conducted in the R program (R Core Team 2021). Data distribution and heterogeneity of comparisons were analysed, before using the Tukey least significance difference test at the probability of 0.05 to determine the difference between treatment means. Graphical figures were produced using the ggplot2 package (Wickham 2016).
Results
Weather observations
Ambient temperatures and rainfall varied between the two experiments (Fig. 1). Experiment 1 (2018–19) received 67 days with a daily maximum over 40°C and 335 mm of rainfall between sowing and harvest. Experiment 2 (2020–21) had 32 days over 40°C and received 613 mm of rainfall during the growing season. The high ambient temperatures in Experiment 1 affected plant growth, resulting in earlier crop maturity and a shorter seasonal length (days between sowing and maturity) than in Experiment 2.
Cotton productivity
There was a productivity difference between the two experimental years, with the harsher conditions of Experiment 1 resulting in a mean lint yield of 2875 kg/ha, which was 1818 kg/ha lower than the mean lint yield of Experiment 2. Shoot harvesting during the season at key growth stages illustrated the variance in dry matter and N uptake over the two experiments (Fig. 1). Dry matter exceeded 22 Mg/ha in Experiment 2, 8 Mg/ha higher than in Experiment 1.
The study found an N fertiliser timing treatment difference in Experiment 2 because the 0:100 treatment produced 3 Mg/ha more dry matter than did the 100:0 timing treatment, absorbing 47 kg N/ha more N.
N fertiliser recovery
The in-crop application of N fertiliser (0:100) resulted in the highest recovery of N fertiliser, with 86% at crop maturity, 10% more than the pre-sow treatment (100:0) (P < 0.05). Of the recovered fertiliser, 73% was found in the plant top, which is equal to 43% of the applied N fertiliser. The recovered N fertiliser within the soil (and belowground plant roots) accounted for 15% of applied fertiliser. The unaccounted N fertiliser is assumed to be lost from the system, with the 100:0 treatment losing 39% (60 kg N/ha), and the 0:100 losing 28.5% or 44 kg N/ha.
The highest recovery of 15N in the soil occurred at the first square stage for the 100:0 treatment (49% or 75.6 kg N/ha) and early bolls for the 0:100 treatment (43%). Both growth stages were the first sampling date after the application of the N fertiliser. As the season continued, 15N fertiliser recovered in the soil decreased by 46.1 kg N/ha at the secondary sampling date in the 100:0 treatment. The amount of 15N recovered in the soil then reached a plateau until the end of season.
N fertiliser recovered in various plant components
Leaves accumulated the most N fertiliser at the first square (9 kg N/ha) and early bolls (24 kg N/ha) stages. The maturing fruit and seed become the strongest N sink between cut-out and plant maturity, accumulating 50 kg N/ha.
The vegetative matter (stem and leaf) peaked at the early boll stage, with 47.9 kg N/ha for the 100:0 treatment, decreasing to 24.7 kg N/ha by maturity. The reduction was due to N remobilised from vegetative to reproductive matter (fruit and seed). The reproductive matter increased by 30.6 kg N/ha during this period.
Seasonal movement of applied N fertiliser
The primary movement of fertiliser when applied pre-sow (0:100) was vertical, because recovered soil N fertiliser was greatest in the 0–150 mm soil depth in the plant line core (directly above fertiliser placement), with 32.5 kg N/ha of the 155 kg N/ha applied recovered at the first square stage (Fig. 2). The secondary movement of the applied N was laterally towards the non-irrigated furrow, where recovered fertiliser ranged between 5 and 20 kg N/ha. Minimal (<0.5 kg N/ha) N fertiliser was found on the irrigated furrow side. This illustrates that once the irrigation water was enriched with the N fertiliser, the force of the irrigation absorption into the planting hill pushed the highly soluble fertiliser-derived N towards the drier non-irrigated side of the plant hill.
Presence of pre-sow (100:0) or in-crop (0:100) 15N-labelled N fertiliser in a transect of the planting hill measured at four dates during Experiment 1 (2018–19). The black dots represent the original location of the applied N fertiliser within the plant hill.
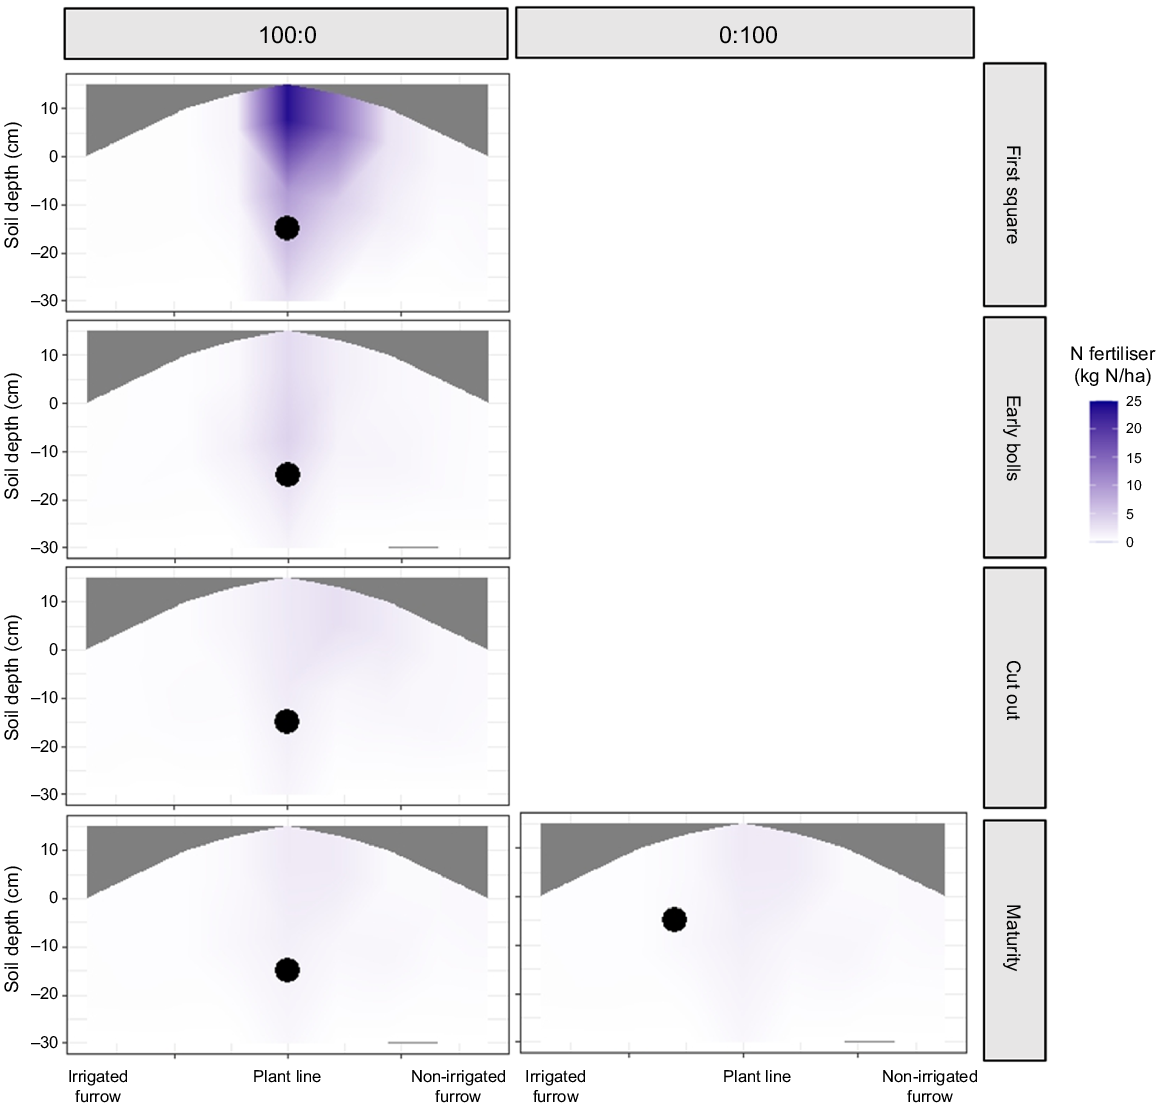
Subsequent soil sampling recovered less fertiliser (P < 0.001), with more dispersion of N fertiliser across the non-irrigated furrow. Still, nil to very low amounts of N fertiliser were recovered on the irrigated side (Figs 2, 3).
Presence of pre-sow (100:0) or in-crop (0:100) 15N-labelled N fertiliser in a transect of the planting hill measured at four dates during Experiment 2 (2019–20). The black dots represent the original location of the applied N fertiliser within the plant hill.
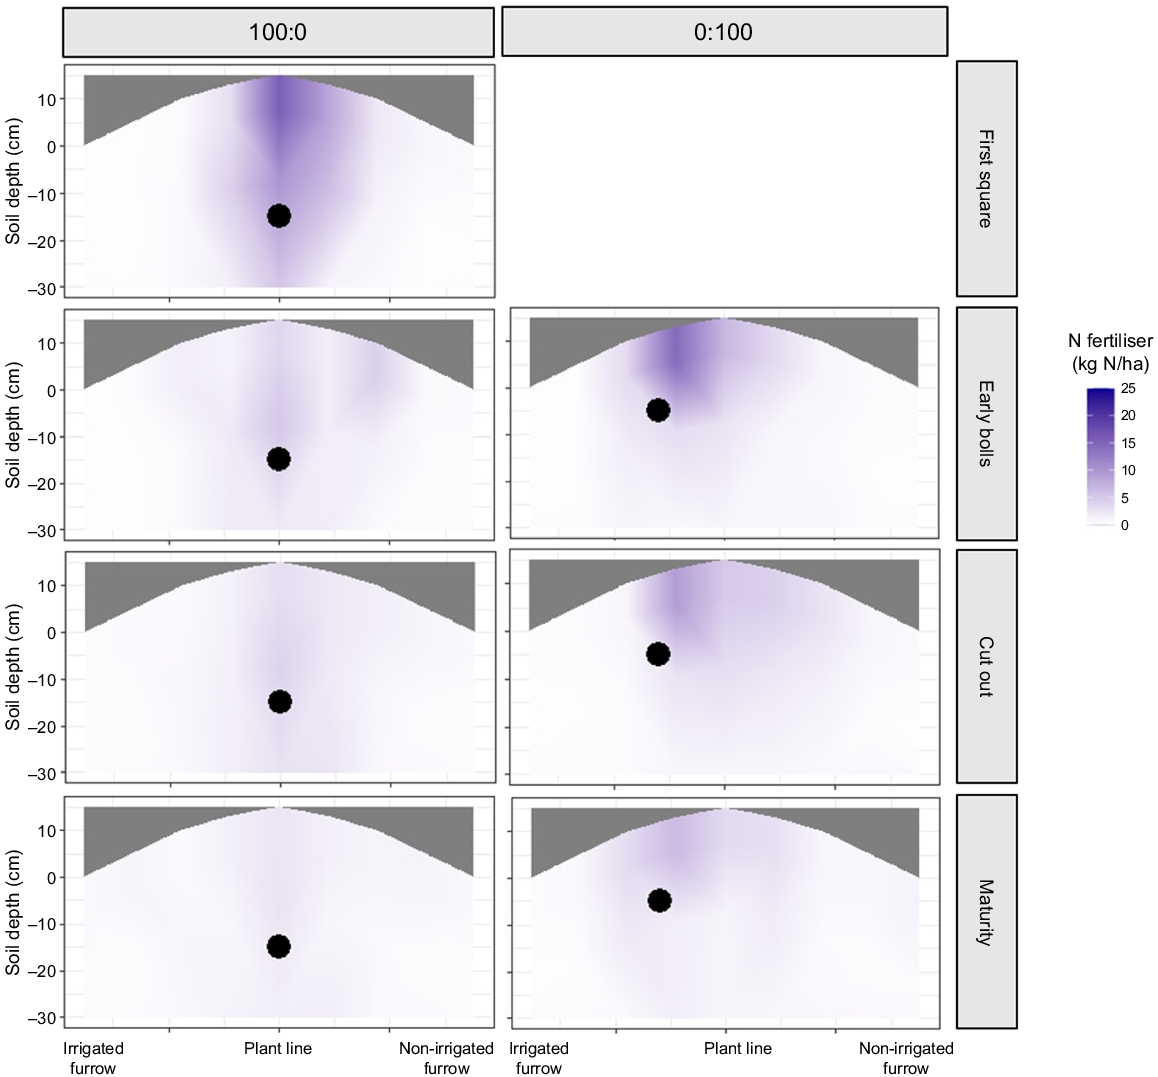
In Experiment 2, the 0:100 treatment was sampled at three stages rather than four, because it was applied only at the first square sampling time. At the first sampling (early bolls), the highest amount of N fertiliser was found in the core taken from the irrigated side of the plant hill, with 18.9 kg N/ha. The recovered N fertiliser declined laterally towards the non-irrigated furrow. Sampling later in the growing season found less N fertiliser, with 40.7 and 35.1 kg N/ha at cut out and maturity respectively. Similar to the 100:0 treatment, the soil N fertiliser recovery was influenced by the planting hill fertiliser application point and irrigation, but N fertiliser was dispersed more evenly in the 0:100 than the 100:0 at maturity.
Discussion
Improving N fertiliser recovery in a cotton system
The study illustrated the benefits of aligning N fertiliser application with crop utilisation requirements in an irrigated cotton system. A review of previous studies containing enriched 15N recovery found that, on average, cotton crops recovered 64% of the applied fertiliser (Table 1). This study found that the application of N fertiliser in-crop (0:100) recovered 72% of the applied fertiliser at plant maturity, an improvement of 11% compared with the application pre-sow (100:0).
Generally, due to the large volume of applied water, flood irrigation is typically less efficient in regard to N and water use than are other irrigation systems such as overhead sprinklers or drip (Bronson et al. 2017). By implementing the ideal timing treatment of 0:100, the reduced fertiliser loss in our study was comparable to the loss reported from an overhead sprinkler system (Scheer et al. 2023). Furthermore, the improvement in fertiliser recovery was similar to the levels reported in a rain-fed cereal cropping system (Harper et al. 1987), which is considered more efficient than an irrigated cropping system (Chen et al. 2008).
The total captured N fertiliser at maturity (plant and soil) ranged between 46% and 86% of that applied. The mean of 68.5% recovered N fertiliser is similar to that in Macdonald et al. (2017) and Silvertooth et al. (2001). The total recovery was made up of 36.7% of the N fertiliser recovered in plant matter and 31.8% in soil (Table 2). This means that 31.5% of applied N fertiliser was lost from the application zone (1 m transect) as gas emissions or leached laterally into the furrow and out of the field within the irrigation water.
| Experiment and treatment | Sampling stage | Recovered N fertiliser (%) | Recovered N fertiliser | Plant Ndff | ||||||
|---|---|---|---|---|---|---|---|---|---|---|
| Stem | Leaf | Fruit (exc. seed) | Seed | Whole plant | Soil | (%) | (%) | |||
| Experiment 1 | ||||||||||
| 100:0 | First square | 0.6 | 1.7 | 0.3 | 2.6 | 55.4 | 58 | 69 | ||
| Early bolls | 7.7 | 21.2 | 6.5 | 35.4 | 16.1 | 51 | 46 | |||
| Cut out | 5.5 | 17.4 | 12.2 | 3.5 | 38.6 | 15.6 | 54 | 42 | ||
| Maturity | 3.7 | 10.2 | 3.6 | 17.6 | 35.1 | 11.7 | 47 | 27 | ||
| 0:100 | Maturity | 5.2 | 12.1 | 6.4 | 22.6 | 46.3 | 11.4 | 58 | 40 | |
| Treatment probability | 0.032 | 0.024 | 0.006 | 0.004 | 0.038 | 0.003 | ||||
| Experiment 2 | ||||||||||
| 100:0 | First square | 2.8 | 6.0 | 0.8 | 9.6 | 42.1 | 52 | 43 | ||
| Early bolls | 9.0 | 23.5 | 4.3 | 36.8 | 22.0 | 59 | 40 | |||
| Cut out | 6.4 | 15.4 | 11.0 | 6.4 | 39.2 | 20.4 | 60 | 34 | ||
| Maturity | 10.0 | 7.9 | 14.2 | 27.7 | 59.8 | 16.1 | 76 | 27 | ||
| 0:100 | First square | |||||||||
| Early bolls | 5.0 | 7.7 | 7.6 | 20.3 | 29.8 | 50 | 22 | |||
| Cut out | 6.1 | 14.5 | 7.6 | 5.7 | 33.9 | 26.3 | 60 | 25 | ||
| Maturity | 5.1 | 6.9 | 14.5 | 37.0 | 63.4 | 22.6 | 86 | 26 | ||
| Treatment probability | 0.036 | 0.017 | 0.011 | 0.009 | ||||||
| Treatment × sampling date probability | 0.006 | 0.008 | 0.033 | 0.008 | 0.029 | 0.034 | 0.007 | 0.007 | ||
Experiment 1 was conducted in 2018–19 and Experiment 2 was conducted in 2020–21. Treatment means were tested with ANOVA and differences determined by Tukey least significance difference test.
The impact of timing of N fertiliser on plant N fertiliser use
Nitrogen fertiliser uptake early in the season (prior to peak fruit) was dominated by the uptake into the leaves, accounting for the greatest N uptake (32.9 of the 155 kg fertiliser N/ha). The developing leaves were the strongest N ‘sink’, ranging between 42% and 60% of whole plant fertiliser uptake. As leaves mature, they switch from being an N sink to becoming an N source for developing meristem tissue in the plants. This occurs as rubisco degrades down to amino acids and proteins. Transporter cells move the organic-N through phloem vessels to meristem matter with high N demand (Masclaux-Daubresse et al. 2010). Between the growth stages of early bolls and cut-out, the rate of N fertiliser uptake by vegetative matter slowed, and the plant remobilised N from the older leaf matter to the reproductive meristems (Hearn and Constable 1984). On average, N fertiliser uptake into leaves was reduced by 45% between cut-out and maturity, while at the same time, seed N uptake increased fivefold.
Applying the N fertiliser prior to sowing (100:0) resulted in higher N fertiliser availability early in the season. The higher application levels of available N fertiliser led to 9% more uptake of N fertiliser at early bolls stage than with applying the fertiliser in-crop (0:100). Nitrogen fertiliser applied pre-sow (100:0) led to more N fertiliser in the stem and leaf matter than did the 0:100 treatment. Conversely, the study found that applying N fertiliser in-crop (0:100) increased the uptake of N fertiliser in the maturing cotton seed compared with applying the N fertiliser pre-sow (100:0). Of the N fertiliser recovered by the plant, seed uptake ranged between 45% and 49% for the 0:100 treatment, compared with 29–37% for the 100:0 treatment. These results suggest that applying N fertiliser in-crop improved the utilisation of N fertiliser, especially by the reproductive matter. The application of in-crop N fertiliser also increased soil-recovered N fertiliser later in the growing season. By better synchronising soil N availability with plant N requirements, growers may reduce overall N fertiliser application rates and still provide sufficient available N for plant use.
Irrigation influence on N fertiliser fate and dispersion within the soil profile
Soil coring at the first square stage recovered an average of 54.5% of the applied N fertiliser. The period between the application of pre-sow fertiliser and the first square stage accounted for the greatest loss of fertiliser-derived N (42%). After the first square sampling, recovery of N fertiliser in the soil remained constant for both the pre-sow and in-crop application timings. The fertiliser-derived N becomes immobilised as it cycles from reactive N (nitrate-N and ammonium-N) to organic forms of N, as outlined by Rochester et al. (1993). Further investigations to determine the flux and cycling of soil organic N forms may allow a greater understanding of seasonal cycles of N fertiliser. Thirty per cent of the recovered N fertiliser was located in the plant line position, with 66% of the recovered fertiliser being found on the non-irrigated side of the hill. The application of irrigation water down the irrigated furrow caused the N fertiliser to saturate the 1 m wide planting hill from the furrow through the plant line core and then out into the non-irrigated furrow. The movement of N fertiliser was aligned with the movement of the applied water through the hill.
The study recovered the highest level of 15N atom% excess at the plant line core (P < 0.001), which aligns with the original fertiliser application point for the 100:0 treatment (Figs 2, 3). Interestingly, the depth at which the labelled fertiliser was applied (250–300 mm deep) had a lower 15N atom% excess than did the topsoil (0–150 mm depth) above it (0.7 and 1.3 15N atom% excess respectively). Although the outside cores were lower than the plant line, there was a clear trend in the fertiliser dispersion because of the application of irrigation water.
Using the highly soluble enriched urea as a guide for water movement, the data suggest that as the irrigation water travels along the irrigation furrow, it saturates the planting hill in an upward motion (capillary action). Once the hill becomes saturated, the water moves laterally towards and ultimately into the non-irrigated furrow. This is shown in Figs 2 and 3, with the soil in the non-irrigated side of the hill and non-irrigated furrow having greater 15N atom% excess than that in the irrigated furrow. There was also vertical water movement below the root zone, but this was in limited amounts (<0.05 15N atom% excess).
The results complement the findings of Macdonald et al. (2017), because early season irrigation events caused high amounts of N-fertiliser loss into the tail water. Fertiliser-enriched soil solution moves out of the bed and into the non-irrigated furrow. The enriched solution in the non-irrigated furrow is lost from the placement position. If the solution is not absorbed by soil below the movement point, it travels down the furrow and out of the field through the tailwater cycling channels (Macdonald et al. 2016).
Importance of background soil N
It has been reported previously that background soil mineral N and newly mineralised N from soil organic matter during the cropping season can be a significant N source for plants (Brackin et al. 2019). Research has shown that approximately 66% of cotton plant N uptake may be sourced from soil mineral N (Macdonald et al. 2018). Our study found a similar result, with 70% of plant N across the two experiments being derived from the soil. The average total plant N uptake was 275 kg N/ha, and therefore, indigenous soil N contributed 193 kg N/ha to the crop. A study conducted close to the experimental site found that summer N mineralisation (in-crop) ranged between 79 and 142 kg N/ha under an identical irrigation strategy (Macdonald et al. 2022). Nitrogen derived from the soil is readily available for plant utilisation and is used with high efficiency. Conducting soil analysis is highly important and sampling should occur to guide application budgets to align with crop utilisation. Unfortunately, results from soil sampling in-crop are often not received in a timely manner, which would allow them to be used as a budget guide for growers during that season.
Conclusions
Improving N fertiliser recovery in agriculture is a primary focus for agricultural industries so as to improve economic and environmental sustainability. A critical period of concern in irrigated systems is between the pre-sow application of fertiliser and growth stages where significant N use by the crop occurs, i.e. peak fruit or cut-out. In an irrigated cotton system, the most significant period of N fertiliser loss occurs early in the season, coinciding with the first and second irrigation events. Our study found that in-crop fertiliser applications led to lower losses of N fertiliser than did applying fertiliser before sowing. In addition, there were distinct differences in the distribution and final fate of fertiliser within the planting hill, because applying N fertiliser on the non-irrigated side led to greater dispersion through the planting hill than did applying N fertiliser into the plant line. By minimising the amount of fertiliser applied to the soil early in the season, when plant needs are low, we saved more than 10% of the applied N fertiliser.
Data availability
The data that support this study will be shared upon reasonable request to the corresponding author.
Declaration of funding
The work was funded by the Australian Government, Department of Agriculture, Fisheries and Forestry, and the Cotton Research and Development Corporation through the More Profit from Nitrogen project.
References
Antille DL (2018) Evaluation of fertigation applied to furrow and overhead irrigated cotton grown in a black vertosol in Southern Queensland, Australia. Applied Engineering in Agriculture 34(1), 197-211.
| Crossref | Google Scholar |
Baird J, Schwenke G, Macdonald B, Nachimuthu G, McPherson A, Mercer C (2024) Efficiency over excess: maximising cotton lint yields with optimum irrigation and nitrogen fertiliser application. Field Crops Research 315, 109484.
| Crossref | Google Scholar |
Brackin R, Buckley S, Pirie R, Visser F (2019) Predicting nitrogen mineralisation in Australian irrigated cotton cropping systems. Soil Research 57(3), 247-256.
| Crossref | Google Scholar |
Bronson KF, Hunsaker DJ, Mon J, Andrade-Sanchez P, White JW, Conley MM, Thorp KR, Bautista E, Barnes , EM (2017) Improving nitrogen fertilizer use efficiency in surface- and overhead sprinkler-irrigated cotton in the desert southwest. Soil Science Society of America Journal 81(6), 1401-1412.
| Crossref | Google Scholar |
Chen D, Suter H, Islam A, Edis R, Freney JR, Walker CN (2008) Prospects of improving efficiency of fertiliser nitrogen in Australian agriculture: a review of enhanced efficiency fertilisers. Australian Journal of Soil Research 46(4), 289-301.
| Crossref | Google Scholar |
Constable GA, Rochester IJ (1988) Nitrogen application to cotton on clay soil: timing and soil testing. Agronomy Journal 80(3), 498-502.
| Crossref | Google Scholar |
Constable GA, Rochester IJ, Daniells IG (1992) Cotton yield and nitrogen requirement is modified by crop rotation and tillage method. Soil and Tillage Research 23(1–2), 41-59.
| Crossref | Google Scholar |
Fritschi FB, Roberts BA, Rains DW, Travis RL, Hutmacher RB (2004) Fate of nitrogen-15 applied to irrigated acala and pima cotton. Agronomy Journal 96(3), 646-655.
| Crossref | Google Scholar |
Grace P, Shcherbak I, Macdonald B, Scheer C, Rowlings D (2016) Emission factors for estimating fertiliser-induced nitrous oxide emissions from clay soils in Australia’s irrigated cotton industry. Soil Research 54(5), 598-603.
| Crossref | Google Scholar |
Harper LA, Sharpe RR, Langdale GW, Giddens JE (1987) Nitrogen cycling in a wheat crop: soil, plant, and aerial nitrogen transport. Agronomy Journal 79(6), 965-973.
| Crossref | Google Scholar |
Karlen DL, Hunt PG, Matheny TA (1996) Fertilizer 15Nitrogen recovery by corn, wheat, and cotton grown with and without pre-plant tillage on norfolk loamy sand. Crop Science 36(4), 975-981.
| Crossref | Google Scholar |
Macdonald BCT, Ringrose-Voase AJ, Nadelko AJ, Farrell M, Toumi S, Nachimuthu G (2016) Dissolved organic nitrogen contributes significantly to leaching from furrow-irrigated cotton–wheat–maize rotations. Soil Research 55(1), 70-77.
| Crossref | Google Scholar |
Macdonald BCT, Chang YF, Nadelko A, Tuomi S, Glover M (2017) Tracking fertiliser and soil nitrogen in irrigated cotton: uptake, losses and the soil N stock. Soil Research 55(3), 264-272.
| Crossref | Google Scholar |
Macdonald BCT, Latimer JO, Schwenke GD, Nachimuthu G, Baird JC (2018) The current status of nitrogen fertiliser use efficiency and future research directions for the Australian cotton industry. Journal of Cotton Research 1, 15.
| Crossref | Google Scholar |
Macdonald BCT, Schwenke GD, McPherson A, Mercer C, Baird J, Nachimuthu G (2022) Soil water deficit effects on soil inorganic nitrogen in alternate-furrow flood irrigated Australian cotton production systems. Soil Research 60(2), 137-146.
| Crossref | Google Scholar |
Masclaux-Daubresse C, Daniel-Vedele F, Dechorgnat J, Chardon F, Gaufichon L, Suzuki A (2010) Nitrogen uptake, assimilation and remobilization in plants: challenges for sustainable and productive agriculture. Annals of Botany 105, 1141-1157.
| Crossref | Google Scholar | PubMed |
R Core Team (2021) R: A language and environment for statistical computing. R Foundation for Statistical Computing, Vienna, Austria. Available at https://www.R-project.org/
Rochester IJ (2003) Estimating nitrous oxide emissions from flood-irrigated alkaline grey clays. Australian Journal of Soil Research 41(2), 197-206.
| Crossref | Google Scholar |
Rochester IJ (2011) Assessing internal crop nitrogen use efficiency in high-yielding irrigated cotton. Nutrient Cycling in Agroecosystems 90, 147-156.
| Crossref | Google Scholar |
Rochester IJ, Constable GA, Macleod DA (1992) Preferential nitrate immobilization in alkaline soils. Australian Journal of Soil Research 30(5), 737-749.
| Crossref | Google Scholar |
Rochester IJ, Constable GA, Macleod DA (1993) Cycling of fertilizer and cotton crop residue nitrogen. Australian Journal of Soil Research 31(5), 597-609.
| Crossref | Google Scholar |
Rochester IJ, Constable GA, Saffigna PG (1997) Retention of cotton stubble enhances N fertilizer recovery and lint yield of irrigated cotton. Soil and Tillage Research 41(1–2), 75-86.
| Crossref | Google Scholar |
Rochester IJ, Peoples MB, Constable GA (2001) Estimation of the N fertiliser requirement of cotton grown after legume crops. Field Crops Research 70(1), 43-53.
| Crossref | Google Scholar |
Scheer C, Rowlings DW, Antille DL, De Antoni Migliorati M, Fuchs K, Grace PR (2023) Improving nitrogen use efficiency in irrigated cotton production. Nutrient Cycling in Agroecosystems 125, 95-106.
| Crossref | Google Scholar |
Sparks M (2019) 2018 Cotton growers survey. Cotton Research and Development Corporation. Available at https://www.insidecotton.com/2018-cotton-growers-survey
Wickham H (2016) ‘ggplot2: Elegant Graphics for Data Analysis.’ (Springer-Verlag: New York, NY, USA) ISBN 978-3-319-24277-4. Available at https://ggplot2.tidyverse.org