
A case study of South Australia’s severe thunderstorm and tornado outbreak 28 September 2016
Dragana Zovko-Rajak A B * , Kevin J. Tory A B and Jeffrey D. Kepert A B
A Bureau of Meteorology, Melbourne, Vic., Australia.
B Bushfire and Natural Hazards Cooperative Research Centre, Melbourne, Vic., Australia.
Abstract
An analysis of the South Australian severe thunderstorm and tornado outbreak of 28 September 2016, which produced at least seven tornadoes and contributed to a state-wide power outage, is presented here. Although challenging, prediction and understanding of tornadoes and other hazards associated with severe thunderstorms is very important to forecasters and to community and emergency services preplanning and preparedness. High-resolution deterministic and ensemble simulations of the event are conducted using the Australian Community Climate and Earth-System Simulator (ACCESS) model and the simulations are compared to radar and satellite observations. The deterministic simulation and two of the ensemble members show that the overall structure, orientation, intensity and timing of simulated thunderstorms is in good agreement with the observations. In the deterministic simulation, a hook-echo feature in the simulated reflectivity, indicating the presence of a mesocyclone, appeared at the time and location of one of the observed tornadoes. Two diagnostics were found to have good value for identifying tornado-formation risk. Updraft helicity successfully identified the potential for mesocyclone development, and the Okubo–Weiss parameter identified model-resolved mesocyclone rotation. The ensemble simulations show a wide range of outcomes for intensity, timing and structure of the event, as well as differences in potential for tornado formation. This emphasises the importance of ensemble simulations in forecasting severe weather and associated hazards, as ensembles identify a range of possible scenarios and the uncertainty, leading to improved guidance for forecasters and emergency services.
Keywords: ACCESS model, ensembles, high resolution, NWP, mesocyclone, severe thunderstorms, South Australia blackout, tornadoes, updraft helicity.
1.Introduction
On 28 September 2016 one of the most significant severe thunderstorm outbreaks in the state’s history affected central and eastern parts of South Australia. Multiple supercell thunderstorms were embedded in a Quasi-Linear Convective System (QLCS; Weisman and Trapp 2003) aligned with a strong cold front that was associated with an intense low-pressure system (e.g. Quinting et al. 2019). The storms produced at least seven tornadoes, destructive wind gusts, large hail and intense rainfall. Power transmission lines were brought down in four different locations, which caused a state-wide power outage (Bureau of Meteorology 2016a).
Prior to the 28 September 2016 event, the Bureau of Meteorology numerical weather prediction (NWP) guidance systems indicated the potential for a significant thunderstorm outbreak. As the outbreak developed, outlook products and advice were continually provided to emergency services, with publicly available severe thunderstorm warnings issued and updated frequently. These included warnings on destructive wind gusts, large hail and heavy rainfall (based on the Bureau of Meteorology 2016a report).
Contrary to general perception, tornadoes in Australia do occur frequently and the first documented tornado since European colonisation occurred in 1795. They are also mentioned in oral stories of Indigenous Australians as ‘willy willy’ (Pybus 2009), which date even further back. The actual frequency of tornadoes is not adequately known as the tornado climatology in Australia is limited and incomplete (Allen and Allen 2016) and many more tornadoes are not reported because they occur in remote and less populated areas. Similar to tornadoes in the United States, tornadoes in Australia can occur during the warm season (October–April in the southern hemisphere) and cool season (May–September in the southern hemisphere) and in a wide range of environmental conditions (e.g. Hanstrum et al. 2002; Allen and Allen 2016). Convective storms associated with tornadoes include supercell and non-supercell thunderstorms, QLCSs (e.g. squall lines and bow echoes) as well as tropical cyclones (e.g. Trapp et al. 2005; Edwards 2012; Thompson et al. 2012). The Australian Bureau of Meteorology uses a tornado rating system based on the Fujita scale (Fujita 1981), and tornadoes associated with the 28 September 2016 outbreak were rated at F1 (117–180 km h−1) or F2 (181–253 km h−1) intensity rating (Bureau of Meteorology 2016a; Sgarbossa et al. 2018).
Accurate prediction and understanding of tornadoes and other hazards associated with severe thunderstorms is very important, as timely dissemination of warnings helps facilitate protective action. Although directly predicting tornadoes with NWP systems is not yet operationally feasible, as this requires model grid lengths of the order of O (100 m) or less, models with grid lengths of the order of O (1 km) (i.e. convection-allowing models) can provide realistic representation of storms that produce tornadoes (e.g. Bryan et al. 2003; Hanley et al. 2016) and allow the investigation of novel model diagnostics for severe weather forecasting (e.g. Clark et al. 2012, 2013; Sobash et al. 2016a).
Updraft helicity (UH) is one such diagnostic produced from convection-allowing models (horizontal grid spacing from 500 m to 4 km) and has been used by the National Oceanic and Atmospheric Administration’s National Weather Service since 2008 (Kain et al. 2008; Clark et al. 2013). The UH is a diagnostic developed to identify mesocyclones and the potential for rotating thunderstorms, or supercells, within which tornadoes may form (Kain et al. 2008). It is the product of vertical vorticity and vertical velocity, integrated vertically between 2 and 5 km above the surface. Previous studies have shown that UH can be used successfully as a severe storm surrogate, not just for forecasting tornado pathlengths but also for strong winds and large hail (e.g. Sobash et al. 2011; Clark et al. 2012, 2013; Gallo et al. 2016). Sobash et al. (2016a) also successfully used low-level UH (0–3 km) to identify low-level mesocyclone rotation in simulated supercells. Recent studies have mostly used UH for identifying tornadic supercells rather than than the UH relationship to tornadoes that develop in QLCSs or tropical cyclones (Sobash et al. 2016a).
In this paper, high-resolution deterministic and ensemble simulations of the 28 September 2016 severe thunderstorm and tornado outbreak in South Australia are performed using the Australian Community Climate and Earth-System Simulator (ACCESS) model. This study aims to offer a better understanding of the meteorology of this event and contributes to improving knowledge of how to best predict similar severe weather events. The use of the UH diagnostic field as a forecast guidance tool for tornado outbreaks is also investigated. To our knowledge, this is the first study to investigate the applicability of UH as a severe storm surrogate in Australia, as well as the first high-resolution NWP case study of a tornado event in Australia.
Section 2 describes observational data, the numerical model and set-up of deterministic and ensemble simulations and model diagnostics. A synoptic overview of the event is presented in Section 3 and simulation results are discussed in Section 4. Finally, a summary and conclusions are presented in Section 5.
2.Data and methods
2.1. Observational data
Satellite and radar observations, as well as ACCESS operational regional analyses (ACCESS-R; Puri et al. 2013; Bureau of Meteorology 2016b) are used to describe synoptic conditions associated with the severe thunderstorm and tornado outbreak of 28 September 2016 (Section 3) and for comparison with simulations (Section 4).
Radar images are derived from Adelaide’s Buckland Park S-band Dual Polarisation radar, at 0.5° elevation. Satellite data are processed by the Bureau of Meteorology from the geostationary satellite Himawari-8 operated by the Japan Meteorological Agency. Satellite images are also used to complement radar analysis for areas where storms and tornadoes were observed but were not well identified on radar due to poor or no radar coverage.
Locations of the seven reported tornadoes used in figures throughout this manuscript are based on the Bureau of Meteorology (2016a) report, with six of the tornadoes occurring during 06:00–06:30 hours UTC on 28 September 2016. In that report, tornadoes were confirmed based on damage assessment, damage reports and radar evidence.
2.2. Numerical model description
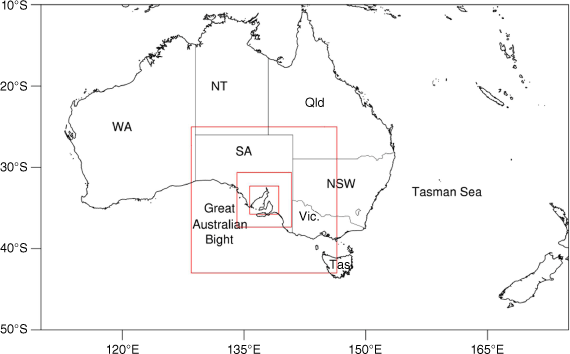
A case study of the 28 September 2016 event is conducted using a nesting configuration of the UK Met Office Unified Model (UM, ver. 10.6), which is the atmospheric component of ACCESS (Puri et al. 2013) used for research and operations in Australia. The model consists of a global model run (nominal 17-km horizontal grid spacing) that is nested down to grid spacing of 4.0 km, 1.5 km and 400 m (Fig. 1), with the inner domain size chosen to capture the area where seven tornadoes were reported. Each domain has 80 vertical levels, and the model top is 38.5 km.
Outline of model domains (red), with horizontal grid spacing of 4 km for the larger domain, and 1.5 km and 400 m for the smaller domains.
All simulations use the Regional Atmosphere and Land Mid-latitude first release (hereafter RAL1-M) science configuration, developed for convection-allowing application of the UM (Bush et al. 2020). RAL1-M defines the science configuration of the physics and dynamics schemes of the atmosphere and uses Arakawa C-grid staggering in the horizontal (Arakawa and Lamb 1977) and Charney–Phillips staggering in the vertical (Charney and Phillips 1953). For a more detailed description see Bush et al. (2020).
The deterministic simulation is initialised at 15:00 hours UTC on 27 September 2016 (+9.5 h for local time) using initial conditions from global ACCESS (ACCESS-G), and all simulations are run for 24 h. Convection parametrisation is not used on the horizontal grid spacings of 1.5 km and lower as convection can be explicitly presented on these scales.
In addition to the described deterministic simulations, convective-scale ensemble simulations of the same event are conducted to learn about the model uncertainty of this event. For these simulations, version 11.1 of the UM ensemble nesting suite is used and consists of the Met Office operational global ensemble system (MOGREPS-G; Bowler et al. 2008) as a driving model, with a horizontal grid spacing of ~33 km, which is similarly nested down to 4-km, 1.5-km and 400-m regional domains.
The ensemble consists of six simulations (one control and five perturbed) initialised at 12:00 hours UTC on 27 September 2016 (+9.5 h for local time) and run for 24 h, with initial and boundary conditions for each member provided by the corresponding MOGREPS-G member. Similar to the deterministic model, all simulations use the RAL1-M science configuration, and all domains have 80 vertical levels with the model top of 38.5 km. Note that ensemble simulations are initialised 3 h earlier as MOGREPS-G initial conditions are output at different time than for ACCESS-G.
2.3. Model diagnostics
The UH diagnostic was designed in 2008 to detect mid-level mesocyclones, and thus supercells, in convection-allowing models. Based on Kain et al. (2008), UH is computed as follows:
where w is the vertical velocity (m s−1), is the vertical component of relative vorticity (s−1) and z is height (m). Although UH can be computed as an instantaneous value at a single model output time, Kain et al. (2010) developed hourly maximum UH (cyclonic rotation is positive for the northern hemisphere) that tracks the maximum value of the diagnostic at every grid point at any model time step within the previous hour (e.g. Clark et al. 2012, 2013; Sobash et al. 2016a). Hourly maximum UH was developed because convective storms evolve on much shorter time scales than the usual model output frequencies (usually hourly or greater), and also provides more information on the path and intensity of simulated storm features (Clark et al. 2013). In this study, UH is computed at every model time step and the maximum and minimum fields are output every hour. Note that UH is negative in the southern hemisphere for cyclonically rotating storms and therefore hourly minimum UH is used in subsequent analysis.
The Okubo–Weiss (OW) parameter has been used in fluid dynamics to identify regions of rotating fluid for many decades:
where ζ is the vertical component of relative vorticity, E is the stretching deformation and F is the shearing deformation (Okubo 1970; Weiss 1991; Markowski et al. 2011). Positive values of the OW parameter highlight flow regions where rotation dominates over strain, and can be used to identify rotation in vortex cores associated with tornadic storms (e.g. Markowski et al. 2011; Coffer and Parker 2017). We found that vertically averaging the OW parameter over a similar layer to UH is a good way to identify a deep coherent vortex core (discussed in Section 4.2).
3.Synoptic overview
The main focus of this paper is high-resolution deterministic and ensemble simulations to investigate how well tornadic storms can be simulated and to investigate diagnostics that can be used as a tornado proxy. Therefore, the synoptic discussion offered here is brief.
As mentioned in Section 1, this high-impact weather event was caused by multiple supercell thunderstorms embedded along a QLCS that was aligned with a strong cold front. This cold front was associated with an intense low-pressure system that developed south of the Great Australian Bight (Fig. 2). A surface low-pressure system (Fig. 2c) developed on 27 September 2016 in response to the amplifying upper-level trough (Fig. 2a) south of Western Australia that was associated with a synoptic-scale Rossby wave pattern (Bureau of Meteorology 2016a; Sgarbossa et al. 2018).
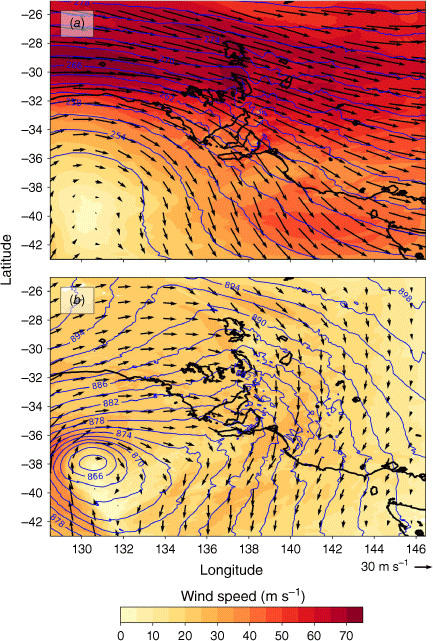
(a, b) Upper-level analysis of 300-hPa geopotential height (blue contours with a 80-m contour interval) and winds (vectors and shading, m s−1) and (c, d) mean sea-level pressure (black contours with a 4-hPa interval) and surface wind (vectors) from the operational regional ACCESS (ACCESS-R) at (a, c) 06:00 hours UTC on 27 September 2016 and (b, d) 06:00 hours UTC on 28 September 2016.
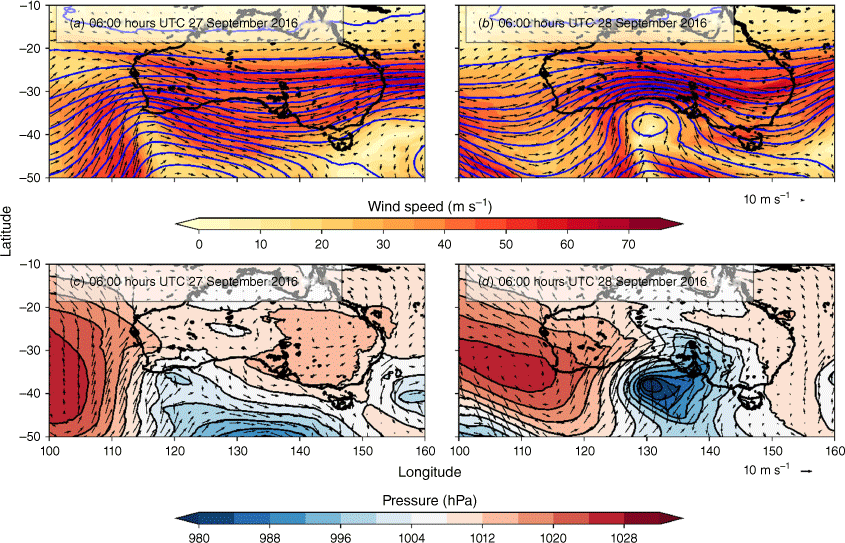
Over the next 24 h (Fig. 2b), the upper-level trough started to tilt negatively (i.e. tilting eastward with decreasing latitude) and began to cut-off, leading to the strengthening and explosive development of the surface low-pressure system and the associated north–south oriented cold front (Fig. 2d). The central pressure dropped 23 hPa in 24 h, meeting Bell and Keyser’s (1993) criterion for explosive development, and reached 973 hPa south of the Bight by 06:00 hours UTC on 28 September 2016 (Fig. 2d, Sgarbossa et al. 2018). Multiple severe thunderstorms developed along the line of a strong cold front that acted as a main lifting mechanism. These thunderstorms crossed central and eastern South Australia bringing damaging and destructive winds, large hailstones and tornadoes that caused a state-wide power outage (Bureau of Meteorology 2016a). By 18:00 hours UTC on 28 September 2016 this intense and complex low system had moved further east (not shown), with its passage causing the lowest-on-record mean sea level pressure (MSLP) observed off the south coast of South Australia (Bureau of Meteorology 2016c).
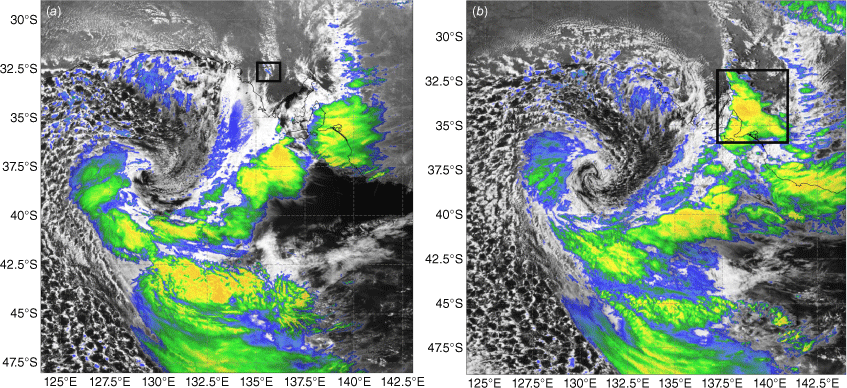
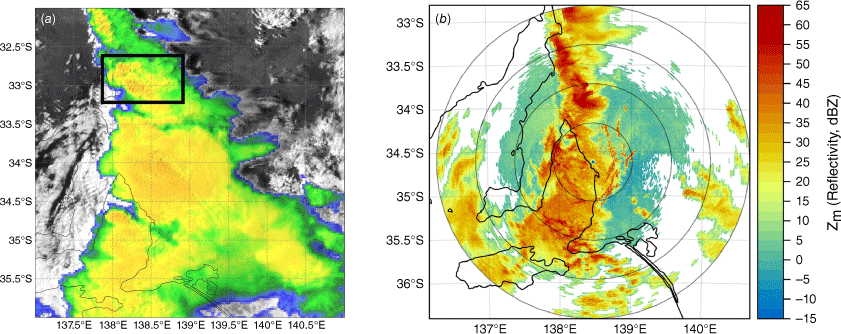
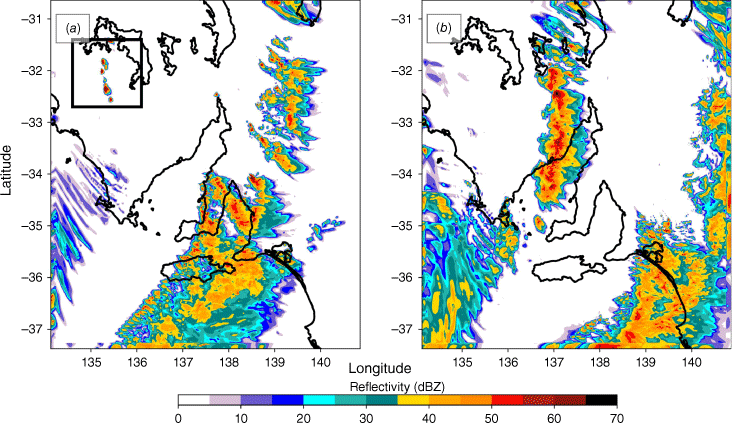
Himawari-8 satellite images at 02:30 and 06:00 hours UTC on 28 September 2016 show a low-pressure system over the Great Australian Bight and thunderstorm cells that first formed over the northern Eyre Peninsula (black box in Fig. 3a). These cells developed into deep convective clouds associated with the cold front and tornado outbreak over the central and eastern parts of South Australia (black box in Fig. 3b). A zoom-in satellite image of deep convection at 06:00 hours UTC on 28 September 2016 (Fig. 4a) and a plan-position radar image from the Adelaide’s Buckland Park radar (Fig. 4b) show the QLCS with embedded supercell thunderstorms that were responsible for reported tornadoes. Note that the northernmost supercells (black box in Fig. 4a) are not well identified by radar due to lack of radar coverage in this area.
Himawari-8 enhanced visible satellite images at (a) 02:30 hours UTC and (b) 06:00 hours UTC on 28 September 2016. Black box in (a) denotes the location of the first thunderstorm cells that formed over the northern Eyre Peninsula and developed into convection associated with the tornado outbreak over the central and eastern South Australia (black box in (b), zoom-in view shown in Fig. 4a).
4.Simulation results
In this section, an overview of the 4- and 1.5-km simulations of the 28 September 2016 case study is provided, to understand how well the model reproduces synoptic features and the overall structure of the event. This is followed by an analysis of the 400-m simulation, and a comparison with the ensemble simulations.
4.1. Overview of the 4- and 1.5-km simulations
Fig. 5 shows the upper-level (10-km) and near-surface (1-km) flow from the 4-km deterministic simulation from 6:00 hours UTC on 28 September 2016. Similar to Fig. 2, this shows a strong westerly jet extending over central and eastern South Australia and an upper-level low over the Great Australian Bight (Fig. 5a). At the surface a strong low-pressure system is situated over the Bight, with strong southerly winds to the south-south-west of the low centre. Associated with this low-pressure system is the north–south oriented cold front extending over central South Australia and collocated with a convergence zone with near-surface wind speed exceeding 20 m s−1 (Fig. 5b). Analysis also shows that modelled MSLP at this time is 974 hPa, in good agreement with the observations (not shown).
(a) Upper-level (10-km) and (b) near surface-level (1-km) winds (vectors and shading, m s−1) and pressure (blue contours with a 2-hPa contour interval) at 06:00 hours UTC on 28 September (from the 4-km deterministic simulation).
To analyse how well the supercell thunderstorms and the QLCS are represented in the model, the 1.5-km deterministic simulation is analysed and compared with observations presented in Section 3. Fig. 6a shows simulated reflectivity around the time when the first thunderstorms associated with the outbreak began to develop along the cold front. Based on the Bureau of Meteorology (2016a) report and shown in Fig. 3a, the first thunderstorm cells formed on the northern Eyre Peninsula by 02:30 hours UTC on 28 September 2016 (12:00 hours local time). In the simulations, the first thunderstorm cells formed on the northern Eyre Peninsula at 02:30 hours UTC on 28 September 2016 (black box in Fig. 6a), in good agreement with the timing and location of the first observed thunderstorms. These thunderstorm cells continued to develop and formed a line while moving south-east ahead of the frontal boundary (Fig. 6b). Over the next 1.5 h (Fig. 7), the line of thunderstorms moved further east, extending in an approximately north-west–south-east direction over central South Australia.
Composite reflectivity from the 1.5-km deterministic simulation at (a) 02:30 hours UTC and (b) 04:30 hours on UTC 28 September 2016. Black box in (a) denotes the location of the first thunderstorm cells that formed over the northern Eyre Peninsula.
Composite reflectivity from the 1.5-km deterministic simulation at (a) 05:30 hours UTC and (b) 06:00 hours UTC on 28 September 2016.
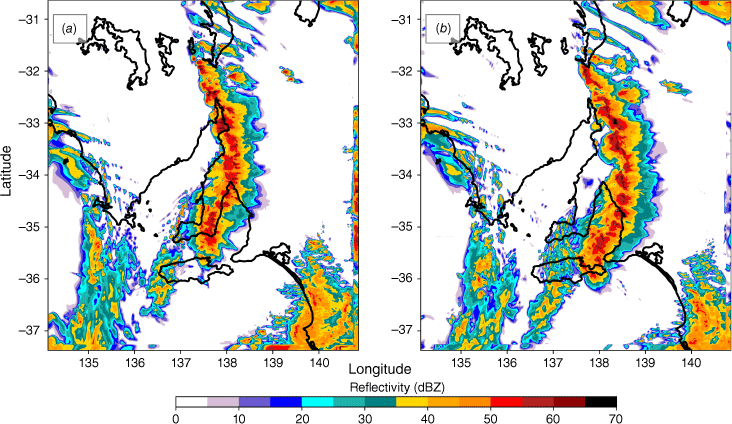
This analysis shows some differences between the simulations and observations. For example, individual supercell thunderstorms associated with the reported tornadoes and seen in the satellite and radar image (cf. Fig. 4) are not fully resolved by the model. Also, the convective cells that extend further south are stronger than those observed. However, the overall timing, orientation and location of severe thunderstorms are captured reasonably well by the model. As mentioned in the introduction, numerical models with 1.5-km grid length (i.e. convection-allowing models) can more realistically represent convective storms and convective processes, but they are not able to fully resolve individual supercells or tornado-like signatures (e.g. Bryan et al. 2003; Hanley et al. 2016). In the following section, the 400-m simulation is analysed to determine if simulated storms are better resolved and if mesocyclones can be captured with this resolution.
4.2. Analysis of the 400-m simulation
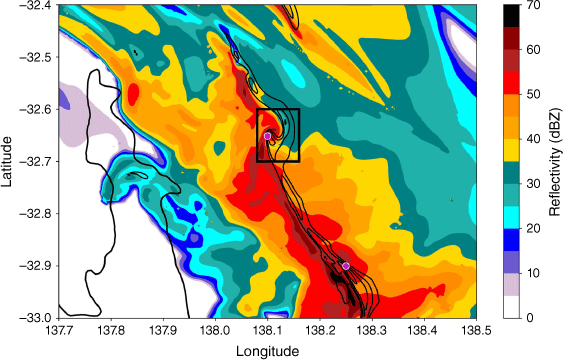
Fig. 8 shows simulated radar reflectivity at 06:00 hours UTC on 28 September 2016, which is around the time when some of the tornadoes were reported (e.g. Bureau of Meteorology 2016a). The overall timing and location of the convective system is in good agreement with the observations (cf. Fig. 4). The northern cells (black box in Fig. 8) are stronger and better defined than the southern part of the convective system, indicated by differences in the simulated reflectivity (Fig. 8).
Simulated radar reflectivity (dBZ) at 2 km at 06:00 hours UTC on 28 September 2016 from the 400-m deterministic simulation. The magenta dots are the observed locations of the tornadoes and the black box denotes the area shown in Fig. 9.
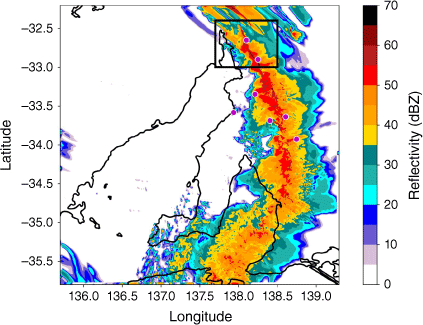
A close-up view of the simulated reflectivity and vertical velocity (Fig. 9) in the northern part of the system (black box in Fig. 8) reveals a hook-echo feature and a curved updraft (black box in Fig. 9) that coincides with the location of one of the reported tornadoes (northernmost magenta dot in Fig. 9). The hook echo indicates the presence of a mesocyclone (Davies-Jones 2015) at this location. The reported tornado is estimated to have formed at approximately 06:15 hours UTC on 28 September 2016 (Bureau of Meteorology 2016a; Sgarbossa et al. 2018), which is about 15 min later than in the simulation. Fig. 9 also shows that at the location of another reported tornado (the southern magenta dot in Fig. 9) larger values of reflectivity and vertical velocity are present, but there is no clear indication of a hook echo or cyclonic rotation. Similarly, analysis of the simulated reflectivity and vertical velocity in the southern part of the convective system, where other tornadoes were reported (cf. Fig. 8), does not show hook echoes or other rotational features (not shown).
As in Fig. 8, but for the area indicated by the black box in Fig. 8. The black contours show upward vertical velocity (6–22 m s−1, contour interval 4 m s−1). The black box denotes the location of the hook echo.
Although a tornado cannot be resolved with the 400-m horizontal resolution, this analysis shows that the mesocyclone and features that indicate the possibility of a tornado (e.g. hook echo) are well captured. At this resolution the model can be used to investigate diagnostics such as UH (described in Section 2.3) to identify rotation and tornado potential in simulated storms. Although UH has been widely used as a diagnostic field in the United States National Weather Service, its use in Australia is relatively novel and to our knowledge, apart from the work of Sgarbossa et al. (2018), has not been widely used in operations.
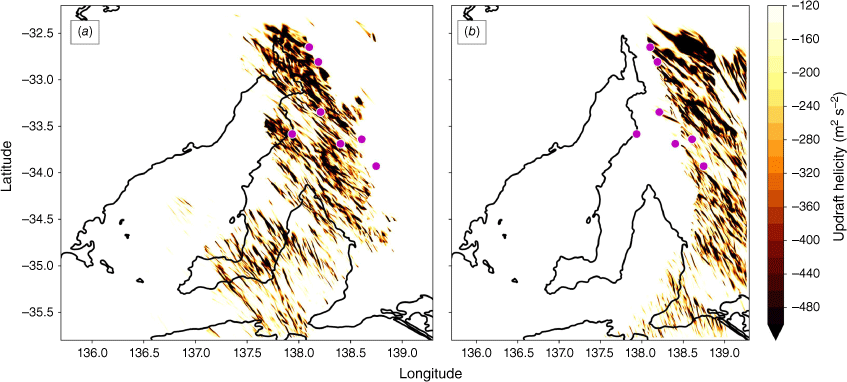
Different thresholds for UH have been used in the scientific literature; for example, Kain et al. (2008) considered a threshold of 50 m2 s−2 as suitable for mesocyclone detection, whereas more recent studies used varying UH thresholds (75, 150 and ≥200 m2 s−2), since higher UH thresholds are more suitable for reduced grid spacing (e.g. Clark et al. 2012, 2013; Gallo et al. 2016; Sobash et al. 2016b; Snook et al. 2019). As mentioned in Section 2.3, positive (negative) values of UH represent cyclonic rotation in the northern (southern) hemisphere. Here, a threshold of −120 m2 s−2 was used, chosen subjectively based on experimentation with different UH thresholds (not shown) to better depict mesocyclone path lengths.
Fig. 10 shows hourly minimum UH for the period between 05:00 and 07:00 hours UTC on 28 September 2016, which coincides with the time period of the reported tornadoes (Bureau of Meteorology 2016a). It shows elongated swathes of hourly minimum UH below −120 m2 s−2 and reaching values below −400 m2 s−2 in close proximity to the observed tornado tracks (magenta dots in Fig. 10). A long and coherent, vortex-like swathe of hourly minimum UH below −500 m2 s−2 coincides with the location of the northernmost observed tornado, indicating the mesocyclone that was identified in simulated reflectivity and vertical velocity (cf. Fig. 9). Interestingly, swathes of hourly minimum UH approximately coincide with locations of other observed tornadoes, where analysis of simulated reflectivity and vertical velocity did not indicate rotation; however, they are not as coherent as the northernmost swath of UH. Coherent tracks of high UH values may indicate potential tornado pathlengths but more research is needed to determine appropriate UH thresholds that best predict tornado pathlengths (Clark et al. 2012, 2013).
Hourly minimum updraft helicity (m2 s−2) for the periods (a) 05:00–06:00 hours UTC and (b) 06:00–07:00 hours UTC on 28 September 2016 from the 400-m simulation. The magenta dots denote the approximate location of observed tornadoes.
This analysis confirms that the use of UH as a diagnostic field would provide useful guidance for identifying the potential for tornado formation in this case. However, recent studies (e.g. Clark et al. 2012; Gallo et al. 2016; Sobash et al. 2016a) have shown that using solely UH as a tornado proxy can lead to large areas of false alarms in regions not always favourable for tornadogenesis.
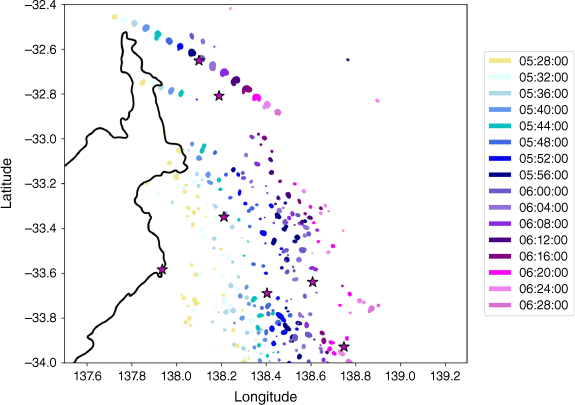
Another parameter worth investigating as a tornado proxy alongside UH is the OW parameter (described in Section 2.3). Fig. 11 shows the OW parameter layer averaged between 1 and 4 km, at 4-min intervals for 05:28–06:28 hours UTC on 28 September 2016. It shows a coherent track of positive OW parameter that coincides with the location of the northernmost reported tornado, thus clearly identifying the mesocyclone in this simulation. In other locations further south, the OW parameter does not have coherent tracks, as they are more spread out and noisy. Other thresholds were tested when analysing the OW parameter, with higher thresholds showing only the northernmost track (not shown). In Fig. 11, a minimum threshold of 0.3 s−2 is used. We also analysed the OW parameter for the 2–5-km layer (like UH) using the same threshold as in Fig. 11 and this also shows a northernmost coherent track of positive OW, but it is a lot noisier in other regions (not shown). This analysis shows that the OW parameter identifies the rotation associated with the mesocyclone in these simulated storms and gives a clear indication of a potential tornado path. This suggests that it can be used as an additional diagnostic alongside UH to assess tornado potential and identify regions where tornadoes may occur, thus potentially reducing false alarms.
The Okubo–Weiss parameter (OW; positive values only), calculated as a 1–4-km layer average for the time interval of 05:28–06:28 hours UTC on 28 September 2016 from the 400-m simulation. Values of the OW parameter are spatially smoothed. The magenta stars denote the approximate location of the observed tornadoes.
4.3. Comparison with ensemble simulations
The analysis presented in Sections 4.1 and 4.2 is based on the deterministic, high-resolution simulation that enables the study of the dynamics and properties of tornadic storms, as well as highlighting how diagnostics such as UH and the OW parameter could be used as severe storm surrogates. However, it does not provide information on the uncertainty associated with the timing, location and intensity of the tornadic storms or tornado pathlengths (e.g. Hanley et al. 2016; Snook et al. 2019), which ensemble simulations can provide. Although tornado-resolving ensemble simulations are not practical due to the extreme computational costs involved (e.g. Zhang et al. 2015; Sobash et al. 2016b; Snook et al. 2019), convection-allowing (i.e. grid lengths of the order of O (1 km)) ensemble simulations are of considerable value for forecasting severe storms and associated hazards. In this section, 4-km and 400-m ensemble simulations are analysed using the model setup described in Section 2.2.
The ensemble simulations showed some differences to the deterministic simulation described above. There is an ~0.5–1-h difference in the timing of the event, likely due to the use of different global initial conditions in the ensemble simulations. Fig. 12 shows the simulated column maximum radar reflectivity for each ensemble member from the 4-km simulation. A substantial variation in the mode of convection is immediately apparent. Although members 1 and 2 display a QLCS structure quite similar to the deterministic forecast, member 5 displays weaker QLCS structure, member 4 is weaker throughout and members 0 and 3 have linear structures to the south of the reported tornadoes (magenta dots in Fig. 12) and discrete cells of convection to the north of the reported tornadoes.
Column maximum simulated radar reflectivity at 05:00 hours UTC on 28 September 2016 from the 4-km ensemble simulation. The magenta dots denote the approximate location of the observed tornadoes.
Dial et al. (2010) found that the organisation of convection into linear or discrete modes is determined by the relative orientation of deep-layer shear vectors and mean wind vectors with respect to the initiating synoptic boundaries, such as cold fronts. The linear convective mode is favoured when shear vectors are oriented parallel to the synoptic boundary, whereas the discrete mode is favoured for shear vectors perpendicular to the boundary.
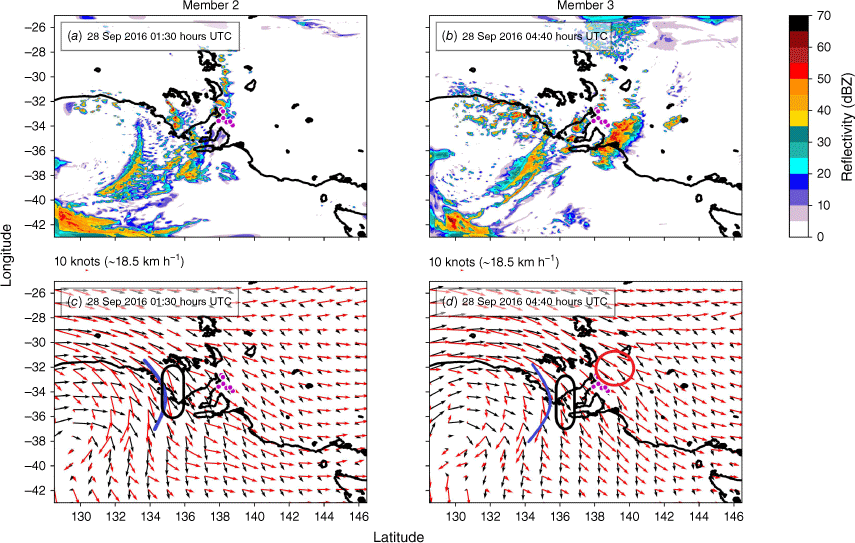
To understand the differences in convective mode between ensemble members (cf. Fig. 12), the orientation of surface–6-km shear vectors relative to the frontal boundary (in this case a cold front) is analysed. For brevity, only ensemble members 2 and 3 are presented here as they are good examples of linear and discrete convective modes, respectively. The storm motion vector is calculated based on Bunkers et al. (2014) and the surface–6-km bulk shear is calculated as the vector difference between winds at 6 km and winds at the surface (in this case 10 m).
Convection over the northern Eyre Peninsula develops a few hours earlier in member 2 than in member 3 (Fig. 13a, b) and along the frontal boundary (blue line in Fig. 13c), with shear vectors parallel to the frontal boundary (black ellipse in Fig. 13c) supporting a more linear mode of convection (Dial et al. 2010). Over time, convection in member 2 starts to resemble the QLCS mode that was observed (not shown). Convection in member 3 develops ahead of the front (Fig. 13b), with the linear mode favoured where shear vectors are more parallel to the boundary (closer to the low, black ellipse in Fig. 13d) and with the discrete mode to the north of the tornado reports where vectors are perpendicular (red ellipse in Fig. 13d). The approximate position of the frontal boundary was determined from 1.5-m temperature and MSLP analysis (not shown). This analysis agrees with the conceptual model of the relationship between the convective mode and the orientation of the shear vectors relative to the frontal boundary (Dial et al. 2010; Thompson et al. 2012).
(a, b) Column maximum simulated reflectivity (dBZ) and (c, d) surface–6-km storm motion vector (black) and surface–6-km bulk shear vector (red) at (a, c) 01:30 hours UTC and (b, d) 04:40 hours UTC on 28 September 2016 from the 4-km ensemble simulation. The magenta dots denote the approximate location of the observed tornadoes and black and red ellipses in (c, d) denote where shear vectors are parallel or perpendicular to the frontal boundary (blue line).
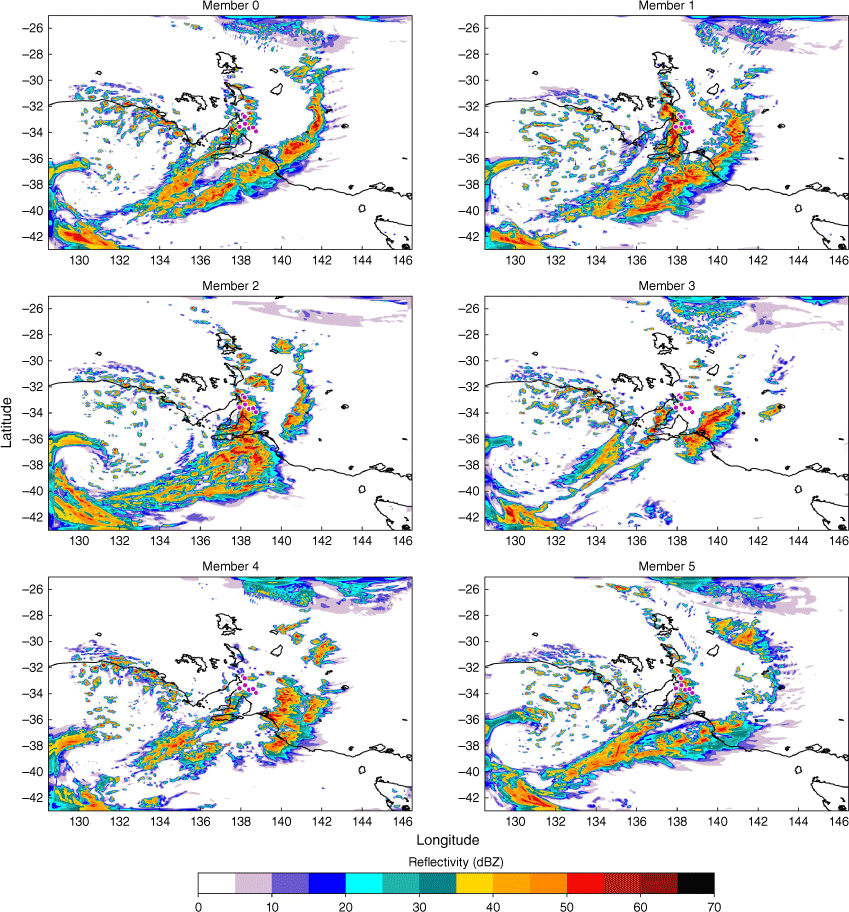
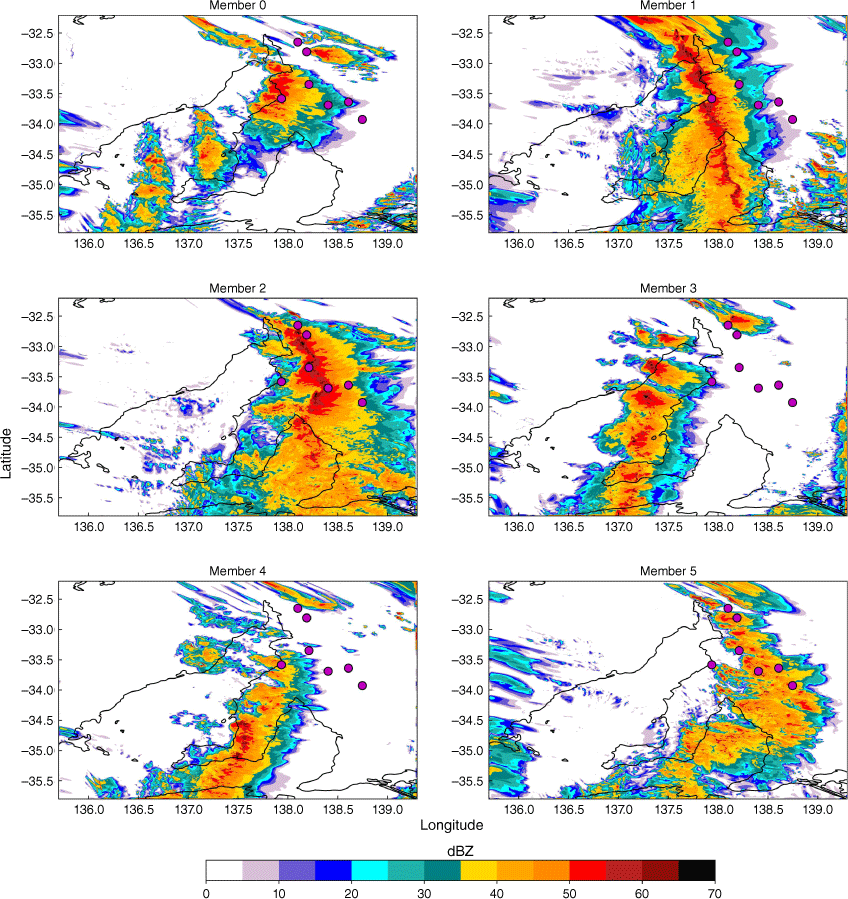
A snapshot of the simulated radar reflectivity from the 400-m simulation (Fig. 14) shows more detail in the convective organisation between the six ensemble members. Convection in members 0 and 3 consists of both discrete cells and linear structure; however, the cells in member 3 are quite distinct and stronger than in member 0. Members 1, 2 and 5 display a QLCS structure similar to the deterministic forecast (cf. Section 4.2) but convection in member 5 is weaker than in members 1 and 2. Convection in member 4 is weaker throughout and patchy in the area of the reported tornadoes.
Column maximum simulated reflectivity (dBZ) at 05:00 hours UTC on 28 September 2016 from the 400-m ensemble simulations. The magenta dots denote the approximate location of the observed tornadoes.
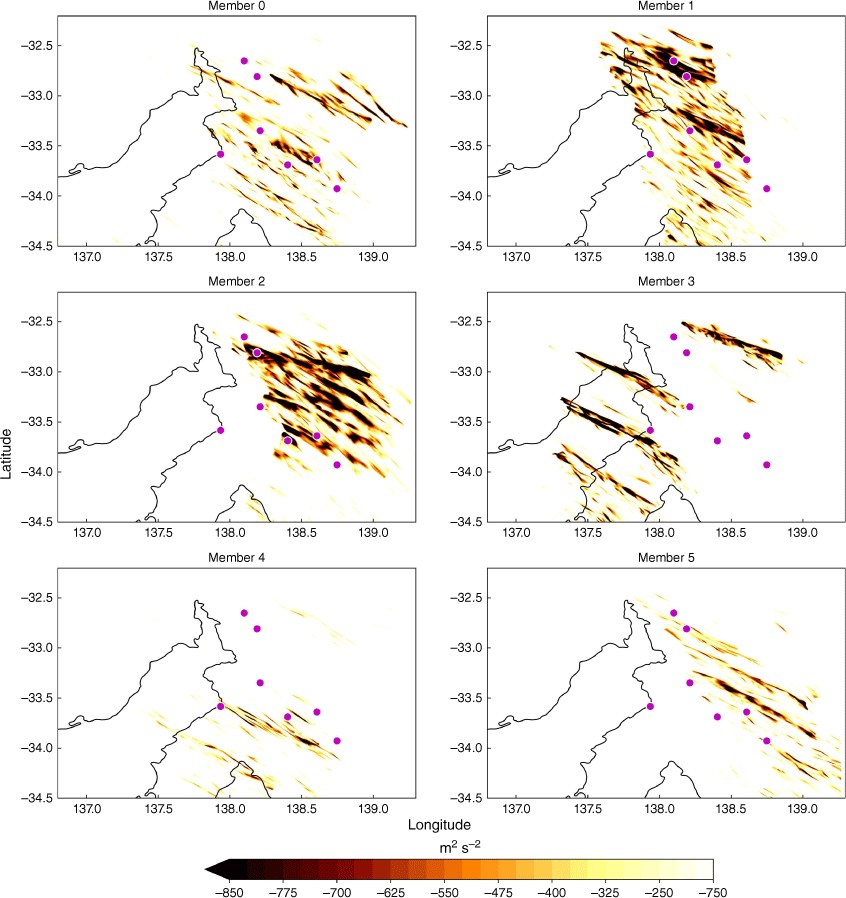
The results from the convective diagnostic tools from these simulations are similarly wide ranging, although we show only the UH for reasons of space. Hourly minimum fields of UH for the six ensemble members are shown in Fig. 15, with members 1 and 2 again being the most like the deterministic simulation. The four individual convective cells in member 3 each possess a strong band of intense UH, suggesting that these are individual supercells, in contrast to the QLCS structure of members 1 and 2. The weaker UH in the remaining members is indicative of less favourable, but not impossible, conditions for tornadogenesis.
5.Summary and conclusions
An analysis of the South Australian severe thunderstorm and tornado outbreak of 28 September 2016, which produced at least seven tornadoes and contributed to a state-wide power outage, is presented here. Both deterministic and ensemble high-resolution simulations using the ACCESS model were conducted, to gain a better understanding of the meteorology of the event and to learn how to best predict similar severe weather events.
The deterministic simulation, and two of the six ensemble members, produced simulated radar reflectivity plots whose structure, orientation, timing and intensity were in close agreement with the observations. In the remaining ensemble members, the convection was either weaker, or displayed a different structure, to that observed.
In the deterministic simulation, a strong mesovortex embedded in the main rainband closely agreed in position and timing with one of the observed tornadoes. Model diagnostics, namely the UH and the vertically averaged OW parameter, were examined and demonstrated strong utility for predicting possible tornado formation. The UH successfully identified the potential for mesocyclone development, whereas the OW parameter indicated the presence of mesocyclones. Since mesocyclones are a necessary (but not sufficient) precursor to tornado formation, both parameters also provide indications of the risk of tornado formation, suggesting that there is a potential for broader operational use of these diagnostic tools in forecasting severe convection.
Coherent tracks of high values of UH and OW both indicated potential tornado paths, which can provide useful guidance to forecasters alongside other storm-scale metrics and environmental information. More research is, however, needed to determine appropriate UH thresholds that best predict tornado pathlengths. For future work it is also necessary to look at more tornadic case studies from Australia, as well as non-tornadic storms, to better understand how these diagnostics compare in other cases.
The ensemble simulations highlight the uncertainty associated with timing, location, structure and intensity of the convective systems that spawned the tornadoes. Although each of the members indicated some potential for tornado formation, this potential varied in magnitude, timing and location between the members. It may not be appropriate to assign a numerical probability to tornado formation in this case since the ensemble has not been calibrated for this purpose. Nevertheless, such an ensemble would have strongly supported a forecast of a high risk of tornado formation.
This ensemble simulation also presents a good example of an important advantage of ensembles over deterministic simulations. The control member of the ensemble (i.e. the unperturbed member 0) provided a more modest indication of tornadoes, especially to the north of the region of interest, as did two of the others. If any of these had been the sole deterministic member available, the forecasters would not have received as strong an indication of the potential for tornadoes. A single deterministic forecast can be regarded as a random choice from the set of all possible ensemble members. Although in this case the deterministic forecast happened to strongly indicate tornado risk, it could well have been weaker. The most extreme forms of severe weather are, almost by definition, rare events. Thus, the use of an ensemble reduces the chances that the numerical guidance will unluckily miss the true magnitude of the event.
Acknowledgements
We are grateful to Dean Sgarbossa for insightful discussions and ideas and to Charmaine Franklin, Shaun Cooper and Harvey Ye for their help in setting up the nesting suite. We also thank Chris Short (Met Office) for his assistance with setting up and running of the ensemble suite and Matthew Bass, Jonathan Fischer and Harald Richter for helpful discussions during earlier stages of work. We thank Leon Majewski and Valentin Louf for providing satellite and radar images, and Barry Hanstrum and Shaun Cooper for providing valuable comments on an earlier version of the manuscript. We thank the two anonymous reviewers for their constructive comments, which greatly improved quality of this manuscript. Preliminary results from this case study have been presented as an extended abstract at the Bushfire and Natural Hazards CRC Research Forum (non-peer reviewed); Australian Journal of Emergency Management, monograph number 5, 2019. This research was undertaken with the assistance of resources and services from the National Computational Infrastructure (NCI), which is supported by the Australian Government.
References
Allen JT, Allen ER (2016) A review of severe thunderstorms in Australia. Atmospheric Research 178–179, 347-366.
| Crossref | Google Scholar |
Bell GD, Keyser D (1993) Shear and curvature vorticity and potential-vorticity interchanges: interpretation and application to a cutoff cyclone event. Monthly Weather Review 121, 76-102.
| Crossref | Google Scholar |
Bowler NE, Arribas A, Mylne KR, Robertson KB, Beare SE (2008) The MOGREPS short-range ensemble prediction system. Quarterly Journal of the Royal Meteorological Society 134, 703-722.
| Crossref | Google Scholar |
Bryan GH, Wyngaard JC, Fritsch JM (2003) Resolution requirements for the simulation of deep moist convection. Monthly Weather Review 131, 2394-2416.
| Crossref | Google Scholar |
Bunkers MJ, Barber DA, Thompson RL, Edwards R, Garner J (2014) Choosing a universal mean wind for supercell motion prediction. Journal of Operational Meteorology 2, 115-129.
| Crossref | Google Scholar |
Bureau of Meteorology (2016a) Severe thunderstorm and tornado outbreak South Australia 28 September 2016. (BOM: Melbourne, Vic., Australia) Available at http://www.bom.gov.au/weather-services/severe-weather-knowledge-centre/thunderstorm-reports/Severe_Thunderstorm_and_Tornado_Outbreak_28_September_2016.pdf
Bureau of Meteorology (2016b) BNOC Operations Bulletin Number 107: APS2 Upgrade to the ACCESS-R Numerical Weather Prediction System. (BOM: Melbourne, Vic., Australia) Available at http://www.bom.gov.au/australia/charts/bulletins/apob107-external.pdf
Bureau of Meteorology (2016c) Monthly Weather Review Australia September 2016. (BOM: Melbourne, Vic., Australia) Available at http://www.bom.gov.au/climate/mwr/aus/mwr-aus-201609.pdf
Bush M, Allen T, Bain C, et al. (2020) The first Met Office Unified Model–JULES regional atmosphere and land configuration, RAL1. Geoscientific Model Development 13, 1999-2029.
| Crossref | Google Scholar |
Charney JG, Phillips NA (1953) Numerical integration of the Quasigeostrophic Equations for barotropic and simple baroclinic flows. Journal of the Atmospheric Sciences 10, 71-99.
| Crossref | Google Scholar |
Clark AJ, Kain JS, Marsh PT, Correia J, Xue M, Kong F (2012) Forecasting tornado pathlengths using a three-dimensional object identification algorithm applied to convection-allowing forecasts. Weather Forecasting 27, 1090-1113.
| Crossref | Google Scholar |
Clark AJ, Gao J, Marsh PT, Smith T, Kain JS, Correia J, Xue M, Kong F (2013) Tornado pathlength forecasts from 2010 to 2011 using ensemble updraft helicity. Weather Forecasting 28, 387-407.
| Crossref | Google Scholar |
Coffer BE, Parker MD (2017) Simulated supercells in nontornadic and tornadic VORTEX2 environments. Monthly Weather Review 145, 149-180.
| Crossref | Google Scholar |
Davies-Jones R (2015) A review of supercell and tornado dynamics. Atmospheric Research 158–159, 274-291.
| Crossref | Google Scholar |
Dial GL, Racy JP, Thompson RL (2010) Short-term convective mode evolution along synoptic boundaries. Weather Forecasting 25, 1430-1446.
| Crossref | Google Scholar |
Edwards R (2012) Tropical cyclone tornadoes: a review of knowledge in research and prediction. Electronic Journal of Severe Storms Meteorology 7, 1-61.
| Crossref | Google Scholar |
Fujita TT (1981) Tornadoes and downbursts in the context of generalized planetary scales. Journal of the Atmospheric Sciences 38, 1511-1534.
| Crossref | Google Scholar |
Gallo BT, Clark AJ, Dembek SR (2016) Forecasting tornadoes using convection-permitting ensembles. Weather Forecasting 31, 273-295.
| Crossref | Google Scholar |
Hanley KE, Barrett AI, Lean HW (2016) Simulating the 20 May 2013 Moore, Oklahoma tornado with a 100-metre grid-length NWP model. Atmospheric Science Letters 17, 453-461.
| Crossref | Google Scholar |
Hanstrum BN, Mills GA, Watson A, Monteverdi JP, Doswell CA (2002) The cool-season tornadoes of California and southern Australia. Weather Forecasting 17, 705-722.
| Crossref | Google Scholar |
Kain JS, Weiss SJ, Bright DT, et al. (2008) Some practical considerations regarding horizontal resolution in the first generation of operational convection-allowing NWP. Weather Forecasting 23, 931-952.
| Crossref | Google Scholar |
Kain JS, Dembek SR, Weiss SJ, Case JL, Levit JJ, Sobash RA (2010) Extracting unique information from high-resolution forecast models: monitoring selected fields and phenomena every time step. Weather Forecasting 25, 1536-1542.
| Crossref | Google Scholar |
Markowski P, Majcen M, Richardson Y, Marquis J, Wurman J (2011) Characteristics of the wind field in three nontornadic low-level mesocyclones observed by the Doppler on Wheels radars. E-Journal of Severe Storms Meteorology 6, 1-48.
| Crossref | Google Scholar |
Okubo A (1970) Horizontal dispersion of floatable particles in the vicinity of velocity singularities such as convergences. Deep Sea Research and Oceanographic Abstracts 17, 445-454.
| Crossref | Google Scholar |
Puri K, Dietachmayer G, Steinle P, et al. (2013) Implementation of the initial ACCESS numerical weather prediction system. Australian Meteorological and Oceanographic Journal 63, 265-284.
| Crossref | Google Scholar |
Quinting JF, Catto JL, Reeder MJ (2019) Synoptic climatology of hybrid cyclones in the Australian region. Quarterly Journal of the Royal Meteorological Society 145, 288-302.
| Crossref | Google Scholar |
Sgarbossa D, Fischer J, Bass M, Taylor J (2018) The end-to-end convective hazard risk forecast process developed by the Australian Extreme Weather Desk for the South Australian 28 September 2016 tornado outbreak. In ‘29th Conference on Severe Local Storms’, 22–26 October 2018, Stowe, VT, USA. Paper 128. (American Meteorological Society) Available at https://ams.confex.com/ams/29SLS/webprogram/Manuscript/Paper355711/Sgarbossa%20et%20al%20-%20Extended%20Abstract.pdf
Snook N, Xue M, Jung Y (2019) Tornado-resolving ensemble and probabilistic predictions of the 20 May 2013 Newcastle–Moore EF5 tornado. Monthly Weather Review 147, 1215-1235.
| Crossref | Google Scholar |
Sobash RA, Kain JS, Bright DR, Dean AR, Coniglio MC, Weiss SJ (2011) Probabilistic forecast guidance for severe thunderstorms based on the identification of extreme phenomena in convection-allowing model forecasts. Weather Forecasting 26, 714-728.
| Crossref | Google Scholar |
Sobash RA, Romine GS, Schwartz CS, Gagne DJ, Weisman ML (2016a) Explicit forecasts of low-level rotation from convection-allowing models for next-day tornado prediction. Weather Forecasting 31, 1591-1614.
| Crossref | Google Scholar |
Sobash RA, Schwartz CS, Romine GS, Fossell KR, Weisman ML (2016b) Severe weather prediction using storm surrogates from an ensemble forecasting system. Weather Forecasting 31, 255-271.
| Crossref | Google Scholar |
Thompson RL, Smith BT, Grams JS, Dean AR, Broyles C (2012) Convective modes for significant severe thunderstorms in the contiguous United States. Part II: supercell and QLCS tornado environments. Weather Forecasting 27, 1136-1154.
| Crossref | Google Scholar |
Trapp RJ, Tessendorf SA, Godfrey ES, Brooks HE (2005) Tornadoes from squall lines and bow echoes. Part I: climatological distribution. Weather Forecasting 20, 23-34.
| Crossref | Google Scholar |
Weisman ML, Trapp RJ (2003) Low-level mesovortices within squall lines and bow echoes. Part I: overview and dependence on environmental shear. Monthly Weather Review 131, 2779-2803.
| Crossref | Google Scholar |
Weiss J (1991) The dynamics of enstrophy transfer in two-dimensional hydrodynamics. Physica D: Nonlinear Phenomena 48, 273-294.
| Crossref | Google Scholar |
Zhang Y, Zhang F, Stensrud DJ, Meng Z (2015) Practical predictability of the 20 May 2013 tornadic thunderstorm event in Oklahoma: sensitivity to synoptic timing and topographical influence. Monthly Weather Review 143, 2973-2997.
| Crossref | Google Scholar |