Using global navigation satellite system data for real-time moisture analysis and forecasting over the Australian region I. The system
John Le Marshall A B E , Robert Norman B , David Howard A , Susan Rennie A , Michael Moore C , Jan Kaplon D , Yi Xiao A , Kefei Zhang B , Carl Wang C , Ara Cate B , Paul Lehmann A , Xiaoming Wang B , Peter Steinle A , Chris Tingwell A , Tan Le A , Witold Rohm D and Diandong Ren AA Bureau of Meteorology, GPO Box 1289, Melbourne, Vic. 3001, Australia.
B RMIT University, Melbourne, Vic., Australia.
C Geoscience Australia, Canberra, ACT, Australia.
D Wroclaw University, Wroclaw, Poland.
E Corresponding author. Email: john.lemarshall@bom.gov.au
Journal of Southern Hemisphere Earth Systems Science 69(1) 161-171 https://doi.org/10.1071/ES19009
Submitted: 11 December 2018 Accepted: 11 July 2019 Published: 11 June 2020
Journal Compilation © BoM 2019 Open Access CC BY-NC-ND
Abstract
The use of high spatial and temporal resolution data assimilation and forecasting around Australia’s capital cities and rural land provided an opportunity to improve moisture analysis and forecasting. To support this endeavour, RMIT University and Geoscience Australia worked with the Bureau of Meteorology (BoM) to provide real-time GNSS (global navigation satellite system) zenith total delay (ZTD) data over the Australian region, from which a high-resolution total water vapour field for SE Australia could be determined. The ZTD data could play an important role in high-resolution data assimilation by providing mesoscale moisture data coverage from existing GNSS surface stations over significant areas of the Australian continent. The data were used by the BoM’s high-resolution ACCESS-C3 capital city numerical weather prediction (NWP) systems, the ACCESS-G3 Global system and had been used by the ACCESS-R2-Regional NWP model. A description of the data collection and analysis system is provided. An example of the application of these local GNSS data for a heavy rainfall event over SE Australia/Victoria is shown using the 1.5-km resolution ACCESS-C3 model, which was being prepared for operational use. The results from the test were assessed qualitatively, synoptically and also examined quantitatively using the Fractions Skills Score which showed the reasonableness of the forecasts and demonstrated the potential for improving rainfall forecasts over south-eastern Australia by the inclusion of ZTD data in constructing the moisture field. These data have been accepted for operational use in NWP.
1 Introduction
Atmospheric water vapour is highly variable in time and space and its determination is a vital component of accurate, high-resolution analysis. It is also important in terms of forecast accuracy. A dearth of high-resolution water vapour observations can be a significant cause of analysis error and lead to poor initialisation of a numerical weather prediction (NWP) model. The development of a global navigation satellite system (GNSS)-based system to improve moisture analysis and forecasting over Australia is, therefore, an important strengthening of current high-resolution moisture analysis and forecasting capability and is anticipated to provide an improved basis for both moisture and precipitation forecasting (Ducrocq et al. 2002; Yan et al. 2008; Bennitt and Jupp 2012; de Haan 2013).
Moisture-related observations in the form of the GNSS zenith total delay (ZTD) are a relatively new source of mesoscale humidity information with ZTD being obtained from networks of ground-based GNSS receivers providing horizontally dense information on the distribution of total water vapour. An advantage of GNSS ZTD observations is that they are nearly continuous with high temporal resolution (15 min) and are useful in nearly all weather situations. In Australia, these data are additionally important as they add valuable information in a data sparse region. Furthermore, we are currently in an environment where there is an increasing number of ground-based global positioning system (GPS) receivers, capable of providing this information, being established across Australia. As a result, the availability of ZTD data across the continent is expected to increase considerably over the coming years.
Activity has already been focused on improving the Bureau of Meteorology’s (BoM’s) moisture analyses (see, e.g. Le Marshall et al. 2014); however, there still remains a requirement for improving the quality of moisture analyses particularly over land. These analyses can be improved, for example, by expanded use of METARS and Automatic Weather Stations, by better use of hyperspectral sounder data in the lower troposphere (e.g. Le Marshall et al. 2014, op cit) and by including improved specification of the surface infrared emissivity (Smith, Pers. Comm.). Another way of improving moisture analysis is by the use of GNSS satellite to ground data.
In this study we wished to determine if the incorporation of GNSS ZTD data into the assimilation database can assist in the modelling of moisture and, in particular, in the modelling and prediction of rainfall. The addition of the ZTD data is expected to be of utility as it can estimate total water vapour to ~2-mm accuracy and is available in areas often devoid of middle and lower tropospheric moisture data. This has been studied in other works overseas with mixed results and these are noted in Section 3. Australia presents a unique opportunity for this work because of the high density and coverage of the still expanding GNSS surface networks.
Here we have used an Australia wide network of GPS receiving stations to provide ZTD data every quarter hour or every hour and have incorporated these data into Australian region scale and state scale data assimilation systems to improve moisture analysis and to provide high-resolution forecasts over the Australian region, particularly Victoria. Related work has also been done to show the utility of the ZTD data when used in conjunction with satellite sounding data, for example microwave sounding data, to improve moisture fields over the Australian region.
2 The global navigation satellite system data-processing systems
2.1 Background
The measured ZTD is the delay in reception of a signal from a GPS satellite which is directly overhead as a result of the presence of the neutral atmosphere and is expressed in terms of excess path length (Bevis et al. 1992). Slant path delays are mapped to the zenith using a mapping function, for example Neill (1996). ZTD is related to the refractivity along the signal path by

where za is antenna height (m) and N is the neutral atmosphere refractivity. Expanding N provides

where Rd = 287.05 J kg−1 K−1 is the gas constant of dry air, ρ is the water vapour density (kg m−3) and Є = 0.62 is the ratio of molar weights. The empirical constants are k1 = 77.6 K hPa−1, k2 = 70.4 K hPa−1 and k3 = 373 900 K2 hPa−1 (Thayer 1974). ZTD has two components, the delay due to hydrostatic pressure and the delay due to the water vapour along the path (Bengtsson et al. 2003). Minimisation of a cost function which takes account of the observed ZTD during the meteorological analysis improves the determination of atmospheric water vapour amount around the signal path.
The near real-time systems estimating the tropospheric parameters ZTD and ZTD gradients for Australia used here are run by RMIT University and Geoscience Australia (GA). They require access to GNSS data/information in real time or close to real time. The supporting data types required for GNSS data processing are precise ultra-rapid (UR) GNSS satellites orbit and clock data, satellite differential code biases, global ionosphere maps, satellite health data, earth’s pole offsets, receivers and satellite antenna phase centres, nutation data, subdaily pole offsets, solid earth tide data, ocean tide data, ocean and atmosphere tide loadings.
These data types have been processed with Bernese GNSS Software 5.2 (Dach et al. 2007; Dach and Walser 2015) and have been downloaded automatically each hour by the processing systems which also download and store RINEX (Receiver Independent Exchange Format) files with GNSS observation data.
2.2 The sources of global navigation satellite system observation data
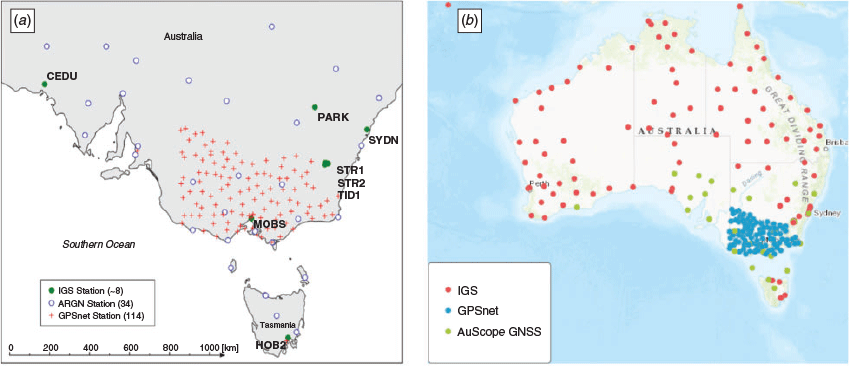
There are a number of key sources of GNSS observational data that have been used for tropospheric parameter estimation for Australia/Victoria. The first one is the IGS (International GNSS Service) network, which for Victoria has 8 IGS stations located in or within 1000-km radius from Victoria. The stations are Ceduna, Hobart, Melbourne, Parkes, Mt Stromlo1, Mt Stromlo2, Sydney and Tidbinbilla. Another source is the APREF (Australia Pacific Reference Network) with 34 stations of the ARGN (Australia Reference Geodetic Network) located in or within the 1000-km radius from the Victoria. A third source is the GPSnet® network operated by the Victorian Government with 114 stations. The distribution of stations is seen in Fig. 1. These sources provide a total of 146 stations. Access to these three networks in the case of RMIT University, for example is organised in near real time for IGS and APREF data by ftp download, and for the GPSnet® network in real time, by the storing streams from all stations. Over the whole of Australia we have over 256 GNSS stations now available for this activity and the number is quickly increasing.
2.3 The RMIT University processing methodology
A number of processing scenarios were investigated with respect to ZTD estimation in real or near real time at RMIT University. The first was use of the double difference (DD) solution without integer ambiguity resolution. The second method was use of the DD solution with ambiguity resolution. This method is slower because of multiple ambiguity estimations. The network solutions implemented were based on the standard Bernese RINEX to SINEX (Site Independent Exchange Format) automated processing scheme. The DD processing strategy included different ionosphere handling and ambiguity resolution methods dependent on baseline length. The Final ZTDs estimation was done using the Saastamoinen model (Saastamoinen 1972) and GMF (Global Mapping Function) wet and dry mapping functions. The model for horizontal gradients of ZTDs was Chen and Herring (1997). Relative constraining of ±3 mm for ZTD was applied over a 1-h interval to avoid ‘jumps’ in tropospheric parameters.
In the DD scenario with fixed ambiguity resolution, the minimum constraint condition is applied over all epoch station coordinates. Reference coordinates of the ARGN and GPSnet stations are estimated from the solutions of the last 14 days with minimum constraint conditions on IGS station positions and velocities in separate Bernese scenarios. In the scenario without ambiguity resolution, heavy constraining on all stations coordinates (0.000001 m) is applied. It was found that both solutions are viable and produce ZTDs of similar quality.
To smooth and improve the ZTD time-series, the joint estimations of ZTDs from the few last stored solutions are commonly made (Dousa and Bennitt 2013). This approach was also applied to the near-real-time service, that is, the stacking of the last 7 normal equation files stored by the Bernese software and to the re-estimation of troposphere parameters. The single window solution for an hour covered the last 6 h and the stacked solution for the hour covered the last 7 normal equations and contained the ZTDs and gradients for the last 12 h.
2.3.1 Quality assessment of the estimated zenith total delay
Initially the ZTD results were compared to the Rapid ZTD product from the CODE Analysis Centre (Switzerland) for the IGS network. Because no other processing centres were disseminating the ZTD results for ARGN and GPSnet® networks, the comparison was only possible on IGS stations. For the six stations processed the bias was mostly in the range ±1.5 mm, and the standard deviation was mostly near to or below 6.5 mm for the 77-day period studied (day 91–168 of 2015).
The fixed and float versions of the network processing services have been operating in real time since day 91 of 2015. Quality assessment of ZTDs was also undertaken with respect to FINAL IGS ZTD product for same 77 days. After consideration of results from comparisons with the CODE Analysis Centre Data and the FINAL IGS ZTD product, it was decided to employ a DD solution, calculated using a 6-h window with fixed ambiguity resolution for NWP application.
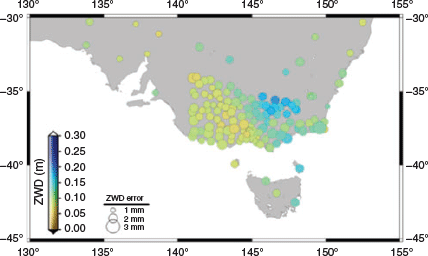
Figure 2 shows a typical product from the RMIT University system, namely zenith wet delay in metres over Victoria, calculated at 0000 UTC 29 May 2018.
|
2.4 The Geoscience Australia processing methodology
GA routinely produces ZTD data. GA employs a precise point positioning (PPP) processing strategy using the Bernese 5.2 software package. To estimate the near-real-time ZTD, it relies upon the IGS Real Time clock products and IGS UR orbits. ZTD estimates are provided every hour with a latency of ~40 min from ~160 stations around Australia. Here GA uses a sliding window of 24 h of raw observations obtained from real-time streams sourced from the ARGN, Auscope, South Pacific and LINZ GPS networks. To help validate the ZTD estimates, GA also produces a rapid (R) solution, which relies upon the rapid IGS orbit and clock products. For the rapid solution, GA processes over 600 stations from a global network dominated by stations in the Asia Pacific region. The system has been established in the Amazon Web Services cloud to help aid in reliability and scalability.
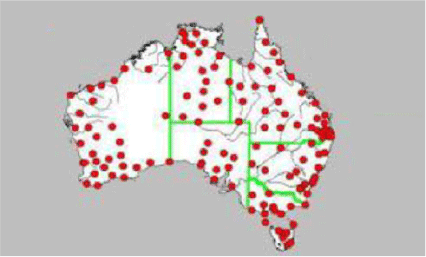
The distribution of GNSS stations used by GA is shown in Fig. 3. This is a subset of the stations in Fig. 1b; however, the GA component of the database is still increasing.
|
2.4.1 Quality assessment of estimated zenith total delay
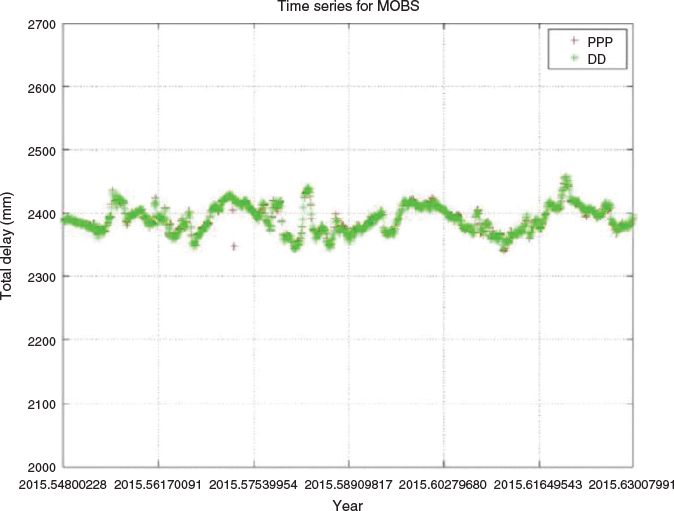
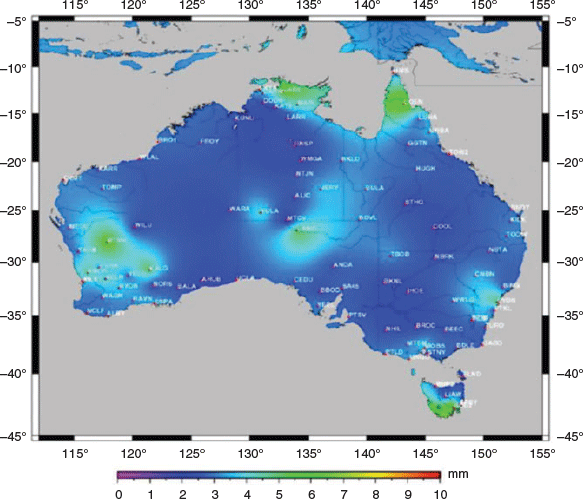
Comparison between PPP (IGS Rapid) and DD (IGS Final) ZTD data from Geoscience data was performed as part of basic testing. The derived ZTD from DD was the reference. The period of comparison was from day 200 to day 229, 2015, when the number of GPS stations was 110. There were 13 stations with root-mean-square (RMS) differences between 4 and 9 mm when comparing PPP with DD results. The RMS differences for the others were between 1 and 4 mm. The results of testing showed good agreement between the two strategies. Figure 4 is the comparison between PPP and DD for the MOBS (Melbourne) station. The distribution of RMS differences for all stations is shown in Fig. 5. The UR orbit + IGS02 clock combination was chosen for near-real-time ZTD production. Output from the system during the period from 12 July 2016 to 31 July 2016 was evaluated. In general, ~93% of GPS stations can provide the UR ZTD derived from UR processing with less than 5% difference compared to R ZTD from daily processing.
|
|
GA has constructed a system and started routinely producing two ZTD estimation products by using the PPP strategy through Bernese software package. To estimate the near-real-time ZTD, GA relies upon the IGS Real Time clock products and the IGS UR orbits. ZTD estimates derived from the sliding window of 24 h of raw observations are provided every hour with a latency of ~40 min from ~160 stations.
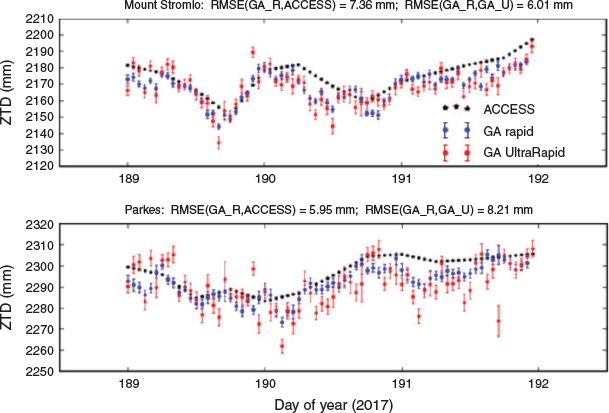
Figure 6 shows a typical product from the GA system, namely ZTD in millimetres over Mount Stromlo and Parkes, compared to the current operational nondata assimilating ACCESS-C2 and GA Rapid and UR Data.
|
3 The assimilation of global navigation satellite system ZTD data
The assimilation of ZTD observations in NWP has been described in several studies. A number of the studies have shown a positive impact of GNSS ZTD observations on NWP systems at a horizontal model grid resolution of the order of 10 km (De Pondeca and Zou 2001; Vedel and Huang 2004; Cucurull et al. 2004; Faccani et al. 2005; Poli et al. 2007; MacPherson et al. 2008; Yan et al. 2009a, 2009b; Boniface et al. 2009; Benjamin et al. 2010; Shoji et al. 2011; Bennitt and Jupp 2012).
Poli et al. (2007) noted an improvement in synoptic scale circulation over 24–96 h and some improvement in precipitation patterns. Yan et al. (2009a, 2009b) and Boniface et al. (2009) noted some positive impact on precipitation forecasts. MacPherson et al. (2008) noted positive impact on forecasts of precipitation amounts by assimilating ZTD observations into the Environment Canada regional NWP model. The complementary benefits of using GNSS data with other observation types has also been demonstrated in a number of studies (Cucurull et al. 2004; Sánchez-Arriola and Navascués 2007; de Haan 2013; Sánchez-Arriola et al. 2016). Initial assessments of the impact of the assimilation of these data at near kilometre horizontal resolution demonstrate their potential impact and are recorded in studies such as Seity et al. (2011), de Haan (2013) and Sánchez-Arriola et al. (2016). As a result of these and other studies GNSS ZTD data are now assimilated operationally at some operational NWP Centres.
3.1 The data assimilation system
The assimilation system used in this study is the BoM’s future operational ACCESS-C3 system. The ACCESS system was implemented as an update to the Bureau’s NWP and climate modelling capabilities (Puri et al. 2013). The ACCESS system is based on the UK Met Office atmospheric model. It is used operationally in real time in the Bureau’s National Operations Centre (NOC). The ACCESS-C3 system used here has a domain covering Victoria and Tasmania. It has a horizontal resolution of near 1.5 km stretching out to 4 km at its border and it has 80 vertical levels. The ACCESS-C system uses the UK Met. Office unified model (UKUM) and the associated four-dimensional variational assimilation (4DVAR) analysis system, the UK Met. Office observation processing system (OPS) and the surface fields processing system (SURF). An update to the SST (sea surface temperature) and soil moisture was performed daily. The SST update came from the operational Regional SST product (Beggs et al. 2011), and the soil moisture came from the ACCESS-G analysis, with higher resolution features provided by the soil property ancillaries.
The ACCESS-C suite runs with a 1-h cycle, 24 times per day (0000, 0100, 0200, 0300 UTC etc.), using observations from OPS in the 4DVAR analysis. The domain is nested in 12-km resolution ACCESS-R2 with boundary conditions updated at 0300, 0900, 1500 and 2100 UTC.
3.2 The data assimilation methodology
An initial data assimilation trial with GNSS data predominantly available from the high-density Victorian network examined a limited period in November/December 2015. The ACCESS-R 12-km resolution forecast model was used with 4DVAR (Puri et al. 2013). The ZTD observations values were assimilated directly into the model with the ZTD observation operator estimating the background ZTD using a model short-range forecast (Rawlins et al. 2007). The study was completed in 2015. After an assessment of the output from this study it was decided to set up a network collection and processing system suitable for operational use to provide ZTD data for the 1.5-km high-resolution data assimilating ACCESS C-3 forecast system, ACCESS-C3.
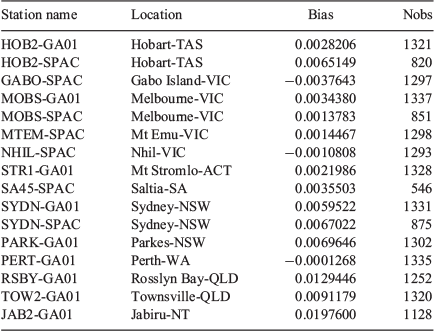
An example of the impact of these local GNSS ZTD data in ACCESS-C3 is provided in this study for a recent very heavy rainfall event over South East Australia, in particular over Victoria. This was a difficult operational forecast. In the data impact tests, the impact of using local GNSS ZTD observations on forecast accuracy over South East Australia/Victoria was examined. For the period studied, particularly 29 November–4 December 2017, four-dimensional variational assimilation was employed to assimilate the ZTD observations into the ACCESS system, namely the Victorian Capital City Model (ACCESS-C3), which provided forecasts out to 2 days. Both RMIT University and GA data were used, which provided a degree of redundancy and also protected against the effects of some problems, for example clock errors, which may affect one system (PPP) more than the other. Station/processing-centre biases were removed from the ZTD observations generated by RMIT University and GA before the assimilation was undertaken. This was done using monthly average biases from matchups computed from the observed ZTD data and forecast model fields at GNSS observation sites. An example of the bias associated with these matchups is seen in Table 1.
|
In this study the forecasts for the control run used the full next generation operational database to be used at the BOM for the third-generation ACCESS model, which included the data listed in Table 2. The experimental run was identical to the control run in all aspects except that it had the local ZTD data added to the full operational database used in the assimilation or analysis step. Typically, in the first assimilation period, 150–250 ZTD estimates or observations were provided to the system every hour.
4 The assimilation of global navigation satellite system–based zenith total delay observations in ACCESS C3 over Victoria, 29 November–4 December 2017
ZTD observations have been assimilated into the Bureau’s future operational 1.5-km ACCESS-C3 forecast model over South Eastern Australia/Victoria between 29 November and 4 December 2017. This period was chosen because it contained examples of no rain, light rain and flooding rain and had proved to be a difficult forecast period for operations. Incorporation of the additional moisture information contained in the ZTD data in the ACCESS-C3 analysis was anticipated to improve the C3 model’s moisture analysis and hence provide improved initial conditions for the C3 model’s forecasts. As noted, some investigators have reported to date that the use of the GNSS ZTD data has provided improvements in numerical modelling in relation to surface moisture and also rainfall prediction. In this case we have examined these and other elements over SE Australia/Victoria during the period of the study.
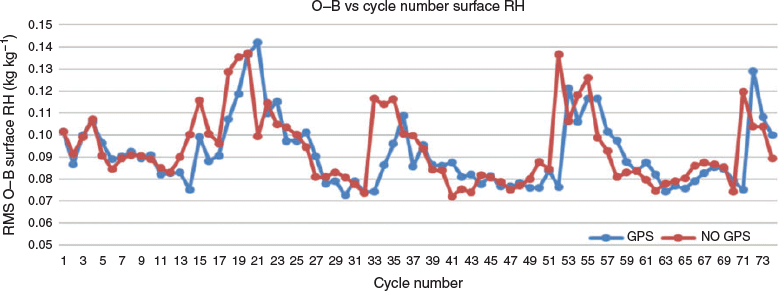
In relation to surface or lower tropospheric moisture, the GNSS observations have changed these model fields. An examination RMS observed minus background (O−B) relative humidity (the amount of water vapour present expressed as a fraction of the water vapour needed for saturation) statistics (Fig. 7) indicates the surface relative humidity RMS O−B value for the case with GNSS ZTD is slightly smaller than that for the case not using the ZTD data. In this case there also appears to be a small temporal delay in features of the relative humidity O−B vs time trace for the no GNSS ZTD data case.
For model level 20 (~2-km altitude) relative humidity, the O−B values are smaller more often than not when ZTD data have been used. It should be noted this is a quite small sample however, with results not to be generalised. The comments reflect only the reasonable nature of the results.
In relation to precipitation, the impact of the ZTD data on the ACCESS C3 forecasts is qualitatively visible in Figs 8–10. The quantitative impact of the ZTD data are seen in Figs 11 and 12 through the use of the Fractions Skill Score (Roberts and Lean 2008). In Fig. 8a, rainfall totals between 0000 UTC 30 November and 0000 UTC 1 December from the Bureau’s operational AWAP system (Jones et al. 2009) are shown (note colour shading for totals ranges from 4 to 400 mm of rain). The forecast rainfall totals for the same period for the control case (no ZTD data) Fig. 8b, and for the experimental case (with ZTD data) Fig. 8c shows different distributions of accumulated rainfall over western and central Victoria. The forecast rainfall maximum near Portland (on the left edge of the Victorian coastline) is a little better positioned in the case which used ZTD data (Fig. 8c), while the rainfall maximum to the NE of Melbourne is also a little better depicted in the forecast with ZTD data.

|

|

|

|
In Fig. 9a, rainfall totals between 0000 UTC on 1 December and 0000 UTC on 2 December as analysed by the operational AWAP system are shown (note colour shading for totals ranges from 4 to 400 mm of rain). The forecast rainfall totals between 0000 UTC on 1 December and 0000 UTC on 2 December for the control case Fig. 9b and for the experimental case with ZTD Fig. 9c again show differences in the distributions of forecast rainfall, this time over eastern and central Victoria. It can be seen that the case that used ZTD data has produced more realistic rainfall coverage over the western part of the State of Victoria. The heavy rain (>50 mm, light blue) to the north-east of Melbourne is a little better positioned, closer to Melbourne, for the system which used ZTD data.
In Fig. 10a, rainfall totals between 0000 UTC on 1 and 2 December as analysed by the operational AWAP system are again shown; however, the colour shading for the lower rainfall totals are changed, to highlight the 0.4–40 mm lower rainfall areas. The forecast totals between 0000 UTC on 1 and 2 December for the control case Fig. 9b and for the experimental case with ZTD Fig. 9c clearly show differences in the distributions of the forecast lighter rainfall over eastern and central Victoria. It is apparent that the forecast with ZTD data has produced better light rainfall coverage over the eastern part of the State of Victoria than the control forecast. The heavy rain (≥27 mm) over Western Victoria is coloured red.
In addition to qualitative/synoptic assessment of the rainfall forecasts, quantitative assessment of the rainfall accumulation fields has been undertaken using the Fractions Skill Score (Roberts and Lean 2008; Mittermaier and Roberts 2010). The Fractions Skill Score ranges from 0 (complete mismatch) to 1 (perfect match). If no events are forecast and some occur, or some occur and none are forecast, the score is 0. This metric was chosen because of its utility in the assessment of high-resolution (here 1.5-km resolution) forecast rain fields. It is now used routinely in the BoM and in other weather services to assess the utility of high-resolution rainfall forecasts. Its capacity to gauge the utility of the rainfall forecasts at differing scales and its ability to guard against the ‘double penalty’ problem in rainfall forecast verification is a key reason for the choice. A detailed description of the characteristics and benefits of the method are contained in the two references cited above. In this study, rainfall accumulations for 12- and 18-h forecasts at 0000, 0600, 1200 and 1800 UTC from ACCESS C-3 have been examined in terms of Fractions Skill Score using the Global Precipitation Measurement mission, IMERG (Integrated Multi-satellite Retrievals for GPM) – L (late) late run rainfall product (Huffman et al. 2015) for verification.
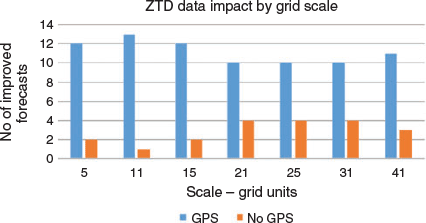
Figure 12a shows the Fractions Skill Score vs Scale (in grid units) for 12-h forecasts during the period 30 November to 4 December 2017, for forecasts where GPS data were and were not included in the forecast base. For the period of the trial, the 12-h forecast has shown improvement overall on average, at all grid scales when GPS data are used. It was also found for this period that the use of GPS data, on average, resulted in improved forecasts for each rainfall accumulation category (the categories are for accumulations greater than 0.5, 1, 4, 8, 12, 16 and 41 mm). Rainfall forecasts for 18 h were also examined for the same period. Figure 12b shows the Fractions Skill Score vs Scale for the same period. Again, for the period of the trial, the 18-h forecasts have shown improvement on average at all scales and it was also found that the forecast done using GPS data, on average, result improved forecasts for each rainfall accumulation category. Figure 13 shows the number of improved forecasts with ZTD data by scale when GPS data are used or not used in the forecast database. For the case studied at all scales, the number of forecasts improved by ZTD data exceeded the number not improved.
|
The results from this trial, which have been examined qualitatively/synoptically and also been examined quantitatively using the Fractions Skills Score, show the reasonableness of the forecasts and demonstrate the potential for improving rainfall forecasts over south-eastern Australia with the use of GNSS-based ZTD data.
5 Conclusions
For the first time, ZTD data provided by GNSS missions has been used in NWP to enhance moisture specification of the atmosphere at up to near 40-km resolution across south-eastern Australia. These observations have an accuracy (often equivalent to <2-mm RMS error in total water vapour) which enables them to be of potential benefit for NWP and to be of value in the Australian region, which is in the data sparse southern hemisphere. Here we have used ZTD, produced in real time/close to real time by RMIT University and GA, and this has resulted in an enhanced database for the specification of moisture fields in the ACCESS C3 system. The improved database has resulted in improvements to 12- and 18-h rainfall forecasts which have been measured using the Fractions Skill Score. The impact of the data will be further documented in part two of this paper as the C3 model is used in different seasons, as the networks providing ZTD data are further expanded and more forecasts using ZTD data are produced.
Of note is that these data are little affected by cloud and precipitation, in many areas are of high horizontal resolution and are near continuous in time. As a result, their use is well suited to NWP and climate studies. Their characteristics and their availability also complement the use of space-based meteorological sounders over land, where we have found a significant improvement in sounding moisture fields from using the ZTD data in conjunction with, for example space-based or ground-based microwave sounder radiances. In a related study, we have used synthetic ZTD/TPW (total precipitable water) vapour and microwave radiances sensed from the surface and space-based instruments to measure moisture profiles. Improvements in the retrieved profiles were found by solving the RTE (radiative transfer equation) using a nonlinear solver with a GFS (Global Forecast System) 6-h first guess. This use of ZTD data is found to provide a constraint on the total moisture fields which improves the moisture profile in an RMS sense and allows the ZTD data to potentially reduce bias or errors in the TPW field for use in NWP and in climate studies. In effect, it is anticipated the small errors of these observations will improve the absolute accuracy of analyses/reanalyses. Both these aspects are of importance in climate studies.
We also noted the comparison of ZTD observations with radiosonde moisture measurements indicates their utility for extending the monitoring of atmospheric moisture from around radiosonde network sites, to a fuller monitoring across the Australian region with new information including trends being revealed. In essence we believe that ZTD observations can delineate total water vapour or moisture trends away from radiosonde sites and importantly allow extension of the domain of climate quality moisture observations into data sparse areas often devoid of conventional upper air moisture information. This would indicate that ZTD data have the potential to make a very important and unique contribution to vital tasks such as climate monitoring, adding significantly to the spatial and temporal coverage provided by the radiosonde network.
Acknowledgements
We wish to acknowledge support through the Natural Disaster Resilience Grants Scheme (Victoria), funded by the National Disaster Resilience Program (NDRP) and the Australian Antarctic Science grant 4469. These grants have contributed to the efficient development and use of GNSS applications in meteorology in Australia and the Antarctic region. We wish to thank Ian Senior and Quang Quach of the Bureau of Meteorology and Dave Offler, Owen Lewis and Johnathon Jones of the UK Meteorological Office for their assistance in the establishment of this data collection, analysis and prediction system.
References
Beggs, H., Zhong, A., Warren, G., Alves, O., Brassington, G., and Pugh, T. (2011). RAMSSA—an operational, high-resolution, Regional Australian Multi-Sensor Sea surface temperature Analysis over the Australian region. Aust. Meteorol. Ocean 61, 1–22.| RAMSSA—an operational, high-resolution, Regional Australian Multi-Sensor Sea surface temperature Analysis over the Australian region.Crossref | GoogleScholarGoogle Scholar |
Bengtsson, L., Robinson, G., Anthes, R., Aonashi, K., Dodson, A., Elgered, G., Gendt, G., Gurney, R., Jietai, M., Mitchell, C., Mlaki, M., Rhodin, A., Silvestrin, P., Ware, R., Watson, R., and Wergen, W. (2003). The use of GPS measurements for water vapour determination. Bull. Amer. Meteor. Soc. 84, 1249–1258.
| The use of GPS measurements for water vapour determination.Crossref | GoogleScholarGoogle Scholar |
Benjamin, S. G., Jamison, B. D., Moninger, W. R., Sahm, S. R., Schwartz, B. E., and Schlatter, T. W. (2010). Relative short-range forecast impact from aircraft, profiler, radiosonde, VAD, GPS-PW, METAR and mesonet observations via the RUC hourly assimilation cycle. Mon. Wea. Rev. 138, 1319–1343.
| Relative short-range forecast impact from aircraft, profiler, radiosonde, VAD, GPS-PW, METAR and mesonet observations via the RUC hourly assimilation cycle.Crossref | GoogleScholarGoogle Scholar |
Bennitt, G., and Jupp, A. (2012). Operational assimilation of GPS zenith total delay observations into the met office numerical weather prediction models. Mon. Wea. Rev. 140, 2706–2719.
| Operational assimilation of GPS zenith total delay observations into the met office numerical weather prediction models.Crossref | GoogleScholarGoogle Scholar |
Bevis, M., Businger, S., Herring, T., Rocken, C., Anthes, R., and Ware, R. (1992). GPS meteorology: remote sensing of atmospheric water vapor using the Global Positioning System. J. Geophys. Res. 97, 15787–15801.
| GPS meteorology: remote sensing of atmospheric water vapor using the Global Positioning System.Crossref | GoogleScholarGoogle Scholar |
Boniface, K., Ducrocq, V., Jaubert, G., Yan, X., Brousseau, P., Masson, F., Champollion, C., Chery, J., and Doerflinger, E. (2009). Impact of high resolution data assimilation of GPS zenith delay on Mediterranean heavy rainfall forecasting. Ann. Geophys. 27, 2739–2753.
| Impact of high resolution data assimilation of GPS zenith delay on Mediterranean heavy rainfall forecasting.Crossref | GoogleScholarGoogle Scholar |
Chen, G., and Herring, T. A. (1997). Effects of atmospheric azimuthal asymmetry on the analysis of space geodetic data. J. Geophys. Res. 102, 20489–20502.
| Effects of atmospheric azimuthal asymmetry on the analysis of space geodetic data.Crossref | GoogleScholarGoogle Scholar |
Cucurull, L., Vandenberghe, F., Barker, D., Vilaclara, E., and Rius, A. (2004). Three-dimensional variational data assimilation of ground-based GPS ZTD and meteorological observations during the 14 December 2001 storm event over the Western Mediterranean Sea. Mon. Wea. Rev. 132, 749–763.
| Three-dimensional variational data assimilation of ground-based GPS ZTD and meteorological observations during the 14 December 2001 storm event over the Western Mediterranean Sea.Crossref | GoogleScholarGoogle Scholar |
Dach, R., Hugentobler, U., Fridez, P., and Meindl M. (Ed.). (2007). Bernese GPS software version 5.0. In: ‘User Manual’. (Astronomical Institute, University of Bern.) Available at http://www.bernese.unibe.ch/docs50/DOCU50.pdf [Verified 21 April 2020].
Dach, R., and Walser, P. (2015). Bernese GNSS software version 5.2 tutorial. In: ‘Processing Example, Introductory Course, Terminal Session’. (Astronomical Institute, University of Bern.) Available at http://www.bernese.unibe.ch/docs/TUTORIAL.pdf [Verified 21 April 2020].
De Haan, S. (2013). Assimilation of GNSS ZTD and radar radial velocity for the benefit of very-short-range regional weather forecasts. Q. J. R. Meteorol. Soc. 139, 2097–2107.
| Assimilation of GNSS ZTD and radar radial velocity for the benefit of very-short-range regional weather forecasts.Crossref | GoogleScholarGoogle Scholar |
De Pondeca, M. S., and Zou, X. (2001). A case study of the variational assimilation of GPS zenith delay observations into a mesoscale model. J. Climate Appl. Meteor. 40, 1559–1576.
| A case study of the variational assimilation of GPS zenith delay observations into a mesoscale model.Crossref | GoogleScholarGoogle Scholar |
Dousa, J., and Bennitt, G. (2013). Estimation and evaluation of hourly updated global GPS zenith total delays over ten months. GPS Solut. 17, 453–464.
| Estimation and evaluation of hourly updated global GPS zenith total delays over ten months.Crossref | GoogleScholarGoogle Scholar |
Ducrocq, V., Ricard, D., Lafore, J. P., and Orain, F. (2002). Storm-scale numerical rainfall prediction for five precipitating events over France: on the importance of the initial humidity field. Wea. Forecasting 17, 1236–1256.
| Storm-scale numerical rainfall prediction for five precipitating events over France: on the importance of the initial humidity field.Crossref | GoogleScholarGoogle Scholar |
Faccani, C., Ferretia, R., Pacione, R., Paolucci, T., Vespe, F., and Cucurull, L. (2005). Impact of a high density GPS network on the operational forecast. Adv. Geosci. 2, 73–76.
| Impact of a high density GPS network on the operational forecast.Crossref | GoogleScholarGoogle Scholar |
Huffman, G. J., Bolvin, D. T., Braithwaite, D., Hsu, K., Joyce, R., Kidd, C., Nelkin, E. J., and Xie, P. (2015). Algorithm Theoretical Basis Document (ATBD) version 4.5. In: ‘NASA Global Precipitation Measurement (GPM) Integrated Multi-satellite Retrievals for GPM (IMERG)’. Available at https://gpm.nasa.gov/sites/default/files/document_files/IMERG_ATBD_V4.5.pdf [Verified 14 May 2020].
Jones, D. A., Wang, W., and Fawcett, R. (2009). High-quality spatial climate data-sets for Australia. Aust. Met. Oceanogr. J. 58, 233–248.
| High-quality spatial climate data-sets for Australia.Crossref | GoogleScholarGoogle Scholar |
Le Marshall, J., Jung, J., Lee, J., Barnet, C., and Maddy, Eric S. (2014). Improving tropospheric and stratospheric moisture analysis with hyperspectral infrared radiances. Aust. Met. Oceanogr. J. 64, 283–288.
| Improving tropospheric and stratospheric moisture analysis with hyperspectral infrared radiances.Crossref | GoogleScholarGoogle Scholar |
Macpherson, S. R., De blonde, G., Aparicio, J., and Casati, B. (2008). Impact of NOAA ground-based GPS observations on the Canadian Regional Analysis and Forecast System. Mon. Wea. Rev. 136, 2727–2746.
| Impact of NOAA ground-based GPS observations on the Canadian Regional Analysis and Forecast System.Crossref | GoogleScholarGoogle Scholar |
Mittermaier, M., and Roberts, N. (2010). Intercomparison of spatial forecast verification methods: identifying skillful spatial scales using the fractions skill score. Wea. Forecasting 25, 343–354.
| Intercomparison of spatial forecast verification methods: identifying skillful spatial scales using the fractions skill score.Crossref | GoogleScholarGoogle Scholar |
Neill, A. E. (1996). Global mapping for the atmospheric delay at radio wavelengths. J. Geophys. Res. 111, 3227–3246.
| Global mapping for the atmospheric delay at radio wavelengths.Crossref | GoogleScholarGoogle Scholar |
Poli, P., Moll, P., Rabier, F., Desroziers, G., Chapnik, B., Berre, L., Healy, S. B., Andersson, E., and Guelai, F. Z. E. (2007). Forecast impact studies of zenith total delay data from European near real-time GPS stations in Meteo France 4DVAR. J. Geophys. Res. 112, 1–16.
| Forecast impact studies of zenith total delay data from European near real-time GPS stations in Meteo France 4DVAR.Crossref | GoogleScholarGoogle Scholar |
Puri, K., Dietachmayer, G., Steinle, P., Dix, M., Rikus, L., Logan, L., Naughton, M., Tingwell, C., Xiao, Y., Barras, V., Bermous, I., Bowen, R., Deschamps, L., Franklin, C., Fraser, J., Glowacki, T., Harris, B., Lee, J., Le, T., Roff, G., Sulaiman, A., Sims, H., Sun, X., Sun, Z., Zhu, H., Chattopadhyay, M., and Engel, C. (2013). Implementation of the initial ACCESS Numerical Weather Prediction system. Aust. Met. Oceanogr. J. 63, 265–284.
| Implementation of the initial ACCESS Numerical Weather Prediction system.Crossref | GoogleScholarGoogle Scholar |
Rawlins, F., Ballard, S. P., Bovis, K. J., Clayton, A. M., Li, D., Inverarity, D., Lorenc, A., and Payne, T. J. (2007). The Met Office Global 4-dimensional data assimilation scheme. Q. J. R. Meteorol. Soc. 133, 347–362.
| The Met Office Global 4-dimensional data assimilation scheme.Crossref | GoogleScholarGoogle Scholar |
Roberts, N. M., and Lean, H. W. (2008). Scale-selective verification of rainfall accumulations from high-resolution forecasts of convective events. Mon. Wea. Rev. 136, 78–97.
| Scale-selective verification of rainfall accumulations from high-resolution forecasts of convective events.Crossref | GoogleScholarGoogle Scholar |
Saastamoinen, J. (1972). Atmospheric correction for troposphere and stratosphere in radio ranging of satellites. In: ‘Geophysical Monograph’, pp. 247–252. (American Geophysical Union: Washington, DC, USA.)
Sánchez-Arriola, J., and Navascués B. (2007). Report on surface moisture impact study. In: ‘EU-FP5 TOUGH Project Deliverable D31’.
Sánchez-Arriola, J., Lindskog, M., Thorsteinsson, S., and Bojarova, J. (2016). Variational bias correction of GNSS ZTD in the HARMONIE modeling system. J. Appl. Meteor. Climatol , .
| Variational bias correction of GNSS ZTD in the HARMONIE modeling system.Crossref | GoogleScholarGoogle Scholar |
Seity, Y., Brousseau, P., Malardel, S., Hello, G., Benard, P., Bouttier, F., Lac, C., and Masson, V. (2011). The AROME-France convective-scale operational model. Mon. Wea. Rev. 139, 976–991.
| The AROME-France convective-scale operational model.Crossref | GoogleScholarGoogle Scholar |
Shoji, Y., Kunii, M., and Saito, K. (2011). Mesoscale data assimilation of Myanmar cyclone Nargis. Part II: Assimilation of GPS-derived precipitable water vapor. J. Meteorol. Soc. Japan 89, 67–88.
| Mesoscale data assimilation of Myanmar cyclone Nargis. Part II: Assimilation of GPS-derived precipitable water vapor.Crossref | GoogleScholarGoogle Scholar |
Thayer, G. D. (1974). An improved equation for the radio refractive of air. Radio Sci. 9, 803–807.
| An improved equation for the radio refractive of air.Crossref | GoogleScholarGoogle Scholar |
Vedel, H., and Huang, X.-Y. (2004). Impact of ground based GPS data on numerical weather prediction. J. Meteorol. Soc. Japan 82, 459–472.
| Impact of ground based GPS data on numerical weather prediction.Crossref | GoogleScholarGoogle Scholar |
Yan, X., Ducrocq, V., Poli1, P., Jaubert, G., and Walpersdorf, A. (2008). Mesoscale GPS zenith delay assimilation during a Mediterranean heavy precipitation event. Adv. Geosci. 17, 71–77.
| Mesoscale GPS zenith delay assimilation during a Mediterranean heavy precipitation event.Crossref | GoogleScholarGoogle Scholar |
Yan, X., Ducrocq, V., Poli, P., Hakam, M., Jaubert, G., and Walpersdorf, A. (2009a). Impact of GPS zenith delay assimilation on convective-scale prediction of Mediterranean heavy rainfall. J. Geophys. Res. 114, D03104.
| Impact of GPS zenith delay assimilation on convective-scale prediction of Mediterranean heavy rainfall.Crossref | GoogleScholarGoogle Scholar |
Yan, X., Ducrocq, V., Jaubert, G., Brousseau, P., Poli, P., Champollion, C., Flamant, C., and Boniface, K. (2009b). The benefit of GPS zenith delay assimilation to high resolution quantitative precipitation forecasts: a case-study from COPS IOP 9. Q. J. Roy. Meteor. Soc. 135, 1788–1800.
| The benefit of GPS zenith delay assimilation to high resolution quantitative precipitation forecasts: a case-study from COPS IOP 9.Crossref | GoogleScholarGoogle Scholar |

