
The effect of water currents on wind drag – a case study of tidal currents and sea breeze in a semi-enclosed embayment
S. M. Thurgate A *
A *
A Murdoch University, South Street, Murdoch, WA, Australia.
Journal of Southern Hemisphere Earth Systems Science 73(1) 1-16 https://doi.org/10.1071/ES22012
Submitted: 13 April 2022 Accepted: 2 December 2022 Published: 6 January 2023
© 2023 The Author(s) (or their employer(s)). Published by CSIRO Publishing on behalf of BoM. This is an open access article distributed under the Creative Commons Attribution-NonCommercial-NoDerivatives 4.0 International License (CC BY-NC-ND)
Abstract
The details of how energy and momentum are exchanged at the interface between ocean surface and the atmosphere is complex and the subject of new and more complete models. The need to improve models of how wind interacts with oceans is driven in part by the growth of offshore wind farms, and the need to predict their likely performance. The geographic features of Shark Bay allow several of the factors affecting the influence of currents on wind speed to be separated and analysed. Shark Bay is the largest semi-enclosed embayment on the Australian coast. It is tidal and aligned north–south in the direction of the sea breeze. The prevailing southerly wind, and the absence of openings to the ocean in the south of the bay, limits the fetch of waves, providing waves of predictable age in the bay with an absence of longer wavelength swell. The sea breeze in this region is characterised among the strongest and most reliable anywhere in the world. Although the tide heights are not large, the geography of the bay ensures strong tidal currents. Hence Shark Bay provides an excellent opportunity to study the effects of currents on winds. This study demonstrates that the effects of the tidal current are apparent in the wind speed record. It shows that simply subtracting a 29-day running average of the particular time of day from the wind speed reveals the effect of an incoming or outgoing tide. Time-series analysis of this outcome shows the periodicity and modulation of the tides. The analysis is further improved through using the Weather Research and Forecasting (WRF) code and subtracting its predictions from the raw data. Time-series analysis of the outcome demonstrates that the resultant difference has two diurnal and two semi-diurnal components with the correct periods and amplitudes of the known tidal variations in that region of Shark Bay. Hence the neglect of the interaction between water currents and wind stress is demonstrated to produce a systematic deviation in the predictions of the WRF from the measured wind values for Shark Bay.
Keywords: coastal, currents, forecasts, tidal, waves, weather, wind, WRF.
1. Introduction
There is increased interest in weather models that include an accurate account of the interaction between the atmosphere and waves on the sea surface. Reliable wind predictions are needed to aid the deployment of new offshore wind farms. The probable performance of these depends on accurate modelling of likely wind speeds, which in turn depends on accurate accounts of the exchange of momentum between the sea surface and the marine–atmospheric boundary layer (Villas Bôas et al. 2019; Deskos et al. 2021). There is also an increasing understanding of the two-way nature of the wind–wave interaction and its importance in driving currents and mixing water components (Villas Bôas et al. 2019). Similarly, there is an emerging understanding of changing wave fields as a consequence of climate change and their likely impact (Liu et al. 2022).
In this investigation, it is determined that the impact of changes in the direction of the tidal current in Shark Bay, through the mechanism of their influence on wave height and steepness, is apparent in the wind speed record at Shark Bay.
Shark Bay lies ~600 km north of Perth in Western Australia (Fig. 1). It is Australia’s largest semi-enclosed water body (Hetzel et al. 2013), extending some 250 km in a north–south direction, aligning it with the prevailing southerly winds, and it marks the western-most point of the Australian continent. The waters of Shark Bay cover 13 000 km2, being some 250 km long and 130 km wide.

|
A connection between tides and the sea breeze has been observed (Lee 2021) and modelled in previous studies (Kessler et al. 1985; Fischereit et al. 2016). In these studies, connections were made with changes to the surface roughness length and thermal balance that accompanies exposure of large intertidal regions and the consequent changes in the sea breeze. The work of Fischereit et al. (2016) demonstrates the complexity of these interactions. Their model includes two-way interactions between the air column model and the two-dimensional model of ocean currents and coast lines. This contrasts with the current investigation in which the interaction of tide and wind is in a region not dominated by a large intertidal region. However, a strong dependence on sea surface conditions and the direction of the tide is well known to mariners who navigate these waters (Schilder 1984). In this investigation, a strong correlation is demonstrated between the tides and 30 min wind speed record in Shark Bay. It is proposed that this correlation is due to the impact of changes in the direction of the tidal current on the wave height of the sea surface, causing changes in the surface roughness experienced by the air column.
Shark Bay is at latitude 26°S on the western coast of Australia, and so faces the Indian Ocean in the region of the Trade Winds. An analysis of the wind patterns on the coast of Western Australia has been completed by Pearce et al. (2015). They conclude that the area can be divided into three major regions. Shark Bay is in the west coast region, Learmonth to Cape Naturaliste. As such it experiences generally strong and persistent southerlies during summer with more variable winds in winter. Masselink and Pattiaratchi (2001) investigated the sea breeze at Perth and its surrounding areas. They concluded that the west coast region experienced strong sea breezes, though the sea breeze was not a ‘pure’ sea breeze as it blows obliquely onshore, rather than perpendicular to the shoreline (Miller et al. 2003). This they conclude is due to the interaction of the sea breeze with the geostrophic winds. The interaction of the sea breeze and geostrophic winds produces a resultant breeze that is largely southerly, reaching a maximum in the early afternoon, and swings from southerly to south-westerly. They characterise this sea breeze as among the most ‘energetic and consistent sea breeze systems in the world’ (Masselink and Pattiaratchi 2001). Our data show that the sea breeze at Shark Bay is consistent with the wind patterns of the sea breeze of the west coast region.
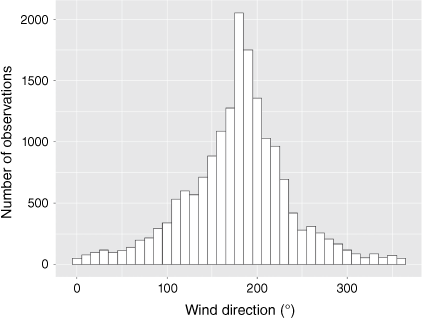
This study investigated the interaction of the tides with the sea surface state in the direction of the prevailing wind relative to the recording station at Denham. Fig. 2 shows that for most of the time the wind at Denham comes from the south, and so crosses the southern reaches of the Western Gulf before reaching the weather station.
|
The direction of the wind is important in this study as water waves travel in the direction of the wind that generates them (Phillips 1957). In this case, the prevailing southerly wind create waves that travel toward north. The inflow tidal current into Shark Bay comes primarily from the opening of the bay in the north (Hetzel et al. 2013), the Naturaliste Channel, between Dirk Hartog Island and Dorre Island (Fig. 1). Hence the major tidal flow direction south of Denham is from north to south on a rising tide and south to north on a falling tide. Thus, the primary tidal flow is either parallel to or anti-parallel to the direction of wave travel in the southern parts of the Western Gulf.
All wind speed and wind direction observations in this work come from the weather station at Shark Bay Airport, which is 4 km north-east of Denham. The relevant tide was assumed to be the tide at the location of the tide station at Useless Loop, as explained below. The locations of both Shark Bay Airport and Useless Loop are shown in Fig. 1.
Shark Bay was first explored by William de Vlamingh in 1697 (Schilder 1984). His first attempts to explore the Bay in 1697 were delayed for days when he found that his long boat was unable to cross the bay due to rough seas (Schilder 1984). Thus, difficult sea conditions are well known to users of Shark Bay, and the decline in sea conditions with the change in tide is well known to mariners (Lapworth 2011).
This study looks at the relationship between tidal flow and the wind speed in Shark Bay. It is proposed that the connection between these two comes from the change in wave height due to a change in current direction as the tide turns from incoming to outgoing. This is shown to have a measurable impact on the wind speed. The impact of changing water height with tide, and thus wave speed and wave height, is also investigated. It is found to play a negligible role.
2. Method
Wind speed, wind direction, atmospheric pressure and temperature, as measured by the Australian Bureau of Meteorology (BOM) weather station at Shark Bay Airport (ID 006105) were provided by BOM for all of 2020. This data recorded the weather station outputs every 30 min, using data taken at 1-min intervals, quality checked and averaged. The study used data from a full year to prevent bias towards a particular season.
The vegetation that lies between the station and the shoreline is low scrub with few, if any trees. The elevation of the area surrounding the weather station is low, staying beneath 50 m above sea level for all the Peron Peninsula. The weather station is a standard BOM automated weather station (AWS) and is mounted 10 m above the ground in accordance with the BOM specification (Bureau of Meteorology 1997) for such stations.
The tide data were computed from the table of predicted tide heights and times at Useless Loop (a village on the western side of Shark Bay, Fig. 1) for the year 2020, as distributed by BOM (Bureau of Meteorology 2019b). Note that the tidal variation at Useless Loop has both a diurnal and a semi-diurnal period, the component with the larger amplitude is diurnal (Burling et al. 2003). Typically, the tidal variation is less than 1 m, and so the intertidal area exposed during a low tide is not large. The amplitude of the tide is modulated to give ‘spring’ tides and ‘neap’ tides. The analysis required information on whether the tide was incoming or outgoing for every 30-min interval during 2020. This was determined by fitting sinusoids between the high-water heights and the low-water heights, at the corresponding times. The derivative of the tide height was used to determine if the tide was outgoing (negative value) or incoming (positive value). Nahas et al. (2005) modelled the tidal flows in Shark Bay and deduced that the magnitude of the mean tidal velocity in the southern parts of the Western Gulf was typically 0.3–0.4 m s–1 using the Hamburg Ocean Model – HAMSOM (Backhaus 1985).
A graph of the tide height for Denham for the period November–December 2020 from the tide table for Denham (Bureau of Meteorology 2019a) is shown in Fig. 3. The tide data for Useless Loop were used in this study as Useless Loop is in the southern reaches of the Western Gulf. The work of Burling et al. (2003) showed that the tidal amplitude is constant across the width of the gulf in this region. Hence the tide data for Useless Loop indicate the tidal state of the water, over which the wind crosses, which is measured from a southerly direction at Shark Bay Airport.

3. Sea breeze at Denham
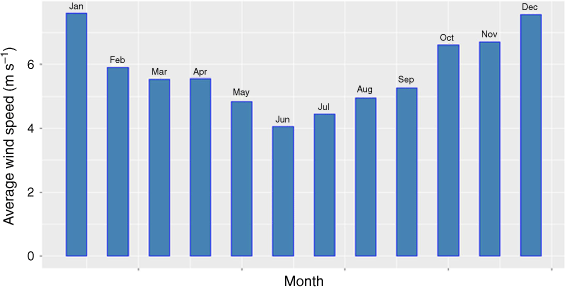
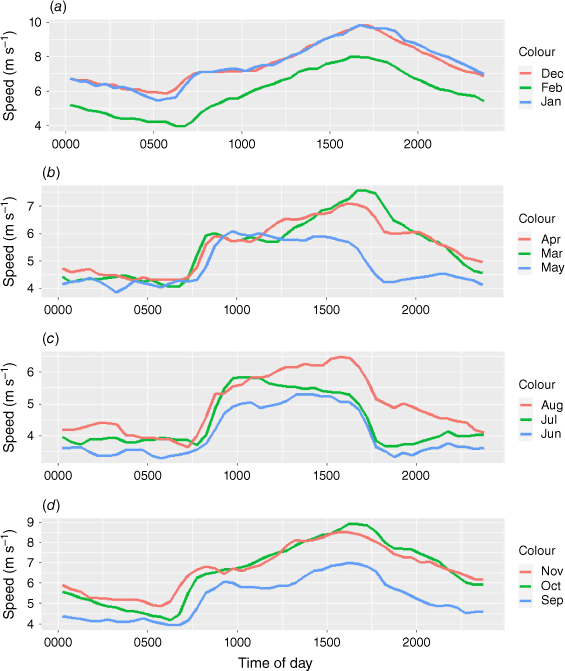
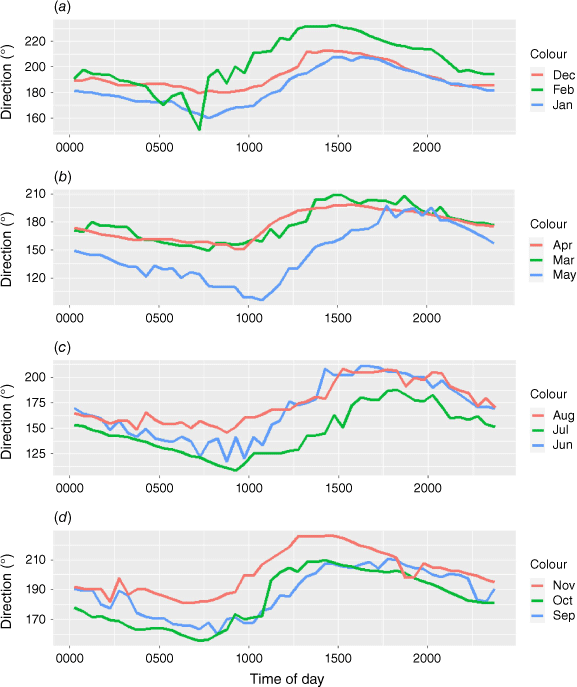
The monthly average wind speed for Shark Bay Airport in 2020 (Fig. 4) shows that the wind speed average is greater during the summer than the winter months. In December and January, the monthly average was ~7.5 m s–1, a strong average wind. The daily variations in monthly average wind speed for 2020 are shown in Fig. 5. It is clear from these data that the sea breeze reaches a maximum at c. 1700 hours in summer, and 1600 hours in winter. The daily variation in average wind direction for each month in 2020 is shown in Fig. 6. These data show that the sea breeze starts in the morning from ~180° in summer and swings to ~210°. In winter it starts ~120° and moves to ~200°.
|
|
|
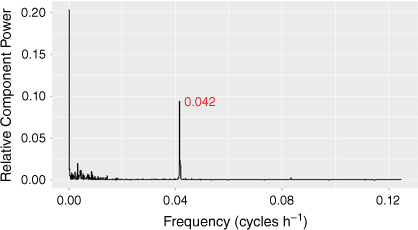
The power spectrum of the wind speed for Shark Bay Airport using data for 2020 is shown in Fig. 7. This spectrum illustrates the domination of the wind by the sea breeze. The largest component has a frequency of 0.0416 h–1, which is a period of 24 h. There is no evidence of strong harmonics of this diurnal frequency. There are some lower frequency components, presumably related to wind that accompany the passage of cold fronts and other pressure systems that cross the coast from the Indian Ocean.
|
Cyclones are a regular feature of the weather at Shark Bay. In 2020, the largest cyclone to pass through the area was Cyclone Mangga. In some of the following analysis, data for the period 20 May to 1 June were removed as these data corresponded to the passage of this cyclone through the Shark Bay region. The text indicates where this was done.
The characteristics of the sea breeze described by these data are similar to the data reported for Perth and the west coast region (Masselink and Pattiaratchi 2001; Pearce et al. 2015), including Shark Bay (Carnarvon Airport weather station ID 006011) and confirms that the wind patterns recorded at Shark Bay Airport weather station ID 006105 are typical of the west coast region of Western Australia.
4. Theory
Over-water surface roughness at higher wind velocities is due to the spectrum of wave height and steepness present at that wind speed. Greater wind speeds generate higher waves that can have larger roughness length (Taylor and Yelland 2001; Cavaleri et al. 2007). This dependence was first characterised by Charnock (1955) who proposed the following:
 (1)
(1)
where z0 is the roughness length, g the acceleration due to gravity, u* the friction velocity and zCh is a non-dimensional roughness parameter, the Charnock parameter. It has long been recognised that this is a simplification, and the Charnock parameter must be chosen to reflect characteristics of the wave field (Deskos et al. 2021).
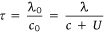
Any dependence on tidal current is likely to be a consequence of the change in wave height and steepness when the wave motion is opposite to the water current as compared to when the wave motion is in the same direction as the current. The dependence of water wave height and steepness on current is well known (Unna 1942; Hedges 1987). This dependence can be seen from the following set of relationships between the wave phase velocity c0 height H0 and wavelength λ0, in stationary water of depth h and their corresponding values c, H and λ for the same wave travelling in a current of velocity U.
 (2)
(2)
where k is 2π ÷ λ0. Equation 2 is applicable to water waves travelling in water of all depths (Phillips 1977). At an interface between stationary water and water travelling at velocity U, the requirement for continuity of the wave is that the period of the wave is constant. This gives the following (Unna 1942):
 (3)
(3)
The total energy in the wave is proportional to the square of the wave height and the energy of the wave will be conserved across the boundary, and so for waves travelling in water where H > λ ÷ 2 (Hedges 1987):
 (4)
(4)
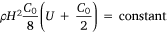
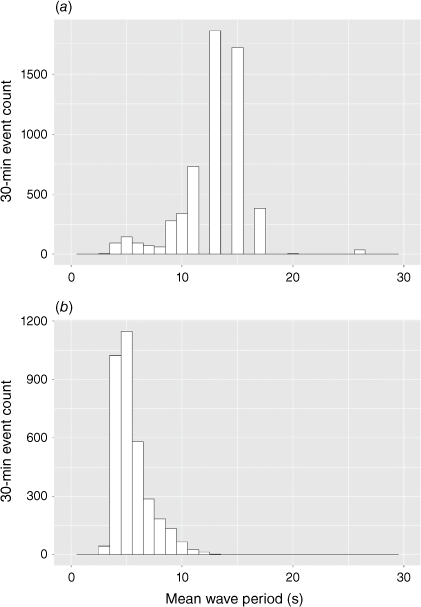
These three expressions can be used to find the ratio of the height of a wave of known wavelength travelling opposite to the direction of the current to that of the same wave travelling in the direction of the current. These dependencies are illustrated in Fig. 8, assuming that h > λ ÷ 2, for a set of waves of different wave lengths. The average depth of Shark Bay is 10 m (Burling et al. 2003). Fig. 8 demonstrates that the change in wave height between a wave travelling in the direction of the current to one travelling opposite the current can be large. Fig. 8 also illustrates the dependence of this effect on the wavelength of the wave. It is much more pronounced on waves of shorter than longer wavelength. The wavelength of water waves depends on the ‘fetch’ of the waves, the distance the wind acts on the surface of the water, as well as the wind strength and the time the wind acts on the surface of the water. In this case, the fetch is limited by the southerly extent of Shark Bay. There are no long-wavelength water waves travelling north at Denham as there are no ocean openings to the bay south of Denham. The fetch in the southern reaches is in the order of tens of kilometres, whereas the fetch needed to produce long-wavelength waves (with wavelengths of greater than 100 m) is greater than 1000 km. These are typically formed in the open ocean (Pierson and Moskowitz 1964). Hence the wave spectrum in the Western Gulf of Shark Bay is distributed around shorter wavelengths. This effect is evident in the wave period data (Fig. 9) collected from a wave monitoring buoy (Sofar Spotter Buoy) moored in Shark Bay, north-east of the tip of Dirk Hartog Island (University of Western Australia and the Minderoo Foundation’s WaWaves, see https://wawaves.org/). This histogram displays the distribution of the mean wave period from 30-min time blocks. The distribution of average period of waves collected here is contrasted with the distribution of average periods, for the same time (10 March 2021 to 25 July 2021), of a similar wave monitoring buoy located off the Perth coast, north-east of Rottnest Island some 600 km to the south. The absence of long-period waves in the Shark Bay data is clear, indicating the dominance of short-wavelength waves in Shark Bay.
|
 . Wavelength values are for stationary water.
|
A variation in wind speed that correlates with tides might also be explained by a mechanism whereby the variation in water height affects wave velocity and so wave height. Shark Bay is shallow, with an average depth of 10 m. In some places it is very shallow. In the region of this study, there is a shallow bank, Knight Bank, to the south of Denham, which has an average depth at low water of 2.0 m. Hence a 1.0-m tidal variation could potentially affect both wave speed and so wave height. In shallow water, water depth determines wave speed (Phillips 1977). If λ ≫ h and A ≪ h, then Eqn 2 reduces to  . Hence, if these conditions are met, as the tide changes from high to low water the wave speed will change from 5.42 to 4.43 m s–1. As energy in the wave is proportional to the square of wave amplitude and the wave period must be constant, the change in wave heights between high and low water will be
 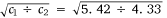 = 1.11 Thus the mechanism would produce an increase in wave height of ~11% on Knight Bank, which is significantly smaller than the change produced by the effect on wave heights caused by a change in the direction of the current, as detailed in Fig. 8. The dramatic change in sea conditions (i.e. wave height) with change in direction of the tide (Lapworth 2011) is observed in this region of the bay, but a change in sea conditions with the arrival of low tide has not been widely reported. However, analysis of the data of this current investigation will allow a distinction to be made between the two possible mechanisms.
Currents can affect the mechanism of wave generation (Pizzo et al. 2021). Wave generation occurs when the velocity of the wind exceeds the phase velocity of the wave (Vekstein 1998). The wave then grows to a height determined by the wind profile near the surface such that the wind velocity matches the wave velocity. This mechanism was first proposed by Miles (1957). If the current is travelling in a direction opposite to the wind, then the phase velocity relative to the wind is lowered and so the mechanism of wave generation and growth is enhanced. Modelling of the tidal currents in Shark Bay (Nahas et al. 2005) estimated the mean tidal velocity in the area where the wind speed measurements were made at 0.3–0.4 m s–1. The phase velocity of a surface gravity wave of λ = 1.0 m in water of depth 10 m is 1.25 m s–1 (Eqn 2). Thus, tidal currents are a significant fraction of the threshold for wave generation. Hence wave generation and growth are enhanced if the waves are travelling in the direction opposite the current.
5. Analysis
Fig. 7 demonstrates the dominance of the sea breeze at Shark Bay Airport. Its regularity provides an opportunity to examine the wind record by comparison with daily averages. To determine the influence of the tide on the wind, it is necessary to compare the sea breeze when the tide is in the same direction as the waves (i.e. travelling from the south with the wind) to when the tidal current is travelling from the north. To do this meaningfully, it is necessary to account for the diurnal variation. The simplest way of doing this is to find the average wind speed at the time of day for that time of the month and year and to compare it to the wind speed when the tidal current is from the south to when it is from the north. Hence, for every 30-min measurement in the data set, the average wind speed for the corresponding time of day, for wind coming from the south, was computed for 29 days – 14 days before and 14 days after the day of the measurement. This running average had the same diurnal periodicity as the raw wind speed. The 29-day average ensured that the average was calculated for a full period of the moon’s orbit, removing any bias from possible tidal effects on the wind speed.
Wind drag due to wave formation is only apparent at higher wind speeds, as is clear from the Charnock relationship (Eqn 1). Hence, only those times when the wind has a significant prospect of inducing waves of sufficient height to add drag need be considered. To do this only those times when the 30-min average wind speed was greater than 7.5 m s–1 were considered. This corresponded to a Beaufort scale of sea surface state of 4–5, when small waves are formed with frequent ‘white caps’ (National Weather Service’s Beaufort Scale, see https://www.weather.gov/pqr/beaufort).
As described in Section 2, the tide table for Useless Loop was used to determine if the tide was rising or falling for all 30-min measurement intervals in 2020. Using this, the average difference between the wind speed and the 29-day running average for that time of day was computed for wind speeds in excess of 7.5 m s–1 for when the tide was incoming and when it was outgoing. This was calculated for all 30-min periods in 2020, where the 29-day running average was available, i.e. after 14 January 2020 and before 17 December 2020. The average value of the wind speed when the tide was incoming (i.e. flowing from the north in the opposite direction of the sea breeze) was 0.25 m s–1 less than the average wind speed when the tide was flowing in the opposite direction. This indicated that there was a measurable difference between the wind speed when the tide was incoming to when it was outgoing.
6. Time dependence of the wind record
To investigate the time dependence of the wind record, the following analysis was applied.
For each 30-min period with wind from the south, in excess of 7.5 m s–1 and for when the tide was flowing in, the difference between the actual wind speed and the 29-day running average wind speed was determined.
The mean of all such differences for the year was calculated and recorded.
Each 30-min record where the tide was ‘incoming’ was marked. This was the ‘reference set’ of times.
To examine the wind record N hours later, every 30-min wind record that was N hours later than the reference set was compared to its 29-day running average wind speed for that time of day and the difference found. Hence if N was 12 h, then instead of looking at times when the tide was incoming, it would now be looking at times when the tide was outgoing. As before, the average of all times that were 12 h from the reference set for the whole year was calculated.
This process was repeated for all times in the scan time, and the yearly average wind speed difference was recorded.
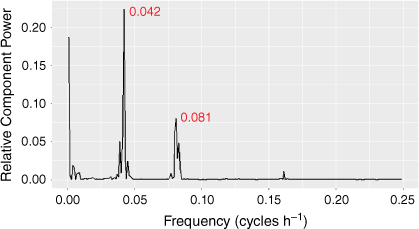
A time series over 42.666 days (two-thousand forty-eight 30-min periods) was computed using this methodology. The outcome of this calculation is shown in Fig. 10. This figure shows the difference between the daily wind speed and the 29-day running average as a function of the ‘Tide delay’ parameter. The tide delay is the value of the number of hours that the calculated point is from the set of reference times. The data clearly have the periodicity of the tides superimposed. It shows that the difference between the wind speed when the wind is against the tide compared to when it is in the same direction is sufficiently great so as to be visible once the daily variation in the sea breeze is removed by subtracting the average wind speed for that time of day and in that month. The modulations of the spring and neap tides are clear as is the presence of both diurnal and semi-diurnal periodicities. The spectral components of Fig. 10 are shown in the power spectrum in Fig. 11. The frequencies identified by this are the diurnal component (1/0.042 = 23.8 h) and the semi-diurnal component (1/0.081 = 12.3 h).

|
|
Although the tide periodicities are clear in Fig. 11, it is also clear in both Fig. 10 and 11 that there are other spectral features present. The ratio of the diurnal to semi-diurnal periodicities is biased towards more diurnal component than could be explained by the tides alone. This was likely due to the incomplete removal of the diurnal sea-breeze component through subtraction of the 29-day running average. Although Fig. 8 shows the domination of the wind by the sea breeze, there are other features present that do not have a diurnal periodicity. Hence the 29-day running average will not always simply remove the sea breeze. There are some days when there is no sea breeze. For instance, if the geostrophic winds are so strong that there is no opportunity for the land to heat more rapidly than the water, the mechanism of the sea breeze pressure gradient will be inhibited for that day. Thus, subtracting the 29-day running average will add to the diurnal component rather than reduce it for this type of day. It is also true that the selection of 29-days as the period to form the average will affect the responsiveness of the average to changes in seasons. This may well introduce low-frequency terms such as are apparent in the slope of the data in Fig. 9, and the intensity of the low frequency terms in Fig. 11.
So simply when subtracting a time of day, the 29-day running average for wind speed from the wind speed record does unequivocally demonstrate the influence of the tides on the wind speed record. However, the resultant spectral analysis is left with artefacts of the process. A better approach is to use a medium-scale weather model with appropriate historical initialisation data. Such a model not only accounts accurately for the sea breeze, but also other geostrophic winds and changes in weather patterns as the season changes. The Weather Research and Forecasting (WRF (ARW) version 4.0) was used to do this.
7. WRF wind speed calculations
Wind speeds were calculated using the WRF ver. 4.0 code. The WRF is extensively used for weather and climate research (WRF 2022). It has been used to study climate and seasons in south-west Western Australia (Kala et al. 2015) and to study wind fields in coastal regions (Jiménez and Dudhia 2018; Kim et al. 2019; Misaki et al. 2019). Hence it is admirably suited to improve the estimates of daily wind speed beyond the simple 29 ‘time of day’ average.
The area has a relatively simple topology in that it is remarkably flat being among the oldest land surfaces anywhere in the world. The land surface elevation does not rise above 100 m for 100 km east of the coast. Then it rises gently to a plateau with an average height ~200 m above sea level (World Topographic Map 2022). However, its geography is relatively complex (Fig. 1). The bay has two gulfs together with the narrow peninsulas and stretches of shallow water. Some care was needed to ensure that the WRF accurately reflected these complexities.
The code was run on a single domain (Fig. 1) 438.4 km east–west by 486.4 km south–north, centred on 25.7°S and 113.5°E. The calculation was done on a 3.2- × 3.2-km spaced grid with 33 vertical levels. The grid size was settled on when calculation demonstrated that the resolution of the wind speed features was not significantly improved by using a finer grid.
The ‘NCAR convection-permitting suite’ of options, denoted as the ‘conus suite’, was used to set the various physics model alternatives (WRF 2022).
The ‘conus suite’ of physics options includes
MYJ PBL scheme (Janjić 1994)
RRTMG longwave radiation scheme (Iacono et al. 2008)
Tiedtke cumulus scheme (Tiedtke 1989; Zhang et al. 2011)
MYJ surface layer scheme (Janjić 1994)
This suite has been extensively tested, particularly in the continental USA (WRF 2022). It produced reliable results for the Shark Bay region (Fig. 12).
|
MODIS IGBP 21-category data were used for the calculations with a time step of 18 s. The WRF code was set to output ‘time series’ data for the geographic location of Shark Bay Airport (25.9°S, 113.6°E, 36.9 m above sea level and 10.0 m above the land surface). The model output data for wind speed at 10 m above the surface was used for comparison with the weather station observations. The model initialisation data needed to run the forecast model for 2020 were downloaded from the Copernicus Climate Change Centre, which is part of the European Centre for Medium-Range Weather Forecasting (ECMWF), using the ERA5 reanalysis data (Copernicus Climate Services, see https://climate.copernicus.eu/climate-reanalysis). Calculations were done for 1 month of data in each run. The first 72 h of each calculation were ignored as ‘spin-up’ for the code to reach reliable outputs. The period when cyclones were in the area of Shark Bay, as outlined in Section 3, was excluded from the calculation.
8. Comparison of calculations with observation
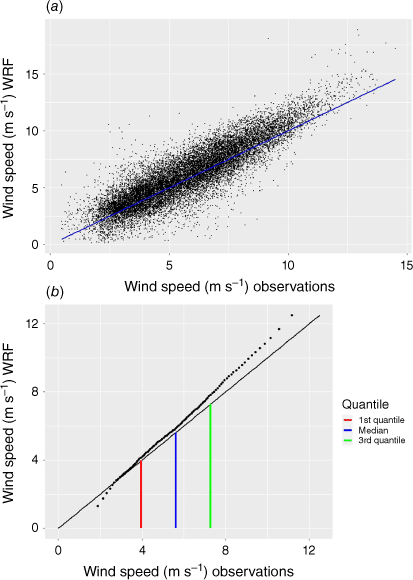
Fig. 12 shows a comparison of the calculated and measured wind speeds for every 30-min period in 2020 for wind coming from all directions. The data are plotted both in a scatterplot and on a quantile–quantile plot, which clearly show that the deviations of the measured wind speed occur at higher wind speed. Some of the very high wind speed measurements in this figure are from Cyclone Mangga as previously described. A wind speed of 7.5 m s–1 corresponds to a sea state of 4–5 on the Beaufort scale, a point where ‘white caps’ become evident on the sea surface. Fig. 12 demonstrates that significant deviations of the WRF calculations occur as a new energy dispersive process begins at wind speeds exceeding this (Cavaleri et al. 2007).
Fig. 13 shows scatterplots of the WRF predictions versus the BOM measurements for wind coming from the south in a compass direction of 160–200° for times when the tidal current was outgoing (from the south, Fig. 13a), for times when the tidal current was incoming (from the north, Fig. 13b) and for low tide (Fig. 13c). It is very clear from Fig. 12 and 13 that the WRF in this configuration does an excellent job in predicting the wind patterns. It is also clear that the WRF in this configuration underestimates the wind speed for higher wind speeds. These figures present convincing evidence that the effects of the tide on the wind speed are evident only at higher wind speeds, and therefore cannot be due to changes in the surface roughness because of the exposure of large ‘mud flats’. If so, the deviations of the measured wind speed from the calculated wind speed would occur at all wind speeds. This is in contrast with the results of Kessler et al. (1985) and Fischereit et al. (2016) in which the tidal effects were demonstrated to be linked to the exposure of large mud flats at low tide. The observation that the deviations occur at high wind speed implies that the origin of the deviation is due to changes in wind drag with increasing wind speed.
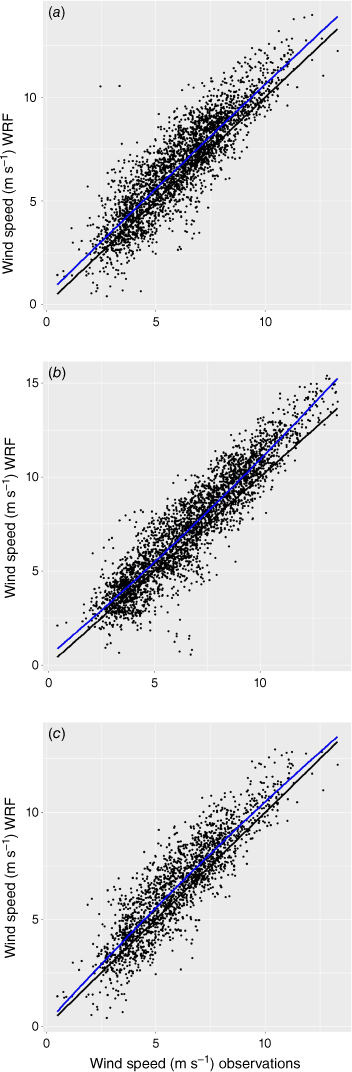
|
The location of BOM AWS (ID 006105) makes it likely that wind-speed measurements by the station will reflect energy lost as the air column passes over the southern reaches of the Western Gulf. Although the wind speed is not the wind speed over the water, the lack of large geographical features in the landscape between the weather station and the gulf minimise the opportunities for mixing and loss of signal. Clearly, there will be days when there is additional turbulence in the air column, and this will cause increased mixing and loss of this signal from time to time. The fits to the data for both the outgoing and ingoing tide (Fig. 13a, b) at lower wind speeds (<7 m s–1) show that the drag at these wind speeds predicted by the WRF is the same for both the incoming and outgoing tides and is higher than the measured wind speed. This constant difference is likely due to misassignment of the drag of the landcover south of the weather station. The fact that the difference remains constant at all wind speeds, including those >7 m s–1, when the tide is in the same direction as the wind implies that the misassignment is to do with geographic features or land cover elements in the WRF model and is not a reflection of drag associated with the sea surface.
It has been acknowledged in the literature (Jiménez and Dudhia 2018) that the drag across shallow water is only approximately computed by the WRF code (ver. 4). This is unsurprising as it has been demonstrated that the wind drag is a function of both the wave height and wave ‘steepness’, the ratio of the height to the wavelength (Taylor and Yelland 2001). Wavelength depends on wave ‘age’, the period of time the wind has been acting on a set of waves and water depth. Wave age depends on wave fetch as well as the time that the wind has been constant (Pierson and Moskowitz 1964). The wave fetch and water depth are not estimated by the WRF, so the wind drag is only approximate (Skamarock et al. 2005). There have been efforts to improve this aspect of the WRF for shallow water (Jiménez and Dudhia 2018; Kim et al. 2019), although these are yet to include the effect of wave age. Jiménez and Dudhia (2018) propose a new formulation for computation of the wind drag at different water depths for waters deeper than 10 m. Kim et al. (2019) applied this formulation to shallow waters in their study of winds over the Korean Peninsula and concluded that they were able to reduce the wind speed bias. Thus, it is not unexpected that there will be an overestimate in the wind speed prediction in the WRF as Shark Bay is both shallow (10-m average depth) and its coastline ensures a limited wave fetch.
9. Calculation of average deviation of the WRF calculation from the BOM measurement at high wind speeds
The analysis of the data was done by looking at correlations, using scatterplots, between the WRF calculations and the BOM observations of selected ‘wind events’. The ‘wind events’ were pairs of BOM observations and corresponding WRF calculations selected from the full data set by setting filters to extract events characterised by the direction of the wind, their correlation with tide events (high tide, low tide, tide outgoing, tide incoming or at a fixed time after high tide, low tide, tide incoming or tide outgoing), date range, range of wind speed and range of tide velocity. The data in the scatterplots were fitted with a quadratic function, using a least squares non-linear fitting program. A quadratic function was chosen to model this data following an analysis of variance test of this model versus a linear fit (Wilks 2019). The data was analysed comparing the deviation at a maximum velocity of the fitted curve from the observed value. The degree to which the WRF overestimates the wind speed over water at higher wind speed was estimated by this computed value. Thus, this ‘Maximum deviation’, evaluated at x = 13.5 m s–1, was used to measure the extent of the wind speed bias of the WRF at higher wind speeds.
Fig. 13 shows scatterplots for wind coming in the range 160–200°, when it is coincident with an outgoing tide (Fig. 13a), an incoming tide (Fig. 13b) and low tide (Fig. 13c). The parameter values from these fits are shown in Table 1. The ‘Maximum deviation’ column in Table 1 shows the amount by which the fitted function exceeds the measured value when the measured wind speed was 13.5 m s–1. From this table, the value predicted by the WRF was 1.58 ± 0.8 m s–1 greater than the measured value of 13.5 m s–1 when the tide was running out. Similarly, when the tide was incoming, the WRF predicted that the wind speed would be 0.47 ± 1.0 m s–1 greater than the measured value of 13.5 m s–1. Hence the deviation of the WRF prediction from the measured values is significantly greater at higher wind speeds when the tide is incoming than when it is outgoing. The errors quoted in Table 1 use the standard errors in the coefficients of the fitted curves returned from the least squares fit program, propagated to produce the error in the maximum deviation.

|
 to the data in
 Fig. 13c and the values recorded for Fig. 13c in Table 1 show no measurable increase in wind drag when the tide reaches low tide. It should be noted that the data in Fig. 13c are for the entire year of ‘low tide’ events, excluding the time when Cyclone Mangga crossed the bay. The criterion used to determine that the tide was low was that tide velocity was near zero (less than 0.0002 m s–1) and the water level was less than the mean water level. This accurately reproduced the times for low water. Hence, the proposal that the increased wind drag is due to waves slowing, and so growing in height, due to the change in water level, can be rejected. Fig. 13b shows the equivalent analysis for every incoming tide event for 2020. In these cases, the measured wind speed is, on average, less than its predicted value for higher wind speeds. Hence, consistent with the field observations, the effect on wave amplitude due to changes in current direction are large whereas those due to water height changes are small.
10. Time dependence of the maximum deviation
The time dependence of the difference between the fitted WRF estimation of the wind speed and the measured wind speed was investigated following a similar approach to that used to examine the time dependence of the actual wind speed less the 29-day running average wind speed described in Section 6.
Each 30-min period with wind from the south and when the tide was incoming was selected and the maximum deviation calculated, as outlined above.
Each 30-min record where the tide was incoming was marked. This was the ‘reference set’ of times.
To examine the wind record N hours later, every 30-min wind record that was N hours later than the reference set was selected and the maximum deviation for that set of wind events was calculated and recorded. Hence, if N was 12 h, then instead of looking at times when the tide was incoming, it would now be looking at times when the tide was outgoing.
This process was repeated for all times in the scan time, and the maximum deviation was recorded.
The outcome of this analysis for a period of 42.333 days is shown in Fig. 14 and should be compared to Fig. 10. It clearly reflects the tides in Shark Bay. The diurnal and semi-diurnal components are apparent, and the modulation giving rise to neap and spring tides is evident. The spectral analysis of this data is shown by its power spectrum in Fig. 15. This clearly shows that the diurnal and semi-diurnal components have been resolved into two components.

|

|
Comparing the time series data in Fig. 10, which subtracted the 29-day running average from the wind record, with the time series data in Fig. 14, which used the WRF output to subtract from the wind record, the following points are noteworthy:
The low-frequency sloping background has been removed.
The semi-diurnal component has been enhanced compared to the diurnal component.
The spring tide and neap tide modulation is apparent in both figures.
These observations are confirmed by the power spectra of Fig. 11 and 15. In addition, Fig. 15 shows:
Reduction in low frequency ‘noise’ components.
Splitting of the diurnal and semi-diurnal components.
The identification of these four tidal components with known tidal components.
The periods and amplitudes of the first four components are shown in Table 2. These can be identified from their periods as the two lunar diurnal components O1 (principal lunar diurnal) and K1 (declinational lunar diurnal), using their Darwin symbols (Simons 2013) and the two semi-diurnal components M2 (medium lunar semi-diurnal) and S2 (medium solar semi-diurnal). The analysis of the tides in Shark Bay by Burling et al. (2003) shows that the tide at Useless Loop has four components: two with a period of near 24 h (diurnal components K1 and O1; Simons 2013) and two with a period near 12 h (semi-diurnal components M2 and S2). Burling et al. (2003) deduced that at Useless Loop, the magnitude of the sum of the K1 and O1 amplitudes was ~2.1 times that of the sum of the M2 and S2 amplitudes. Table 2 shows that, for this analysis, the ratio of the sum of the diurnal amplitudes (K1 and O1) to the sum of the semi-diurnal amplitudes (M2 and S2) is 2.3.

|
Hence, the WRF has very effectively described wind events due to the sea breeze and other geostrophic sources and, when subtracted from the wind record at Shark Bay airport, the difference reproduces the tidal movements, showing all major components and modulations.
11. Conclusion
We demonstrated that the wind record from the Shark Bay Airport clearly shows the modulation of the wind speed by the tidal current. The effect of the tidal currents is written into the wind record with such fidelity that it is possible, with the assistance of the WRF, to extract not only the spring and neap tide modulations but all four major tidal components with the correct periods and amplitudes. The deviation of the WRF from the measured values occurs at wind speeds associated with changes to the observed sea state, as shown in Fig. 12. This can be interpreted as the point at which the wave steepness, the ratio of the wave height to wavelength, becomes so large that the wave starts to lose cohesion, producing the characteristic ‘white caps’. The increased dissipation involved will increase the roughness length and so reduce the wind speed recorded at 10 m. Wave height and steepness is increased if the wave is travelling in the opposite direction to the water current, hence the increased dissipation with the consequential reduction in wind speed will be greater when the waves are travelling in the direction opposite to the tidal current and so the wind speed will be less than the average for that time of day. By this mechanism, the deviation of the wind speed from the WRF predictions (and 29-day running average) is correlated with the tides. This conclusion points to the need to include water currents and a full dynamical description of the sea surface for models predicting wind over the surface of water, particularly when the currents and winds are strong. In the evolving circumstance where climate change is predicted to increase high wind events, these more complete models will be of increasing value.
Supplementary material
Supplementary material is available online.
Data availability
The data that support this study are available in the article and accompanying online supplementary material (Copernicus Climate Services, see https://climate.copernicus.eu/climate-reanalysis; Bureau of Meteorology, see http://www.bom.gov.au/climate/data-services/station-data.shtml; University of Western Australia and the Minderoo Foundation’s WaWaves, see https://wawaves.org/).
Conflicts of interest
The author declares that he has no conflict of interest.
Declaration of funding
This research did not receive any specific funding.
Acknowledgements
The author thanks Tom Lyons who introduced him to the WRF following discussions of weather issues in Shark Bay. Tom guided him through implementation of the WRF and advised on appropriate settings. Without Tom, this work would not have been done. Sadly, Tom passed away and did not get a chance to see this work completed. His input and company are sorely missed. The author also thanks Jatin Kalia, who directed the author to the Copernicus Climate Change Centre, and Peter Rye who helped guide him in the application of the WRF to the analysis of this data. Both Jatin and Peter provided a critical eye and constructive suggestions.
References
Backhaus JO (1985) A three-dimensional model for the simulation of shelf sea dynamics. Deutsche Hydrographische Zeitschrift 38, 165–187.| A three-dimensional model for the simulation of shelf sea dynamics.Crossref | GoogleScholarGoogle Scholar |
Bureau of Meteorology (1997) Guidelines for the siting and exposure of metrological instruments and observing facilities – observation specification number 2013.1. Available at http://www.bom.gov.au/climate/cdo/about/observation_specification_2013.pdf
Bureau of Meteorology (2019a) Tide Predictions for Australia, South Pacific and Antarctica: Denham, WA. Available at http://www.bom.gov.au/australia/tides/#!/wa-denham
Bureau of Meteorology (2019b) Tide Predictions for Australia, South Pacific and Antarctica: Useless Loop, WA. Available at http://www.bom.gov.au/australia/tides/#!/wa-useless-loop
Burling MC, Pattiaratchi CB, Ivey GN (2003) The tidal regime of Shark Bay, Western Australia. Estuarine, Coastal and Shelf Science 57, 725–735.
| The tidal regime of Shark Bay, Western Australia.Crossref | GoogleScholarGoogle Scholar |
Cavaleri L, Alves J-HGM, Ardhuin F, Babanin A, Banner M, Belibassakis K, Benoit M, Donelan M, Groeneweg J, Herbers THC, Hwang P, Janssen PAEM, Janssen T, Lavrenov IV, Magne R, Monbaliu J, Onorato M, Polnikov V, Resio D, Rogers WE, Sheremet A, McKee Smith J, Tolman HL, van Vledder G, Wolf J, Young I (2007) Wave modelling – the state of the art. Progress in Oceanography 75, 603–674.
| Wave modelling – the state of the art.Crossref | GoogleScholarGoogle Scholar |
Charnock H (1955) Wind stress on a water surface. Quarterly Journal of the Royal Meteorological Society 81, 639–640.
| Wind stress on a water surface.Crossref | GoogleScholarGoogle Scholar |
Chen F, Janjić Z, Mitchell K (1997) Impact of atmospheric surface-layer parameterizations in the new land-surface scheme of the NCEP Mesoscale Eta model. Boundary-Layer Meteorology 85, 391–421.
| Impact of atmospheric surface-layer parameterizations in the new land-surface scheme of the NCEP Mesoscale Eta model.Crossref | GoogleScholarGoogle Scholar |
Deskos G, Lee JCY, Draxl C, Sprague MA (2021) Review of wind–wave coupling models for large-eddy simulation of the marine atmospheric boundary layer. Journal of the Atmospheric Sciences 78, 3025–3045.
| Review of wind–wave coupling models for large-eddy simulation of the marine atmospheric boundary layer.Crossref | GoogleScholarGoogle Scholar |
Fischereit J, Schlünzen KH, Gierisch AMU, Grawe D, Petrik R (2016) Modelling tidal influence on sea breezes with models of different complexity. Meteorologische Zeitschrift, 25, 343–355.
| Modelling tidal influence on sea breezes with models of different complexity.Crossref | GoogleScholarGoogle Scholar |
Hedges TS (1987) Combinations of waves and currents: an introduction. Proceedings of the Institution of Civil Engineers, Part 1 82, 567–585.
| Combinations of waves and currents: an introduction.Crossref | GoogleScholarGoogle Scholar |
Hetzel Y, Pattiaratchi C, Lowe R (2013) Intermittent dense water outflows under variable tidal forcing in Shark Bay, Western Australia. Continental Shelf Research 66, 36–48.
| Intermittent dense water outflows under variable tidal forcing in Shark Bay, Western Australia.Crossref | GoogleScholarGoogle Scholar |
Iacono MJ, Delamere JS, Mlawer EJ, Shephard MW, Clough SA, Collins WD (2008) Radiative forcing by long-lived greenhouse gases: calculations with the AER radiative transfer models. Journal of Geophysical Research: Atmospheres 113, D13103
| Radiative forcing by long-lived greenhouse gases: calculations with the AER radiative transfer models.Crossref | GoogleScholarGoogle Scholar |
Janjić ZI (1994) The step-mountain eta coordinate model: Further developments of the convection, viscous sublayer, and turbulence closure schemes. Monthly Weather Review 122, 927–945.
| The step-mountain eta coordinate model: Further developments of the convection, viscous sublayer, and turbulence closure schemes.Crossref | GoogleScholarGoogle Scholar |
Jiménez PA, Dudhia J (2018) On the need to modify the sea surface roughness formulation over shallow waters. Journal of Applied Meteorology and Climatology 57, 1101–1110.
| On the need to modify the sea surface roughness formulation over shallow waters.Crossref | GoogleScholarGoogle Scholar |
Kala J, Andrys J, Lyons TJ, Foster IJ, Evans BJ (2015) Sensitivity of WRF to driving data and physics options on a seasonal time-scale for the southwest of Western Australia. Climate Dynamics 44, 633–659.
| Sensitivity of WRF to driving data and physics options on a seasonal time-scale for the southwest of Western Australia.Crossref | GoogleScholarGoogle Scholar |
Kessler RC, Eppel D, Pielke RA, McQueen JM (1985) A numerical study of the effects of a large sandbar upon sea breeze development. Archives for Meteorology, Geophysics, and Bioclimatology, Series A 34, 3–26.
| A numerical study of the effects of a large sandbar upon sea breeze development.Crossref | GoogleScholarGoogle Scholar |
Kim S-Y, Hong S-Y, Kwon YC, Lee YH, Kim D-E (2019) Effects of modified surface roughness length over shallow waters in a regional model simulation. Atmosphere 10, 818
| Effects of modified surface roughness length over shallow waters in a regional model simulation.Crossref | GoogleScholarGoogle Scholar |
Lapworth A (2011) Wind against tide. Weather 66, 100–102.
| Wind against tide.Crossref | GoogleScholarGoogle Scholar |
Lee Y-H (2021) Observational analysis of tidal effect on sea breeze. Boundary-Layer Meteorology 180, 273–288.
| Observational analysis of tidal effect on sea breeze.Crossref | GoogleScholarGoogle Scholar |
Liu J, Meucci A, Liu Q, Babanin AV, Ierodiaconou D, Young IR (2022) The wave climate of Bass Strait and South-East Australia. Ocean Modelling 172, 101980
| The wave climate of Bass Strait and South-East Australia.Crossref | GoogleScholarGoogle Scholar |
Masselink G, Pattiaratchi CB (2001) Characteristics of the sea breeze system in Perth, Western Australia, and its effect on the nearshore wave climate. Journal of Coastal Research 17, 173–187.
Miles JW (1957) On the generation of surface waves by shear flows. Journal of Fluid Mechanics 3, 185–204.
| On the generation of surface waves by shear flows.Crossref | GoogleScholarGoogle Scholar |
Miller STK, Keim BD, Talbot RW, Mao H (2003) Sea breeze: structure, forecasting, and impacts. Reviews of Geophysics 41, 1011
| Sea breeze: structure, forecasting, and impacts.Crossref | GoogleScholarGoogle Scholar |
Misaki T, Ohsawa T, Konagaya M, Shimada S, Takeyama Y, Nakamura S (2019) Accuracy comparison of coastal wind speeds between WRF simulations using different input datasets in Japan. Energies 12, 2754
| Accuracy comparison of coastal wind speeds between WRF simulations using different input datasets in Japan.Crossref | GoogleScholarGoogle Scholar |
Nahas EL, Pattiaratchi CB, Ivey GN (2005) Processes controlling the position of frontal systems in Shark Bay, Western Australia. Estuarine, Coastal and Shelf Science 65, 463–474.
| Processes controlling the position of frontal systems in Shark Bay, Western Australia.Crossref | GoogleScholarGoogle Scholar |
Pearce A, Hart A, Murphy D, Rice H (2015) Seasonal wind patterns around the Western Australian coastline and their application in fisheries analysis. Fisheries Research Report 266, Department of Fisheries, Western Australia.
Phillips OM (1957) On the generation of waves by turbulent wind. Journal of Fluid Mechanics 2, 417–445.
| On the generation of waves by turbulent wind.Crossref | GoogleScholarGoogle Scholar |
Phillips OM (1977) ‘The dynamics of the upper ocean’, 2nd edn. (Cambridge University Press)
Pierson WJ Jr, Moskowitz L (1964) A proposed spectral form for fully developed wind seas based on the similarity theory of S. A. Kitaigorodskii. Journal of Geophysical Research 69, 5181–5190.
| A proposed spectral form for fully developed wind seas based on the similarity theory of S. A. Kitaigorodskii.Crossref | GoogleScholarGoogle Scholar |
Pizzo N, Deike L, Ayet A (2021) How does the wind generate waves? Physics Today 74, 38–43.
| How does the wind generate waves?Crossref | GoogleScholarGoogle Scholar |
Schilder G (Ed.) (1984) The discovery of Australia’s West Coast. In ‘Voyage to the Great South Land, William de Vlamingh’. pp. 68–70. (Royal Australian Historical Society: Sydney, NSW, Australia)
Simons B (2013) ‘Coastal Tides Institut océanographique’. (Transl. D Manley) (Fondation Albert, Prince de Monaco)
Skamarock WC, Klemp JB, Dudhia J, Gill DO, Barker DM, Wang W, Powers JG (2005) A description of the Advanced Research WRF version 2. NCAR Technical Note NCAR/TN-4681STR, National Center for Atmospheric Research, Mesoscale and Microscale Meteorology Division
Taylor PK, Yelland MJ (2001) The dependence of sea surface roughness on the height and steepness of the waves. Journal of Physical Oceanography 31, 572–590.
| The dependence of sea surface roughness on the height and steepness of the waves.Crossref | GoogleScholarGoogle Scholar |
Thompson G, Field PR, Rasmussen RM, Hall WD (2008) Explicit forecasts of winter precipitation using an improved bulk microphysics scheme. Part II: implementation of a new snow parameterization. Monthly Weather Review 136, 5095–5115.
| Explicit forecasts of winter precipitation using an improved bulk microphysics scheme. Part II: implementation of a new snow parameterization.Crossref | GoogleScholarGoogle Scholar |
Tiedtke M (1989) A comprehensive mass flux scheme for cumulus parameterization in large-scale models. Monthly Weather Review 117, 1779–1800.
| A comprehensive mass flux scheme for cumulus parameterization in large-scale models.Crossref | GoogleScholarGoogle Scholar |
World Topographic Map (2022) Shire of Shark Bay, Topographic map. Available at https://en-us.topographic-map.com/maps/vzzp/Shire-Of-Shark-Bay/
Unna PJH (1942) Waves and tidal streams. Nature 149, 219–220.
| Waves and tidal streams.Crossref | GoogleScholarGoogle Scholar |
Vekstein GE (1998) Landau resonance mechanism for plasma and wind-generated water waves. American Journal of Physics 66, 886–892.
| Landau resonance mechanism for plasma and wind-generated water waves.Crossref | GoogleScholarGoogle Scholar |
Villas Bôas AB, Ardhuin F, Ayet A, Bourassa MA, Brandt P, Chapron B, Cornuelle BD, Farrar JT, Fewings MR, Fox-Kemper B, Gille ST, Gommenginger C, Heimbach P, Hell MC, Li Q, Mazloff MR, Merrifield ST, Mouche A, Rio MH, Rodriguez E, Shutler JD, Subramanian AC, Terrill EJ, Tsamados M, Ubelmann C, van Sebille E (2019) Integrated Observations of global surface winds, currents, and waves: requirements and challenges for the next decade. Frontiers in Marine Science 6, 425
| Integrated Observations of global surface winds, currents, and waves: requirements and challenges for the next decade.Crossref | GoogleScholarGoogle Scholar |
Wilks DS (2019) ‘Statistical Methods in the Atmospheric Sciences’, 4th edn. (Elsevier: New York, NY, USA)
WRF (2022) WRF Model Users' Page: NCAR Convection-Permitting Physics Suite for WRF. Available at https://www2.mmm.ucar.edu/wrf/users/physics/ncar_convection_suite.php
Zhang C, Wang Y, Hamilton K (2011) Improved representation of boundary layer clouds over the southeast Pacific in ARW-WRF using a modified Tiedtke cumulus parameterization scheme. Monthly Weather Review 139, 3489–3513.
| Improved representation of boundary layer clouds over the southeast Pacific in ARW-WRF using a modified Tiedtke cumulus parameterization scheme.Crossref | GoogleScholarGoogle Scholar |