

Examining ozone susceptibility in the genus Musa (bananas)
Mst Nahid Farha A B * , Jeff Daniells C , Lucas A. Cernusak A , Edita Ritmejerytė D , Phurpa Wangchuk D , Stephen Sitch E , Lina M. Mercado E F , Felicity Hayes G , Flossie Brown E and Alexander W. Cheesman A E
A
B
C
D
E
F
G
Abstract
Tropospheric ozone (O3) is a global air pollutant that adversely affects plant growth. Whereas the impacts of O3 have previously been examined for some tropical commodity crops, no information is available for the pantropical crop, banana (Musa spp.). To address this, we exposed Australia’s major banana cultivar, Williams, to a range of [O3] in open top chambers. In addition, we examined 46 diverse Musa lines growing in a common garden for variation in three traits that are hypothesised to shape responses to O3: (1) leaf mass per area; (2) intrinsic water use efficiency; and (3) total antioxidant capacity. We show that O3 exposure had a significant effect on the biomass of cv. Williams, with significant reductions in both pseudostem and sucker biomass with increasing [O3]. This was accompanied by a significant increase in total antioxidant capacity and phenolic concentrations in older, but not younger, leaves, indicating the importance of cumulative O3 exposure. Using the observed trait diversity, we projected O3 tolerance among the 46 Musa lines growing in the common garden. Of these, cv. Williams ranked as one of the most O3-tolerant cultivars. This suggests that other genetic lines could be even more susceptible, with implications for banana production and food security throughout the tropics.
Keywords: banana, biomass, food security, leaf mass per area, ozone, total antioxidant capacity, total phenolic content, water use efficiency.
Introduction
Tropospheric ozone (O3) is the third most important anthropogenic greenhouse gas and an air pollutant causing adverse impacts on plants and ecosystem services (Ainsworth et al. 2012, 2020). Ozone in the atmosphere is formed by photochemical oxidation reactions of carbon monoxide (CO), volatile organic compounds (VOCs), methane (CH4) and nitrogen oxides (NOx). Over much of the Earth’s land surface, O3 concentrations have more than doubled since the start of the industrial revolution (Monks et al. 2015; Ainsworth 2017). The tropics are strongly impacted by high and rapidly growing anthropogenic emissions of O3 precursors (Kunhikrishnan et al. 2004). An increase in surface O3 concentration has been noted by satellite monitoring across many tropical regions (Leventidou et al. 2018), with modelling studies predicting that surface O3 concentrations will increase yet further in coming decades (Wild et al. 2012). Although the impact of O3 on crops has been found to be variable across the globe (Emberson et al. 2009), studies estimate the current global O3 yield gaps for rice and soybean to be 4.4% and 12.4%, respectively (Mills et al. 2018a). The highest O3-induced yield loss in rice (Oryza sativa) is found in parts of India, Bangladesh, China and Indonesia, and losses of yield in soybean (Glycine max) are highest across the Americas (Mills et al. 2018a). It is clear that O3 is, and will continue to be, a significant problem across much of the tropics (Van Dingenen et al. 2009; Moura et al. 2018a; Sharps et al. 2021). It has been suggested that projected increases in [O3] across south Asia will decrease wheat yields by as much as 40% by 2050 (Tai et al. 2014), with important implications for global food security (Feng et al. 2022).
While the susceptibility to O3 of tropical commodity crops such as rice (Sarkar et al. 2015), maize (Zea mays) (Singh et al. 2014), soybean (Singh et al. 2010) and sugarcane (Saccharum spp.) (Moura et al. 2018b; Cheesman et al. 2023) has been determined and is now beginning to be incorporated into the selection of commercial lines (Ainsworth 2017; Mills et al. 2018a), no information exists on the susceptibility of other tropical staple crops such as bananas (Musa spp.). The genus Musa represents a genetically diverse and complex assemblage of both seeded and parthenocarpic plant types, with four distinct sections: (1) Callimusa; (2) Australimusa; (3) Eumusa; and (4) Rhodochlamys (Daniells et al. 2001; Daniells and Janssens 2020). The majority of cultivated bananas have been derived from hybridisation within the Eumusa group, and in particular, between Musa acuminata (A genome) and Musa balbisiana (B genome), leading to a great diversity of hybrid types and ploidy levels grown around the world at both subsistence and commercial scales (Daniells and Bryde 2001). However, despite a diverse genetic potential, Cavendish cultivars, a triploid A genome subgroup (i.e. AAA), represent ~47% of all global commercial production (FAO 2022) and are the most commonly sold variety in the global north. Grown in more than 100 countries throughout the tropics and sub-tropics, the gross production value of all bananas and plantains (cooking bananas) is thought to represent US$51.5 billion annually (FAO 2022). However, precise figures on total global banana production are difficult to obtain as banana cultivation is often conducted by smallholder farmers and traded in the informal sector (FAO 2022). The global production of bananas grew at a compound annual rate of 3.2% between 2000 and 2017, reaching a record of 114 million tonnes in 2017, up from about 67 million tonnes in 2000 (FAO 2022).
The pathway for O3 damage to plants follows O3 uptake from the atmosphere through stomata (Ainsworth et al. 2012); once internal to the leaf, O3 reacts rapidly with biomolecules forming reactive oxygen species (ROS); e.g. hydrogen peroxide (H2O2), superoxide (O2−) and hydroxyl (OH−) radicals, which can subsequently cause cellular damage leading to metabolic dysfunction and possible cell death (Ainsworth et al. 2012; Emberson et al. 2018). Internal ROS are countered by a diverse range of antioxidants including ascorbic acid, glutathione and phenolic compounds such as flavonols (Dusart et al. 2019). Thus, leaf-level antioxidant capacity is important to explain the O3 susceptibility of plant species due to its detoxification ability (Feng et al. 2010; Inada et al. 2012; Yendrek et al. 2015; Li et al. 2016). Leaves with larger contents of antioxidants exhibit greater O3 tolerance due to a greater capacity for detoxification (Feng et al. 2010; Inada et al. 2012; Yendrek et al. 2015). It should also be noted that biological ‘antioxidant capacity’ can include enzymatic processes such as superoxide dismutase, which can either directly scavenge ROS or act during the regeneration of antioxidant compounds (Gillespie et al. 2007; Dusart et al. 2019). However, in this study we consider only the standing pool of antioxidant compounds at the time of leaf harvest.
Leaf-level antioxidant capacity has been shown to be a fundamental trait determining tolerance of Musa spp. to abiotic stressors such as cold temperatures and drought, which may both indirectly form ROS. For example, a comparison of the cold-tolerant plantain cv. Dajiao (Musa paradisiaca.; ABB group cv. Dajiao) and the cold-sensitive banana cv. Brazil (Musa acuminata; AAA group cv. Brazil) using proteomics suggests that an increase in antioxidant capacity confers increased cold tolerance to plantains (Yang et al. 2012). Antioxidant capacity, and thereby the ability to neutralise ROS has also been linked to drought tolerance in Musa spp., and is a suggested target for selective breeding for drought tolerance (Nansamba et al. 2020). It is also worth noting that transgenic banana plants have been conferred abiotic stress tolerance by an over expression of inducible cytosolic ascorbate peroxidase gene (AhcAPX) annulling damage caused by ROS (Shekhar et al. 2019). It is therefore reasonable to assume that accession-level differences in antioxidant capacity may underpin observed differences in response to ROS, regardless of whether they formed directly by O3 or indirectly in response to other abiotic stressors.
Leaf internal morphology also impacts the interaction of O3 and ROS with critical cellular processes, determining plant O3 susceptibility. Specifically, leaves with high leaf mass per unit area (LMA) (e.g. thicker leaves and/or those with higher leaf density) have a lower O3 load per unit leaf mass and appear more tolerant to O3 (Bussotti 2008; Li et al. 2016). Indeed, O3 susceptibility across sub-tropical tree species is negatively related to increasing LMA (Zhang et al. 2012; Li et al. 2016; Dai et al. 2017), while an analysis across clones of silver birch has shown that accessions with thinner leaves are more sensitive to O3 (Pääkkönen et al. 1997; Karlsson et al. 2007).
Plant water use efficiency (WUE) is an important trait that links carbon and water cycles of terrestrial ecosystems (Beer et al. 2009). The intrinsic water use efficiency (iWUE) describes the ratio of photosynthetic rate to stomatal conductance (Cernusak et al. 2021). We therefore expect higher iWUE to correspond to less O3 uptake through stomata per unit of CO2 fixed by photosynthesis, thereby resulting in less O3 exposure risk for a given amount of photosynthesis (Kolb and Matyssek 2001; Hoshika et al. 2018). Indeed, an experimental study of soybean genotypes showed that O3-tolerant cv. Fiskeby III had a higher WUE than O3-susceptible cv. Mandarin (Ottawa) (Bailey et al. 2019). For crops, leaf-level WUE is already used as an important parameter in crop improvement (Masutomi et al. 2019), with iWUE determined in a time-integrated way by measuring the stable carbon isotope composition of leaf dry matter, following the formulation developed by Farquhar and colleagues (Farquhar et al. 1982, 1989; Farquhar and Richards 1984).
Despite the importance of banana as a staple food crop in the tropics, there is to date, no work that we are aware of examining the potential impacts of tropospheric O3 in Musa spp., with the only published work on O3 and banana being focused on the use of O3 either as a fumigant during packing or in solution as a post-harvest wash (Alencar et al. 2013). In the face of predicted rises in O3 concentration across the tropics (Brown et al. 2022). It is therefore vital to identify the potential O3 risks on banana production and at the same time explore the potential held within the genetic diversity of the Musa genus to mitigate such risks. Hence, in this work we aimed to:
carry out the first known characterisation of O3 susceptibility in the highly important pantropical herbaceous crop – bananas (Musa spp.) using Australia’s major cultivar, Williams (AAA group, Cavendish subgroup); and
test the range of physiological and biochemical traits thought to influence response to O3 across the Musa genus under common garden conditions. This allowed us to place our observed impact of O3 in cv. Williams Cavendish within the context of putative susceptibility to O3 across the Musa genus more broadly.
In this study, we tested two hypotheses: (1) O3 exposure would lead to decreases in biomass and increases in the leaf physiological and biochemical traits LMA, iWUE and antioxidant capacity in cv. Williams; (2) among a large collection of Musa lines, there would be some with high LMA, iWUE and antioxidant capacity, and that lines with high levels of these putative O3 tolerance traits would be associated with higher ploidy levels and/or a higher proportion of B genome.
Materials and methods
The O3 susceptibility of banana (Musa spp.) cv. Williams (https://www.promusa.org/Williams) was tested in open top chambers (OTC) built at the UK University of Exeter’s TropOz Research facility located at James Cook University’s Environmental Research Complex (ERC) on the Nguma-bada campus in Far North Queensland, Australia (www.tropoz.org). In addition, examination across the genus Musa of biophysical variation in functional traits known to determine O3 susceptibility was conducted by sampling a living germplasm collection held at the South Johnstone Research Facility of the Queensland Department of Agriculture and Fisheries.
Open top chamber (OTC) and O3 treatment
The experiment was conducted in nine independently controlled and monitored OTCs. The chambers (internal volume 22.2 m3) were continuously ventilated at ~2 m3 s−1 using separate inline square centrifugal fans (ICQ560-VEE, Pacific Ventilation, Melbourne, Vic., Australia). External air to each chamber was drawn through two 592 mm × 592 mm High-Capacity Honeycomb Grid Carbon Filters (AF4VC14412, AireFlow-VC, Airepure Australia, Mulgrave, Vic., Australia) each fitted with a BR4 G4 pre-filter (80022020, Airepure Australia). Both fans and filters were housed within individual custom-made air handling units with air directed into the OTC’s through a galvanised steel HVAC conduit. Into the charcoal filtered air stream of each chamber, pure O3 generated on site (AOT-60G, Aquapure Ozone technology, Shenzhen, China) was delivered using a ¼" PTFE tubing manifold with the delivery regulated by both a PTFE 24V NC solenoid, pressure regulator and a PFA needle valve (MV-13-120, Parker Hannifin, Tucson, AZ, USA). This allowed for regulated delivery of pre-determined doses of O3 into each chamber’s air stream. The solenoid control systems were run by a networked Raspberry Pi-4 computer allowing for individual control over O3 supply to specific chambers at specific times, with the aim of achieving a range of ambient O3 concentrations between 0 and 120 ppb above ambient in 15-ppb increments across the nine chambers.
Ozone concentrations in each chamber were monitored sequentially using an ultraviolet (UV) absorption O3 analyser (Model 205, 2B Technologies, Boulder, CO, USA) in air brought to a centralised service hub via a vacuum pump (Labport 840FT.18, KNF, Moreland West, Vic., Australia). A series of 24 V solenoids on a custom PTFE manifold, regulated by a networked Raspberry Pi-4 computer allowed for sampling from each chamber (via ¼" PTFE lines) in series. Assuming a 2-min sampling period per chamber and all nine chambers operational (plus zero check), this allowed for approximately three O3 concentrations readings per hour per chamber. Environmental variables such as air temperature (T), air relative humidity (RH), shortwave radiation and photosynthetically active radiation (PAR) were monitored using a single meteorological monitoring station (Campbell Scientific, Logan, UT, USA) established in the central OTC.
Plant material
Tissue culture plantlets of cv. Williams were initially grown in a shade house, for 2 months and then transplanted into 60-L pots filled with locally sourced ‘garden mix’ top soil. After 1 month acclimation to sun, we selected 27 homogeneous plants approximately 20 cm in height and transferred them to OTCs for O3 treatment, with three replicates grown in each chamber. The plants were grown under O3 fumigation for 109 days from 23 October 2020 to 9 February 2021 with O3 fumigation for 9 h per day (from 08:00 hours to 17:00 hours). All plants were watered daily using an automated drip irrigation system to ensure pots were kept close to field capacity, fertilised using a controlled release fertiliser (Scotts Landscape Formula All Purpose Osmocote, Scotts Miracle-Gro, OH, USA) and rotated every week to avoid the positional effect within chamber (Potvin and Tardif 1988).
At the end of the O3 fumigation period and when the plants were on average 97 cm in height, two leaves were collected from every plant, specifically the third most recently expanded and therefore newly mature leaf (new leaf) and the eighth-most recently expanded (old leaf), both new and old leaves having fully developed under O3 fumigation. From each leaf two mid-lamina leaf sections ~300 cm2 from both sides of the midrib were taken and measured for total fresh weight. After weighing, and scanning to determine area, one section was wrapped in tinfoil, snap-frozen in liquid N2 and stored at −20°C before freeze-drying for biochemical analyses (see below); the other section was dried at 70°C for determination of LMA.
At the end of the experiment, leaves, pseudostem, corm and small suckers were harvested separately and dried in an oven at 70°C until constant weight for biomass determination.
Ozone dose response
As well as determination of the concentration-based O3 metric, AOT40 (accumulated O3 concentrations over a threshold of 40 ppb), we estimated O3 flux into leaves using the Deposition of O3 for Stomatal Exchange (DO3SE) model based on an empirical Jarvis model of stomatal conductance (gs) (Jarvis 1976; Emberson et al. 2000). To parameterise the model, stomatal conductance to water vapour (gs) was measured using a SC-1 Leaf Porometer (Meter Group, Pullman, WA, USA) on the abaxial and adaxial surfaces of the youngest fully expanded mature leaf on each plant. Point measurements of gs were conducted over a range of conditions with a total of 408 measurements of gs used to parameterise the model. The air temperature, PAR and relative humidity varied from 26.8 to 39.5°C, 0 to 2515 μmol m−2 s−1 and 46.5 to 94.6%, respectively, during the gs measurements. The O3 flux-based metric POD (Phytotoxic O3 Dose, the accumulated stomatal O3 flux above a threshold of 1 or 6 nmol O3 m−2 projected leaf area (PLA) s−1) was calculated according to CLRTAP (2017).
Musa diversity sampling
Banana cultivars were sampled from the living collections held at the South Johnstone Research Facility under common garden conditions and ambient [O3]. At this site, a diverse range of ~200 banana types and hybrids are grown under standard fertilisation and watering regimes. On a single day (15 December 2020), we sampled 46 genetic lines chosen to represent a good cross-section of the diversity held in the collection. During sampling, three fully expanded new leaves were collected from each genetic line, with a mid-lamina leaf section ~400 cm2 from each being used for determination of leaf morphological traits (e.g. lamina leaf mass per unit area, LMA) and biochemical analysis (see below).
Leaf morphological traits
For all lamina samples collected from the OTC experiment and diversity sampling, LMA was calculated using the leaf dry mass (DM) and the leaf area (LA) determined by image analyser software (ImageJ, National Institutes of Health (NIH), Bethesda, MD, USA). LMA was calculated as LMA = DM/LA in units of g m−2. Freeze-dried leaf samples were subsequently ground into fine powder (Rocklabs Bench Top Ring Mill) and stored in airtight vials until determination of leaf biochemistry and stable isotope concentrations.
Biochemical analyses
Powdered leaf samples (~30 mg) were extracted in cold 50% acetone (Ritmejerytė et al. 2019). Total antioxidant capacity (TAC) was determined in the leaf extract by the ferric reducing antioxidant power (FRAP) assay. The assay was carried out according to Benzie and Strain (1996) with some modifications. Fresh FRAP solution was made by mixing 300 mM acetate buffer (pH 3.6), 10 mM TPTZ solution (in 40 mM HCl) and 20 mM FeCl3.6H2O solution. The volume ratio of the three reagents was 10:1:1, respectively. The solution was kept warm at 37°C in a water bath until used. Leaf extracts (10 μL) were allowed to react with the FRAP solution (190 μL) for 30 min in the dark. The absorbance of the reaction mixture was measured at 593 nm and TAC was expressed as ascorbic acid equivalents (mg AAE g−1 dry weight). Ascorbic acid was used as the standard and a calibration curve in the range of 0–250 μg mL−1 was prepared for this assay.
Total phenolic content (TPC) was measured in the same leaf extract by the Folin–Ciocalteau method (Singleton and Rossi 1965; Cork and Krockenberger 1991) with some modifications (Ritmejerytė et al. 2019). Briefly, a 20-μL aliquot of the leaf extract and 380 μL distilled H2O were mixed with 25 μL Folin–Ciocalteu reagent. After 3 min, 75 μL 20% Na2CO3 (w/v) was added to the reaction mixture and incubated in the assay tubes at room temperature for 20 min. The absorbance of the mixture was then measured at 765 nm with a microplate reader (FLUOstar OPTIMA, BMG Labtech Pty. Ltd, Vic., Australia). Gallic acid was used as a standard and TPC was expressed as Gallic acid equivalents (mg GAE g−1 dry weight).
Stable isotope measurements
The carbon stable isotope ratio (δ13C, ‰) and weight percent (%C) were determined using a Costech Elemental Analyser fitted with a zero-blank auto-sampler coupled via a ConFloIV to a ThermoFinnigan DeltaVPLUS using Continuous-Flow Isotope Ratio Mass Spectrometry (EA-IRMS) at James Cook University’s Advanced Analytical Centre. Stable isotope results are reported as per mil (‰) deviations from the VPDB reference. Precisions (s.d.) on internal standards were better than 0.1‰ for δ13C. The iWUE was calculated from δ13C according to the equation of Farquhar et al. (1989):
where Δ13C is the carbon isotope discrimination by the plants , and
where Ca (400 ppm) is the mean ambient CO2 concentration; the parameters a (4.4‰) and b (27‰) are the diffusional fractionation for CO2 in air and isotopic discrimination of the RuBP carboxylase enzyme against 13CO2, respectively; δ13Ca is the carbon isotope ratio of atmospheric CO2 (−8‰ under ambient air conditions).
Statistical analyses
Rather than adopt a fixed treatment level approach, we chose to fumigate the nine OTC’s each with a different [O3], such that we established a gradient to determine the full range of impacts. Such an approach has been advocated as better than a fixed level approach in global change studies of continuous environmental drivers, because it can also identify non-linear responses, should they occur (Kreyling et al. 2018). As specifically pointed out by Hurlbert (2004), this approach does not lead to problems of pseudoreplication and represents a valid method of testing for significant treatment effects. With each OTC representing a single point on the gradient of O3 exposure, a linear regression of averaged data at the chamber level (n = 3 plants) was used to investigate the relationship between the O3 exposure metric (e.g. AOT40, POD1 and POD6) and both plant biomass and leaf functional traits (LMA, iWUE, TAC and TPC).
Across the diverse Musa lines, leaf traits (LMA, TAC and iWUE) were checked with Shapiro–Wilk and Levene’s tests for normality and homogeneity of variance. To compare the means of the leaf trait data across different ploidy levels, data were then subjected to analysis of variance (ANOVA) coupled with Tukey’s post hoc test (i.e. LMA and iWUE) or the non-parametric Kruskal–Wallis test (i.e. TAC) if the assumption of normality was not met. Pearson’s correlation coefficient and Spearman’s rank were conducted to identify correlations between the leaf traits. Lastly, a principal component analysis (PCA) was conducted to evaluate the leaf trait relationships among 46 genetic lines in PCA space. To do this analysis, the z-scores of LMA, TAC and iWUE traits were calculated using the scale function in the R-package scales (Wickham and Seidel 2022) and then summed. The genetic lines were ordered according to the sum of z-scores for the PCA plot. A permutational multivariate analysis of variance was performed to identify whether different ploidy levels were different in the PCA space. All statistical analyses were performed using the software R ver. 3.6.2 (R Core Team 2019) utilising base R and the packages dplyr (Wickham et al. 2023), vegan (Oksanen et al. 2020), ggbiplot (Vu 2011), pairwiseAdonis (Martinez Arbizu 2020).
Results
Open top chamber O3 experiment
Banana cv. Williams was exposed to nine different levels of O3 exposure in OTCs. Over the experimental period, the average values of daytime (i.e. between 08:00 hours and 17:00 hours) O3 concentration ranged between 14.6 ± 4.5 and 91.5 ± 39.3 ppb, corresponding to an AOT40 of between 0 and 55 ppm h−1 (see Supplementary Table S1). During the experimental period, the average daytime air temperature, PAR and relative humidity were 32 ± 2.7°C, 1154.1 ± 693 μmol m−2 s−1 and 65 ± 13.4%, respectively. For determination of PODy parametrisation of gs in the DO3SE model is in Table 1, with calculated POD1 ranging from between 4.4 and 43.5 mmol m−2, and POD6 ranging between 0 and 27.4 mmol m−2 (Table S1).
| Parameter | Unit | cv. Williams | ||
|---|---|---|---|---|
| gmax | mmol O3 m−2 s−1 | 530 | ||
| Lm | m | 0.46 | ||
| fmin | fraction | 0.13 | ||
| fPAR | unitless | 0.004 | ||
| fVPD | VPDmin | kPa | 4.7 | |
| VPDmax | kPa | 2.35 | ||
| ftemp | Tmin | °C | 26 | |
| Topt | °C | 35 | ||
| Tmax | °C | 43 |
gmax, maximum conductance; fmin, fraction of gmax at minimum stomatal conductance (gmin); Lm, effective leaf blade width; ftemp, flight, fVPD are the functions of gs response to air temperature (T, °C), photosynthetically active radiation at the leaf surface (PAR, μmol m−2 s−1) and vapour pressure deficit (VPD, kPa), respectively.
Ozone dose response relationships for cv. Williams
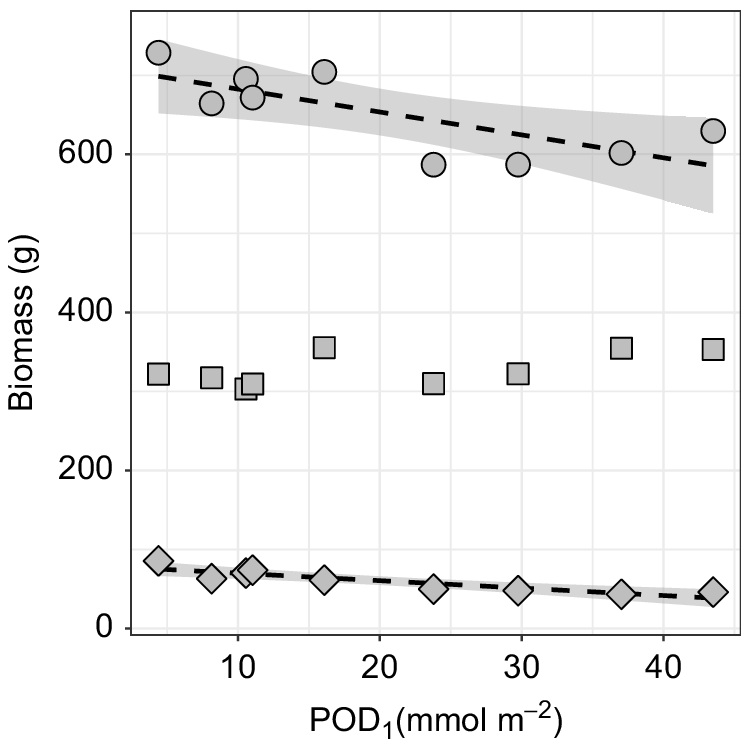
Aboveground biomass of cv. Williams was significantly impacted by exposure to O3, whether O3 exposure was expressed as either a concentration (i.e. AOT40) or flux (i.e. POD1 and POD6) metrics (Fig. 1, Table S2). Specifically, there was a significant (P < 0.05) and a highly significant (P < 0.01) decline in pseudostem and corm, and small suckers biomass, respectively. Similar patterns were seen irrespective of whether AOT40, POD1 or POD6 was used (Table S2). However, in all cases, there was no significant change in leaf biomass with increasing O3 exposure (Table S2). As significant trends observed with POD1 provided the highest Adj-R2 values, we conducted further analyses using this metric of O3 exposure.
Variation in aboveground biomass of banana cv. Williams (AAA group, Cavendish subgroup) grown under various O3 concentrations. Biomass broken down into leaf biomass (square), pseudostem and corm biomass (circle), and small suckers (diamond) biomass with O3 metric POD1. Both pseudostem and corm, and small sucker biomass show significant negative declines (Adj-R2 = 0.50, P < 0.05 and Adj-R2 = 0.77, P < 0.01) with increasing O3 flux metric POD1.
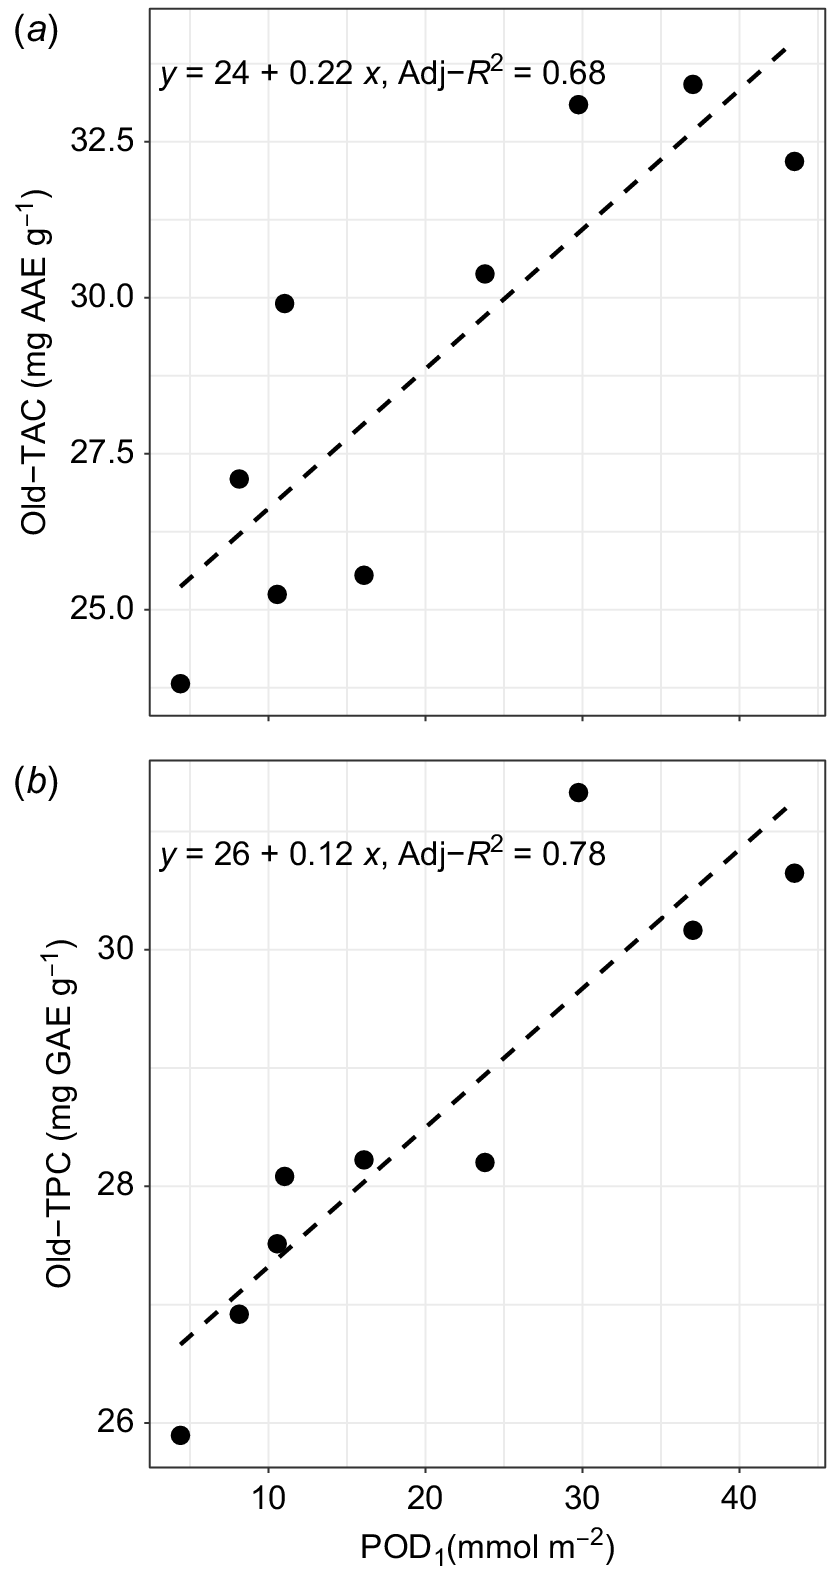
Leaf functional traits (TAC, TPC, LMA and iWUE) were tested for O3 dose response in both old and new leaves. The old-leaf TAC and TPC both showed highly significant relationships with POD1 (Adj-R2 = 0.68, P < 0.01, Fig. 2a and Adj-R2 = 0.78, P < 0.001, Fig. 2b); the relationships were positive in both cases. However, the new-leaf TAC and TPC both were not significantly related to the POD1 (Adj-R2 = −0.042, P = 0.44 and Adj-R2 = −0.11, P = 0.67). The mean values of new-leaf TAC were between 27.0 and 33.8 mg AAE g−1 dry weight and new-leaf TPC were between 23.7 and 27.4 mg GAE g−1 dry weight. Similarly, mean values for old-leaf TAC were between 23.8 and 33.4 mg AAE g−1 dry weight and old-leaf TPC were 25.9 and 31.3 mg GAE g−1 dry weight. Thus, while relationships between TAC and TPC with POD1 were significant in older leaves, there were no significant relationships with POD1 in new leaves.
Leaf lamina (a) total antioxidant capacity (TAC) and (b) total phenolic content (TPC) in the eighth (old) leaf of Musa spp. cv. Williams grown under various O3 concentrations. Values represent chamber average of three plants. Both TAC and TPC show a highly significant (P < 0.01) and positive relationship with the O3 flux metric, POD1.
For physiological traits, mean values of new-leaf LMA ranged between 76.8 and 83.6 g m−2, and old-leaf LMA ranged between 75.3 and 81.8 g m−2. However, there was no significant trend in LMA values with the POD1 for either new (Adj-R2 = −0.14, P = 0.93) or old leaves (Adj-R2 = 0.11, P = 0.21). In the case of iWUE, the mean values of new-leaf iWUE varied from 42.0 to 55.3 μmol mol−1 and old-leaf iWUE varied from 42.3 to 50.2 μmol mol−1. They also showed no significant trend with POD1 for either new (Adj-R2 = 0.10, P = 0.21) or old leaves (Adj-R2 = 0.05, P = 0.28). Thus, there were no changes in LMA and iWUE across the O3 exposure gradient.
Leaf functional traits evaluation of diverse Musa genetic lines
Different correlation tests were performed to assess the relationships among leaf functional traits LMA, TAC and iWUE of 46 Musa lines. The Pearson’s test showed a moderate positive relationship between LMA and iWUE (r = 0.36, P = 0.02). For non-parametric data, the Spearman’s rank correlation rho (ρ) values showed a moderate correlation between the pairs LMA and TAC (ρ = 0.30, P = 0.04) and TAC and iWUE (ρ = 0.40, P = 0.006).
The one-way ANOVA and Kruskal–Wallis test were performed to evaluate if the three leaf traits (LMA, TAC and iWUE) were different for the three different ploidy levels: diploid, triploid and tetraploid. The ANOVA test showed that LMA was statistically significantly different among the ploidy levels (F(2, 43) = 4.70, P = 0.01), with mean value of LMA being 15.8% lower and significantly different (Tukey’s post hoc, P-value 0.015) in diploid lines as compared to triploid lines, while tetraploid lines were not significantly different. For both iWUE (F(2, 43) = 0.99, P = 0.38) and leaf TAC (H(2) = 0.68, P = 0.71), there were no significant differences among the three levels of ploidy.
In just the 32 triploid genetic lines (Table 2), a one-way ANOVA was performed to determine whether the three leaf traits (LMA, TAC and iWUE) were significantly different between cultivars with a difference in their proportion of B genome. Using three levels of B genome contribution, none (e.g. AAA, 0%), low (e.g. AAB or 33%), and high (e.g. ABB or 66%), we saw no significant differences in LMA (F(2, 29) = 2.46, P = 0.1), leaf TAC (F(2, 29) = 0.47, P = 0.63) or iWUE (F(2, 29) = 1.03, P = 0.37).
| ID | Accession | Ploidy | Genome A | Proportion of ‘B’ genome | LMA (g m−2) | TAC (AAE g−1) | iWUE (μmol mol−1) | z-LMA | z-TAC | z-iWUE | z-Sum | PC1 | PC2 | PC3 | |
|---|---|---|---|---|---|---|---|---|---|---|---|---|---|---|---|
| 1 | Pisang Kelat | Trip. | AAB | 0.33 | 65.4 | 27.7 | 97.9 | −0.40 | 1.97 | 1.92 | 3.50 | 2.11 | 1.68 | 0.71 | |
| 2 | Williams | Trip. | AAA | 0 | 86.6 | 21.8 | 93.3 | 1.34 | 0.68 | 1.44 | 3.46 | 2.02 | −0.47 | 0.16 | |
| 3 | Ney Poovan | Dip. | AB | 0.5 | 68.3 | 29.9 | 87.4 | −0.16 | 2.46 | 0.85 | 3.14 | 1.78 | 1.85 | −0.43 | |
| 4 | Goldfinger | Tetra. | AAAB | 0.25 | 95.5 | 22.0 | 82.2 | 2.07 | 0.74 | 0.31 | 3.12 | 1.70 | −0.95 | −1.06 | |
| 5 | Niukin | Dip. | AA | 0 | 90.9 | 22.5 | 83.3 | 1.68 | 0.84 | 0.43 | 2.95 | 1.63 | −0.60 | −0.85 | |
| 6 | Da Jiao | Trip. | NA | 0.33 | 82.0 | 24.2 | 85.2 | 0.96 | 1.20 | 0.62 | 2.77 | 1.56 | 0.17 | −0.54 | |
| 7 | Pisang Raja | Trip. | AAB | 0.33 | 71.0 | 24.4 | 93.0 | 0.06 | 1.25 | 1.42 | 2.72 | 1.63 | 0.84 | 0.46 | |
| 8 | Hom Thong Mokho | Trip. | AAA | 0 | 88.6 | 17.3 | 92.9 | 1.50 | −0.29 | 1.41 | 2.62 | 1.57 | −1.26 | 0.51 | |
| 9 | Sar 294 | Trip. | TTT | 0 | 92.0 | 22.2 | 78.6 | 1.78 | 0.78 | −0.06 | 2.50 | 1.32 | −0.71 | −1.23 | |
| 10 | Asupina | Trip. | TTT | 0 | 76.0 | 20.7 | 92.6 | 0.46 | 0.44 | 1.38 | 2.28 | 1.39 | −0.02 | 0.62 | |
| 11 | Blue Java | Trip. | ABB | 0.66 | 75.8 | 22.1 | 89.3 | 0.45 | 0.75 | 1.03 | 2.23 | 1.32 | 0.21 | 0.22 | |
| 12 | Dwarf Cavendish | Trip. | AAA | 0 | 94.0 | 16.7 | 83.9 | 1.94 | −0.43 | 0.48 | 1.99 | 1.12 | −1.68 | −0.33 | |
| 13 | Tigua | Trip. | AAB | 0.33 | 81.0 | 18.9 | 86.7 | 0.87 | 0.06 | 0.77 | 1.70 | 1.00 | −0.58 | 0.15 | |
| 14 | Dwarf Red | Trip. | AAA | 0 | 90.1 | 18.1 | 79.7 | 1.62 | −0.12 | 0.06 | 1.56 | 0.84 | −1.23 | −0.65 | |
| 15 | Kirkirnan | Dip. | AA | 0 | 59.0 | 19.6 | 99.2 | −0.93 | 0.21 | 2.05 | 1.33 | 0.97 | 0.81 | 1.87 | |
| 16 | Musa acuminata ssp. zebrina | Dip. | AA | 0 | 63.5 | 29.6 | 72.8 | −0.56 | 2.39 | −0.65 | 1.18 | 0.55 | 2.08 | −1.35 | |
| 17 | Ainu | Trip. | AAB | 0.33 | 74.1 | 16.1 | 88.1 | 0.31 | −0.57 | 0.92 | 0.66 | 0.46 | −0.62 | 0.82 | |
| 18 | Pisang Nangka | Trip. | AAA | 0 | 65.9 | 19.4 | 85.5 | −0.36 | 0.17 | 0.65 | 0.47 | 0.33 | 0.38 | 0.58 | |
| 19 | Mangat | Trip. | AAB | 0.33 | 76.1 | 16.1 | 84.2 | 0.47 | −0.55 | 0.51 | 0.44 | 0.30 | −0.72 | 0.42 | |
| 20 | Lady Finger | Trip. | AAB | 0.33 | 86.0 | 19.5 | 68.8 | 1.28 | 0.19 | −1.06 | 0.41 | 0.09 | −0.78 | −1.48 | |
| 21 | Monthan Short | Trip. | ABB | 0.66 | 69.6 | 20.0 | 80.4 | −0.06 | 0.30 | 0.13 | 0.37 | 0.21 | 0.25 | −0.02 | |
| 22 | Sugar | Trip. | AAB | 0.33 | 61.4 | 22.1 | 81.5 | −0.73 | 0.76 | 0.24 | 0.27 | 0.17 | 1.06 | 0.16 | |
| 23 | Kluai Teparot | Trip. | ABB | 0.66 | 75.6 | 15.0 | 84.3 | 0.43 | −0.80 | 0.52 | 0.16 | 0.15 | −0.87 | 0.57 | |
| 24 | Lakatan | Trip. | AAA | 0 | 77.4 | 14.0 | 84.6 | 0.58 | −1.02 | 0.56 | 0.11 | 0.13 | −1.13 | 0.63 | |
| 25 | Igisahira Gsanzwe | Trip. | AAA | 0 | 75.9 | 16.4 | 80.0 | 0.46 | −0.49 | 0.09 | 0.05 | 0.04 | −0.67 | 0.09 | |
| 26 | Musa coccinea | Dip. | NA | 0 | 46.9 | 30.8 | 72.6 | −1.92 | 2.64 | −0.67 | 0.04 | −0.06 | 3.22 | −0.86 | |
| 27 | Pisang Susu | Trip. | AAA | 0 | 67.2 | 15.8 | 84.0 | −0.26 | −0.62 | 0.50 | −0.38 | −0.14 | −0.26 | 0.79 | |
| 28 | PA 03.22 | Tetra. | AAAB | 0.25 | 68.1 | 16.9 | 75.9 | −0.18 | −0.37 | −0.33 | −0.88 | −0.51 | −0.14 | 0.01 | |
| 29 | IC2 | Tetra. | AAAA | 0 | 65.5 | 19.7 | 71.4 | −0.39 | 0.23 | −0.80 | −0.97 | −0.61 | 0.44 | −0.52 | |
| 30 | Goly Goly Pot Pot | Trip. | ABB | 0.66 | 76.2 | 19.0 | 62.4 | 0.48 | 0.08 | −1.71 | −1.15 | −0.83 | −0.29 | −1.55 | |
| 31 | Horn Plantain | Trip. | AAB | 0.33 | 68.6 | 14.1 | 76.7 | −0.14 | −0.99 | −0.26 | −1.38 | −0.77 | −0.59 | 0.33 | |
| 32 | Pacific Plantain | Trip. | AAB | 0.33 | 63.1 | 16.6 | 75.4 | −0.59 | −0.45 | −0.38 | −1.42 | −0.81 | 0.10 | 0.20 | |
| 33 | Bluggoe | Trip. | ABB | 0.66 | 64.8 | 17.0 | 70.9 | −0.45 | −0.36 | −0.85 | −1.66 | −0.99 | 0.07 | −0.26 | |
| 34 | Gros Michel | Trip. | AAA | 0 | 57.1 | 17.1 | 76.5 | −1.08 | −0.33 | −0.28 | −1.69 | −0.93 | 0.53 | 0.44 | |
| 35 | Kandrian | Trip. | ABB | 0.66 | 60.3 | 17.2 | 73.3 | −0.82 | −0.31 | −0.60 | −1.73 | −1.00 | 0.37 | 0.07 | |
| 36 | Pisang Gajih Merah | Trip. | ABB | 0.66 | 56.8 | 12.4 | 84.6 | −1.11 | −1.36 | 0.56 | −1.91 | −0.95 | −0.17 | 1.57 | |
| 37 | Vunamami | Dip. | AS | 0 | 53.4 | 14.4 | 81.6 | −1.39 | −0.93 | 0.25 | −2.07 | −1.07 | 0.33 | 1.26 | |
| 38 | Ducasse | Trip. | ABB | 0.66 | 60.1 | 16.4 | 70.8 | −0.84 | −0.49 | −0.86 | −2.19 | −1.27 | 0.24 | −0.03 | |
| 39 | Inarnibal | Dip. | AA | 0 | 66.1 | 13.7 | 71.2 | −0.34 | −1.09 | −0.81 | −2.25 | −1.30 | −0.52 | 0.06 | |
| 40 | Pisang Mas | Dip. | AA | 0 | 61.9 | 13.7 | 72.7 | −0.69 | −1.08 | −0.67 | −2.44 | −1.38 | −0.27 | 0.32 | |
| 41 | FHIA-25 | Trip. | AAB | 0.33 | 69.2 | 14.3 | 61.6 | −0.09 | −0.95 | −1.80 | −2.84 | −1.74 | −0.60 | −0.87 | |
| 42 | Musa balbisiana | Dip. | BB | 1 | 60.9 | 16.1 | 63.8 | −0.77 | −0.55 | −1.57 | −2.90 | −1.74 | 0.16 | −0.57 | |
| 43 | Yangambi Km5 | Trip. | AAA | 0 | 59.2 | 14.4 | 67.3 | −0.91 | −0.93 | −1.22 | −3.06 | −1.78 | −0.01 | −0.06 | |
| 44 | Musa ornata | Dip. | NA | 0 | 56.1 | 14.9 | 66.9 | −1.17 | −0.81 | −1.26 | −3.23 | −1.88 | 0.25 | −0.03 | |
| 45 | Pisang Ceylan | Trip. | AAB | 0.33 | 63.7 | 12.9 | 61.9 | −0.54 | −1.26 | −1.76 | −3.57 | −2.12 | −0.51 | −0.49 | |
| 46 | Calcutta 4 | Dip. | AA | 0 | 47.8 | 14.1 | 64.5 | −1.85 | −0.99 | −1.50 | −4.34 | −2.50 | 0.61 | 0.18 |
Ploidy, ploidy level; Dip., diploid; Trip., triploid; Tetra., tetraploid.
PCA results for diverse Musa lines
A PCA analysis of leaf traits data was performed for 46 Musa genetic lines in which the lines were ordered according to the sum of z-scores for LMA, TAC and iWUE traits (Table 2). The first two PCA axes (PC1 and PC2) explained a total of 81.4% of the observed variation in the leaf trait dataset (52.7% and 28.7% in PC1 and PC2, respectively). The loading plot (Fig. 3) showed that PC1 was positively related to all variables iWUE, LMA and TAC. Of the three variables, the contribution of iWUE to the PC1 was higher than LMA and TAC, as the iWUE vector was more parallel to the PC1 axis. On the other hand, LMA and TAC were the main contributors to the PC2 axis.
Principal components analysis of leaf functional traits. The PCA biplot shows the 46 Musa lines as numbers in the plane formed by two principal components and the leaf functional trait variables, leaf mass per area (LMA), intrinsic water use efficiency (iWUE) and total antioxidant capacity, are shown as vectors (arrows). The Musa lines were grouped by ploidy levels.
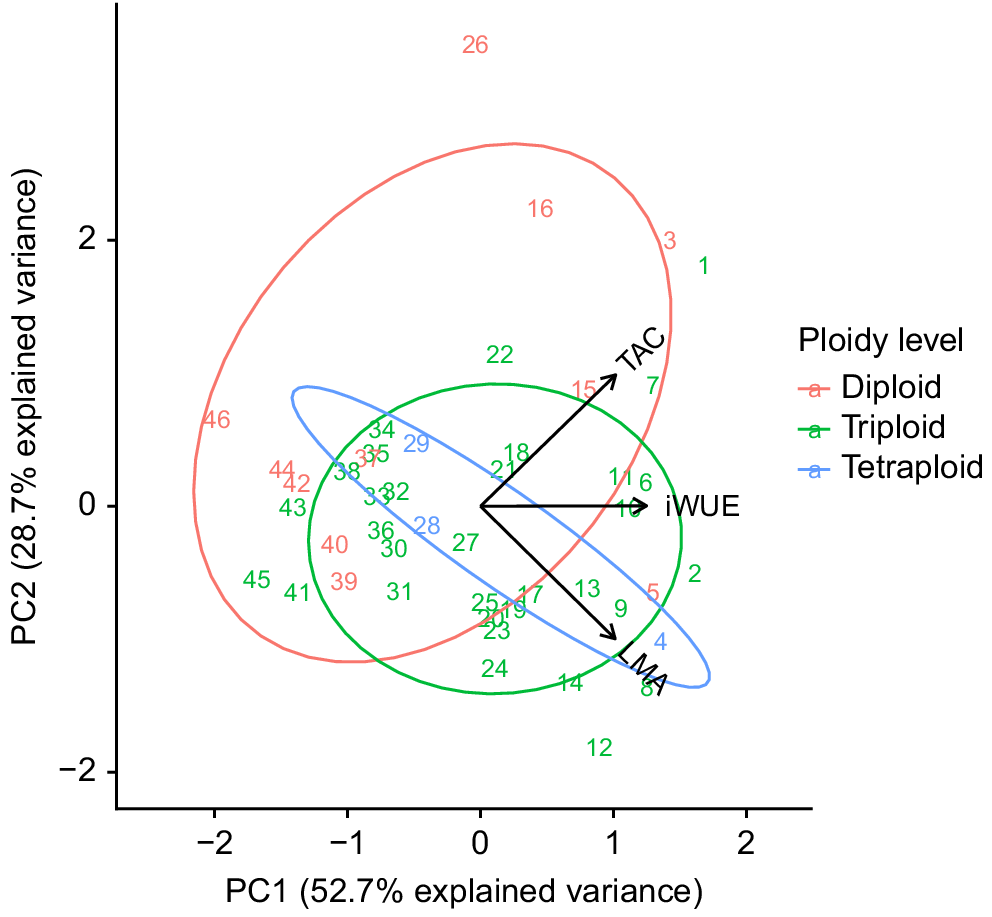
A permutational multivariate analysis of variance was conducted, to test whether the distribution of ploidy groups in PCA space differed (Fig. 3). The permutation test showed that there were significant differences among the ploidy levels (F(2, 43) = 3.27, P = 0.02). A pairwise Adonis analysis revealed a significant difference between diploid and triploid lines (P = 0.005, Fig. 3), but no significant differences between tetraploid and either triploid or diploid lines. Further, only for the triploid dataset, a similar PCA analysis was conducted to identify the effect of B genome. The result showed that the proportion of B genome had no significant effect on the PCA distributions (F(2, 29) = 1.39, P = 0.26). Thus, we found evidence of an association between ploidy level and traits relevant to O3 susceptibility but no such association with the proportion of B genome in the triploid lines.
Discussion
In this study, we investigated the effects of O3 on above-ground biomass and leaf functional traits of the banana cv. Williams grown under different O3 concentrations in OTCs. In addition, we examined the range of functional traits known to mitigate O3 susceptibility in other species expressed across the Musa genus grown under common garden conditions. As the future predictions of O3 concentrations across the tropics continue to rise (Mills et al. 2018b; Brown et al. 2022), it is important to identify the potential O3 risks on banana production, and at the same time explore the range of potential O3 tolerance across genetic lines as a basis for future plant breeding programs.
Responses of biomass to O3 for cv. Williams
O3 exposure had significant effects on the biomass of cv. Williams. The results showed a significant reduction in both pseudostem (including corm biomass) and new shoots (small suckers) biomass with increasing O3 flux. However, there was no change in leaf biomass with the POD1 (or indeed other metrics of O3 exposure AOT40 or POD6). In general, studies show that O3 has negative impacts on total plant biomass (Wittig et al. 2009; Emberson et al. 2018); however, in those studies that partitioned above-ground biomass into components, similar results have been found to our findings with banana. In Holm oak (Quercus ilex), Gerosa et al. (2015) found that while stem biomass significantly reduced under high O3, leaf biomass showed no decline. It appears that at high O3 exposure, plants preferentially drive energy to the maintenance of leaf metabolism and/or to production of new leaves, decreasing the allocation of biomass to below-ground, structural or storage components of the plant (Moura et al. 2018b; Holder and Hayes 2022).
Responses of leaf functional traits to O3 for cv. Williams
The study of biochemical traits across O3 exposure showed a significant increase in old-leaf TAC and TPC with increasing O3 flux (e.g. POD1 and POD6). Gao et al. (2016) also reported that elevated O3 significantly increased both leaf TAC and TPC in four Chinese tree species. Similarly, an increase in TPC alone due to O3 exposure has been regularly observed (Saleem et al. 2001; Yamaji et al. 2003). The increase in TPC can be related to their defensive role against oxidative stress through their action as ROS scavengers (Oksanen et al. 2013). The change in TAC is consistent with changes in TPC, as phenolic compounds are the main contributors to the antioxidant properties of plant extracts (Dudonné et al. 2009). However, the new-leaf TAC and TPC were found to not relate to O3 flux. Hence, this study suggests that plant leaves respond to cumulative O3 exposure by increasing antioxidants, rather than constitutively upregulating antioxidant content in new leaf tissue.
Our results from cv. Williams show that there was no significant trend in LMA with increasing O3 flux. Although interspecific variation in O3 susceptibility among tree species can, to a large extent, be explained by variation in LMA (Feng et al. 2018), meta-analysis has shown that LMA itself is not much altered by elevated O3 (Poorter et al. 2009). A recent study on C4 species showed that elevated O3 had no significant effect on LMA (Li et al. 2022), while Shang et al. (2017) found that LMA significantly reduced with increasing O3 metric in particular poplar (Populus spp.) clones. These differences may be related to the O3 susceptibility of plant species themselves, with LMA responses being both cultivar- and species-specific (Dai et al. 2017; Feng et al. 2018).
Several studies have shown that elevated O3 decreases plant iWUE (Masutomi et al. 2019; Xu et al. 2020; Li et al. 2021). Commonly, elevated O3 exposure reduces plant net photosynthesis much more than it does stomatal conductance, leading to a decline in leaf iWUE, as iWUE is the ratio of photosynthesis to stomatal conductance (Hoshika et al. 2015; Xu et al. 2020, 2021). However, other studies also have indicated that iWUE is not impacted by elevated O3 (Zhang et al. 2014; Sugai et al. 2018; Li et al. 2019). In cv. Williams, we did not find any significant relationship between iWUE and O3 flux. This may be due to the change in both A and gs proportionally by O3 exposure (Zhang et al. 2014; Li et al. 2019), or the dominance of the δ13C signal by structural carbon laid down in the young leaf during development (Vogado et al. 2020).
Correlations among leaf functional traits in diverse Musa lines
We found large variability and correlation in the values of LMA, TAC and iWUE among the 46 lines of Musa studied. In general, LMA is used to express the degree of a plant’s adaptations and acclimation to its surroundings. Leaves with high LMA have thicker and/or denser leaves compared to those with low LMA. Accordingly, they typically have a higher nitrogen content per unit leaf surface; as a result, they have a high photosynthesis rate and a high iWUE (Bussotti 2008). These traits make plants less reactive to environmental stressors and enable them to support the detoxification process (Bussotti 2008). In this regard, the correlation among these leaf traits of 46 Musa lines was consistent with more general observations. Moreover, our PCA results were consistent with our correlation tests. Of the three variables, the contribution of iWUE to the PC1 was higher than LMA and TAC, indicating selection for high iWUE, already used as an important indicator for crop improvement (Masutomi et al. 2019), may have additional benefits for conferring O3 tolerance. The observed positive relationship between putative determinants of O3 tolerance provides support for an additive z-value (i.e. iWUE + LMA + TAC) to determine projected O3 susceptibility (Table 2).
There was a significant effect of ploidy level on the leaf functional traits of the 46 Musa lines tested. Our analyses showed that diploid lines were significantly different from triploid lines (Fig. 3), with our results suggesting that the diploid lines could have a lower tolerance to O3 as compared to triploid lines. General observations have shown that AA diploids are more susceptible to drought than most triploids (Ravi et al. 2013), leading to the suggestion that triploid accessions are generally more stress tolerant. We saw no significant differences between tetraploid and either diploid or triploid lines, however, this was probably due to low numbers of observations with only three tetraploids among 46 lines tested. It has been suggested that the presence of B genome may confer some advantage under abiotic stress, with the B genome showing greater tolerance to drought than those entirely based on the A genome (Thomas et al. 1998; Ravi et al. 2013; Delfin et al. 2016). However, we could not find any significant effects of B genome levels on the leaf trait variables tested. A possible reason is that the assumption of full segregation between the A and B genomes simply does not exist as demonstrated by Baurens et al. (2019).
Evaluation of combined results
Examining functional trait diversity present across the Musa genus, we projected an O3 tolerance ranking (Table 2) among the 46 lines tested. The highest-ranked (putative O3 tolerant) lines include accessions like cv. Goldfinger (FHIA-01), noted for their tolerance to cold, pests and disease (Orjeda et al. 1999; Daniells and Bryde 2001; Mintoff et al. 2021), and cv. Williams noted as being resistant to mechanical stress due to robust leaves (J. Daniells, pers. comm.). Therefore, our ranking of banana accessions may be consistent with generalised stress tolerance. The predicted ranking provides a context for the extrapolation of our OTC results in cv. Williams to the Musa genus more broadly as well as identifying accessions for future O3 risk assessment.
The results of our Musa genus study with respect to LMA, iWUE, and TAC suggest that cv. Williams could be considered amongst the more O3 tolerant cultivars of the 46 lines tested here. Considering our OTC experiment results showing the susceptibility of cv. Williams to O3, we would expect the other lower-ranked Musa genetic lines to be even more susceptible to O3. This information will be important for predicting food security in regions where O3 concentrations are already high or will further increase in the future. For example, in Africa, banana production represents an important staple food crop. Whereas other staple food crops such as Triticum aestivum (wheat) and Phaseolus vulgaris (bean) are already known to be sensitive to O3 (Hayes et al. 2020), nothing is yet known about the susceptibility of local banana varieties to O3. Our experimental results suggest there could be a substantial risk from O3 on banana production in Africa. Experimental work on different Musa genetic lines would be required to confirm our presumed variation in susceptibility, while work with larger plants would be required to extend our observation on biomass gain to impacts on fruit yield and crop production losses.
Conclusion
We have demonstrated the scale and possible prevalence of O3 susceptibility in the important tropical food group Musa. Securing agricultural production and food security across tropical regions will require the development of agricultural practice including improved cultivar selection and efficient irrigation management. However, both of these practices may incur unintended consequences in the form of increased impacts of O3 damage (Harmens et al. 2019). For example, the selection of high-yielding cultivars with associated increased stomatal conductance (gs) has been postulated as the reason behind the substantial variation observed in O3 susceptibility of wheat lines (Biswas et al. 2008). Similarly, the alleviation of soil water deficit via targeted irrigation may lead to higher gs thereby increasing the flux of O3 into crop leaves during periods (such as local biomass burning) in which O3 concentration may be high. Here, we have established susceptibility to O3 in the biomass production of a widely planted banana cultivar. We have also explored on an empirical basis the potential for O3 tolerance among a diverse collection of wild species, cultivars and synthetic hybrids in the genus Musa. Development of cultivars with O3 tolerance traits, in addition to those traits desirable for food production, could contribute to safeguarding tropical food supplies as O3 pollution continues to rise.
Data availability
The data that supports this study are openly available on Dryad (doi:10.5061/dryad.fbg79cp26).
Declaration of funding
This work was supported by Natural Environment Research Council (NERC), UK funding (Grant no. NE/R001812/1).
Author contributions
Mst Nahid Farha: Methodology, Investigation, Formal Analysis, Writing – Original draft preparation. Jeff Daniells: Resources, Writing – Review and Editing. Lucas A. Cernusak: Supervision, Resources, Writing – Review and Editing. Edita Ritmejerytė: Methodology, Writing – Review and Editing. Phurpa Wangchuk: Resources, Writing – Review and Editing. Stephen Sitch: Funding Acquisition, Writing – Review and Editing. Lina M. Mercado: Funding Acquisition, Writing – Review and Editing. Felicity Hayes: Funding Acquisition, Writing – Review and Editing. Flossie Brown: Investigation, Formal Analysis, Writing – Review and Editing. Alexander W. Cheesman: Conceptualisation, Methodology, Investigation, Formal Analysis, Project administration, Funding acquisition, Writing – Review and Editing.
Acknowledgements
We thank Catherine Vis and Dr Jen Whan at the Environmental Research Complex and Advanced Analytical Centre of James Cook University for their help in collecting basic data.
References
Ainsworth EA (2017) Understanding and improving global crop response to ozone pollution. The Plant Journal 90(5), 886-897.
| Crossref | Google Scholar | PubMed |
Ainsworth EA, Yendrek CR, Sitch S, Collins WJ, Emberson LD (2012) The effects of tropospheric ozone on net primary productivity and implications for climate change. Annual Review of Plant Biology 63, 637-661.
| Crossref | Google Scholar | PubMed |
Ainsworth EA, Lemonnier P, Wedow JM (2020) The influence of rising tropospheric carbon dioxide and ozone on plant productivity. Plant Biology 22, 5-11.
| Crossref | Google Scholar | PubMed |
Alencar ERd, Faroni LRD, Pinto MdS, Costa ARd, Silva TAd (2013) Postharvest quality of ozonized “nanicao” cv. bananas. Revista Ciência Agronômica 44(1), 107-114.
| Crossref | Google Scholar |
Bailey A, Burkey K, Taggart M, Rufty T (2019) Leaf traits that contribute to differential ozone response in ozone-tolerant and sensitive soybean genotypes. Plants 8(7), 235.
| Crossref | Google Scholar | PubMed |
Baurens F-C, Martin G, Hervouet C, Salmon F, Yohomé D, Ricci S, Rouard M, Habas R, Lemainque A, Yahiaoui N, D’Hont A (2019) Recombination and large structural variations shape interspecific edible bananas genomes. Molecular Biology and Evolution 36(1), 97-111.
| Crossref | Google Scholar | PubMed |
Beer C, Ciais P, Reichstein M, Baldocchi D, Law BE, Papale D, Soussana J-F, Ammann C, Buchmann N, Frank D, Gianelle D, Janssens IA, Knohl A, Köstner B, Moors E, Roupsard O, Verbeeck H, Vesala T, Williams CA, Wohlfahrt G (2009) Temporal and among-site variability of inherent water use efficiency at the ecosystem level. Global Biogeochemical Cycles 23(2), GB2018.
| Crossref | Google Scholar |
Benzie IFF, Strain JJ (1996) The ferric reducing ability of plasma (FRAP) as a measure of “antioxidant power”: the FRAP assay. Analytical Biochemistry 239(1), 70-76.
| Crossref | Google Scholar | PubMed |
Biswas DK, Xu H, Li YG, Sun JZ, Wang XZ, Han XG, Jiang GM (2008) Genotypic differences in leaf biochemical, physiological and growth responses to ozone in 20 winter wheat cultivars released over the past 60 years. Global Change Biology 14(1), 46-59.
| Crossref | Google Scholar |
Brown F, Folberth GA, Sitch S, Bauer S, Bauters M, Boeckx P, Cheesman AW, Deushi M, Dos Santos Vieira I, Galy-Lacaux C, et al. (2022) The ozone–climate penalty over South America and Africa by 2100. Atmospheric Chemistry and Physics 22, 12331-12352.
| Crossref | Google Scholar |
Bussotti F (2008) Functional leaf traits, plant communities and acclimation processes in relation to oxidative stress in trees: a critical overview. Global Change Biology 14(11), 2727-2739.
| Crossref | Google Scholar |
Cernusak LA, Farha MN, Cheesman AW (2021) Understanding how ozone impacts plant water-use efficiency. Tree Physiology 41(12), 2229-2233.
| Crossref | Google Scholar | PubMed |
Cheesman AW, Brown F, Farha MN, Rosan TM, Folberth GA, Hayes F, et al. (2023) Impacts of ground-level ozone on sugarcane production. Science of The Total Environment 904, 166817.
| Crossref | Google Scholar |
Cork SJ, Krockenberger AK (1991) Methods and pitfalls of extracting condensed tannins and other phenolics from plants: insights from investigations on Eucalyptus leaves. Journal of Chemical Ecology 17(1), 123-134.
| Crossref | Google Scholar | PubMed |
Dai L, Li P, Shang B, Liu S, Yang A, Wang Y, Feng Z (2017) Differential responses of peach (Prunus persica) seedlings to elevated ozone are related with leaf mass per area, antioxidant enzymes activity rather than stomatal conductance. Environmental Pollution 227, 380-388.
| Crossref | Google Scholar | PubMed |
Delfin EF, Ocampo ETM, dela Cueva FM, Damasco OP, de la Cruz F, Dinglasan EG, Gueco LS, Herradura LE, Molina AB (2016) Response of wild and edible Musa spp. seedlings to limiting moisture stress. Philippine Journal of Crop Science 41(3), 1-12.
| Google Scholar |
Dudonné S, Vitrac X, Coutière P, Woillez M, Mérillon J-M (2009) Comparative study of antioxidant properties and total phenolic content of 30 plant extracts of industrial interest using DPPH, ABTS, FRAP, SOD, and ORAC assays. Journal of Agricultural and Food Chemistry 57(5), 1768-1774.
| Crossref | Google Scholar | PubMed |
Dusart N, Gandin A, Vaultier M-N, Joffe R, Cabane M, Dizengremel P, Jolivet Y (2019) Importance of detoxification processes in ozone risk assessment: need to integrate the cellular compartmentation of antioxidants? Frontiers in Forests and Global Change 2, 45.
| Crossref | Google Scholar |
Emberson LD, Ashmore MR, Cambridge HM, Simpson D, Tuovinen J-P (2000) Modelling stomatal ozone flux across Europe. Environmental Pollution 109(3), 403-413.
| Crossref | Google Scholar | PubMed |
Emberson LD, Büker P, Ashmore MR, Mills G, Jackson LS, Agrawal M, Atikuzzaman MD, Cinderby S, Engardt M, Jamir C, et al. (2009) A comparison of North American and Asian exposure–response data for ozone effects on crop yields. Atmospheric Environment 43(12), 1945-1953.
| Crossref | Google Scholar |
Emberson LD, Pleijel H, Ainsworth EA, van den Berg M, Ren W, Osborne S, Mills G, Pandey D, Dentener F, Büker P, et al. (2018) Ozone effects on crops and consideration in crop models. European Journal of Agronomy 100, 19-34.
| Crossref | Google Scholar |
FAO (2022) Markets and trade: bananas. Available at https://www.fao.org/economic/est/est-commodities/oilcrops/bananas/en/ [Accessed 28 July 2022]
Farquhar GD, Richards RA (1984) Isotopic composition of plant carbon correlates with water-use efficiency of wheat genotypes. Functional Plant Biology 11(6), 539-552.
| Crossref | Google Scholar |
Farquhar GD, O’Leary MH, Berry JA (1982) On the relationship between carbon isotope discrimination and the intercellular carbon dioxide concentration in leaves. Functional Plant Biology 9(2), 121-137.
| Crossref | Google Scholar |
Farquhar GD, Ehleringer JR, Hubick KT (1989) Carbon isotope discrimination and photosynthesis. Annual Review of Plant Physiology and Plant Molecular Biology 40(1), 503-537.
| Crossref | Google Scholar |
Feng Z, Pang J, Nouchi I, Kobayashi K, Yamakawa T, Zhu J (2010) Apoplastic ascorbate contributes to the differential ozone sensitivity in two varieties of winter wheat under fully open-air field conditions. Environmental Pollution 158(12), 3539-3545.
| Crossref | Google Scholar | PubMed |
Feng Z, Büker P, Pleijel H, Emberson L, Karlsson PE, Uddling J (2018) A unifying explanation for variation in ozone sensitivity among woody plants. Global Change Biology 24(1), 78-84.
| Crossref | Google Scholar | PubMed |
Feng Z, Xu Y, Kobayashi K, Dai L, Zhang T, Agathokleous E, Calatayud V, Paoletti E, Mukherjee A, Agrawal M, et al. (2022) Ozone pollution threatens the production of major staple crops in East Asia. Nature Food 3(1), 47-56.
| Crossref | Google Scholar | PubMed |
Gao F, Calatayud V, García-Breijo F, Reig-Armiñana J, Feng Z (2016) Effects of elevated ozone on physiological, anatomical and ultrastructural characteristics of four common urban tree species in China. Ecological Indicators 67, 367-379.
| Crossref | Google Scholar |
Gerosa G, Fusaro L, Monga R, Finco A, Fares S, Manes F, Marzuoli R (2015) A flux-based assessment of above and below ground biomass of Holm oak (Quercus ilex L.) seedlings after one season of exposure to high ozone concentrations. Atmospheric Environment 113, 41-49.
| Crossref | Google Scholar |
Gillespie KM, Chae JM, Ainsworth EA (2007) Rapid measurement of total antioxidant capacity in plants. Nature Protocols 2(4), 867-870.
| Crossref | Google Scholar | PubMed |
Harmens H, Hayes F, Sharps K, Radbourne A, Mills G (2019) Can reduced irrigation mitigate ozone impacts on an ozone-sensitive African wheat variety? Plants 8(7), 220.
| Crossref | Google Scholar | PubMed |
Hayes F, Sharps K, Harmens H, Roberts I, Mills G (2020) Tropospheric ozone pollution reduces the yield of African crops. Journal of Agronomy and Crop Science 206(2), 214-228.
| Crossref | Google Scholar |
Holder AJ, Hayes F (2022) Substantial yield reduction in sweet potato due to tropospheric ozone, the dose-response function. Environmental Pollution 304, 119209.
| Crossref | Google Scholar | PubMed |
Hoshika Y, Katata G, Deushi M, Watanabe M, Koike T, Paoletti E (2015) Ozone-induced stomatal sluggishness changes carbon and water balance of temperate deciduous forests. Scientific Reports 5(1), 9871.
| Crossref | Google Scholar |
Hoshika Y, Carrari E, Zhang L, Carriero G, Pignatelli S, Fasano G, Materassi A, Paoletti E (2018) Testing a ratio of photosynthesis to O3 uptake as an index for assessing O3-induced foliar visible injury in poplar trees. Environmental Science and Pollution Research 25, 8113-8124.
| Crossref | Google Scholar | PubMed |
Hurlbert SH (2004) On misinterpretations of pseudoreplication and related matters: a reply to Oksanen. Oikos 104, 591-597.
| Crossref | Google Scholar |
Inada H, Kondo T, Akhtar N, Hoshino D, Yamaguchi M, Izuta T (2012) Relationship between cultivar difference in the sensitivity of net photosynthesis to ozone and reactive oxygen species scavenging system in Japanese winter wheat (Triticum aestivum). Physiologia Plantarum 146(2), 217-227.
| Crossref | Google Scholar | PubMed |
Jarvis P (1976) The interpretation of the variations in leaf water potential and stomatal conductance found in canopies in the field. Philosophical Transactions of the Royal Society of London. B, Biological Sciences 273(927), 593-610.
| Crossref | Google Scholar |
Karlsson PE, Braun S, Broadmeadow M, Elvira S, Emberson L, Gimeno BS, Le Thiec D, Novak K, Oksanen E, Schaub M, Uddling J, Wilkinson M (2007) Risk assessments for forest trees: the performance of the ozone flux versus the AOT concepts. Environmental Pollution 146(3), 608-616.
| Crossref | Google Scholar | PubMed |
Kolb TE, Matyssek R (2001) Limitations and perspectives about scaling ozone impacts in trees. Environmental Pollution 115(3), 373-393.
| Crossref | Google Scholar |
Kreyling J, Schweiger AH, Bahn M, Ineson P, Migliavacca M, Morel-Journel T, Christiansen JR, Schtickzelle N, Larsen KS (2018) To replicate, or not to replicate – that is the question: how to tackle nonlinear responses in ecological experiments. Ecology Letters 21(11), 1629-1638.
| Crossref | Google Scholar | PubMed |
Kunhikrishnan T, Lawrence MG, von Kuhlmann R, Richter A, Ladstätter-Weißenmayer A, Burrows JP (2004) Analysis of tropospheric NOx over Asia using the model of atmospheric transport and chemistry (MATCH-MPIC) and GOME-satellite observations. Atmospheric Environment 38(4), 581-596.
| Crossref | Google Scholar |
Leventidou E, Weber M, Eichmann K-U, Burrows J P, Heue K-P, Thompson AM, Johnson BJ (2018) Harmonisation and trends of 20-year tropical tropospheric ozone data. Atmospheric Chemistry and Physics 18(13), 9189-9205.
| Crossref | Google Scholar |
Li P, Calatayud V, Gao F, Uddling J, Feng Z (2016) Differences in ozone sensitivity among woody species are related to leaf morphology and antioxidant levels. Tree Physiology 36(9), 1105-1116.
| Crossref | Google Scholar | PubMed |
Li S, Courbet G, Ourry A, Ainsworth EA (2019) Elevated ozone concentration reduces photosynthetic carbon gain but does not alter leaf structural traits, nutrient composition or biomass in switchgrass. Plants 8(4), 85.
| Crossref | Google Scholar | PubMed |
Li P, Feng Z, Shang B, Uddling J (2021) Combining carbon and oxygen isotopic signatures to identify ozone-induced declines in tree water-use efficiency. Tree Physiology 41(12), 2234-2244.
| Crossref | Google Scholar | PubMed |
Li S, Moller CA, Mitchell NG, Lee D, Sacks EJ, Ainsworth EA (2022) Testing unified theories for ozone response in C4 species. Global Change Biology 28(10), 3379-3393.
| Crossref | Google Scholar | PubMed |
Martinez Arbizu P (2020) pairwiseAdonis: pairwise multilevel comparison using adonis. R package version 0.4. Available at www.github.com/pmartinezarbizu/pairwiseAdonis/
Masutomi Y, Kinose Y, Takimoto T, Yonekura T, Oue H, Kobayashi K (2019) Ozone changes the linear relationship between photosynthesis and stomatal conductance and decreases water use efficiency in rice. Science of The Total Environment 655, 1009-1016.
| Crossref | Google Scholar | PubMed |
Mills G, Sharps K, Simpson D, Pleijel H, Frei M, Burkey K, Emberson L, Uddling J, Broberg M, Feng Z, et al. (2018a) Closing the global ozone yield gap: quantification and cobenefits for multistress tolerance. Global Change Biology 24(10), 4869-4893.
| Crossref | Google Scholar | PubMed |
Mills G, Pleijel H, Malley CS, Sinha B, Cooper OR, Schultz MG, Neufeld HS, Simpson D, Sharps K, Feng Z, et al. (2018b) Tropospheric ozone assessment report: present-day tropospheric ozone distribution and trends relevant to vegetation. Elementa: Science of the Anthropocene 6, 47.
| Crossref | Google Scholar |
Mintoff SJL, Nguyen TV, Kelly C, Cullen S, Hearnden M, Williams R, Daniells JW, Tran-Nguyen LTT (2021) Banana cultivar field screening for resistance to Fusarium oxysporum f.sp. cubense tropical race 4 in the Northern Territory. Journal of Fungi 7(8), 627.
| Crossref | Google Scholar | PubMed |
Monks PS, Archibald AT, Colette A, Cooper O, Coyle M, Derwent R, Fowler D, Granier C, Law KS, Mills GE, et al. (2015) Tropospheric ozone and its precursors from the urban to the global scale from air quality to short-lived climate forcer. Atmospheric Chemistry and Physics 15(15), 8889-8973.
| Crossref | Google Scholar |
Moura BB, Alves ES, Marabesi MA, de Souza SR, Schaub M, Vollenweider P (2018a) Ozone affects leaf physiology and causes injury to foliage of native tree species from the tropical Atlantic Forest of southern Brazil. Science of The Total Environment 610-611, 912-925.
| Crossref | Google Scholar | PubMed |
Moura BB, Hoshika Y, Ribeiro RV, Paoletti E (2018b) Exposure- and flux-based assessment of ozone risk to sugarcane plants. Atmospheric Environment 176, 252-260.
| Crossref | Google Scholar |
Nansamba M, Sibiya J, Tumuhimbise R, Karamura D, Kubiriba J, Karamura E (2020) Breeding banana (Musa spp.) for drought tolerance: a review. Plant Breeding 139(4), 685-696.
| Crossref | Google Scholar |
Oksanen E, Keski-Saari S, Kontunen-Soppela S, Keinänen M (2013) Metabolomics and transcriptomics increase our understanding about defence responses and genotypic differences of northern deciduous trees to elevating ozone, CO2 and climate warming. In ‘Developments in environmental science, Vol. 13’. (Eds R Matyssek, N Clarke, P Cudlin, TN Mikkelsen, JP Tuovinen, G Wieser, E Paoletti) pp. 309–329. (Elsevier: Oxford, UK)
Oksanen J, Blanchet F, Friendly M, Kindt R, Legendre P, McGlinn D, Minchin P, O’Hara R, Simpson R, Solymos P (2020) vegan community ecology package R package version 2. 5–7. Available at https://CRAN.R-project.org/package=vegan
Orjeda G, Escalant J-V, Moore N (1999) The international Musa Testing Programme (IMTP) phase II overview of final report and summary of results. InfoMusa 8, 3-10.
| Google Scholar |
Poorter H, Niinemets Ü, Poorter L, Wright IJ, Villar R (2009) Causes and consequences of variation in leaf mass per area (LMA): a meta-analysis. New Phytologist 182(3), 565-588.
| Crossref | Google Scholar | PubMed |
Potvin C, Tardif S (1988) Sources of variability and experimental designs in growth chambers. Functional Ecology 2, 123-130.
| Crossref | Google Scholar |
Pääkkönen E, Holopainen T, Kärenlampi L (1997) Variation in ozone sensitivity among clones of Betula pendula and Betula pubescens. Environmental Pollution 95(1), 37-44.
| Crossref | Google Scholar | PubMed |
R Core Team (2019) ‘R: a language and environment for statistical computing.’ (R Foundation for Statistical Computing: Vienna, Austria). Available at https://www.R-project.org/
Ravi I, Uma S, Vaganan MM, Mustaffa MM (2013) Phenotyping bananas for drought resistance. Frontiers in Physiology 4, 9.
| Crossref | Google Scholar | PubMed |
Ritmejerytė E, Boughton BA, Bayly MJ, Miller RE (2019) Divergent responses of above- and below-ground chemical defence to nitrogen and phosphorus supply in waratahs (Telopea speciosissima). Functional Plant Biology 46(12), 1134-1145.
| Crossref | Google Scholar |
Saleem A, Loponen J, Pihlaja K, Oksanen E (2001) Effects of long-term open-field ozone exposure on leaf phenolics of European silver birch (Betula pendula Roth). Journal of Chemical Ecology 27(5), 1049-1062.
| Crossref | Google Scholar | PubMed |
Sarkar A, Singh AA, Agrawal SB, Ahmad A, Rai SP (2015) Cultivar specific variations in antioxidative defense system, genome and proteome of two tropical rice cultivars against ambient and elevated ozone. Ecotoxicology and Environmental Safety 115, 101-111.
| Crossref | Google Scholar | PubMed |
Shang B, Feng Z, Li P, Yuan X, Xu Y, Calatayud V (2017) Ozone exposure- and flux-based response relationships with photosynthesis, leaf morphology and biomass in two poplar clones. Science of The Total Environment 603-604, 185-195.
| Crossref | Google Scholar | PubMed |
Sharps K, Vieno M, Beck R, Hayes F, Harmens H (2021) Quantifying the impact of ozone on crops in Sub-Saharan Africa demonstrates regional and local hotspots of production loss. Environmental Science and Pollution Research 28, 62338-62352.
| Crossref | Google Scholar | PubMed |
Shekhar S, Rustagi A, Kumar D, Yusuf MA, Sarin NB, Lawrence K (2019) Groundnut AhcAPX conferred abiotic stress tolerance in transgenic banana through modulation of the ascorbate-glutathione pathway. Physiology and Molecular Biology of Plants 25(6), 1349-1366.
| Crossref | Google Scholar | PubMed |
Singh E, Tiwari S, Agrawal M (2010) Variability in antioxidant and metabolite levels, growth and yield of two soybean varieties: an assessment of anticipated yield losses under projected elevation of ozone. Agriculture, Ecosystems & Environment 135(3), 168-177.
| Crossref | Google Scholar |
Singh AA, Agrawal SB, Shahi JP, Agrawal M (2014) Assessment of growth and yield losses in two Zea mays L. cultivars (quality protein maize and nonquality protein maize) under projected levels of ozone. Environmental Science and Pollution Research 21(4), 2628-2641.
| Crossref | Google Scholar | PubMed |
Singleton VL, Rossi JA, Jr. (1965) Colorimetry of total phenolics with phosphomolybdic-phosphotungstic acid reagents. American Journal of Enology and Viticulture 16(3), 144-158.
| Crossref | Google Scholar |
Sugai T, Kam DG, Agathokleous E, Watanabe M, Kita K, Koike T (2018) Growth and photosynthetic response of two larches exposed to O3 mixing ratios ranging from preindustrial to near future. Photosynthetica 56(3), 901-910.
| Crossref | Google Scholar |
Tai APK, Martin MV, Heald CL (2014) Threat to future global food security from climate change and ozone air pollution. Nature Climate Change 4(9), 817-821.
| Crossref | Google Scholar |
Thomas DS, Turner DW, Eamus D (1998) Independent effects of the environment on the leaf gas exchange of three banana (Musa sp.) cultivars of different genomic constitution. Scientia Horticulturae 75(1-2), 41-57.
| Crossref | Google Scholar |
Van Dingenen R, Dentener FJ, Raes F, Krol MC, Emberson L, Cofala J (2009) The global impact of ozone on agricultural crop yields under current and future air quality legislation. Atmospheric Environment 43(3), 604-618.
| Crossref | Google Scholar |
Vogado NO, Winter K, Ubierna N, Farquhar GD, Cernusak LA (2020) Directional change in leaf dry matter δ 13C during leaf development is widespread in C3 plants. Annals of Botany 126(6), 981-990.
| Crossref | Google Scholar | PubMed |
Vu VQ (2011) ggbiplot: a ggplot2 based biplot. R package version 0.55. Available at http://github.com/vqv/ggbiplot
Wickham H, Seidel D (2022) scales: scale functions for visualization. R package version 1.2.1. Available at https://CRAN.R-project.org/package=scales
Wickham H, François R, Henry L, Müller K, Vaughan D (2023) dplyr: a grammar of data manipulation. R package version 1.1.2. Available at https://CRAN.R-project.org/package=dplyr
Wild O, Fiore AM, Shindell DT, Doherty RM, Collins WJ, Dentener FJ, Schultz MG, Gong S, MacKenzie IA, Zeng G, et al. (2012) Modelling future changes in surface ozone: a parameterized approach. Atmospheric Chemistry and Physics 12(4), 2037-2054.
| Crossref | Google Scholar |
Wittig VE, Ainsworth EA, Naidu SL, Karnosky DF, Long SP (2009) Quantifying the impact of current and future tropospheric ozone on tree biomass, growth, physiology and biochemistry: a quantitative meta-analysis. Global Change Biology 15(2), 396-424.
| Crossref | Google Scholar |
Xu Y, Feng Z, Shang B, Yuan X, Tarvainen L (2020) Limited water availability did not protect poplar saplings from water use efficiency reduction under elevated ozone. Forest Ecology and Management 462, 117999.
| Crossref | Google Scholar |
Xu Y, Shang B, Peng J, Feng Z, Tarvainen L (2021) Stomatal response drives between-species difference in predicted leaf water-use efficiency under elevated ozone. Environmental Pollution 269, 116137.
| Crossref | Google Scholar | PubMed |
Yamaji K, Julkunen-Tiitto R, Rousi M, Freiwald V, Oksanen E (2003) Ozone exposure over two growing seasons alters root-to-shoot ratio and chemical composition of birch (Betula pendula Roth). Global Change Biology 9(10), 1363-1377.
| Crossref | Google Scholar |
Yang Q-S, Wu J-H, Li C-Y, Wei Y-R, Sheng O, Hu C-H, Kuang R-B, Huang Y-H, Peng X-X, McCardle JA, Chen W, Yang Y, Rose JKC, Zhang S, Yi G-J (2012) Quantitative proteomic analysis reveals that antioxidation mechanisms contribute to cold tolerance in plantain (Musa paradisiaca L.; ABB Group) seedlings. Molecular & Cellular Proteomics 11(12), 1853-1869.
| Crossref | Google Scholar | PubMed |
Yendrek CR, Koester RP, Ainsworth EA (2015) A comparative analysis of transcriptomic, biochemical, and physiological responses to elevated ozone identifies species-specific mechanisms of resilience in legume crops. Journal of Experimental Botany 66(22), 7101-7112.
| Crossref | Google Scholar | PubMed |
Zhang W, Feng Z, Wang X, Niu J (2012) Responses of native broadleaved woody species to elevated ozone in subtropical China. Environmental Pollution 163, 149-157.
| Crossref | Google Scholar | PubMed |
Zhang W, Feng Z, Wang X, Niu J (2014) Elevated ozone negatively affects photosynthesis of current-year leaves but not previous-year leaves in evergreen Cyclobalanopsis glauca seedlings. Environmental Pollution 184, 676-681.
| Crossref | Google Scholar | PubMed |