

Phenotyping of industrial hemp (Cannabis sativa) genotypes with different growth habits
Alison R. Gill A , Beth R. Loveys A , Christopher J. Brien A B , Nathaniel Jewell A B , Bettina Berger A B , Timothy R. Cavagnaro A C and Rachel A. Burton A *
A
B
C
Abstract
Industrial hemp (Cannabis sativa) has gained renewed scientific and agricultural interest worldwide as a multi-use, high-value crop, with products spanning textile, clothing, medicinal, food, and construction industries. Cannabis exhibits broad genetic diversity and high phenotypic plasticity, with strong genotype × environment interactions, resulting in varied aboveground growth habits from tall and thin to short and bushy. Here, we compared the growth and response to water deficit over time in seedlings of two tall, thin French dual-purpose industrial hemp genotypes, Felina 32 and Ferimon 12, and one short, bushy Chinese dual-purpose genotype, Han NE, using state-of-the-art non-destructive phenotyping and automated gravimetric watering systems. Despite the different growth habits, growth patterns were remarkably similar. Water deficit consistently reduced shoot and root dry weight, plant height, number of leaf pairs, CO2 assimilation, and stomatal conductance in all three genotypes. Han NE showed potential for greater water use efficiency, possibly linked to the shorter bushy growth habit, but further research is needed to evaluate varying growth habits within different environments and over the entire plant lifecycle. This study provides valuable insights into diverse hemp genotypes to inform field-based agronomic decisions and targeted breeding programs.
Keywords: Cannabis sativa, drought stress, genotype-by-environment interactions, growth analysis, growth habit, industrial hemp, non-destructive phenotyping, water deficit, water use efficiency.
Introduction
Industrial hemp (Cannabis sativa) has recently seen renewed interest worldwide due to its multi-use, high-value products and low water requirements. Although industrial hemp is strictly regulated, with maximum allowable levels of 1% w/w Δ9-tetrahydrocannabinol (THC) in Australia (Gordon et al. 2023), hemp seeds show great potential for human and animal nutrition (Schultz et al. 2020; Burton et al. 2022), and hemp fibre, one of the strongest natural fibres, is popular for textiles and clothing, paper production, and construction materials.
Genetic diversity is broad within Cannabis, as its origins are diverse and its cultivation dates back over 6000 years, with breeding for modern purposes covering only a fraction of that time (Amaducci et al. 2015). Additionally, Cannabis plants have high phenotypic plasticity, with strong genotype × environment interactions (Small 2015; Campbell et al. 2019). There are thus many different genotypes and corresponding growth habits within Cannabis (Johnson and Wallace 2021), with growth habits varying between tall, thin types and short, bushy types. While this allows Cannabis to thrive in a broad range of conditions, it also means that traits can vary within the same genotype, creating difficulties for growers. Importantly, this broad range of characteristics is likely to also underly variable responses to abiotic stresses such as drought within industrial hemp.
While studies have investigated water requirements for multiple hemp varieties (e.g. Tang et al. 2018; Campbell et al. 2019; Adesina et al. 2020; Duque Schumacher et al. 2020; Herppich et al. 2020; Gill et al. 2022; Scordia et al. 2022), these mostly occur in field settings at harvest, with limited manipulation of water availability in controlled settings. To the best of our knowledge, there are no studies that utilise state-of-the-art non-destructive high-throughput phenotyping (HTP) or precision watering platforms to accurately measure temporal water use in hemp. HTP permits non-destructive, repeated measurements of plant aboveground biomass over the life of a plant until harvest, reducing errors, (Watts-Williams et al. 2019) and generates time-course series data with lower labour requirements than traditional phenotyping methods (Chang et al. 2020). To inform targeted breeding programs and develop genotypes with improved drought resistance, controlled environment studies that utilise contemporary phenotyping methods to manipulate water availability are warranted. Hemp growth models developed using non-destructive HTP could inform field-level agronomic decisions, including nutrient and water input requirements (Ngo et al. 2023), and increase understanding of ideal environmental conditions for hemp production.
Given the limited information regarding the responses of different hemp genotypes to water deficit over time and the valuable knowledge generated by growth analyses, we tested two hypotheses: (1) hemp genotypes with different growth habits (tall and thin vs short and bushy) will differ in growth rates and patterns of growth during the vegetative stages; and (2) water use and responses to water deficit will vary between genotypes with different growth habits. Certain growth habits will cope better with water deficit and these differences will be evident using automated, non-destructive plant phenotyping techniques.
We chose two tall, thin, closely related dual-purpose genotypes from France, Felina 32 and Ferimon 12, and one short, bushy dual-purpose genotype from China, Han NE. As the two French varieties showed vastly different growth habits to the Chinese variety when grown in the field in Adelaide, South Australia, these three genotypes were chosen for comparison from a wider pool of available options. Two experiments were conducted in a glasshouse in Adelaide, South Australia using non-destructive phenotyping and automated gravimetric watering systems to examine acute water deficit responses in hemp seedlings over time.
Materials and methods
Plant material and growth conditions
A soil mix (composed of 50% UC Davis mix (University of California), 35% cocopeat, and 15% clay loam; pH 6.6), which has previously been used for industrial hemp (Cannabis sativa L.) water deficit experiments (Gill et al. 2022), was used in this experiment (Takahashi et al. 2015). Basal nutrients were added to the soil mix as per Gill et al. (2022). Plastic, free-draining pots (4.5 L; 200 mm diameter × 190 mm deep) were filled with 4.3 kg of soil mix. The gravimetric water content (GWC) of the soil mix at field capacity (FC), determined from a subsample as described by Cousins et al. (2020), was 14%.
Five seeds of industrial hemp varieties, Felina 32, Ferimon 12 (both obtained from Good Country Hemp, South Australia), or Han NE (obtained from China by The Hemp Corporation, Australia)) were sown directly into each pot. For 7 days, plants were grown on a bench in a glasshouse and were well-watered manually. At 8 days, seedlings were thinned to one uniformly sized seedling per pot and were transferred to either a high-throughput Smarthouse (LemnaTec GmbH, Germany; Experiment 1) or an automated gravimetric watering system (DroughtSpotter, Phenospex, The Netherlands; Experiment 2) (plantphenomics.org.au/technologies/#greenhouses) at The Plant Accelerator, Australian Plant Phenomics Network. To reduce soil evaporation, a rubber mesh was placed on the soil surface of all pots. Conditions in both the Smarthouse and DroughtSpotter were maintained at 26/18°C day/night thermoperiod and 16/8 h day/night photoperiod. Sunlight in the DroughtSpotter was supplemented with 400 μmol m−2 s−1 using LEDs (GreenPower LED toplighting module DR/B HB 400 V, Philips Electronics Australia Ltd, Australia). Sunlight in the Smarthouse was supplemented with 500 μmol m−2 s−1 using LEDs (Cool White (6500K) Rebel LED, Luxeon Star LEDs, Canada).
Felina 32 and Ferimon 12 are monoecious, while Han NE is diecious. For both experiments, Han NE had double the number of replicates than Felina 32 and Ferimon 12 to account for potential differences in male and female plants. Initially, only female Han NE plants were to be measured, with the male plants culled (using a PCR protocol to determine plant sex as per Gill et al. (2025a), but since the plants remained vegetative and there were no observed differences between male and female phenotypes at harvest, all plants were retained to provide additional replicates. Sample number varied depending on measurement and is provided in figure legends and table headings, with statistical measures accounting for these differences. Plants were fertilised with 50 mL nutritive solution as described by Gill et al. (2022) at 29, 30, and 33 days after planting (DAP).
Experimental design
Experiment 1 in the Smarthouse comprised 10 replicates each of two genotypes (Felina 32 and Ferimon 12), and 20 replicates of a third genotype (Han NE), for a total of 40 plants. It used a generalised randomised block design where the experimental area in the Smarthouse was divided into 10 blocks of four units (carts) (see Supplementary Fig. S1). The 40 carts were staggered within a domain of four lanes by 20 (1–12, 14–21) positions in the SW Smarthouse. Under the staggering protocol, each block occupied two lanes by four positions, including two vacant positions per lane per block. The three genotypes (including two replicates of Han NE) were randomised to the four units in each block using the R package dae (Brien 2023a), a package for the R statistical computing environment (R Core Team 2023).
Automated imaging and watering to 22% GWC occurred daily. From the red-green-blue (RGB) images, the Projected Shoot Area (PSA), a proxy for shoot surface area, of the plant was obtained. While for leafy species, PSA can be highly correlated to biomass, we found poor correlation between PSA and biomass for hemp, which suffered from growth habit differences. PSA should therefore be regarded as a measure of shoot area rather than biomass per se. It is calculated as the sum of the areas, measured in kilopixels, from three camera views, comprising two side views and a view from above (Watts-Williams et al. 2022). Felina 32 and Ferimon 12 imaging was halted after 30 days due to the plant heights exceeding the image frame.
Experiment 2 used the DroughtSpotter automated watering system, which is composed of 168 individual lysimeters, arranged in two 3 × 28 grids, one on each side of an aisle (Cousins et al. 2020). Each lysimeter is connected to an individual watering spigot which waters from the top. The system records the weights of the individual pots, and therefore evapotranspiration, every 10 min. The experiment in the DroughtSpotter comprised 10 replicates of two genotypes (Felina 32 and Ferimon 12) and 20 replicates of the third genotype (Han NE), with two watering treatment groups, for a total of 80 plants. All plants were grown under ‘well-watered’ (WW) conditions (above FC) for 29 DAP, from which point ‘reduced water’ (RW) plants were watered to 50% FC for acute drought conditions.
The experiment in the DroughtSpotter greenhouse occupied six lanes by 15 positions (every second position in 1–11 and in 12–28). The design was a split-unit design where the experimental area was divided into 10 blocks of nine cells each, occupying three lanes by three positions, but with eight cells with a pot and one cell empty (Fig. S2). The eight occupied cells were divided into four main units of two cells each, the main units being arranged to maximise the number of main units whose two cells are in the same position. The three genotypes (including two replicates of Han NE) were randomised to the four main units in each block, using the R package dae (Brien 2023a). The watering treatments were assigned so that two high watering treatments were not neighbours in a lane or in a position, with randomisation of arrangements between blocks.
Sampling
Assimilation (An) and stomatal conductance (gs) were measured weekly (7, 14, 21, 28, and 34 DAP) using an infra-red gas analyser (LCpro-SD, ADC BioScientific Ltd, UK). Measurements were taken on the youngest, fully-expanded leaf of five plants per treatment between 10:00 hours and 12:00 hours in a 6.25-cm2 chamber. All measurements were performed at a CO2 concentration of 420 μmol CO2 mol−1 air with saturating light (1500 μmol m−2 s−1).
Leaf chlorophyll content was measured using a chlorophyll meter (SPAD-502 Plus, Konica Minolta, Japan) at 34 DAP. The youngest, fully expanded leaf of five plants per treatment for Felina 32 and Ferimon 12, and 10 plants per treatment for Han NE was measured. At 35 DAP, leaf water potential at predawn (ψPD) and midday (ψM) were measured in the youngest, fully expanded leaf using a Scholander pressure chamber (Model 600D, PMS Instruments, USA). One leaf was taken from five randomly selected plants per treatment.
Harvest
Plants from both experiments were destructively harvested at 36 DAP. Shoots were cut at soil level, weighed for aboveground biomass, and measured for height. The number of leaf pairs were counted. A subset of roots (n = 4–5 plants for Ferimon 12 and Felina 32, n = 9–10 plants for Han NE) were washed well to remove soil, patted dry, imaged using a digital camera, and weighed for belowground biomass. Dry weights were recorded after oven-drying all plant biomass at 60°C for 5 days. The dried shoot material was homogenised by grinding using a knife mill (Model 4 Wiley, Thomas Scientific, USA) and then a laboratory mill (3100, Perten, Sweden).
Ground samples from Experiment 2 were freeze-dried for 24 h (Benchtop Freeze Drier, Dynavac, Boyikang Laboratory Instruments Co, China). Carbon and nitrogen stable isotope analysis was conducted as described in Gill et al. (2022). Analytical precision was 0.09‰ for δ15N and 0.05‰ δ13C. Five samples per treatment were analysed.
Data preparation
Traits for analysis were obtained from the PSA data using the smoothing and extraction of traits (SET) method described by Brien et al. (2020), employing the R package growthPheno (Brien 2023b) for the computation. The absolute and relative growth rates for PSA (PSA AGR and PSA RGR) were calculated from the PSA values by differencing consecutive PSA and ln(PSA) values, respectively, and dividing by the time differences. Smoothed PSA (sPSA) was computed by backtransforming smoothing splines fitted to the ln(PSA), with smoothing df set to six. Using the sPSA, the smoothed growth rates sPSA AGR and sPSA RGR were computed analogously to PSA AGR and PSA RGR.
To investigate growth, the imaging period was divided into five intervals. The first interval, DAP 8–12, had constant sPSA RGR and the following interval, DAP 12–16, was a period of increasing sPSA AGR. The next interval, DAP 16–22, saw the greatest increase in the sPSA AGR, after which the sPSA AGR peaked (during DAP 22–26). The penultimate interval, DAP 26–30, was a period when the sPSA AGR was decreasing. During the last interval, DAP 30–36, the growth rates for Han NE were approximately constant, but the Felina 32 and Ferimon 12 plants continued to exhibit decreasing growth rates and tended to have outgrown the area covered by the Smarthouse camera.
For the water use data, total smoothed water use over the imaging period (sWU Total) was calculated and water use efficiency per unit of shoot dry weight (water use index; sWUI-DW) was calculated as the ratio of DW to sWU Total. Interval water use traits sWUR and sWUI were defined for the same intervals as the sPSA traits.
The DroughtSpotter data, comprising weight and applied water for each pot over time, was used to compute daily water use rate (WUR) for each pot. No attempt was made to differentiate between biological water consumption and evaporative loss. For analysis purposes, WUR was aggregated over the DAP intervals 16–22, 22–26, 26–29, and 29–32 together with total water use (WU) (DAP 10–36). sWUI-DW was calculated as above.
Statistical analysis
To produce estimated marginal means (EMMs) (Searle et al. 1980), each trait was analysed using the R packages ASReml-R (Butler et al. 2021) and asremlPlus (Brien 2023c) to fit a linear mixed model, starting with the following maximal linear mixed model:
where y is the response vector of values for the trait being analysed, μ is the overall mean for the experiment, τ is the vector of fixed effects of interest, β is the vector of design spatial effects, u is the vector of random design spatial effects, 1 is the vector of ones, the matrices Xt, Xs, and Z are the design matrices for the corresponding effects vectors, and e is the vector of residual effects.
For Experiment 1, the effects of interest were the genotype effects only and the fixed spatial effects were the block effects; there were no random design effects. For Experiment 2, the effects of interest were: (1) the genotype main effects that represent consistent differences between the genotypes; (2) the watering main effects that represent consistent differences between the watering treatments; and (3) the interaction of genotype and watering that allows for the differential response of the genotypes to the watering treatments. The fixed design spatial effects were the block effects and the random design spatial effects were for the variation between the main units within a block.
In Experiment 1, the residual effects are assumed to be normally distributed with a single variance. In Experiment 2, they are assumed to be normally distributed with different variances for plants from the different watering treatments. For each trait, a model assuming a single variance for the residual effects was also fitted. Of these two models, the model with the smallest Akaike Information Criterion (AIC) was chosen. Normal probability plots of the residuals and residual-versus-fitted-values plots were inspected to fulfil the assumptions underlying the fitted models. For Experiment 1, all plots were satisfactory. For Experiment 2, after applying a logarithmic transformation to root dry weight and carbon to nitrogen ratio (C:N), the residual plots were satisfactory for all traits.
For Experiment 1, a Wald F-test with α = 0.05 was conducted for the genotype effects for each trait. EMMs were computed for the genotype. For each trait from Experiment 2, a Wald F-test with α = 0.05 was conducted for the interaction effect; if this was not statistically significant, Wald F-tests were then performed for each of the main effects. EMMs were obtained that conform to the significant effects. For both experiments, least significant intervals for α = 0.05 (LSI(5%)) were calculated for determining the significance of pairwise differences between the EMMs; the lower and upper limits of an LSI were computed as an EMM ± (l.s.d.(5%)/2), where l.s.d.(5%) is the least significant difference for α = 0.05.
Results
Experiment 1
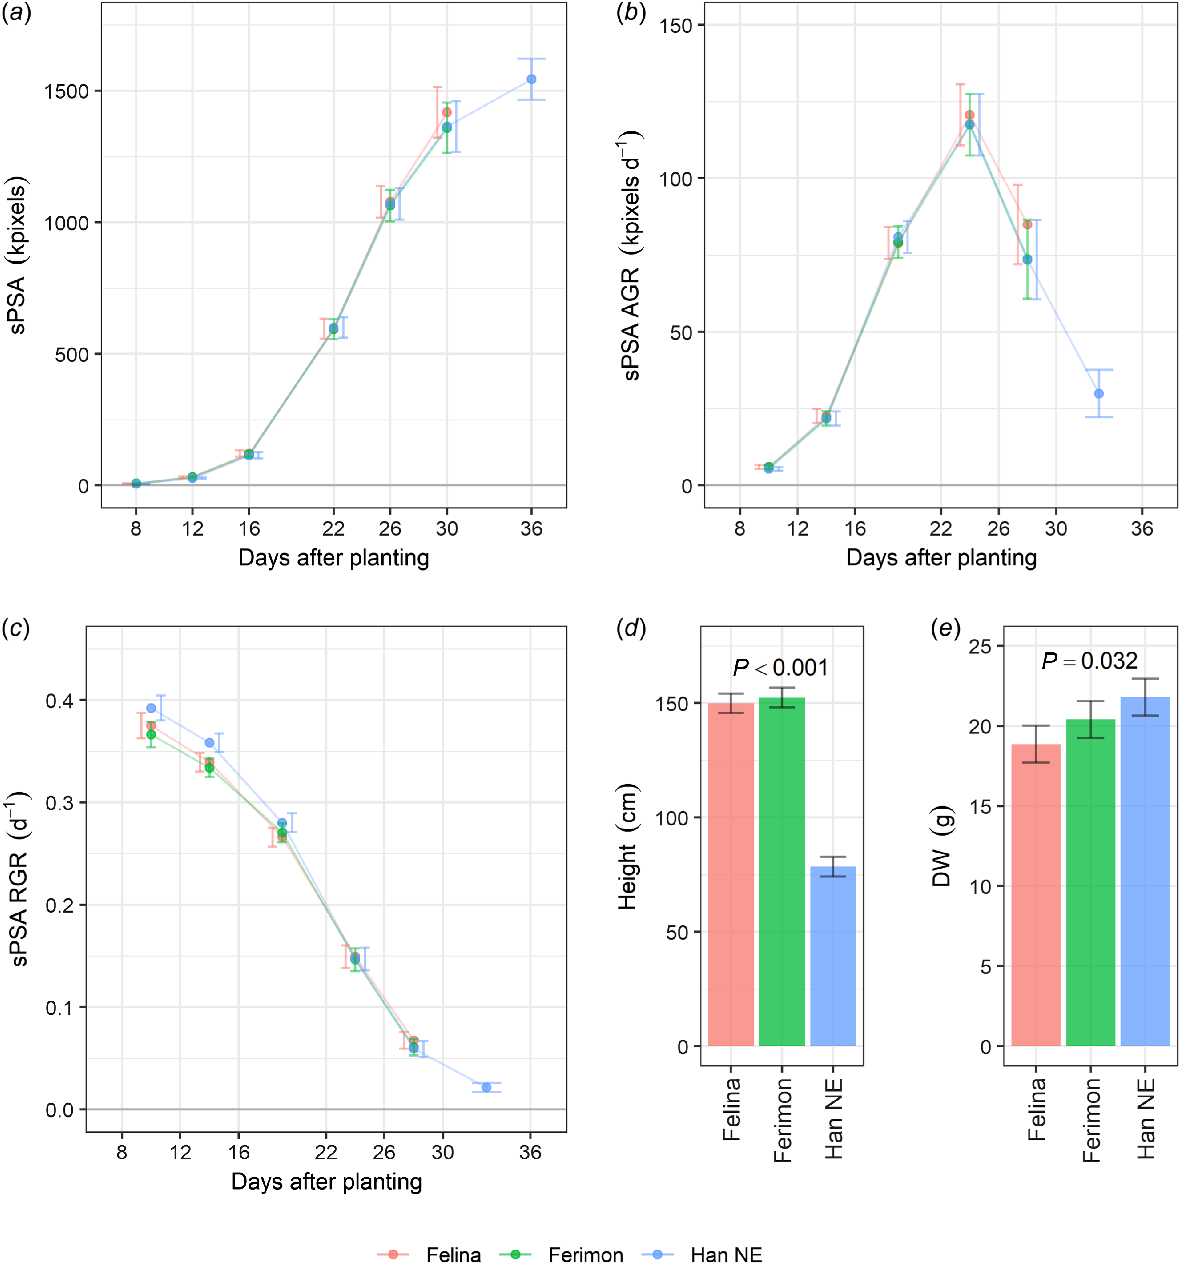
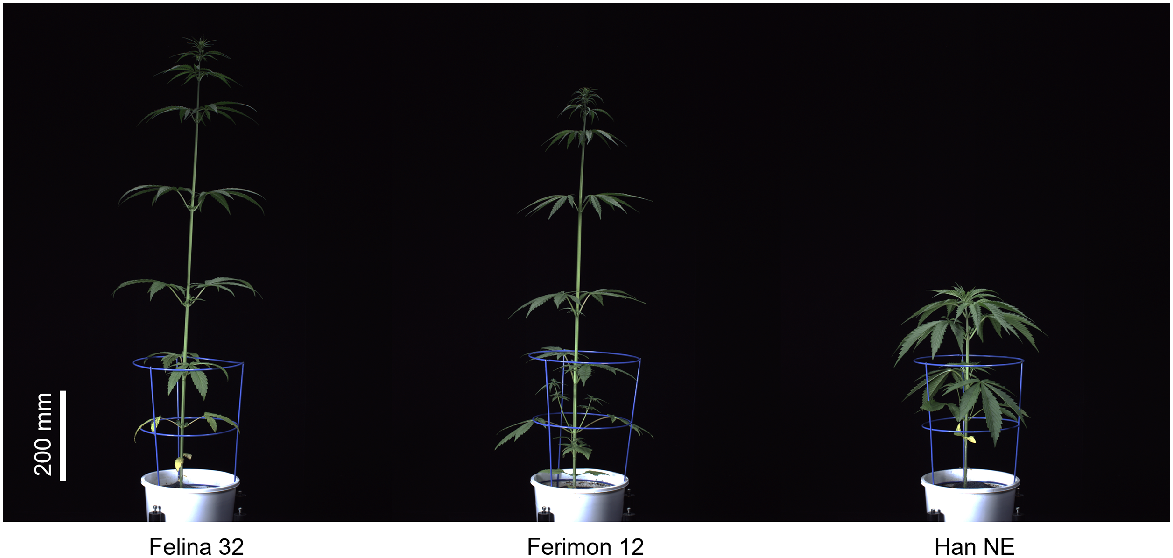
To compare daily growth between the genotypes, sPSA EMMs for each genotype were plotted against DAP (Fig. 1a). Imaging of Felina 32 and Ferimon 12 was halted after 30 days due to plants growing out of the image frame. All three genotypes had similar sPSA throughout the growing period, there being no significant sPSA differences (P > 0.05) between the genotypes. sPSA AGR and sPSA RGR were also similar between the genotypes (Fig. 1b, c). The only significant differences (P ≤ 0.05) between the genotype’s growth rates were for the sPSA RGR in the first two intervals; Han NE had slightly elevated sPSA RGR as compared to the other two genotypes. The shoot dry weight for Han NE was significantly greater (P ≤ 0.05) than that for Felina 32, with Ferimon 12 falling between the other two genotypes (Fig. 1d). The mean height of Han NE (78.5 cm) at harvest was significantly different to Felina 32 (149.4 cm) and Ferimon 12 (152.4 cm, P ≤ 0.05, Fig. 1e). In terms of shape, Han NE plants were shorter and bushier, compared to taller Ferimon 12 and Felina 32 plants (Fig. 2).
Estimated marginal means (EMMs) for three industrial hemp genotypes grown in the Smarthouse under well-watered conditions for (a) smoothed projected shoot area (sPSA), (b) sPSA absolute growth rate (AGR), (c) sPSA relative growth rate (RGR) plotted against days after planting (DAP), (d) height at harvest, and (e) shoot dry weight (DW) at harvest. Error bars are EMMs ± half-l.s.d (5%). Two EMMs for the same DAP are significantly different (P ≤ 0.05) if their error bars do not overlap. The P-values are for significant effects (P ≤ 0.05). n = 10 replicates for Felina 32 and Ferimon 12, n = 20 replicates for Han NE.
Red-green-blue images of three industrial hemp genotypes taken by the Smarthouse automated imaging system at 26 DAP. Images have been edited for clarity (+20% brightness, −20% contrast).
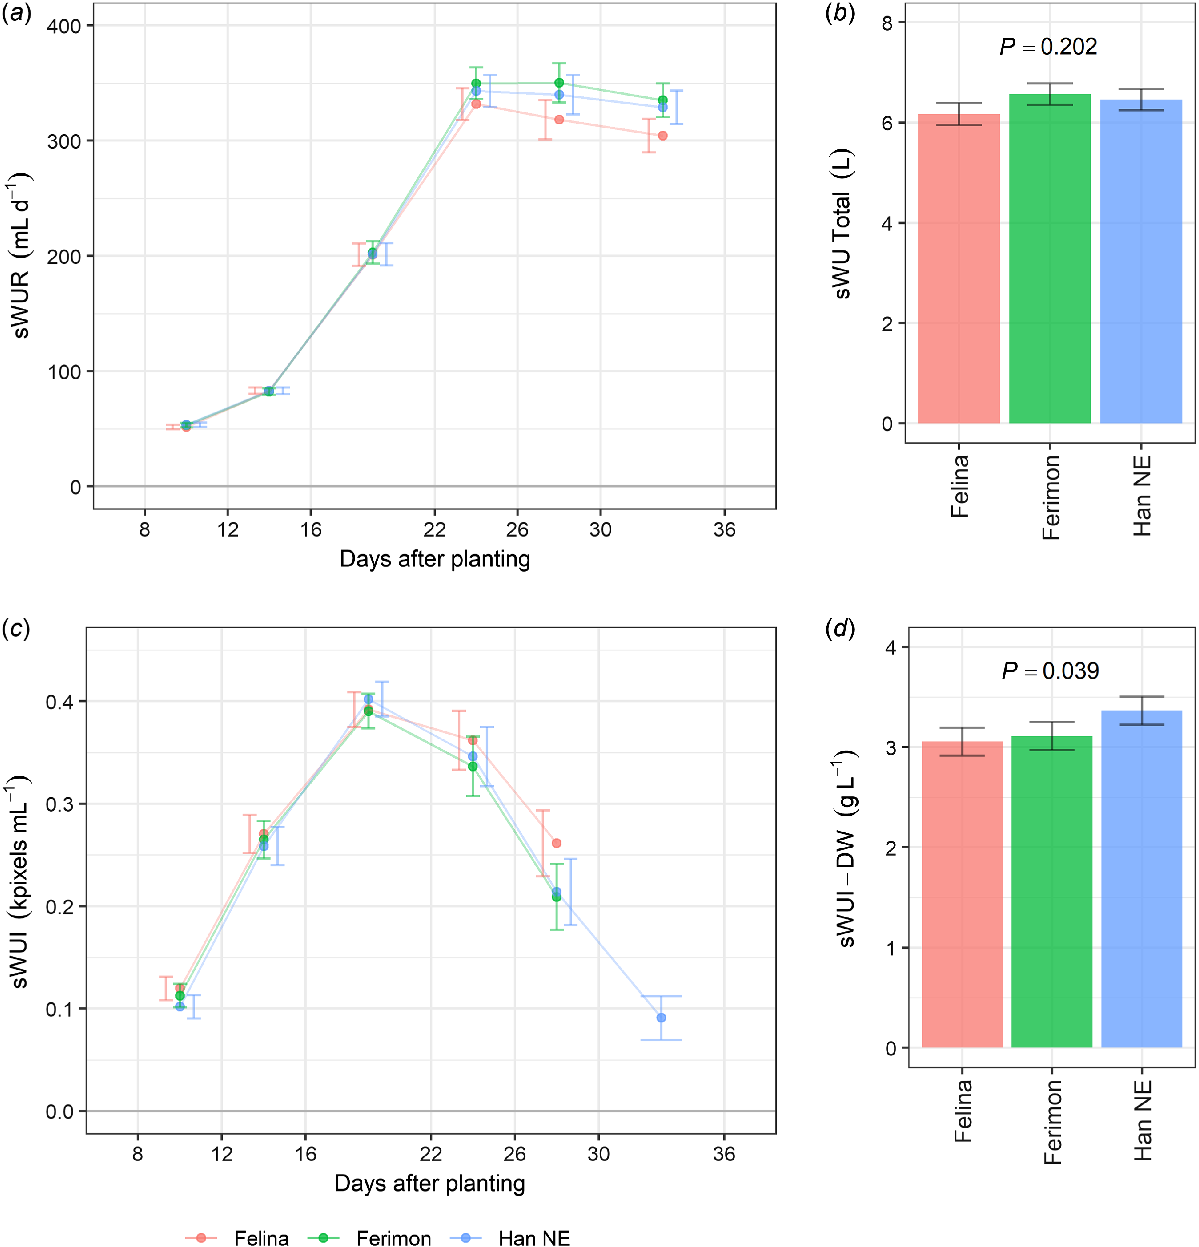
Smoothed values of sWUR and sWUI were plotted against DAP to compare water use between genotypes. All three genotypes showed similar sWUR and sWUI (Fig. 3a, c). The greatest rate of water use in all three genotypes occurred from 22 DAP. Water use efficiency was at a maximum in the interval 16–22 DAP, and then decreased (Fig. 3c). At harvest, there were no significant differences in total sWU between the three genotypes (Fig. 3b), but Han NE had significantly greater (P ≤ 0.05) sWUI-DW (Fig. 3d). Total sWU per pot was 6.2–6.5 L.
Estimated marginal means (EMMs) for three industrial hemp genotypes grown in the Smarthouse under well-watered conditions for (a) rate of water use (sWUR) and (c) water use efficiency (sWUI) plotted against days after planting (DAP). (b) Total water use (sWU Total) and (d) water use efficiency per unit of shoot dry weight (sWUI-DW) is shown for the three genotypes. Error bars are EMMs ± half-l.s.d (5%). Two EMMs for the same DAP are significantly different (P ≤ 0.05) if their error bars do not overlap. The P-values are for significant effects (P ≤ 0.05). n = 10 replicates for Felina 32 and Ferimon 12, n = 20 replicates for Han NE.
Experiment 2
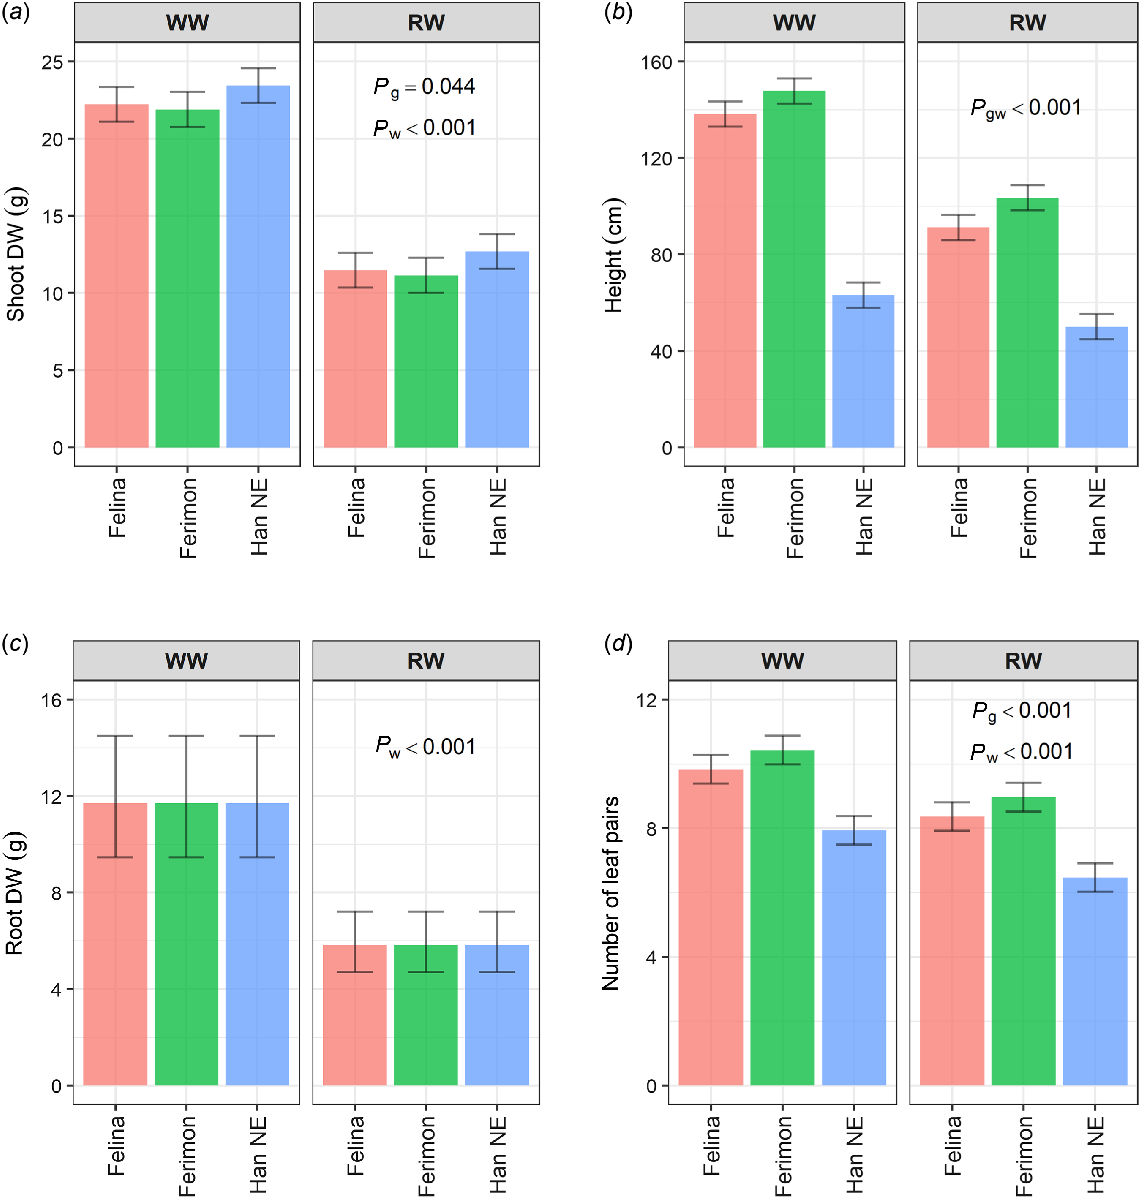
While Experiment 1 focused entirely on the growth analysis of the three hemp genotypes with sufficient water availability, Experiment 2 introduced an acute water deficit treatment at 29 DAP. In all three genotypes, the water deficit significantly reduced shoot dry weight by the same amount (10.75 g) as compared to the WW plants (P ≤ 0.001, Fig. 4a). The height difference between RW and WW plants depended on the genotype (P ≤ 0.001); there was also a small, but significant difference in shoot DW between the genotypes (P = 0.044) that was the same for each watering treatment. The difference in mean height between the RW and WW plants varied between the genotypes (P ≤ 0.001). Mean height for WW Felina 32 plants was 138.3 cm and for RW plants was 91.2 cm. Similarly, Ferimon 12 WW plants had a mean height of 147.8 cm while RW plants had a mean height of 103.5 cm. Han NE plants were shorter, with mean heights of 63.1 cm and 50.0 cm for WW and RW, respectively. Water deficit significantly decreased root dry weight (P ≤ 0.001), but the genotypes did not differ significantly in the reduction (P > 0.05, Fig. 4c); over the three genotypes, the root dry weight was estimated to reduce from 11.7 g to 5.8 g. For the number of leaf pairs, there was a significant reduction of 1.5 pairs under the RW treatment (P ≤ 0.001), but it did not differ significantly between genotypes (P > 0.05, Fig. 4d).
Estimated marginal means (EMMs) for three industrial hemp genotypes grown on the DroughtSpotter under well-watered (WW) and reduced water (RW) conditions for (a) shoot dry weight, (b) plant height, (c) root dry weight, and (d) number of leaf pairs. WW conditions were maintained above field capacity, while RW conditions were reduced to 50% field capacity at 29 DAP. Error bars are least significant intervals (LSI (5%)). Two EMMs for the same watering level are significantly different if their error bars do not overlap. The P-values are for significant effects (P ≤ 0.05) where g = genotype and w = watering. For (a) and (b), n = 10 replicates for Felina 32 and Ferimon 12, n = 20 replicates for Han NE. For (c) and (d), n = five replicates for Felina 32 and Ferimon 12, n = 10 replicates for Han NE.
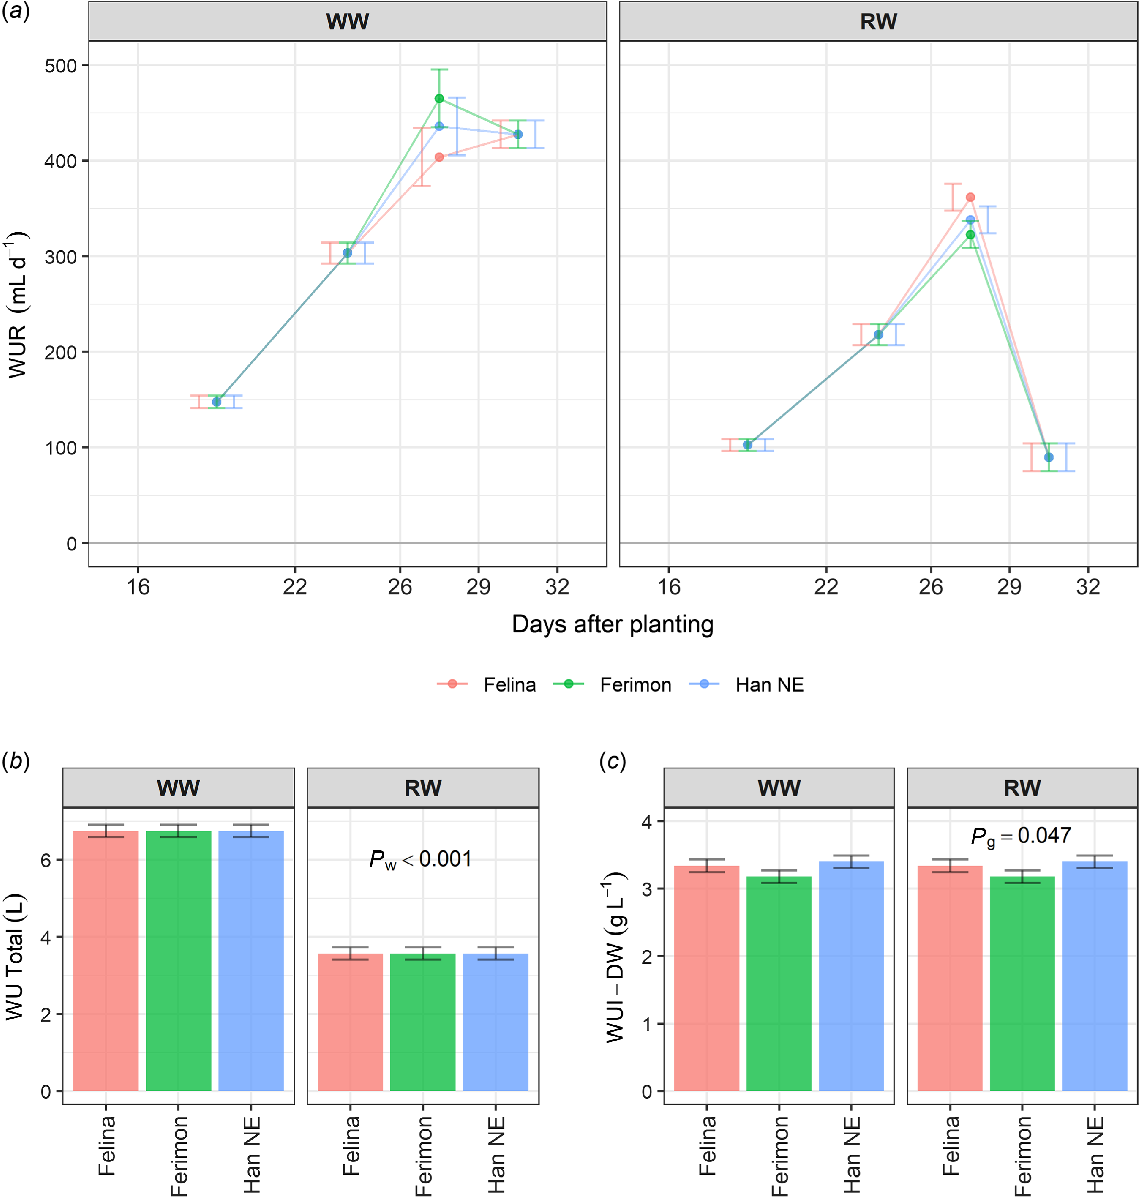
Water use per day for all genotypes was greatest in the WW treatment in the intervals from 26 to 32 DAP (Fig. 5a). Water use decreased dramatically in the RW treatment in the interval from 27 to 32 DAP. There were no significant differences between genotypes for the total WU, but total WU was significantly greater in the WW than the RW treatment (P ≤ 0.001, Fig. 5b). WUI-DW was not significantly different between watering treatments, but did differ between genotypes (P ≤ 0.05, Fig. 5c).
Estimated marginal means (EMMs) for three industrial hemp genotypes grown on the DroughtSpotter under well-watered (WW) and reduced water (RW) conditions for (a) the interval-based water use traits WUR 16–22, WUR 22–26, WUR 26–29, and WUR 29–32, (b) total water use (WU Total) per pot and (c) water efficiency with respect to shoot dry weight (WUI-DW). WW conditions were maintained above field capacity, while RW conditions were reduced to 50% field capacity at 29 DAP. Error bars are least significant intervals (LSI (5%)). Two EMMs for the same DAP interval and watering level are significantly different if their error bars do not overlap. The P-values are for significant effects (P ≤ 0.05) where g = genotype and w = watering. n = 10 replicates for Felina 32 and Ferimon 12, n = 20 replicates for Han NE.
Carbon isotope analysis was conducted as an indicator of water use efficiency. RW treated plants of all three genotypes had significantly higher (less depleted) δ13C than WW plants (P ≤ 0.001, Table 1), there being no significant difference between the genotypes. Therefore, hemp plants under water deficit showed the greatest water use efficiency. Results were similar for the three genotypes of hemp, with all three having a WW mean δ13C of −29.1‰ and a RW mean δ13C of −26.6‰ (Table 1).
| EMM | P-values | ||||||||||
|---|---|---|---|---|---|---|---|---|---|---|---|
| WW | RW | W × G | W | G | |||||||
| Fel | Fer | Han | Fel | Fer | Han | ||||||
| δ13C | ‰ | −29.1 | −29.1 | −29.1 | −26.6 | −26.6 | −26.6 | 0.169 | <0.001*** | 0.085 | |
| δ15N | ‰ | 5.32 | 5.32 | 5.32 | 6.14 | 6.14 | 6.14 | 0.632 | 0.002** | 0.083 | |
| C | % | 40.5 | 41.9 | 41.0 | 42.3 | 41.5 | 41.9 | 0.010** | na | na | |
| N | % | 1.15 | 1.15 | 1.15 | 2.16 | 2.16 | 2.16 | 0.88 | <0.001*** | 0.206 | |
| C:N | 29.3 | 29.3 | 29.3 | 18.3 | 18.3 | 18.3 | 0.157 | <0.001*** | 0.391 | ||
| Leaf chlorophyll content | SPAD units | 45.7 | 45.7 | 45.7 | 61.8 | 61.8 | 61.8 | 0.599 | <0.001*** | 0.102 | |
| ψPD | – MPa | 3.77 | 3.77 | 3.77 | 2.86 | 2.86 | 2.86 | 0.628 | 0.035* | 0.432 | |
| ψM | – MPa | 2.64 | 3.04 | 4.26 | 4.19 | 6.66 | 3.02 | 0.004*** | na | na | |
WW, well-watered conditions that were maintained above field capacity; RW, reduced water conditions that were reduced to 50% field capacity at 29 DAP.
Hemp varieties: Fel, Felina 32; Fer, Ferimon 12; Han, Han NE.
P-values of the Wald F-statistic are given for differential responses of genotype (G) to watering level (W), consistent differences between watering level, and consistent differences between genotype.
*P < 0.05; **P < 0.01; ***P < 0.001.
Leaf nitrogen content (N%) and leaf chlorophyll content were significantly greater in plants under water deficit (P ≤ 0.001, Table 1). Mean N content was approximately 1% greater in the RW plants in all three treatments. Mean leaf chlorophyll content was 45.7 SPAD units for WW plants and 61.8 SPAD units for RW plants (Table 1). δ15N was significantly higher in RW plants than WW plants (P ≤ 0.01, Table 1). For leaf carbon content (C%), there was a significant interaction between genotype and watering treatment (P = 0.01). C% in both Felina 32 and Han NE plants under RW were significantly greater than WW Felina 32 plants (P ≤ 0.05, Table 1). As both C and N content increased under water deficit, the C:N was lowest in RW plants (P ≤ 0.001). Genotypic differences were not significantly different within watering treatments for N%, leaf chlorophyll content, δ15N, and C:N.
Leaf ψ showed limited differences between treatments, within the three genotypes (Table 1). ΨPD was significantly greater (more negative) for WW plants than RW plants. For ΨM, there was a significant interaction effect for watering treatment and genotype (P = 0.004), with the only significant difference being that Ferimon 12 RW plants displayed higher values than any of the other five combinations of watering treatments and genotypes (Table 1).
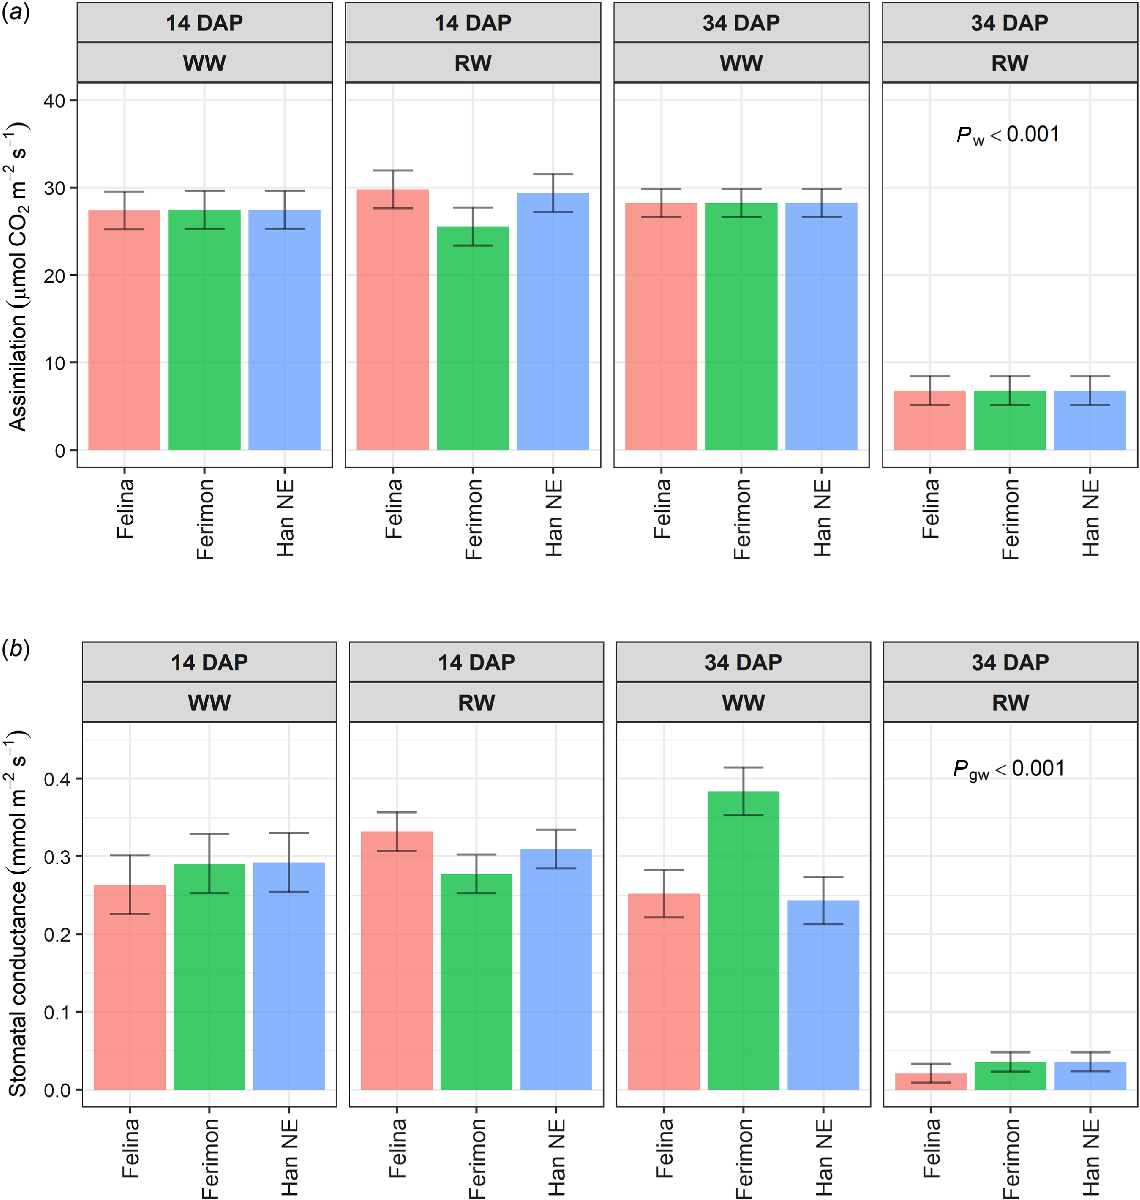
For both An and gs, there were no significant differences between the two water treatments within each genotype at 14 DAP (Fig. 6) and 28 DAP. At 34 DAP, An was significantly reduced in RW plants compared to WW plants (P ≤ 0.001), with no significant differences between genotypes. In contrast, there was a significant interaction for gs at 34 DAP. While gs decreased under RW for all genotypes, the reduction was significantly greater for Ferimon 12 (Fig. 6).
Estimated marginal means (EMMs) of (a) CO2 assimilation and (b) stomatal conductance at 14 and 34 DAP for three industrial hemp genotypes grown on the DroughtSpotter under well-watered (WW) and reduced water (RW) conditions. WW conditions were maintained above field capacity, while RW conditions were reduced to 50% field capacity at 29 DAP. Error bars are least significant intervals (LSI (5%)). Two EMMs for the same watering level are significantly different if their error bars do not overlap. The P-values are for significant effects (P ≤ 0.05) where g = genotype and w = watering. n = five replicates for Felina 32 and Ferimon 12, n = 10 replicates for Han NE.
Discussion
This study compared how hemp genotypes with differing growth habits grow and respond to water deficit throughout the vegetative stage. We hypothesised that tall, thin growth habits would exhibit different growth patterns to short, bushy growth habits. We also hypothesised that certain growth habits would respond better to water deficit, which would be evident through targeted, state-of-the-art non-destructive phenotyping techniques.
Clearly, the two French genotypes (Felina 32 and Ferimon 12), had different growth habits to Chinese Han NE, with greater height and numbers of leaf pairs (Figs 1d, 2). Generally, the Han NE plants were bushy, with shorter internodes. This short growth habit was obvious in our previous field trials in Adelaide, South Australia (pers. comm.), and was therefore chosen as a comparison to the tall French varieties. Despite the differences in growth habit, all three genotypes exhibited similar patterns of total shoot growth, with similar average and relative growth rates, and projected shoot area, throughout the experiment (Fig. 1).
Previous studies have reported Han NE to be a tall variety, growing above 1.5 m and up to 3 m (Monserrate 2021; Skewes 2022), while our plants were short in comparison. This is potentially due to differences in seed provenance as well as genotype × environment interactions. Cannabis accessions have been found to show little genetic consistency (Johnson and Wallace 2021) and questions have been raised as to the scale of the total genetic diversity, leading to debates in speciation and classification of hemp varieties (Campbell et al. 2019). Hemp varieties are highly plastic, so data as provided here offers insight into the variability of physical traits in key varieties of hemp. Han NE is potentially more plastic than Ferimon 12 and Felina 32, exhibiting variability in height in different environments. Targeted studies such as this one offer much-needed information on phenotypic variability, which will be important for breeding programs to develop varieties with improved stability, uniformity, and adaptability (Campbell et al. 2019).
While responses to water deficit have been explored in hemp previously (Gill et al. 2023), none assess the rates of water use and water use efficiency in hemp temporally using state-of-the-art non-destructive phenotyping or precision watering platforms. Under well-watered conditions, daily water use was greatest from 22 DAP, corresponding to a peak in the absolute growth rate of the plants (Fig. 3). A proxy for water use efficiency, here termed WUI, was also greatest in the period from 16 to 22 DAP (Fig. 3). Evidently, hemp plants maximise water uptake during their greatest periods of growth, which occurs around 22 DAP. The rate of water use remained mostly consistent after 22 DAP while absolute growth rates decreased (Figs 1b, 3a), which corresponds to the observed decrease in WUI, suggesting that hemp plants lose efficiency in converting available water to biomass after this point. Water constraints likely exist early in the growth cycle of hemp, during plant establishment, which occurs during the first 6 weeks. This supports previous studies that reported that during establishment, inadequate water availability can inhibit hemp growth (Adesina et al. 2020) but after establishment, reductions in water availability may not constrain survival (Duque Schumacher et al. 2020). Although our automated experiment was necessarily constrained in duration as plants grew out of the imaging frames, future research should investigate growth and water dynamics throughout the lifecycle of hemp plants beyond 36 days of growth. Furthermore, δ15N has previously been suggested for genotypic screening under drought (Araus et al. 2013), with our results indicating little difference in acute water stress between the three genotypes (Table 1).
Previous reports of hemp water requirements have also varied greatly depending on the study type (e.g. field vs glasshouse) and environmental conditions (Cherrett et al. 2005; Tang et al. 2018; Adesina et al. 2020; Duque Schumacher et al. 2020; Gill et al. 2022), leading to difficulties in comparison of genotypes across different studies. Precise control of the environmental conditions in this study allowed us to probe the influence of differing growth habits on the growth of hemp under water deficit conditions. The shorter, bushy genotype, Han NE, showed potential for greater water use efficiency than the other two genotypes, but only in well-watered conditions (Fig. 3d). This could be an effect of greater leaf and soil shading in the bushier genotype and less evaporation from the pots, but this did not necessarily translate to better water use efficiency under water deficit. While water deficit decreased heights in all three genotypes (Fig. 4b), the greatest reductions occurred in Felina 32 and Ferimon 12. Indeed, mean plant height of Han NE was only reduced by 20% under water deficit while mean heights were reduced by 33% in the other genotypes. Under water deficit, Han NE plants also had higher ψM indicative of lower water stress (Table 1), while Ferimon 12 showed the greatest water stress at midday. Previous research has also shown that increased hemp plant height correlates with less conservative water use and thus reduced WUE (Campbell et al. 2019). Short, bushy genotypes of hemp may possess a greater ability to tolerate water deficit.
As Cannabis accessions have been found to show little genetic consistency with potential issues regarding seed provenance, further research is needed to understand the relative contributions of genetic and phenotypic factors specifically in responses to abiotic stresses such as water stress. Research should focus on identifying genetic markers or genes associated with water stress resistance to inform breeding programs and develop more resilient and productive cultivars.
Here, we provide novel data linking growth habit and water use behaviour in hemp. Such studies are currently lacking and, considering the availability of a broad range of growth habits and increased interest in growing hemp in disparate geographical and climactic locations, robust comparisons will be required to accelerate correct genotype choice for growers. We report that three hemp genotypes with differing growth habits showed consistent responses to water deficit, including reductions in shoot and root mass, height, and gas exchange. While the bushy, short genotype, Han NE, exhibited potential for diminished height reductions under water deficit, further research is needed to evaluate diverse growth habits in different environments. By making our datasets, codes and images fully open and available online (Gill et al. 2025b; see Data Availability), we aim to contribute to transparent and reproducible plant phenotyping practices. Industrial hemp phenotyping studies such as this will be vital to inform field-based agronomic decisions and targeted breeding approaches, with consideration for fibre and seed production under water deficit.
Data availability
All data generated or used during this study, including phenotyping images, environmental parameters, and codes, are freely available at https://doi.org/10.25909/29097107.v2.
Conflicts of interest
Timothy Cavagnaro is an Editor of Functional Plant Biology but was blinded from the peer review process for this paper.
Declaration of funding
ARG was supported by an APPN Postgraduate Internship. ARG was also supported by the University of Adelaide Charles John Everard Scholarship, AW Howard Memorial Trust – Tim Healey Supplementary Scholarship, and Playford Trust PhD Scholarship. This research was partially funded by the Australian Government through an Australian Research Council Linkage Grant number LP200301543.
Author contributions
Alison Gill: conceptualisation, methodology, formal analysis, investigation, visualisation, writing – original draft, writing – review and editing, funding acquisition. Beth Loveys: conceptualization, methodology, formal analysis, investigation, writing – review and editing, supervision. Christopher Brien: conceptualization, methodology, software, formal analysis, writing – review and editing, visualisation. Nathaniel Jewell: conceptualisation, methodology, software, formal analysis, writing – review and editing, visualisation. Bettina Berger: conceptualisation, methodology, writing – review and editing, project administration. Timothy Cavagnaro: conceptualisation, methodology, writing – review and editing, supervision. Rachel Burton: conceptualization, methodology, writing – review and editing, supervision.
Acknowledgements
We acknowledge the use of the facilities, and scientific and technical assistance of the Australian Plant Phenomics Network (APPN), which is supported by the Australian Government’s National Collaborative Research Infrastructure Strategy (NCRIS). In particular, we thank Lidia Mischis, Nicole Bond, and Fiona Norrish for their roles in soil preparation and potting. ARG gratefully acknowledges that this work was supported by an APPN Postgraduate Internship. We thank Mick Anderson from Good Country Hemp for providing seed. We thank the two reviewers for their valuable feedback on the manuscript. This paper forms part of the Ph.D thesis of Alison R Gill (2023).
References
Adesina I, Bhowmik A, Sharma H, Shahbazi A (2020) A review on the current state of knowledge of growing conditions, agronomic soil health practices and utilities of hemp in the United States. Agriculture 10(4), 129.
| Crossref | Google Scholar |
Amaducci S, Scordia D, Liu FH, Zhang Q, Guo H, Testa G, Cosentino SL (2015) Key cultivation techniques for hemp in Europe and China. Industrial Crops and Products 68, 2-16.
| Crossref | Google Scholar |
Araus JL, Cabrera-Bosquet L, Serret MD, Bort J, Nieto-Taladriz MT (2013) Comparative performance of δ13C, δ18O and δ15N for phenotyping durum wheat adaptation to a dryland environment. Functional Plant Biology 40(6), 595-608.
| Crossref | Google Scholar | PubMed |
Brien C (2023a) dae: functions useful in the design and ANOVA of experiments. Version 3.2-15. Available at https://cran.r-project.org/package=dae [accessed May 2023]
Brien C (2023b) growthPheno: functional analysis of phenotypic growth data to smooth and extract traits. Version 2.1-19. Available at http://cran.at.r-project.org/package=growthPheno [accessed May 2023]
Brien C (2023c) asremlPlus: augments ASReml-R in fitting mixed models and packages generally in exploring prediction differences. Version 4.3-50. Available at http://cran.r-project.org/package=asremlPlus/ [accessed May 2022]
Brien C, Jewell N, Watts-Williams SJ, Garnett T, Berger B (2020) Smoothing and extraction of traits in the growth analysis of noninvasive phenotypic data. Plant Methods 16, 36.
| Crossref | Google Scholar |
Burton RA, Andres M, Cole M, Cowley JM, Augustin MA (2022) Industrial hemp seed: from the field to value-added food ingredients. Journal of Cannabis Research 4, 45.
| Crossref | Google Scholar |
Butler DG, Cullis BR, Gilmour AR, Gogel BJ, Thompson R (2021) ASReml-R reference manual. Version 4. Available at http://asreml.org. [accessed May 2023]
Campbell BJ, Berrada AF, Hudalla C, Amaducci S, McKay JK (2019) Genotype × environment interactions of industrial hemp cultivars highlight diverse responses to environmental factors. Agrosystems, Geosciences & Environment 2(1), 1-11.
| Crossref | Google Scholar |
Chang S, Lee U, Hong MJ, Jo YD, Kim J-B (2020) High-throughput phenotyping (HTP) data reveal dosage effect at growth stages in Arabidopsis thaliana irradiated by gamma rays. Plants 9(5), 557.
| Crossref | Google Scholar | PubMed |
Cousins OH, Garnett TP, Rasmussen A, Mooney SJ, Smernik RJ, Brien CJ, Cavagnaro TR (2020) Variable water cycles have a greater impact on wheat growth and soil nitrogen response than constant watering. Plant Science 290, 110146.
| Crossref | Google Scholar |
Duque Schumacher AG, Pequito S, Pazour J (2020) Industrial hemp fiber: a sustainable and economical alternative to cotton. Journal of Cleaner Production 268, 122180.
| Crossref | Google Scholar |
Gill AR, Loveys BR, Cowley JM, Hall T, Cavagnaro TR, Burton RA (2022) Physiological and morphological responses of industrial hemp (Cannabis sativa L.) to water deficit. Industrial Crops and Products 187, 115331.
| Crossref | Google Scholar |
Gill AR, Loveys BR, Cavagnaro TR, Burton RA (2023) The potential of industrial hemp (Cannabis sativa L.) as an emerging drought resistant fibre crop. Plant and Soil 493, 7-16.
| Crossref | Google Scholar |
Gill AR, Phillips AL, Tyerman SD, Lawson T, Cavagnaro TR, Burton RA, Loveys BR (2025a) Water conservation and assimilation is driven by stomatal behaviour in industrial hemp (Cannabis sativa L.). Environmental and Experimental Botany 232, 106119.
| Crossref | Google Scholar |
Gill AR, Loveys BR, Brien C, Jewell N, Berger B, Cavagnaro T, Burton RA (2025b) Data for phenotyping of industrial hemp (Cannabis sativa L.) experiments. The University of Adelaide. Dataset. Available at https://doi.org/10.25909/29097107.v2
Herppich WB, Gusovius H-J, Flemming I, Drastig K (2020) Effects of drought and heat on photosynthetic performance, water use and yield of two selected fiber hemp cultivars at a poor-soil site in Brandenburg (Germany). Agronomy 10(9), 1361.
| Crossref | Google Scholar |
Johnson MS, Wallace JG (2021) Genomic and chemical diversity of commercially available high-CBD industrial hemp accessions. Frontiers in Genetics 12, 682475.
| Crossref | Google Scholar |
Ngo HTT, Cavagnaro TR, Jewell N, Brien CJ, Berger B, Watts-Williams SJ (2023) High-throughput shoot phenotyping reveals temporal growth responses to nitrogen and inorganic and organic phosphorus sources in tomato. AoB PLANTS 15(2), plad011.
| Crossref | Google Scholar |
R Core Team (2023) R: A language and environment for statistical computing. R Foundation for Statistical Computing. Version 4.1.1, Vienna, Austria. Available at https://www.R-project.org/ [accessed July 2023]
Schultz CJ, Lim WL, Khor SF, Neumann KA, Schulz JM, Ansari O, Skewes MA, Burton RA (2020) Consumer and health-related traits of seed from selected commercial and breeding lines of industrial hemp, Cannabis sativa L. Journal of Agriculture and Food Research 2, 100025.
| Google Scholar |
Scordia D, Papazoglou EG, Kotoula D, Sanz M, Ciria CS, Pérez J, Maliarenko O, Prysiazhniuk O, von Cossel M, Greiner BE, Lazdina D, Makovskis K, Lamy I, Ciadamidaro L, Petit-dit-Grezeriat L, Corinzia SA, Fernando AL, Alexopoulou E, Cosentino SL (2022) Towards identifying industrial crop types and associated agronomies to improve biomass production from marginal lands in Europe. GCB Bioenergy 14(7), 710-734.
| Crossref | Google Scholar |
Searle SR, Speed FM, Milliken GA (1980) Population marginal means in the linear model: an alternative to least squares means. The American Statistician 34(4), 216-221.
| Crossref | Google Scholar |
Skewes M (2022) SA Industrial Hemp Trials. Available at https://pir.sa.gov.au/__data/assets/pdf_file/0006/373488/industrial-hemp-update-report.pdf [accessed 26 June 2024]
Small E (2015) Evolution and classification of Cannabis sativa (Marijuana, Hemp) in relation to human utilization. The Botanical Review 81, 189-294.
| Crossref | Google Scholar |
Takahashi F, Tilbrook J, Trittermann C, Berger B, Roy SJ, Seki M, Shinozaki K, Tester M (2015) Comparison of leaf sheath transcriptome profiles with physiological traits of bread wheat cultivars under salinity stress. PLoS ONE 10(8), e0133322.
| Crossref | Google Scholar |
Tang K, Fracasso A, Struik PC, Yin X, Amaducci S (2018) Water- and nitrogen-use efficiencies of hemp (Cannabis sativa L.) based on whole-canopy measurements and modeling. Frontiers in Plant Science 9, 951.
| Crossref | Google Scholar |
Watts-Williams SJ, Jewell N, Brien C, Berger B, Garnett T, Cavagnaro TR (2019) Using high-throughput phenotyping to explore growth responses to mycorrhizal fungi and zinc in three plant species. Plant Phenomics 2019, 5893953.
| Crossref | Google Scholar |
Watts-Williams SJ, Gill AR, Jewell N, Brien CJ, Berger B, Tran BTT, Mace E, Cruickshank AW, Jordan DR, Garnett T, Cavagnaro TR (2022) Enhancement of sorghum grain yield and nutrition: a role for arbuscular mycorrhizal fungi regardless of soil phosphorus availability. Plants People Planet 4(2), 143-156.
| Crossref | Google Scholar |